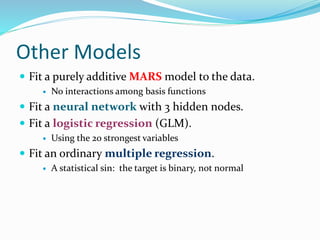
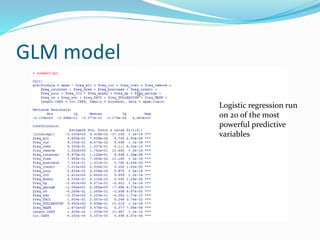
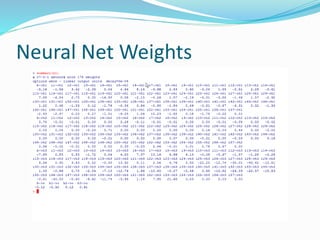
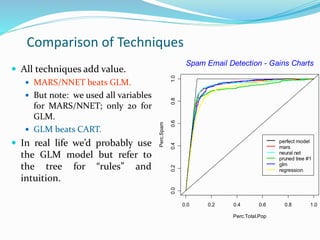
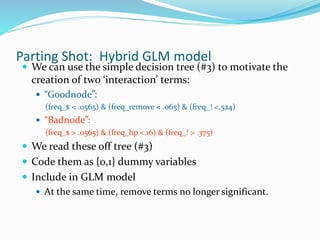
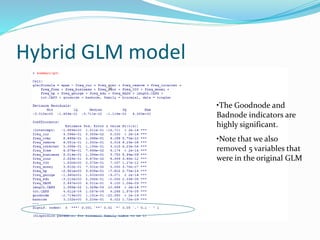
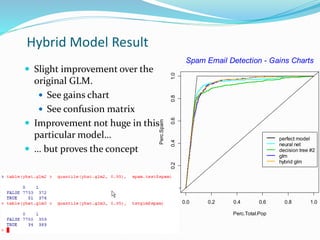
Prof. Neeraj Bhargava
Vishal Dutt
Department of Computer Science, School of
Engineering & System Sciences
MDS University, Ajmer
CART Gains Chart
 How do the three trees
compare?
 Use gains chart on test data.
 Outer black line: the best
one could do
 45o line: monkey throwing
darts
 The bigger trees are about
equally good in catching 80%
of the spam.
 We do lose something with
the simpler tree.
0.0 0.2 0.4 0.6 0.8 1.0
0.00.20.40.60.81.0
Perc.Total.Pop
Perc.Spam
perfect model
unpruned tree
pruned tree #1
pruned tree #2
Spam Email Detection - Gains Charts
Other Models
 Fit a purely additive MARS model to the data.
 No interactions among basis functions
 Fit a neural network with 3 hidden nodes.
 Fit a logistic regression (GLM).
 Using the 20 strongest variables
 Fit an ordinary multiple regression.
 A statistical sin: the target is binary, not normal
GLM model
Logistic regression run
on 20 of the most
powerful predictive
variables
Neural Net Weights
Comparison of Techniques
 All techniques add value.
 MARS/NNET beats GLM.
 But note: we used all variables
for MARS/NNET; only 20 for
GLM.
 GLM beats CART.
 In real life we’d probably use
the GLM model but refer to
the tree for “rules” and
intuition.
0.0 0.2 0.4 0.6 0.8 1.0
0.00.20.40.60.81.0
Perc.Total.Pop
Perc.Spam
perfect model
mars
neural net
pruned tree #1
glm
regression
Spam Email Detection - Gains Charts
Parting Shot: Hybrid GLM model
 We can use the simple decision tree (#3) to motivate the
creation of two ‘interaction’ terms:
 “Goodnode”:
(freq_$ < .0565) & (freq_remove < .065) & (freq_! <.524)
 “Badnode”:
(freq_$ > .0565) & (freq_hp <.16) & (freq_! > .375)
 We read these off tree (#3)
 Code them as {0,1} dummy variables
 Include in GLM model
 At the same time, remove terms no longer significant.
Hybrid GLM model
•The Goodnode and
Badnode indicators are
highly significant.
•Note that we also
removed 5 variables that
were in the original GLM
Hybrid Model Result
 Slight improvement over the
original GLM.
 See gains chart
 See confusion matrix
 Improvement not huge in this
particular model…
 … but proves the concept
0.0 0.2 0.4 0.6 0.8 1.0
0.00.20.40.60.81.0
Perc.Total.Pop
Perc.Spam
perfect model
neural net
decision tree #2
glm
hybrid glm
Spam Email Detection - Gains Charts
Concluding Thoughts
 In many cases, CART will likely under-perform tried-and-
true techniques like GLM.
 Poor at handling linear structure
 Data gets chopped thinner at each split
 BUT: is highly intuitive and a great way to:
 Get a feel for your data
 Select variables
 Search for interactions
 Search for “rules”
 Bin variables

20 Simple CART

  • 1.
    Prof. Neeraj Bhargava VishalDutt Department of Computer Science, School of Engineering & System Sciences MDS University, Ajmer
  • 3.
    CART Gains Chart How do the three trees compare?  Use gains chart on test data.  Outer black line: the best one could do  45o line: monkey throwing darts  The bigger trees are about equally good in catching 80% of the spam.  We do lose something with the simpler tree. 0.0 0.2 0.4 0.6 0.8 1.0 0.00.20.40.60.81.0 Perc.Total.Pop Perc.Spam perfect model unpruned tree pruned tree #1 pruned tree #2 Spam Email Detection - Gains Charts
  • 4.
    Other Models  Fita purely additive MARS model to the data.  No interactions among basis functions  Fit a neural network with 3 hidden nodes.  Fit a logistic regression (GLM).  Using the 20 strongest variables  Fit an ordinary multiple regression.  A statistical sin: the target is binary, not normal
  • 5.
    GLM model Logistic regressionrun on 20 of the most powerful predictive variables
  • 6.
  • 7.
    Comparison of Techniques All techniques add value.  MARS/NNET beats GLM.  But note: we used all variables for MARS/NNET; only 20 for GLM.  GLM beats CART.  In real life we’d probably use the GLM model but refer to the tree for “rules” and intuition. 0.0 0.2 0.4 0.6 0.8 1.0 0.00.20.40.60.81.0 Perc.Total.Pop Perc.Spam perfect model mars neural net pruned tree #1 glm regression Spam Email Detection - Gains Charts
  • 8.
    Parting Shot: HybridGLM model  We can use the simple decision tree (#3) to motivate the creation of two ‘interaction’ terms:  “Goodnode”: (freq_$ < .0565) & (freq_remove < .065) & (freq_! <.524)  “Badnode”: (freq_$ > .0565) & (freq_hp <.16) & (freq_! > .375)  We read these off tree (#3)  Code them as {0,1} dummy variables  Include in GLM model  At the same time, remove terms no longer significant.
  • 9.
    Hybrid GLM model •TheGoodnode and Badnode indicators are highly significant. •Note that we also removed 5 variables that were in the original GLM
  • 10.
    Hybrid Model Result Slight improvement over the original GLM.  See gains chart  See confusion matrix  Improvement not huge in this particular model…  … but proves the concept 0.0 0.2 0.4 0.6 0.8 1.0 0.00.20.40.60.81.0 Perc.Total.Pop Perc.Spam perfect model neural net decision tree #2 glm hybrid glm Spam Email Detection - Gains Charts
  • 11.
    Concluding Thoughts  Inmany cases, CART will likely under-perform tried-and- true techniques like GLM.  Poor at handling linear structure  Data gets chopped thinner at each split  BUT: is highly intuitive and a great way to:  Get a feel for your data  Select variables  Search for interactions  Search for “rules”  Bin variables