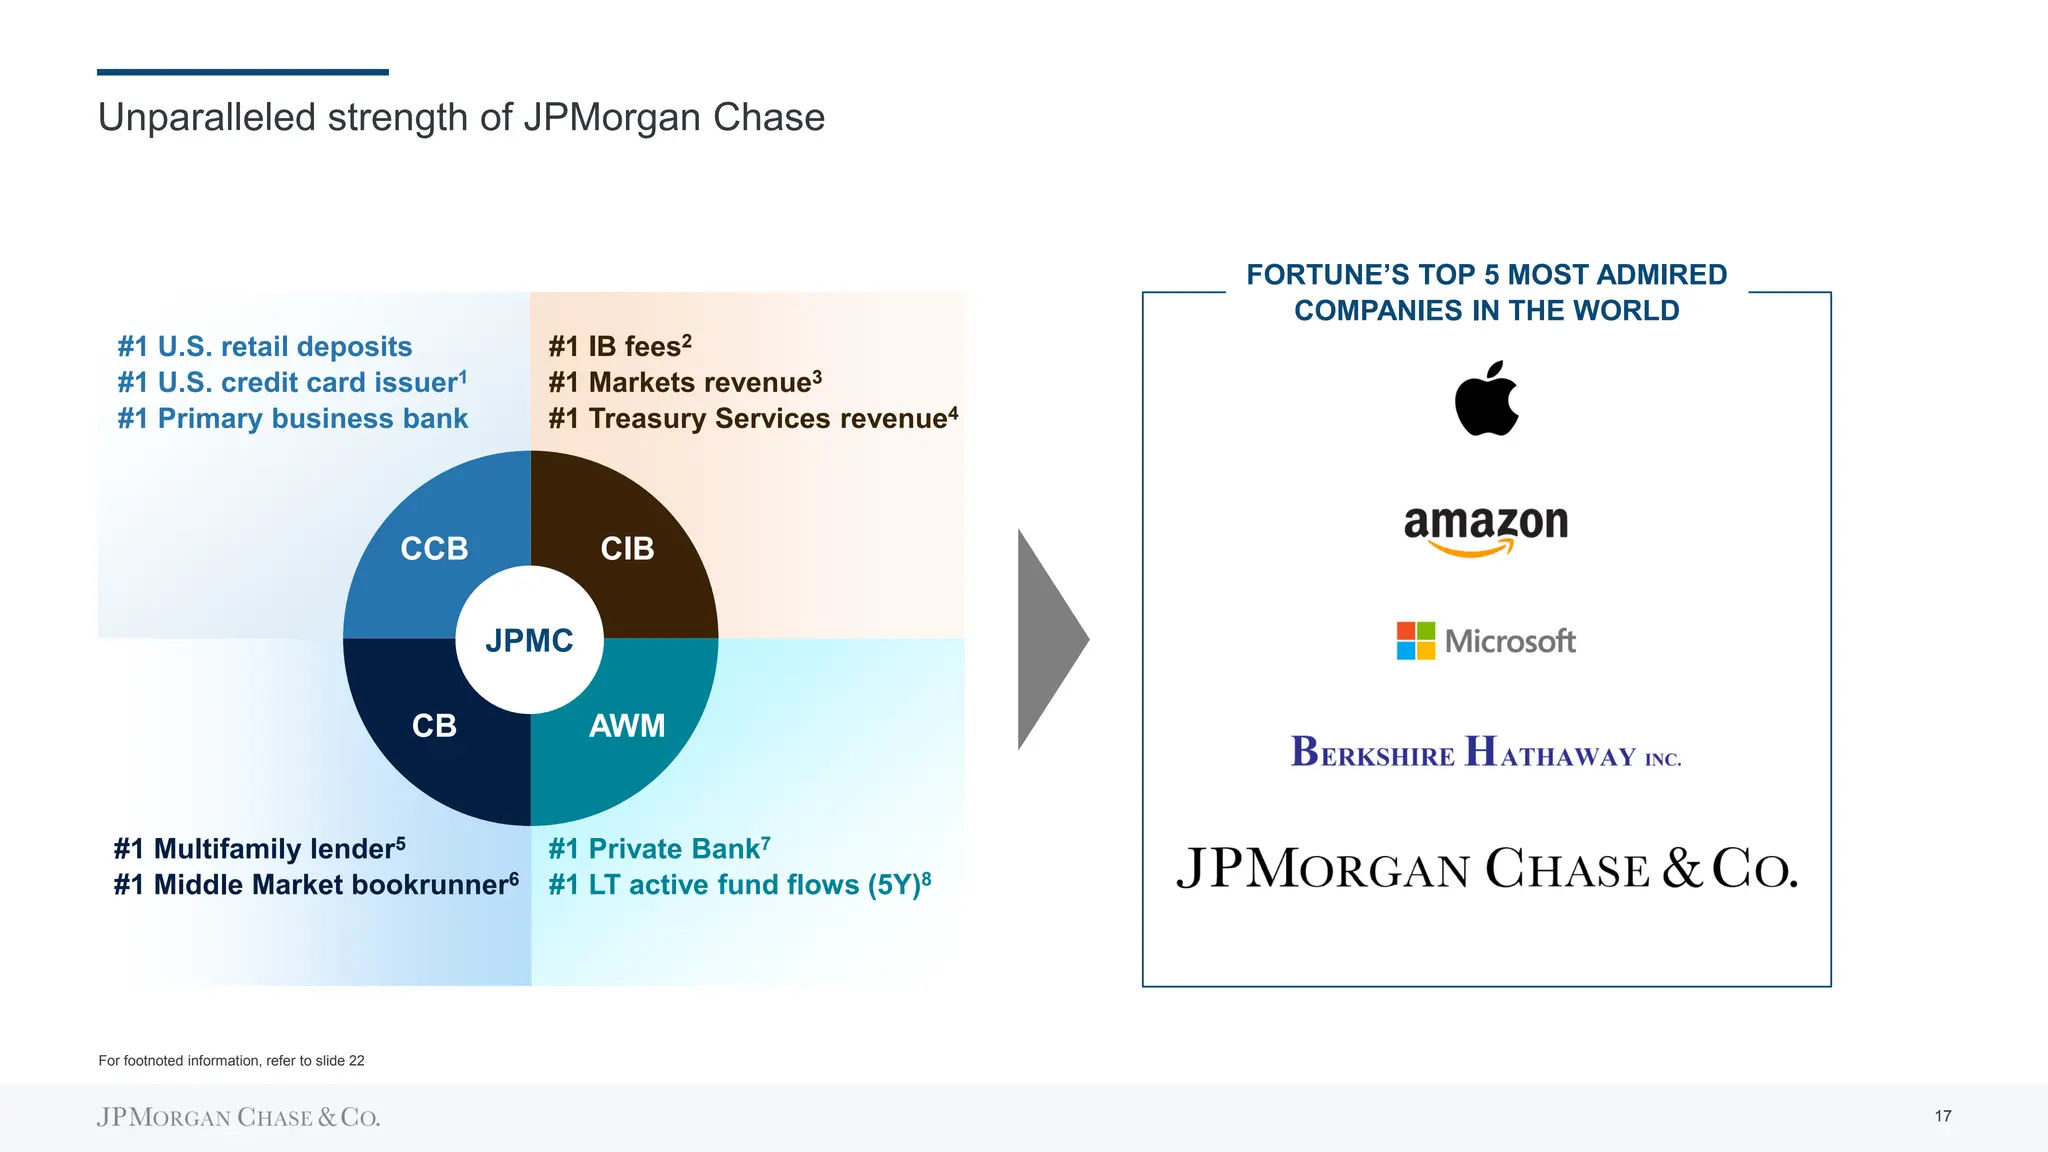
Topics of discussion
Firm overview
Operating environment
Financial results
Outlook
Conclusion
1
We have a proven operating model that is supported by a consistent strategic framework
Complete Global Diversified At Scale
⚫ Customer centric and easy to do
business with
⚫ Comprehensive set of products
and services
⚫ Focus on safety and security
⚫ Powerful brands
⚫ Continuously investing in the
future while maintaining expense
discipline
⚫ Focus on customer experience
and innovation
⚫ Employer of choice for top and
diverse talent
⚫ Fortress balance sheet
⚫ Risk governance and controls
⚫ Culture and conduct
⚫ Operational resilience
⚫ Investing in and supporting our
communities
⚫ Integrating environmental
sustainability into business and
operating decisions
⚫ Serving a diverse customer base
⚫ Promoting sound governance
Exceptional client
franchises
Unwavering
principles
Long-term
shareholder value
Sustainable
business practices
2
We have leading client and customer-centric franchises
CCB
AWM
CB
CIB
IB fees4
Markets revenue5
Treasury Services
revenue6
Rated Private
Bank in the World7
LT active fund flows (5-yr)8
U.S. retail deposits1
U.S. credit card issuer2
Primary Business Bank3
Multifamily lender9
Middle Market
bookrunner10
CCB
U.S. retail deposits1 7.1% 10.9%
Credit card sales11 20.5% 22.4%
Client investment assets $159B $647B
⚫ #1 retail deposit share in top three U.S. markets: NYC, LA and Chicago
CIB
Investment Banking fees4 7.7% 7.9%
Markets revenue5 8.6% 11.6%
5.6% 8.4%
⚫ Operate in 100+ markets globally
CB
Gross IB revenue13 $1.6B $3.0B
Payments revenue14 $2.7B $5.9B
⚫ International presence in 34 locations and 66% CB Int’l revenue growth '19-'22
AWM
Client assets15 $2.0T $4.0T
72% 90%
⚫ 19 straight years of positive net new flows; $1.6T since 201217
Market share 2012 2022
+380bps
+260bps
+190bps
+3.5x
+4.1x
+3.5x
+20bps
+3.5x
+300bps
+3.5x
+280bps
+3.5x
+1.9x
+3.5x
+121%
+3.5x
+100%
+3.5x
+18ppts
Long-term mutual fund AUM
outperforming over 10 years16
Treasury Services revenue6
For footnoted information, refer to slide 21
12
3
Being complete, global, diversified and at scale enables us to meet clients’ and customers’ needs
across the spectrum and through cycles…
CCB2
CIB2
CB
AWM
Corp.
Revenue1 by segment ($B)
$111
$123
$132
51 51 55
38
49 48
9
9 12
13
14
18
2018 2020 2022
OUR DIVERSE BUSINESS MIX PERFORMS THROUGH CYCLES…
$111
$123
$132
53 47
62
39 47
41
2018 2020 2022
20
29
29
NII3
NIR3
Markets
Revenue1 by type ($B)
…AND OUR CLIENTS AND CUSTOMERS BENEFIT FROM A COMPLETE AND AT-SCALE OFFERING
$3.7T
Total assets
Wealth Management
Commercial Real Estate
Fixed Income Markets
Global
Private Bank
International
Consumer
Initiatives
$2.8T
AUM
79mm
U.S.
consumers
$4.0T
Client assets
294k
Employees
across 60+
countries
>90%
Of Fortune 500
companies
do business with us
$5.6T
Consumer
payments4
$10T
Daily payment
processing5
Payments
Asset
Management
M&A
ECM
DCM
Equity Markets
Lending
Securities Services
Middle Market
Corporate Client
Consumer Banking
Business Banking
Card Services
Home Lending
Auto
For footnoted information, refer to slide 22
100+
Markets
globally
4
…strengthening relationships through multi-LOB partnerships and delivering all of JPMorgan Chase to
clients throughout their lifetimes
Individuals
Small
Businesses
Middle
Markets
Larger
Corporates
Financial &
Investment
Markets / SS Banking Payments
GPB AM
CCB CIB
CB
AWM
50 Market Leadership Teams in the U.S.
7 U.S. regions; 700+ senior leaders
43 Senior Country Officers globally
All focused on cross-LOB growth opportunities
~30% of leaders have cross business/function experience1
Denotes primary
relationships
Our product completeness and scale make us uniquely positioned to strengthen our value proposition to each client segment
✓
✓
✓ ✓
✓ ✓
✓ ✓ ✓ ✓ ✓
✓ ✓ ✓ ✓
✓
✓ Relationships with adjacent segments
(e.g., employees) or cross-LOB solution
CIB
CB
AWM
CCB Select cross-LOB solutions
strengthening segment value propositions
Advanced Chase Wealth Management products
and capabilities powered by Global PB
Payment solutions including
real time bill payment and global remittances
Integrated Payment solutions (QuickAccept)
embedded into Chase Complete Banking
Employee benefits and retirement accounts
provided by Everyday 401K
Payment solutions tailored to Middle Market
and specific sectors (e.g., Healthcare, e-
Commerce)
Sponsor and VC coverage spanning portfolio
companies, GPs and Founders
Global Shares for capital table management and
share plan management for employees
Range of customized lending, treasury, markets,
and custody solutions to meet needs of complex
financial institutions
✓ ✓
✓
✓
✓
✓
✓
✓
✓
✓
✓
✓
✓
✓ ✓
For footnoted information, refer to slide 22
Our value proposition
is further enhanced by
constant investment in
Technology
✓
✓
5
There are multiple sources of uncertainty ahead
Macro environment
⚫ Health of the consumer
⚫ Interaction between interest rates,
persistent inflation and ongoing
tight labor market
We are prepared to deliver for our clients, customers and stakeholders in any environment
⚫ Pace of QT
⚫ Debt ceiling
Geopolitical
⚫ Ongoing war in Ukraine
⚫ US / China relations
Regulatory
⚫ CCAR / SCB
⚫ Basel III endgame / holistic review
⚫ Heightened scrutiny of the
banking sector overall
⚫ FDIC-related items
6
Cybersecurity and risk management remain non-negotiable priorities
Provide operational resiliency
and security
Address multi-jurisdictional
sanctions
Protect clients’ assets,
money in movement and data
Minimize fraud and cyber risk
Comply with AML1 laws and
KYC2 protocols
We are an integral part of a safe, sound and resilient financial system
Compliance
Fraud
Cyber
KYC
Control
Management
Legal
Finance
Risk
For footnoted information, refer to slide 22
We are an integral part of a safe, sound and resilient financial system
Three lines of defense
Front Line Units
Independent Risk
Management
Internal Audit
Human
Resources
Technology
7
We remain committed to advancing a sustainable and inclusive economy
Sustainable Development Target: $2.5T over 10 years1
Racial Equity Commitment: $30B over 5 years1
Community
Development
Striving to advance
economic inclusion in
developed markets
$102B cumulative progress
by the end of 2022
$482B
reported progress
by the end of 2022
~$29B
Approved funding of
~$18B in loans to
incentivize the
preservation of
nearly 170k
affordable housing
rental units in the
U.S.
Opened 16 Community Center Branches2
and hired 146 Community Managers
Refinanced 14,000+
incremental mortgage
loans totaling ~$3B
Invested $100mm+ of equity in Minority
Depository Institutions and Community
Development Financial Institutions
406,000 net new low-cost
checking accounts with no
overdraft fees
Development
Finance
Working to support
socioeconomic development
in emerging economies
$204B
Green
$1T goal
Aiming to drive climate
action and sustainable
resource management
$176B
For footnoted information, refer to slide 22
95%
19%
8
9%
compound annual
growth rate since 2004
$15 $16
$19
$22 $23
$27
$30
$34
$39
$41
$45
$48
$51
$54
$56
$61
$66
$72 $73
'04 '05 '06 '07 '08 '09 '10 '11 '12 '13 '14 '15 '16 '17 '18 '19 '20 '21 '22
Our strong track record has laid the foundation for our continued success
TBVPS1 ($)
STRONG TRACK RECORD OF PERFORMANCE AND GROWTH…
18%
ROTCE1
$132B
Revenue3
58%
Overhead ratio3
445bps > peers2
$38B
Net Income
vs. 69% for peers2
vs. 12% for peers2
…MAKING US WHO WE ARE TODAY…
Complete Global At Scale
Diversified
“We are committed to achieving high
quality of earnings. This means consistently
investing in our businesses”
- Jamie Dimon, 2007
…AND CONSISTENTLY INVESTING…
Technology
Bankers, Advisors &
Branches
Marketing
Digital, Data, AI
& Product Design
New and Expanded
Businesses
…AND PREPARING US FOR THE FUTURE
For footnoted information, refer to slide 22
2022
9
For footnoted information, refer to slide 22
$1.4T
HQLA and marketable
securities
140%
Bank LCR
$488B
Total Loss-Absorbing
Capacity
5.9%
Firm SLR
13.8%
Standardized CET1 ratio
LIQUID BALANCE SHEET
$460B
Our fortress balance sheet principles are designed so we can be a pillar of strength in any environment
114%
Firm LCR
13.9%
Advanced CET1 ratio
STRONG CAPITAL POSITION
Tier 1
$254B
$488B
TLAC
Allowance
JPM
Current JPM Loss-
Absorbing Capacity
All U.S. bank loan
losses during the GFC4
As of March 31, 2023
Sources of liquidity1
$1.6T
$2.3T
Deposits1
NIM3:
4Q21
3.1% 1.9% 3.8%
(120bps) 190bps
Cash
HQLA-eligible
securities2
Other
unencumbered
securities2
$203B
$453B
$421B
$557B
$236B
$421B
4Q19 1Q23
~$600B
increase in
liquidity sources
$1.4T
$0.9T
10
$713B
$1,113B
$855B
$1,208B
4Q19 1Q23
~$800B
net deposit inflows
since QE restarted
CCB
CIB, CB,
AWM, Corp.
2023 Outlook
as of 1Q23
Impact of
First Republic
2023 Outlook Medium-term
NII ex. Markets outlook increasing to ~$84B due to First Republic, though sources of uncertainty remain
~$84
⚫ Deposit reprice
⚫ Magnitude and timing
⚫ Competitive dynamics and
consumer behavior
⚫ Balance sheet growth and mix
⚫ Card Services revolve
normalization
⚫ Securities reinvestment
strategy
⚫ Impact of policy choices and
macro environment
⚫ Pace of quantitative
tightening (QT)
⚫ Path of Fed Funds rate
⚫ Size and terms of RRP
⚫ Severity of any recession
1Q23
$20.9
NET INTEREST INCOME EX. MARKETS1 ($B) SOURCES OF UNCERTAINTY
2Q23
3Q23
4Q23
$81
Mid-$70s
~$3
Medium-term impact to be determined
For footnoted information, refer to slide 23
Assumes Fed Funds target
upper bound reaches
4.75% by year end,
with two cuts in 4Q23
Assumptions
Mid-single digit loan growth
Card Services
revolve growth
continues
Moderate
Wholesale
loan growth
Deposits down slightly YoY
Rate headwinds partially
offset by moderate loan
growth
Assumptions
Meaningful catch up in deposit
repricing as lags are removed
from the current run rate
Potential upside from
First Republic franchise
11
Should the terms of RRP be reevaluated
given the extent of deposit drainage?
Credit extension
How long can unprecedented pace of QT
continue before triggering reserve scarcity?
System-wide deposit levels will depend on how QT interacts with RRP and customer behavior
Key questions U.S.
Treasury
MMFs
FHLB
$18.1
$17.1
17
($0.4)
($0.6)
($0.7)
$0.8
Dec '21 Loans and
securities
Fed B/S TGA and
RRP
Other Apr '23
Size of Fed balance sheet
Federal
Reserve
Increase balance sheet (“QE”)
Decrease balance sheet (“QT”)
Outlook: continued QT (~$80B per month)
Mix of Fed liabilities
Increase in AUM, invested in non-
RRP assets (e.g., T-bills)
Increase in AUM, invested in Fed’s
RRP facility
Outlook: growth in RRP likely to continue
absent increase in available T-bills
Spending of Treasury General
Account (TGA)
Issue treasuries to increase TGA
Outlook: ~neutral over time
Growth in advances, if funded by
MMFs selling RRP
Growth in advances, if funded by
discount notes purchased using
bank deposits
Individuals,
corporations
and institutions
Increases deposits
Repay loans / purchase
securities from banks
Outlook: modest loan growth
to continue
Evolution of U.S. commercial bank deposits ($T)1
Fed
B/S
TGA &
RRP
Loans &
securities
Regardless of macro pressures on deposits, our strategy remains the same: focus on maintaining primary banking relationships
Borrow from / sell securities
to banks
Decreases deposits
FHLB &
other2
vs. $4.6T
Fed B/S expansion during QE
(Feb ‘20 – Dec ’21)
For footnoted information, refer to slide 23
12
Our 2023 expense outlook is unchanged excluding expenses associated with First Republic
ADJUSTED EXPENSE1 ($B)
1 2
31
33
27
28
5
5
12
12
2022 2023 Outlook
before First Republic
Impact of
First Republic
2023
Outlook
~$5 ~$81
CCB
CIB
CB
AWM
Corp.
$76
⚫ ~$2B increase in
investment expense
⚫ ~$3B increase in
structural expense
⚫ Includes $0.6B of
investments
transitioned into
BAU
⚫ Includes $0.5B of
FDIC assessment
announced in 2022
⚫ Modest decrease in
volume- and revenue-
related expense
~$3.5
~$84.5
⚫ Includes integration
costs
2024 CONSIDERATIONS
FDIC CONSIDERATIONS
⚫ Moderating labor inflation
⚫ Continued investments
⚫ Market-dependent increase in volume- and revenue-related expenses
⚫ Continued efficiencies
⚫ Integration costs related to First Republic
⚫ Potential increases to regular-way FDIC assessments
For footnoted information, refer to slide 23
⚫ Finalization of special assessment related to systemic risk
determination
⚫ Based on May 11 NPR:
– Approximately $3B, pre-tax
– Likely to be accrued in 2023
⚫ Assessment associated with First Republic
⚫ No indication of a special assessment
⚫ $13B estimated loss to the DIF can be rebuilt through regular-way
assessments
⚫ Potential redesign to deposit insurance
special assessment
FDIC
13
We continue to invest in positioning the Firm for long-term success
$5.6
$6.7
$7.2
0.3
1.9 2.3
2.7
2.6
3.2
3.2
0.2
0.2
0.3
0.7
0.8
0.9
2021 2022 2023
Technology Investments
…TECHNOLOGY…
Total investment expense ($B)
CCB
CIB
CB
AWM
Corp.
$10.9
$13.7
$15.7
0.5 0.3 0.6
5.2
7.1
7.9
3.0
3.6
3.9
0.7
0.9
1.0
1.4
1.8
2.2
2021 2022 2023
OPPORTUNITIES ACROSS ALL BUSINESSES…
$1.7
$2.2
$2.7
2021 2022 2023
$2.1
$2.6
$3.0
2021 2022 2023
$0.7
$1.5
$1.2
2021 2022 2023
Bankers, Advisors & Branches Marketing
Digital, Data, AI
& Product Design
New and Expanded
Businesses
Commerce
Int.
Consumer
$0.7
$0.9
$1.0
2021 2022 2023
Other1
…AND BEYOND
Totals may not sum due to rounding; for footnoted information, refer to slide 23
$0.2
$0.6
2021 2022 2023
$0.0
14
The regulatory capital environment is uncertain…
Today
Comment period
NPR Phase-in period
Final
rule
Final
implementation
MULTIPLE FACTORS AT PLAY, THOUGH ANY POTENTIAL REGULATORY CHANGES WON’T BE IMMEDIATE
4.5%
GSIB CCyB
Lending
RWA – “the denominator” Buffers – “the ratio”
1Q25 earliest
4.0% 0%
Today
Rule
?
? Period ?
Final
implementation
?
Trading
(incl. Repos & FRTB)
SCB
Operational Risk
and CVA
Although the ultimate direction of the various components of capital requirements is uncertain, we are prepared for overall requirements to increase
Basel III endgame Holistic review
15
…but we have strong organic capital generation capabilities
For footnoted information, refer to slide 23
11.9%
13.8%
1Q22 1Q23 1Q24
13.5%
target
Our organic capital generation and proven balance sheet discipline enable us to dynamically adjust to headwinds and pursue strategic opportunities
1Q22 – 1Q23 reflects actuals
1Q23 – 1Q24 is illustrative and based on analyst estimates as of 4/27 (before First Republic)
11.2%
13.5%
12.5%
Regulatory
Requirement
Organic capital generation (net income, less dividends1)
RWA change
SCB:
GSIB:
3.2%
3.5%
4.0%
4.0%
4.0%?
4.5%
ORGANIC CAPITAL GENERATION AND EVOLUTION OF CET1 RATIO FROM 1Q22 TO 1Q24
Includes RWA
mitigation efforts
RWA growth2
~40bps per
quarter2
Potential uses:
⚫ FDIC special assessment
⚫ 2023 SCB uncertainty
⚫ Potential regulatory changes
⚫ Additional business growth
⚫ Distributions
~$20B of excess
capital available
Includes net
repurchases and
AOCI
~40bps First
Republic impact
13.0%
16
Credit remains benign, but we expect continued normalization throughout the year
5.8%
5.3%
Q0 Q1 Q2 Q3 Q4 Q5 Q6 Q7 Q8
WE ARE RESERVED FOR PEAK UNEMPLOYMENT OF 5.8% IN LATE 20241
8-quarter weighted average UER forecasts (%)
10.3 11.4
1.9
1.7
6.5
9.5
18.7
22.8
4Q21 total allowance Economic
drivers
Loan growth / mix
and credit quality
1Q23 total allowance
Card Services
Consumer ex.
Card
Wholesale
Firmwide allowance ($B)
WE HAVE BUILT RESERVES AS THE OUTLOOK HAS DETERIORATED
3
WE EXPECT NORMALIZED NCOS BY THE END OF 2023
NCO rate (%)
0.6%
0.6%
0.3% 0.3%
2019 2020 2021 2022 2023
Outlook
Card Services Consumer ex. Card Wholesale Firmwide
3.10%
2.93%
1.94%
1.47%
2.60%
For footnoted information, refer to slide 23
4Q21
1Q23
Pre-pandemic
2017 – 2019
average
3,4
2
17
18%
2022 Medium-term
We are positioned to generate strong ROTCE in a variety of recessionary scenarios
For footnoted information, refer to slide 23
Deposit outcomes
Credit normalization
and possible deterioration
Impact of policy choices
Investment banking wallet recovery
and new normal
Inflation
Regulatory items
Loan growth
THE BALANCE OF RISKS SKEWS TO THE
DOWNSIDE…
…BUT WE CAN STILL DELIVER STRONG RETURNS IN A RECESSION
Illustrative ROTCE1 path by recessionary scenario
17%
through the
cycle target
Moderate to deep, early
Moderate, delayed
Recession
depth, timing
Moderate to deep, early
Shallow, gradual Shallow, early
Well below
Well above
Fed Funds Rate
vs. LT policy
Slightly above
Above Below
Sharply abating
Persistent
Inflation Slowly abating
Less persistent Abating
Recessionary scenarios
1Q22 – 4Q22
quarterly ROTCE
20%
18
We remain committed to serving our clients and customers with the full breadth of our offering, while
producing strong returns for all our constituents
~17%
ROTCE target
~$84B
2023 NII and NII ex. Markets
~$84.5B
2023 adjusted expense
13.5%
Target CET1 ratio at 1Q24
Promotes stronger and deeper
relationships with customers
Allows us to serve more clients everywhere
Supports more stable earnings in any
operating environment
Offsets margin compression through volume
growth and facilitates efficiencies
Complete Global
Diversified At Scale
See notes on slide 20 for additional information on ROTCE, NII ex. Markets and adjusted expense
19
Notes on non-GAAP financial measures
1. In addition to analyzing the Firm’s results on a reported basis, management reviews Firmwide results, including the overhead ratio, on a “managed” basis; these Firmwide managed basis results
are non-GAAP financial measures. The Firm also reviews the results of the lines of business on a managed basis. The Firm’s definition of managed basis starts, in each case, with the reported
U.S. GAAP results and includes certain reclassifications to present total net revenue for the Firm and each of the reportable business segments on a fully taxable-equivalent basis. Accordingly,
revenue from investments that receive tax credits and tax-exempt securities is presented in the managed results on a basis comparable to taxable investments and securities. These financial
measures allow management to assess the comparability of revenue from year-to-year arising from both taxable and tax-exempt sources. The corresponding income tax impact related to tax-
exempt items is recorded within income tax expense. These adjustments have no impact on net income as reported by the Firm as a whole or by the lines of business. For a reconciliation of the
Firm’s results from a reported to managed basis for the full years 2020, 2021 and 2022, refer to page 58 of JPMorgan Chase’s Annual Report on Form 10-K for the year ended December 31,
2022 (“2022 Form 10-K”). For all other periods presented, refer to the Explanation and Reconciliation of the Firm’s Use of Non-GAAP Financial Measures disclosure in JPMorgan Chase’s
Annual Report on Form 10-K for each respective year
2. In addition to reviewing net interest income (“NII”), net yield, and noninterest revenue (“NIR”) on a managed basis, management also reviews these metrics excluding CIB Markets (“Markets”,
which is composed of Fixed Income Markets and Equity Markets). Markets revenue consists of principal transactions, fees, commissions and other income, as well as net interest income. These
metrics, which exclude Markets, are non-GAAP financial measures. Management reviews these metrics to assess the performance of the Firm’s lending, investing (including asset-liability
management) and deposit-raising activities, without the volatility associated with Markets activities. In addition, management also assesses Markets business performance on a total revenue
basis as offsets may occur across revenue lines. For example, securities that generate net interest income may be risk-managed by derivatives that are reflected at fair value in principal
transactions revenue. Management believes that disclosure of these measures provides investors and analysts with alternative measures to analyze the revenue trends of the Firm. For a
reconciliation of NII, net yield, and NIR from reported to excluding Markets for the full year 2022 and the first quarter of 2023, refer to page 59 of JPMorgan Chase’s 2022 Form 10-K and page
17 of JPMorgan Chase’s Quarterly Report on Form 10-Q for the quarter ended March 31, 2023, respectively. For all other periods presented, refer to the Explanation and Reconciliation of the
Firm’s Use of Non-GAAP Financial Measures disclosure in JPMorgan Chase’s Annual Report on Form 10-K for each respective year
3. Tangible common equity (“TCE”), return on tangible common equity (“ROTCE”) and tangible book value per share (“TBVPS”), are each non-GAAP financial measures. TCE represents the
Firm’s common stockholders’ equity (i.e., total stockholders’ equity less preferred stock) less goodwill and identifiable intangible assets (other than mortgage servicing rights), net of related
deferred tax liabilities. ROTCE measures the Firm’s net income applicable to common equity as a percentage of average TCE. TBVPS represents the Firm’s TCE at period-end divided by
common shares at period-end. TCE, ROTCE and TBVPS are utilized by the Firm, as well as investors and analysts, in assessing the Firm’s use of equity. For a reconciliation from common
stockholders’ equity to TCE for the full years 2020, 2021 and 2022, refer to page 60 of JPMorgan Chase’s 2022 Form 10-K. For all other periods presented, refer to the Explanation and
Reconciliation of the Firm’s Use of Non-GAAP Financial Measures disclosure in JPMorgan Chase’s Annual Report on Form 10-K for each respective year
4. Adjusted expense, which excludes Firmwide legal expense, is a non-GAAP financial measure. Adjusted noninterest expense excludes Firmwide legal expense of $266mm for the full year ended
December 31, 2022. Management believes this information helps investors understand the effect of certain items on reported results and provides an alternate presentation of the Firm’s
performance
20
Notes on slide 3
Slide 3 – We have leading client and customer-centric franchises
1. Federal Deposit Insurance Corporation (FDIC) 2022 Summary of Deposits survey per S&P Global Market Intelligence applies a $1B deposit cap to Chase and industry branches for market share. While many of our branches have
more than $1B in retail deposits, applying a cap consistently to ourselves and the industry is critical to the integrity of this measurement. Includes all commercial banks, savings banks and savings institutions as defined by the FDIC
2. Based on 2022 sales volume and loans outstanding disclosures by peers (American Express Company (AXP), Bank of America Corporation, Capital One Financial Corporation, Citigroup Inc. and Discover Financial Services) and
JPMorgan Chase estimates. Sales volume excludes private label and Commercial Card. AXP reflects the U.S. Consumer segment and JPMorgan Chase estimates for AXP’s U.S. small business sales. Loans outstanding exclude
private label, AXP Charge Card, Citi Retail Cards and Commercial Card
3. Barlow Research Associates, Primary Bank Market Share Database as of 4Q22. Rolling 8-quarter average of small businesses with revenue of more than $100,000 and less than $25mm
4. Dealogic as of April 3, 2023. Rank for 2022
5. Coalition Greenwich Competitor Analytics. Based on JPMorgan Chase’s internal business structure and revenue. Rank for 2022, based on Coalition Index Banks for Markets
6. Coalition Greenwich Competitor Analytics. Reflects global J.P. Morgan Treasury Services business (CIB and CB). Based on JPMorgan Chase’s internal business structure and revenue. Rank for 2022, based on Coalition Index
Banks for Treasury Services
7. Euromoney
8. Active ETF Rank (Simfund)
9. In the U.S.. S&P Global Market Intelligence as of December 31, 2022
10. Refinitiv LPC, 2022
11. Represents general purpose credit card spend, which excludes private label and Commercial Card. Based on company filings and JPMorgan Chase estimates
12. Data as of 2017
13. Includes gross revenues earned by the Firm, that are subject to a revenue sharing arrangement with the CIB, for products sold to CB clients through the Investment Banking, Markets or Payments businesses. This includes
revenues related to fixed income and equity markets products
14. In the fourth quarter of 2022, certain revenue from CIB markets products was reclassified from investment banking to payments. In the first quarter of 2020, the Merchant Services business was realigned from CCB to CIB. With the
realignment, revenue is now reported across CCB, CIB and CB based primarily on client relationship. Financials from 2012 were revised to conform with the current presentation. Includes growth of $161mm that is also included in
the Gross IB revenue metric
15. In the fourth quarter of 2020, the Firm realigned certain wealth management clients from AWM to CCB. Prior-period amounts have been revised to conform with the current presentation
16. 90% of 10-year J.P. Morgan Asset Management long-term mutual fund AUM performed above peer median. All quartile rankings, the assigned peer categories and the asset values used to derive this analysis are sourced from the
fund ranking providers. Quartile rankings are done on the net-of-fee absolute return of each fund. The data providers re-denominate the asset values into U.S. dollars. This % of AUM is based on fund performance and associated
peer rankings at the share class level for U.S.-domiciled funds, at a “primary share class” level to represent the quartile ranking of U.K., Luxembourg and Hong Kong funds, and at the fund level for all other funds. The “primary share
class” is defined as C share class for European funds and Acc share class for Hong Kong and Taiwan funds. In case the share classes defined are not available, the oldest share class is used as the primary share class. The
performance data could have been different if all share classes would have been included. Past performance is not indicative of future results. Effective September 2021, the Firm has changed the peer group ranking source from
Lipper to Morningstar for U.S.-domiciled funds (except for Municipal and Investor Funds) and Taiwan-domiciled funds, to better align these funds to the providers and peer groups it believes most appropriately reflects their
competitive positioning. This change may positively or adversely impact, substantially in some cases, the quartile rankings for one or more of these funds as compared with how they would have been ranked by Lipper for this
reporting period or future reporting periods. The source for determining the rankings for all other funds remains the same. The classifications in terms of product suites and product engines shown are J.P. Morgan’s own and are
based on internal investment management structures
17. Refers to total client asset flows
21
Notes on slides 4-10
Slide 4 – Being complete, global, diversified and at scale enables us to meet clients’ and customers’ needs across the spectrum and through cycles…
1. Totals may not sum due to rounding. See note 1 on slide 20
2. In the first quarter of 2023, the allocations of revenue and expense to CCB associated with a Merchant Services revenue sharing agreement were discontinued and are now retained in Payments in CIB. Prior-period
amounts have been revised to conform with this presentation
3. Ex. Markets. See note 2 on slide 20
4. Total payment volumes reflect Consumer and Small Business customers’ digital (ACH, BillPay, PayChase, Zelle, RTP, External Transfers, Digital Wires), Non-digital (Non-digital Wires, ATM, Teller, Checks) and credit
and debit card payment outflows
5. Based on firmwide data using regulatory reporting guidelines as prescribed by the Federal Reserve Board
Slide 5 – …strengthening relationships through multi-LOB partnerships and delivering all of JPMorgan Chase to clients throughout their lifetimes
1. As of May 5, 2023, 30% of MD employees up to two levels down from the Operating Committee had cross-sub-LOB and/or cross-function mobility since 2017
Slide 7 – Cybersecurity and risk management remain non-negotiable priorities
1. Anti-money laundering (“AML”)
2. Know your customer (“KYC”)
Slide 8 – We remain committed to advancing a sustainable and inclusive economy
1. Select highlights, refer to our 2022 ESG report for additional detail
2. Total Community Center Branches as of April 30, 2023
Slide 9 – Our strong track record has laid the foundation for our continued success
1. See note 3 on slide 20
2. Peers include Bank of America, Citigroup, Goldman Sachs, Morgan Stanley and Wells Fargo
3. See note 1 on slide 20
Slide 10 – Our fortress balance sheet principles are designed so we can be a pillar of strength in any environment
1. Totals may not sum due to rounding. Deposits are average for the quarter
2. HQLA-eligible securities includes the Firm’s average eligible HQLA securities and average eligible HQLA securities held by JPMorgan Chase Bank, National Association ("JPMorgan Chase Bank, N.A.") that is in excess
of its stand-alone 100% minimum LCR requirement and not transferable to non-bank affiliates, and thus excluded from the Firm’s reported HQLA under the LCR rule. Other unencumbered securities includes other end-
of-period unencumbered marketable securities, such as equity and debt securities
3. Net yield on average interest-earning assets excluding Markets. See note 2 on slide 20
4. All U.S. banks’ loan losses for the Great Financial Crisis calculated as losses for peak loss years (2009-2011). S&P Capital IQ
22
Notes on slides 11-18
Slide 11 – NII ex. Markets outlook increasing to ~$84B due to First Republic, though sources of uncertainty remain
1. See notes 1 and 2 on slide 20
Slide 12 – System-wide deposit levels will depend on how QT interacts with RRP and customer behavior
1. Totals may not sum due to rounding
2. Includes items from both the Fed balance sheet and all Commercial Banks balance sheets that influence deposits but are not reflected in the other data presented
Slide 13 – Our 2023 expense outlook is unchanged excluding expenses associated with First Republic
1. See note 4 on slide 20. Totals may not sum due to rounding
Slide 14 – We continue to invest in positioning the Firm for long-term success
1. Other includes selected LOB-related acquisition expenses and investments associated with the company’s real estate expenses
Slide 16 – …but we have strong organic capital generation capabilities
1. Dividends include common and preferred stock dividends
2. Represents the median consensus of research analyst estimates as of April 27, 2023
Slide 17 – Credit remains benign, but we expect continued normalization throughout the year
1. As of March 31, 2023
2. Wholesale includes allowance for credit losses in Corporate
3. Totals may not sum due to rounding; 4Q21 and 1Q23 total allowance include $42mm and $90mm, respectively, on investment securities
4. On January 1, 2023, the Firm adopted changes to the TDR accounting guidance. The adoption of this guidance resulted in a net reduction in the allowance for loan losses of approximately $600mm
Slide 18 – We are positioned to generate strong ROTCE in a variety of recessionary scenarios
1. See note 3 on slide 20. ROTCE ranges indicated are estimates
23
We continue to execute against our technology strategy
Deliver best-in-class products,
platforms, and experiences
Unlock the
power of data
Strengthen our development
capabilities and infrastructure
Customer and
client experiences
Product and
platform
development
Modernize
technology
Drive software
development
excellence
Embed data and
insights into
everything
⚫ Continued to release new products and experiences
that delight our customers:
⚫ Account validation: custom-built engine that
validates bank accounts to protect customers
⚫ Cash optimization: enable utilization of residual
cash to generate alpha
⚫ Connected Commerce: ecosystem of products
connected via reusable APIs
⚫ Fusion: cloud-native data management and
reporting platform
⚫ Versana: reduce settlement times and improve
liquidity management for syndicated loan market
⚫ Improved speed-to-market of
product features by 20% (in days)
⚫ Continued application
modernization through refactoring,
SaaS replacement, and legacy
decommissioning
⚫ Enabled multi-vendor public cloud
as target state infrastructure
⚫ Completed ~60% of our application
migrations to strategic data centers
⚫ Optimized data center footprint to
facilitate public cloud journey
⚫ Ahead of our plan to
deliver $1B
business value
⚫ +34% YoY growth in
AI/ML use cases in
production
⚫ Accelerated large-
language-model
(LLM) enablement
⚫ Matured ability to
respond to new
threats, including
quantum safe
encryption
⚫ Delivered business
value through cyber
as a differentiator
⚫ Maintained flat
expense relative to
volume increases
Proactively defend
against cyber
threats
Protect the Firm
and our customers
1 2 3 4
1
Products, platforms, and experiences $4.0B
Modernize technology and software
development excellence
$3.2B
Unlock the power of data
Protect the Firm and our customers
Total $7.2B
$0.7
$1.1
$0.5
$0.5
2019 2021 Structural
/ volume-
related
Investments 2022 Structural
/ volume-
related
Investments 2023
$11.7
$12.5
$14.3
$15.3
+7% CAGR
Our expense growth is driven by investments, volumes, and structural factors
CAGR
2019-23
11%
4%
CIB $3.2B
CCB $2.7B
AWM $0.9B
CB $0.3B
Total $7.2B
Infrastructure
Software licenses
Application and production support
Wage inflation +$0.5
Volumes / other +$0.5
Internal efficiencies ($0.5)
2
Wage inflation +$0.6
Volumes / other +$0.5
Internal efficiencies ($0.4)
TECH INVESTMENTS BY STRATEGY, 2023
FULLY LOADED TECH INVESTMENTS BY LOB, 2023
RUN THE BANK INCLUDES
Investments /
change the
bank
Run the
bank
TOTAL TECHNOLOGY EXPENSE ($B)
Note that totals may not sum due to rounding
◼ Increase utilization of cloud and
reduce data center footprint
◼ Break monolithic applications into
modular and API-driven architecture
to improve cost elasticity
◼ Improve engineer capacity through
agile adoption and elimination of non-
value adding activities
◼ High levels of automation (testing,
release, production support) and
streamlined software delivery through
our platforms
We have delivered $0.5B against our $1.5B productivity target
3
~$300mm
through engineering
efficiencies and
labor productivity
~$200mm
in infrastructure
productivity
OUR 3-YEAR COMMITMENT FROM INVESTOR DAY 2022 PROGRESS WE’VE MADE
Modernizing technology and software development excellence will drive cost efficiency
across the total spend and slow our expense growth
Total spend breakdown Opportunity size
Opportunity levers
Total Spend ($B)
Engineering
Product, design, application
support, and other
Infrastructure and software
14.1
15-20%
~10%
in infrastructure cost
efficiency
in productivity and
cost efficiency
Software development excellence
Modernize technology
~$1.5B in productivity and cost efficiencies over the next 3 years
Strengthen our software development capabilities and infrastructure
2
~560
2022 2023
+14%
Growth in SaaS
applications
We continue to modernize our technology estate while keeping infrastructure RTB expense relatively flat
4
⚫ We have increased SaaS adoption to replace non-differentiating
applications with industry-leading SaaS solutions
⚫ And we have continued our legacy application decommissioning
journey
⚫ In the last year, we have been modernizing our on-premise infrastructure
and growing cloud use
⚫ Over time, this has resulted in our infrastructure run-the-bank expense
remaining relatively flat while our volumes have increased
30%
38%
2022 2023
Cloud as a percentage of total infra spend
~60%
of in-scope applications
have fully migrated to our
modern data centers
2019 2022
+50%
Storage and compute volumes
2019 2022
+2% CAGR
Infrastructure run-the-bank expense
Strengthen our software development capabilities and infrastructure
2
WE’VE MADE SIGNIFICANT PROGRESS IN MODERNIZING APPLICATIONS… …WHILE MODERNIZING OUR INFRASTRUCTURE & SUPPORTING GROWING VOLUMES
~490
~2,200 ~2,500
2022 2023
+300
Volume of
applications
decommissioned
since 2017
We’ve made progress on technology modernization and engineering excellence to drive efficiencies in
feature delivery and slow our expense growth
AGILITY
Adopt and continuously improve
agile practices to free engineer
capacity
SPEED
Accelerate development and
deployment of features into
production
STABILITY
Minimize failed changes and
unplanned outages
60%
of apps
60%
of teams
100%
of apps
LAUNCH
PLAN
…tracking towards ~100%
Toolchain adoption by YE 2023
84%
On Enterprise
Toolchain
Exceeded 80%
2022 target
5
Strengthen our software development capabilities and infrastructure
2
WHAT WE MEASURE ACROSS SOFTWARE DEVELOPMENT LIFECYCLE COVERAGE EXAMPLE OUTCOMES WE’VE ACHIEVED IN 1 YEAR
99.9% change success rate while
change volumes have gone up ~60%
~70% of CCB teams improved YoY
performance on agile practices
~20% improvement in days from
backlog to deployment
Our modernization strategy is enabling us to deliver significant value across the business
6
Strengthen our software development capabilities and infrastructure
2
Completed migration of internet-
facing Chase.com to the public
cloud in 4Q22, serving all
customers through Amazon Web
Services
Chase.com
22% increase in
change volume
15 Chase.com releases
weekly, 2 mobile app
releases monthly
100% customers onboarded
(including 63mm+ active
digital customers)
Moving up-funnel to meet
customers earlier in their journeys,
protecting our core franchise,
and disrupting incumbents in
Commerce
Connected Commerce
Innovative API-driven
platform to automate
partner onboarding and
simplify integration with
Chase ecosystem
35% increase in speed to
deliver product features YoY
Offers and
recommendations delivered
$350mm impact over two
months in 2023
Graphite is a scalable, modern
strategic platform for processing
payments globally, including
real-time payments
JPM Payments
Transaction Engine
Third largest payments
platform by volume
Reduced time to launch a
new real-time payment
market from ~18 months
to ~3-6 months
Each payment capability
built with its own
independent component
architecture
Regulatory data warehouse
responsible for global regulatory
reporting for Cash Equities,
Futures, and Options in 15+
countries
Markets Regulatory
Reporting Platform
Reduced monthly running
cost by >50%
Running on public cloud,
enabling real-time audit
trail calculation and report
generation
Increased ability to scale to
2.5B trades per day on
public cloud from 500mm
trades per day on-premise
$1.5B target
2021 2022 2023
3.6x
AI/ML driven business impact
7
Unlock the power of data
3
Building an industry-leading team
WE EXPECT TO BEAT OUR AI/ML IMPACT TARGETS CONTINUING TO ACCELERATE THE POWER OF OUR DATA AND AI/ML
We continue to prioritize our investment in Data and AI/ML, and see increasing value in our businesses
Expanding our technology platforms
Select thematic examples across our 300+ use cases in production
Personalization of products
and experiences for retail
customers
Deepening client relationships
through improved analytics and
insights
~25 use cases
~$220mm impact in 2022
~60 use cases
~$100mm impact in 2022
1 JPMC ranked number one in the Evident AI Index (January 2023), the first public benchmark of major banks on their AI maturity
600+
ML engineers
data scientists
900+
200+
AI researchers
Ranked #1
Evident AI Index1
⚫ Improving capabilities, with embedded governance and
Responsible AI
⚫ Integrating ML Ops capability to support teams to develop
models faster and measure performance
⚫ Increased use cases leveraging firmwide model development
and training platform by 2.2x YoY
We continue to evolve our best-in-class Cyber capabilities through a dynamic threat environment
8
2022
2020 2023
2021
Security alerts
processed per day
Advising U.S. Government and policy makers to improve public-private partnership
and enhance cybersecurity for critical infrastructure
Automating security controls by default in development, data, and infrastructure
platforms, reducing the number of required developer actions by over 60%
Further strengthening access and authentication, improving user experience while
lowering the burden of managing passwords
Engaging with NIST1 as a financial services member of the National Cybersecurity Center
of Excellence and collaborating on post-quantum cryptography migration guidelines
2022 2023
Cybersecurity exercises
and simulations
2022 2023
Supplier vulnerabilities
proactively mitigated by
JPMC
2022 2023
Cyber-related
expenditure
1 National Institute of Standards and Technology
Reduced required actions and introduced straight-through-processing for cloud
regulatory compliance resulting in automated approval for over 60% of deployments
Protect the firm and our customers
4
MANAGING EXPENSE WHILE DOING MORE CREATING VALUE WHILE PROTECTING THE FIRM AND FINANCIAL SERVICES
INDUSTRY CRITICAL INFRASTRUCTURE
+22%
>2x
+66%
+4% CAGR
We are well positioned to lead across our businesses, backed by resilient, innovative technology, for years
to come
Unlock the
power of data
Protect the Firm and
our customers
Deliver best-in-class
products and experiences
to customers
Strengthen our software
development capabilities and
infrastructure
1 2 3 4
9
Continued to release new
products and experiences that
delight our customers
Improved speed-to-market of
product features by 20%
$0.5B productivity impact
delivered against $1.5B target
~100% Enterprise Toolchain
adoption by year-end
Ahead of our plan to deliver
$1B business value
300+ use cases in production
$1.5B value target to be
delivered by year-end 2023
Creating value while
protecting our Firm and
customers
Optimizing our expense
while volumes increase
S T R I C T L Y P R I V A T E A N D C O N F I D E N T I A L
We have a consistent set of strategic priorities
Growing and deepening relationships by
engaging customers1 with products and
services they love and expanding our distribution
Delivering financial performance that is
consistently best-in-class
Leveraging data and technology to drive speed
to market and deliver customer value
⚫ Grow our customer base through new-to-bank relationships in Consumer Bank and Card
⚫ Engage customers with improved experiences across human and digital channels
⚫ Deepen relationships with a focus on Business Banking, Wealth Management, and Commerce
⚫ Operate resilient businesses with best-in-class returns
⚫ Scale core businesses and invest for long-term growth
Protecting our customers and the firm through a
strong risk and controls environment
Cultivating talent to build high-performing,
diverse teams where culture is a competitive
advantage
⚫ Optimize channels, products, and platforms to deliver customer and business value
⚫ Modernize applications, infrastructure, and data to future-proof the business
⚫ Drive disciplined risk, controls, and governance processes
⚫ Leverage our risk platforms as responsible growth engines
⚫ Create a culture where our people come to work with heart, curiosity, and courage
⚫ Be known as a company that serves customers, communities, and each other in a first-
class way
Strategy
Enablers
Outcome
1
5
2
3
4
1 “Customer” includes both consumers and small businesses and reflects unique individuals and business entities that have financial ownership or decision-making power with respect to accounts
2
We have delivered against our commitments
Added net ~3mm customers to the CCB franchise
Continued to scale distribution by opening 114 branches, while adding 240+ Business Relationship Managers and 300+ Advisors
Launched Personal Advisors and Wealth Plan for Chase clients and advisors
Launched Ink Business Premier, Pay in 4 on debit to select customers, and ChaseTravel.com for cardholders
Targeted and delivered ~$8B in volume through Travel platform – on track for ~$15B by 2025
Migrated nearly 30% of data to the public cloud – on track for 50% by end of 2023
Delivered $500mm+ in value from AI/ML programs
Continued to operate in a strong risk and controls environment
Attracted top talent and reduced attrition
Generated ~$40B in net interest income vs. ~$38B guidance from last year
Incurred ~$31B in adjusted expense1 vs. ~$32B guidance from last year
Delivered 29% ROE on net income of $14.9B
Extended #1 position in retail deposit share2 by 60bps
Extended #1 position in card by outstandings3 by 74bps
Strategy
Enablers
Outcome
✓
✓
✓
✓
✓
✓
✓
✓
✓
✓
✓
✓
✓
✓
STRATEGIC PRIORITIES AND COMMITMENTS
For footnoted information, refer to slide 73
3
73.6 74.3 76.3 79.0
4.6 4.9 5.3 5.7
2019 2020 2021 2022
Small businesses
Consumers
We continue to drive significant customer growth – the catalyst for the franchise
Retail deposit share2
9.1% (#3) 9.6% (#3) 10.3% (#1) 10.9% (#1)
Business Banking primary bank share3
9.4% (#1) 9.5% (#1) 9.2% (#1) 9.3% (#1)
Card sales share4
22.4% (#1) 22.3% (#1) 22.4% (#1) 22.4% (#1)
Card O/S share4
16.6% (#1) 16.6% (#1) 16.5% (#1) 17.3% (#1)
CCB customers (mm)
Since 2019, we have grown our overall customer base by 8% and multi-LOB relationships5 by ~20%
8%
1
For footnoted information, refer to slide 74
4
We strive to make it easy to do business with us by engaging customers across channels
In 2022, we achieved record high satisfaction across channels5
active digital
customers3
63mm+
digital logins4
>15B
mobile logins per
user per month
>20
unique visitors to
branches per day
~900k
U.S. population
within a 10-min.
drive to a branch
60%
customers met
with a banker
>20mm
#1 Digital banking platform1 1st Retail bank in all lower 48 states2
Enabling customers to manage their full financial lives through
our digital banking, lending, and investing capabilities
Our branch network is a local storefront for customers who
want to engage with our bankers and advisors
Increasing branch
density
For footnoted information, refer to slide 75
5
We are investing across our lines of business to serve more of our client needs
CONNECTED COMMERCE
Customers (mm)
1.6
2.2 2.3
2019 2021 2022
45%
Relationships2 (mm)
2.9
3.5 3.8
2019 2021 2022
>75%
of Business Banking clients
also have a Consumer
Banking relationship
>85% of first-time investors come
from banker referrals3
BUSINESS BANKING
Clients5 (mm)
WEALTH MANAGEMENT1
Enabled by recent
acquisitions
>$3
~$4
~$8
2019 2021 2022
Chase Travel sales volume ($B)
4
>2x 30%
For footnoted information, refer to slide 76
6
We generate tremendous franchise value from operating our businesses within CCB and the broader firm
World-class capabilities across the firm
100%
of J.P. Morgan Wealth Management investments
through Asset & Wealth Management
Solutions throughout customers’ lifecycles
>15%
of new Middle Market relationships came
from Business Banking last year
Unmatched omnichannel distribution
Scale of our franchise
Leading financial services brand
#1
in prospect consideration
across peer institutions1
$7B+
in investments to drive sustained growth
while delivering industry leading returns
CCB JPM
Customer Value Employee Value Enterprise Value
~50%
of Commercial & Private Banking clients
visit our branch network5
Branch network as a storefront for JPMC
#1
#1
#1
Consumer Banking
Business Banking
Card
Wealth
Merchant
Mortgage
#1
#1
#2
For Chase clients3
In the industry2
75%+
of mortgage originations4, Business Banking clients,
and wealth relationships from existing customers
For footnoted information, refer to slide 77
7
2019 2021 2022
Average deposits ($B) $698 $1,055 $1,163
Average loans ($B) $478 $434 $439
Average Card outstandings ($B) $156 $140 $163
Revenue ($B)2 $55.0 $49.9 $54.8
Deposit margin3 2.48% 1.27% 1.71%
Expense ($B)2 $28.1 $29.0 $31.2
ROE 31.0% 41.0% 29.0%
$21.7
$18.1
$20.9
We continue to deliver strong financial performance
CCB Pretax Income ex. LLR ($B)1,2
For footnoted information, refer to slide 78
8
$49.9
$54.8
$3.5
$1.9
($0.7)
($0.7) $1.0
2021 Macro rate Volume Overdraft changes Margin MSR / Other 2022
We continue to drive core growth in the business: 2021-2022
▲ Deposit growth
▲ Card loan and spend growth
▼ Increase in Card acquisition costs
▼ Home Lending production volumes
▼ Auto leases
1 In the first quarter of 2023, the allocations of revenue and expense to CCB associated with a Merchant Services revenue sharing agreement were discontinued and are now retained in Payments in CIB. Prior-period amounts have been revised to conform with the current presentation
2 Totals may not sum due to rounding
Net Interest Income ($B)
2022
Actual
~$40
2023
Outlook
ex. FRC
~$50
(▲~$10 vs. ‘22)
▲ Card loan yield
▼ Home Lending production margin
▼ Card renewals and refreshes
2
CCB REVENUE ($B)1
9
$49.1
$54.8
($5.1)
$13.0
($1.0)
($0.3)
($0.9)
2012 Macro rate Volume Overdraft changes Margin MSR / Other 2022
Revenue walk: 2012-2022
Net Interest Income ($B)
2022
Actual
~$40
2023
Outlook
ex. FRC
~$50
(▲~$10 vs. ‘22)
Deposit Margin2
2.57%
Deposit Margin2
1.71%
1 In the first quarter of 2023, the allocations of revenue and expense to CCB associated with a Merchant Services revenue sharing agreement were discontinued and are now retained in Payments in CIB. Prior-period amounts have been revised to conform with the current presentation
2 Banking & Wealth Management
CCB REVENUE ($B)1
10
$1,173
$1,134
$80
($47)
($118)
$46
1Q22 Customer growth Customer activity Yield-seeking outflows Yield-seeking inflows 1Q23
We are retaining and growing primary bank relationships and capturing money in motion
▼ JPM WM investments
▼ Internal migration3
▼ External brokerages
▼ Online banks
▲ Internal migration6
▲ Net new money
$35
JPM WM investments
$81
retention of yield
seeking flows7
~60%
of banking customers outflow to
an online bank with no change
in primary bank %5
~5%
YoY customer
growth2
>3%
Total yield-seeking inflows
4
52% checking
52% checking
Core
Drivers
~4%
For footnoted information, refer to slide 79
decline in deposit
balances driven by
higher taxes and spend
BANKING & WEALTH MANAGEMENT DEPOSIT BALANCES ($B)1
11
23.9 24.2
We are maintaining expense discipline while we continue to invest for the future
$23.8 $24.0 ~$25
$29.0
$(0.8)
$0.9
$0.1 $31.2
~$(0.1)
~$1.1
~$0.3 ~$33
$1.9
~$0.7
2021 Volume- &
revenue-related
Structural Investments Other 2022 Actuals Volume- &
revenue-related
Structural Investments Other 2023 Outlook
Investments ▲ Wage inflation
▲ Higher headcount
▲ Technology
▼ Auto lease depreciation
▲ Core volume growth
▲ Salesforce incentives
$7.0
$5.2
2022
▲ FDIC base
assessment
CCB ADJUSTED EXPENSE ($B)1,2,3
For footnoted information, refer to slide 80
ex. FRC
12
2021 2022 2023
Outlook
~3% CAGR
$23.8B
~$25B
~30% Customers per branch6
>15% Tenured Advisors7
>15% Sales productivity per branch8
BRANCH NETWORK & FIELD COST PER ACCOUNT
$24.0B
2019 2022 2023
Outlook
(5%)
For footnoted information, refer to slide 81
>20% Servicing calls per customer3
>50% Total transaction volume4
~5% Fraud loss rate per transaction5
OPERATIONS & FRAUD COST PER ACCOUNT
2019 2022 2023
Outlook
(11%)
We are realizing benefits of scale and efficiencies across our business
ADJUSTED EXPENSE1,2 (EX. INVESTMENTS)ARE GROWING MODESTLY
Other volume-
related
Other structural
Tech production
Operations &
fraud
Branch network
& field
13
$7.1
~$7.9
$2.7
$3.1
$3.2
$3.9
$1.2
$0.9
2022 2023 Outlook
From 2022-2023, we will continue to invest in growing the franchise
Wealth
Management
Connected
Commerce2
Branch
Network
Marketing
⚫ Roll-off of travel platform operating expenses
⚫ Deal integration & amortization (cxLoyalty, FROSCH)
⚫ Advisor hiring
⚫ New builds in expansion and mature markets
⚫ Banker hiring
⚫ Acquisitions & deepening
⚫ Branding
6 year
payback
4 year
break-even
4 year
break-even
2 – 3x ROI
Growth
businesses
$0.5
$0.4
$1.4
$2.5
Note: marketing investments
are part of ~$8B total gross
marketing spend3
Technology
& product
⚫ Channels, products, and platform development
⚫ Infrastructure, applications, and data modernization
~50% pays
back in <5
years4
Disciplined investment process – focus on long-term growth and profitability
$0.71
2023
Status
2022 Return
Profile
✓
✓
✓
✓
✓
Distribution
For footnoted information, refer to slide 82
14
CCB INVESTMENTS REPRESENT ~$7.9B OF ~$15.7B IN TOTAL FIRMWIDE INVESTMENTS ($B)
We continue to deliver customer and business value as we modernize our technology
$1.2 $1.4
$1.1
$1.3
$0.3
$0.4
2022 2023 Outlook
~$3.1
Tech
modernization
Product &
design org
Tech modernization: Improve speed and quality to help future-proof the business
Tech product development: Deliver experiences customers love
Tech product
development
$2.7
Channels
Evolve our self-service and
digital capabilities
Products
Offer new products and features
Platforms
Continuously improve to
meet customer needs
Digital channels
Improved self-service capabilities to
reduce call volumes by 20% per
customer since 2019
Engagement
Total active digital users up 20%
vs. 2019 as we continue to launch
new features and products
Account opening
~11mm accounts opened digitally, up
37% vs. 2019
$0.4
Infrastructure
Increase resiliency, scalability,
and delivery
Applications
Faster speed to market
Data
Transform our data housing and
consumption
New data centers & public cloud
~50% of applications have migrated out
of legacy data centers, on track to
migrate ~95% by YE 2024
Interoperability
~65% of customer digital account
opening flows moved to target platform,
on track to reach 99% goal by YE 2023
Cloud migration
~30% of data is in the public cloud, on
target to reach 50% by YE 2023
Looking forward we expect total CCB investment spend growth to moderate – consistent with a profitable growing franchise
IMPACT BEING DRIVEN BY OUR TECHNOLOGY INVESTMENTS (SELECT EXAMPLES)
1 Note: Totals may not sum due to rounding
15
TECHNOLOGY AND PRODUCT INVESTMENTS ($B)1
We closely monitor the health of our consumers’ balance sheets (1 of 2)
Median balances are down from their peak but
remain up from pre-pandemic levels
Historical avg. Pandemic high Mar '23
Median deposit balances
Total population
Historical avg. Pandemic high Mar '23
Median operating cash buffers3 (days)
Total population
Jan ‘20 Mar ‘23
17%
19%
Median nominal income growth vs. inflation
Inflation rate
Nominal income growth (Stable cohort - all incomes)
Nominal income growth (Stable cohort - lowest incomes)
Operating cash buffers remain above pre-pandemic levels
and continue to slowly normalize
Nominal incomes are up but inflation
has impacted real wage gains
All incomes +84% +21%
Lowest incomes2 +115% +31%
All incomes +126% +75%
Lowest incomes2 +183% +92%
31%
4
Stable cohort1
Stable cohort1
5
6
For footnoted information, refer to slide 83
16
98%
54%
84%
21%
We closely monitor the health of our consumers’ balance sheets (2 of 2)
39%
11% 9%
36%
4%
3%
FY22 vs. FY19 Apr YTD ('23 vs. '22) Apr ('23 vs. '22)
Total credit and debit spend growth1
Total population
Change in credit spend Change in debit spend
Overall, spend remains solid as our portfolio is growing
We also track the same customers’ spend over time and see
they have recently started to trade down
$169 $180
4Q19 1Q23
Period-end card outstandings ($B)3
7%
O/S ($) per
account
Revolve O/S
($) over
same time
period up
~3%
While the number of customers who revolve continues to
normalize, those that do revolve have higher balances
10%
O/S ($) per revolving account
Driven by… 14%
% of revolvers (#)5
17%
2.4%
-
0…
20%
3.5%
0.3%
FY22 vs. FY19 Apr YTD ('23 vs. '22) Apr ('23 vs. '22)
Credit spend growth1
Stable cohort2
All incomes Lowest incomes
(1.2%)
Total population (9%)
Stable cohort4
(All incomes) (5%)
All
incomes
+15% / +23% +3% / +2% (2%) / 0%
Lowest
incomes
+19% / +23% +4% / +2% 0% / 0%
Stable credit cohort discretionary and non-discretionary spend mix
Total
population
+38% / +38% +10% / +8% +7% / +6%
Credit and debit discretionary and non-discretionary spend mix
For footnoted information, refer to slide 84
17
We’ve maintained a prudent risk profile while we continue to grow the business (1 of 2)
Card1
Issuer
Sub-Prime Mix Sub-Prime Mix 30+ DQs
Net Credit
Losses
3
4Q19 4Q22
4Q22 as a % of
4Q19
4Q22 as a % of
4Q19
Peer 1 N/D N/D 63% 46%
Chase 16% 13% 78% 54%
Peer 2 18% 16% 77% 56%
Peer 3 20% 18% 97% 70%
Peer 4 23% 20% 79% 59%
Peer 5 32% 20% 79% 70%
Peer 6 28% 26% 82% 68%
Peer 7 33% 31% 87% 75%
Auto1,2
Issuer
30+ DQs Net Credit Losses
3
4Q22 as a % of 4Q19 4Q22 as a % of 4Q19
Peer 1 82% 87%
Chase 89% 80%
Peer 2 99% 111%
Peer 3 103% 137%
INDUSTRY RISK PERFORMANCE METRICS
1 Peer information sourced from public disclosures
2 Chase Auto excludes Wholesale (DCS) & Lease
3 Represents net charge-offs
18
We’ve maintained a prudent risk profile while we continue to grow the business (2 of 2)
2012 2019 2022
Card
% of portfolio <660 FICO score1 16% 16% 13%
% of outstandings from balance
parker segment2 20% 9% 5%
Auto3
% of portfolio <660 credit score4 22% 18% 16%
% of portfolio <660 FICO score and
LTV >1205 1.6% 2.1% 1.3%
Home
Lending6
Owned-portfolio avg. FICO1 692 758 769
Owned-portfolio avg. CLTV 79% 55% 51%
2019 2022 ∆
Card
% of originations <660 credit score
Industry7 10% 13% 3ppts
Chase 3% 3% -
Auto3
% of originations with term ≥84 months
Industry7 12% 18% 6ppts
Chase 5% 5% -
Home
Lending
% LTV >80 HFI jumbo origination mix
Industry8 11% 13% 2ppts
Chase 9% 10% 1ppt
ORIGINATION RISK METRICS
PORTFOLIO RISK METRICS
For footnoted information, refer to slide 85
19
Credit continues to return to pre-pandemic levels
⚫ Consumer balance sheets and credit remain healthy,
continuing a path of normalization
⚫ Leading credit indicators – notably early delinquency roll-rates
– remain below pre-pandemic levels
⚫ Card entry to delinquency rates are ~80% of pre-pandemic
levels, up from the low point in 2Q21
⚫ Chase Auto loan portfolio loss performance has normalized
to pre-pandemic levels
2019 2020 2021 2022 2023 Outlook
Card 3.10% 2.93% 1.94% 1.47% ~2.6%
Auto 0.33% 0.20% 0.05% 0.21% ~0.5%
Retail only 0.44% 0.25% 0.04% 0.24% ~0.55%
Home Lending (0.05%) (0.09%) (0.17%) (0.14%) ~0.0%
Business
Banking1
0.58% 0.57% 0.53% 0.40% ~0.6%
ex. Overdraft 0.47% 0.48% 0.41% 0.17% ~0.35%
< 3.5%
2024 Outlook
> 3.5%
2025 Outlook
CREDIT RISK OUTLOOK NET CHARGE-OFF GUIDANCE
1 Excludes Paycheck Protection Program loans
20
⚫ Primary driver of stress scenario is unemployment rate (UER)
⚫ Losses typically lag UER, and will vary depending on when UER peaks and shape of recovery
⚫ Table on the right shows annualized average losses over the two-year period 1Q24-4Q25, and cumulative losses over the same period
Annualized avg. (%) Cumulative ($)
Central case ~3.5% ~$15.5B
Moderate
recession scenario
~4.8% ~$18.8B
Incremental +130bps +$3.3B
Estimated 2-Year net credit losses (2024-2025)
Unemployment rate
0%
1%
2%
3%
4%
5%
6%
7%
8%
4Q22 1Q23 2Q23 3Q23 4Q23 1Q24 2Q24 3Q24 4Q24 1Q25 2Q25 3Q25 4Q25 1Q26 2Q26 3Q26 4Q26
Moderate recession (peak 3Q24) Central case
5.1%
7.1%
KEY ASSUMPTIONS – NOT AN OUTLOOK1
Stress scenario analysis for Card
1 Federal Reserve's 2022 DFAST Results and Methodology Disclosure remains instructive data point for more severe recession
21
Our Home Lending portfolio is in a position of strength with low delinquencies and strong LTVs
Our business is well-positioned given current
levels of equity and portfolio quality
Home Lending portfolio by CLTV1,2
30+ Delinquency % (based on $)
Financial Crisis Pre-Covid Current
20103 Mar ‘20 Mar ‘23
13.5% 1.5% 0.8%
We continue to prepare for a variety of
stress scenarios
30+ delinquency rate at 0.2% if vintages prior to
2010 are excluded
~5% of portfolio resides in 80%+
HPI trough (5%) (15%)
Peak UER 5.1% 7.1%
Central
case
Moderate
recession
Estimated 2024-2025 NCOs ($mm)
< 100
< 300
47%
21%
16%
11%
4%
1%
<50% 50-60% 60-70% 70-80% 80-90% >=90%
Home prices remain elevated but have begun to
decline from recent peaks
Major markets with >10% forecasted HPI4,5
declines from peak to YE 2023
▪ Additional expected decline (current to Dec’23)
▪ Actual decline (2022 peak to current)
▪ % HFI 2022 originations6
-13%
-11%
-10%
-9%
-11%
-6%
-9%
-7%
-9%
-6%
-8%
-6%
-7%
-7%
-7%
-8%
-6%
-8%
-5%
-7%
-4%
-7%
-5%
-3%
9%
6%
2%
3%
3%
1%
1%
3%
1%
1%
4%
11%
-20%
-18%
-17%
-17%
-16%
-14%
-14%
-14%
-13%
-13%
-13%
-10%
San Francisco-Oakland-Hayward, CA
Seattle-Tacoma-Bellevue, WA
Austin-Round Rock, TX
Phoenix-Mesa-Scottsdale, AZ
San Jose-Sunnyvale-Santa Clara, CA
Portland-Vancouver-Hillsboro, OR-WA
Las Vegas-Henderson-Paradise, NV
Denver-Aurora-Lakewood, CO
Sacramento-Roseville-Arden-Arcade, CA
Nashville-Davidson-Murfreesboro-Franklin, TN
San Diego-Carlsbad, CA
Los Angeles-Long Beach-Anaheim, CA
For footnoted information, refer to slide 86
22
We run our business for the long-term and manage through cycles
Forward-looking guidance of 25%+ ROE through the cycle
Current outlook is
uncertain
as macro factors may pressure
short term returns
Benefits of
reprice lags
Deposit outlook Credit trends
We leverage the power
of the CCB franchise
remaining confident in our
strategies through cycles
Scale of our
customer
relationships
Strength and
diversification of
our businesses
Operational
excellence and
discipline
Investment
through cycles
with unmatched
capacity
23
We have consistently driven core growth and strong returns over the long term
For footnoted information, refer to slide 87
$11.7
$12.3
$13.4
$14.4
$15.2 $15.0
$19.4
$21.7
$18.8
$18.1
$20.9
2012 2013 2014 2015 2016 2017 2018 2019 2020 2021 2022
$1,066 $2,249
7.1% (#3) 10.9% (#1)
20.5% (#2) 22.4% (#1)
17.7% (#1) 17.3% (#1)
6.2% (#3) 9.3% (#1)
Fed Funds effective rate6
CCB pretax income ex. LLR ($B)5
CCB ROE ex. LLR5
Client balances ($B)7: 8% CAGR
Retail deposit share (%)8: +380bps
Card sales market share (%)9: +190bps
BB Primary bank share (%)10: +310bps
0.14% 0.11% 0.09% 0.13% 0.40% 1.00%
1.83% 2.16%
0.38% 0.08%
1.68%
16% 15% 15%
17%
18% 18%
28%
31%
26% 26%
31%
Card O/S share (%): (40bps)
Card O/S share is
up >200bps since
2012 when
adjusting for risk-
appetite
CONSUMER & COMMUNITY BANKING – 10-YEAR PERFORMANCE1,2,3,4
24
25
We are making strong progress against our strategy
#1
retail bank based on
deposits1
Consumer
Banking
Branch
Network
⚫ Grow: ~40mm customers, up 14% since 20192
⚫ Engage: ~80% primary bank
⚫ Deepen: ~50% of primary customers are multi-LOB3
1st
bank in all lower
48 states
⚫ Grow: #1 deposit share in 11 of top 50 markets4
⚫ Engage: >75% of balances held by regular branch visitors5
⚫ Deepen: ~20% increase in banker productivity since 2019
Optimize and extend our
branch network to reach and
gain trust in more local
communities
Strengthen and tailor our
customer value propositions
to extend leadership
position
Consumer Banking Branch Network Business Banking Card & Connected Commerce
WE’RE THE MARKET LEADER OUR STRATEGY IS WORKING AND WE WILL EXTEND OUR LEAD
For footnoted information, refer to slide 88
26
We have continued to drive core growth in our business
Consumer Banking Branch Network Business Banking Card & Connected Commerce
27
1 “Consumer Banking customer” reflects unique individuals that have financial ownership or decision making power with respect to Consumer Banking accounts
14%
11%
35.4
37.9
39.2
40.4
2019 2020 2021 2022
14%
We added 1.6mm
net new checking
accounts in 2022
4.5%
CAGR
Consumer Banking customers (mm)1
Average deposits ($B) $535 $629 $772 $848
Debit card sales ($B) $314 $339 $414 $431
18.3%
11.3%
10.1%
Our core customer growth has driven significant outperformance
9.1%
9.9% 9.8%
10.9%
10.3%
9.8%
2019 2022 2019 2022 2019 2022
#3 #1 #1 #2 #2 #3
Rank4
+180bps +40bps flat
Chase Peer 1 Peer 2
Chase Large Banks2
Industry
(ex. Chase)
3-year deposit CAGR1
WE OUTPERFORMED PEERS IN DEPOSIT GROWTH SINCE 2019…
National retail deposit share3
…WHICH HAS LED TO ~180BPS OF DEPOSIT SHARE GAIN
Consumer Banking Branch Network Business Banking Card & Connected Commerce
For footnoted information, refer to slide 89
28
Satisfied
Loyal
Engaged
Our primary bank customers are satisfied, loyal, and engaged
~80%
of primary bank customers
would recommend Chase2
of Consumer Banking checking customers
partner with us as their primary bank1
~80%
of Consumer Banking Gen Z and Millennial
consumer checking customers are primary bank
retention rate among
primary bank customers4
>95%
>75%
>75% >75%
of customers are
mobile active7
of balances held by customers
who regularly use branches6
customer satisfaction across
branch and digital channels3
Record high
of primary bank customers choose
Chase for other financial needs5
~50%
Consumer Banking Branch Network Business Banking Card & Connected Commerce
For footnoted information, refer to slide 90
29
Our customers engage with Chase to make payments and manage their finances
2019 2022
Cash & check
Debit
Digital ~40%
(25%)
~26mm
active Zelle
customers2
>35
monthly debit transactions
per active debit customer3
2019 2022
Mobile-active >75%
+9ppts
Not mobile-active
~50%
of mobile-active Consumer
Banking users engage with
our financial health tools5
~9B
digital logins by
Consumer Banking
users6
Transactions by method of payment1
CUSTOMERS ARE SHIFTING TO DIGITAL PAYMENTS…
Mobile engagement4
…AND USING THE CHASE APP TO MANAGE THEIR FINANCES
Consumer Banking Branch Network Business Banking Card & Connected Commerce
For footnoted information, refer to slide 91
30
Wealth
Management
Business
Banking
Credit
Card
Home
Lending
>75%
of retail volume is from
Consumer Banking
customers
>75%
of Business Banking clients
also have a Consumer
Banking relationship
>45%
of Branded Card members
are also Consumer
Banking customers1
~90%
of Wealth Management
relationships also have a
Consumer Banking relationship2
~50% of Consumer Banking primary customers are engaged across products
Increases relationship value Strengthens banking relationship
Lowers cost of acquisition
Consumer
Banking
CONSUMER BANKING SERVES A HIGH PROPORTION OF CUSTOMERS ACROSS EACH LOB AND GENERATES TREMENDOUS VALUE FOR THE FIRM
Consumer Banking Branch Network Business Banking Card & Connected Commerce
31
1 Excludes small business customers
2 Consumer and small businesses with Wealth Management relationships with balances >$0
We continue to strengthen our value proposition to meet the needs of customers across segments
2019 2022 2019 2022
Products &
Services
Advice
⚫ Launched Early Direct Deposit on Secure
Banking
⚫ Launching Freedom Rise for new-to-credit
⚫ Scaled Community Centers and branches
to build trust and financial health locally
⚫ Developing Credit Journey features for
credit building and new-to-credit
⚫ Deployed higher yield options for cash
management
⚫ Improved payments experiences
⚫ Launched Wealth Plan to help clients plan
for the future
⚫ Adding banker and advisor capacity to
serve more client needs
Low-cost entry to banking with tailored
solutions to build financial health
Relationship proposition to meet
banking, lending, and investing needs
2019 2022
⚫ Strengthened Overdraft Assist with next day
no fee / $50 buffer
⚫ Launched Pay in 4 to select customers
⚫ Launched Personal Advisors for mass
affluent clients looking for low-cost advice
⚫ Continuing branch expansion to serve more
communities
Full-service banking solution to meet
spend, save, and liquidity needs
Emerging segments Affluent segments
Mass market segments
~75% ~5%
~20%
% of accounts4
# OF LOW-COST
CHECKING ACCOUNTS1
# OF MASS MARKET
CHECKING ACCOUNTS2
# OF PRIVATE CLIENT RELATIONSHIPS
WITH DEPOSITS AND INVESTMENTS3
Consumer Banking Branch Network Business Banking Card & Connected Commerce
~40% ~10% ~30%
For footnoted information, refer to slide 92
32
33
5,293
4,831
2017 2022
We have accelerated our growth as we have extended and optimized our branch network
$119
$227
2017 2022
Chase Large banks2
(ex. Chase)
% of current network opened
in the last five years4
15% 3%
% of network consolidated in
the last five years5
22% 24%
(1.8%) CAGR
Large Banks2
(ex. Chase)
(4.7%) CAGR
13.8% CAGR
Large banks2
(ex. Chase)
$165mm3
Chase Large banks2
(ex. Chase)
Deposits per branch
(10+ years cohort)4
$259mm $170mm
Deposits per branch
(5-10 years cohort)4
$154mm $97mm
BRANCH COUNT1 DEPOSITS PER BRANCH ($mm)1,6
Consumer Banking Branch Network Business Banking Card & Connected Commerce
We have increased the number of consumer and small business customers per branch by ~30% from 2019 to 20227
For footnoted information, refer to slide 93
34
Network expansion creates an unparalleled growth engine
Meaningful contribution:
7%
3%
15%
5%
3%
6%
79%
88%
94%
Chase
Large banks2
(ex. Chase)
0-5 years
10+ years
~$85B
in deposit growth since
2017 from branches
<10 years old3
5-10 years
~4 year
break-even on
new builds4
More upside:
~$160B
in incremental deposits as our
branches mature to look like our
seasoned network5
<5%
branch share in 19 of the top 50
markets, including 3 of the top 10
(DC, Boston, Philadelphia)1,6
Industry
Branch network by age cohort1
WE HAVE INVESTED IN NEW BRANCHES FASTER THAN PEERS
THESE INVESTMENTS ARE CONTRIBUTING MEANINGFULLY
TO OUR PERFORMANCE, WITH MORE UPSIDE
Consumer Banking Branch Network Business Banking Card & Connected Commerce
For footnoted information, refer to slide 94
35
We have a demonstrated ability to grow in different starting positions and markets
11.6%
14.8%
20.4%
2012 2017 2022
1.6%
4.2%
6.3%
2012 2017 2022
0.8%
2012 2017 2022
Out of footprint
8.8ppts
111
new builds from
2012-20224
~$9B
deposit growth from
2012-20221
~$2B
deposit growth from
2017-20221
4.7ppts
13.7% 16.5% 16.9%
Branch
share2 5.7% 6.7% 8.7%
Branch
share2
0.0% 0.0% 2.6%
Branch
share2,3
~$86B
deposit growth from
2012-20221
42
new builds from
2017-20224
35
new builds from
2012-20224
0.8ppts
Deposit share1
LOS ANGELES
Deposit share1
ATLANTA
Deposit share1
BOSTON
Consumer Banking Branch Network Business Banking Card & Connected Commerce
For footnoted information, refer to slide 95
36
Branches are an important part of our omnichannel service and engagement model
2019 2022
Branch-
centric
Multi-
channel
Digitally-
centric
2019 2022
>75% of balances are held by customers
who regularly use branches
(~25%) ~20%
Everyday branch transactions1
WE ENABLE CUSTOMERS TO SELF-SERVE
Balance by customer channel engagement behavior2
CUSTOMERS CONTINUE TO VISIT BRANCHES
Productivity per banker3
WE ARE MEETING MORE CLIENT NEEDS
Consumer Banking Branch Network Business Banking Card & Connected Commerce
For footnoted information, refer to slide 96
37
Wealth
Management
Business
Banking
Credit
Card
Home
Lending
Our branches are the storefront for JPMC across lines of business
~50%
of mortgages are
originated in branches2
~85%
of business checking accounts
are opened in branches
~25%
of Branded credit cards are
opened in branches
>85%
of first-time investors come
from banker referrals1
Branch team
of experts
OUR BRANCH TEAMS GENERATE TREMENDOUS VALUE FOR THE FIRM ACROSS CCB AND JPMC MORE BROADLY
Creates a talent pipeline Serves a wide range of client needs
Drives acquisitions across channels
Consumer Banking Branch Network Business Banking Card & Connected Commerce
38
1 Represents first-time investors with full-service relationships through Chase Wealth Management
2 Represents mortgage originations from branch Home Lending Advisors
We are extending our network to cover more Americans and gain trust in local communities
5,293 Branches1
4,831
~60%
U.S. population coverage
by market3 ~80%
50%
U.S. population coverage
within a 10-minute drive time4 60%
68% Small business coverage5
87%
$4.4T Addressable deposits6
$7.9T
~85% coverage
by market
Looking ahead:
~70% coverage within a
10-minute drive time
2017 CHASE BRANCH NETWORK COVERAGE BY STATE1 2022 CHASE BRANCH NETWORK COVERAGE BY STATE1
Consumer Banking Branch Network Business Banking Card & Connected Commerce
Increasing branch share2
For footnoted information, refer to slide 97
39
40
41
585
The small business ecosystem remains healthy despite economic headwinds
Monthly small business formations (#k)1
Small business formations are elevated vs. pre-pandemic…
40
140
240
340
440
540
640
Jan-19 Jan-20 Jan-21 Jan-22 Jan-23
Consumer Banking Branch Network Business Banking Card & Connected Commerce
Small business optimism index2
…and while optimism remains low…
80
85
90
95
100
105
110
Jan-19 Jan-20 Jan-21 Jan-22 Jan-23
Cash buffers (# of days of reserves, indexed to start of period)3
…our clients are healthy, with strong cash buffers…
30-day delinquency rates (relative to start of period)3
…and relatively low delinquencies
60%
80%
100%
120%
140%
160%
180%
200%
Jan-19 Jan-20 Jan-21 Jan-22 Jan-23
-0.8%
-0.4%
0.0%
0.4%
0.8%
615
355 101
90
100%
187%
130% Start
91
Pandemic peak
Jan-19 Jan-20 Jan-21 Jan-22 Jan-23
+46bps
-13bps
-80bps
-40bps
0bps
+40bps
+80bps
1 Source: U.S. Census – Business and Industry Time Series, Monthly Business Formation Statistics; not seasonally adjusted
2 Source: NFIB: Optimism Index
3 Cash buffers data based on fixed cohort of clients active in both January 2020 and November 2022, with balances/outflows tracked from January 2019–March 2023; delinquency rates based on both Business Banking line/loan and Chase Small Business Card – excl. PPP loans, overdrafts
42
We serve ~6mm small- and medium-sized businesses (SMBs) across Chase for Business1
Consumer Banking
Entrepreneurs who start businesses
Chase for Business
<$20mm sales size
Commercial Banking
~$20mm-$2B sales size2
Corporate & Investment Bank
>$2B sales size
Business Banking Business Card Payments Services
#1
Primary bank market share3
Today’s focus
#2
SMB credit card spend3
#1
Payment provider for Business
Banking clients1
Consumer Banking Branch Network Business Banking Card & Connected Commerce
1 6MM client count as of December 2022; payment provider rank as of April 2023
2 Annual sales size thresholds are directional and do not apply to select core segments and specialized industries within Commercial Banking
3 Primary bank market share sourced from Barlow Research Associates as of 4Q22. Rolling 8-quarter average of small businesses with sales size between $100k-$25mm; SMB credit card spend share based on internal estimates of Nilson (only 2021 available) and 2022 actuals if available
43
We help businesses of all sizes start, run, and grow with Chase
WE SERVE ALL TYPES OF SMALL- AND
MEDIUM-SIZED BUSINESSES…
~65%
of BB clients start in
Consumer Banking
~30%
of large BB clients
started as small clients2
>15%
of new Middle Market
relationships come
from BB1
Start Run Grow
~40%
~50%
~10%
<$100k $100k-$1mm >$1mm
(1) Professional Services
(2) Real Estate
(3) Construction
(4) Retail
(5) Healthcare
(6) Transportation
(7) Other
6.2%
9.3%
2012 2022
#3 #1
+310bps
Primary bank market share and rank3
Annual sales size and industry mix of BB clients
Consumer Banking Branch Network Business Banking Card & Connected Commerce
1
2
3
4
5
6
7
…HELPING THEM START,
RUN, AND GROW…
…EARNING US THE RIGHT TO BE THE
TOP BUSINESS BANK IN THE U.S.
1 Data reflects FY2022
2 Large clients defined as businesses with an annual sales size of $1mm or greater; Small clients defined as businesses with an annual sales size of under $1mm; captures client sales size growth between 2020 and 2022
3 Primary bank market share sourced from Barlow Research Associates as of 4Q22. Rolling 8-quarter average of small businesses with sales size between $100k-$25mm
44
Our business is growing rapidly and delivers strong economics
Business Banking clients (mm)
2.9
3.2
3.5
3.8
0
0.5
1
1.5
2
2.5
3
3.5
4
2019 2020 2021 2022
Average deposits ($B) $136 $175 $226 $259
Average loans
ex. PPP ($B)
$24 $24 $22 $20
Primary bank rank1 #1 #1 #1 #1
30%
OUR BUSINESS HAS GROWN SIGNIFICANTLY…
~3x
higher balances per average BB
account vs. average Consumer
Banking account
~80%
of balances in noninterest-
bearing checking accounts
~9% CAGR
+ 90%
since ‘19
We originated >340k
net new checking
accounts in 2022
Consumer Banking Branch Network Business Banking Card & Connected Commerce
…THESE RELATIONSHIPS
HAVE STRONG ECONOMICS
1 Primary bank market share sourced from Barlow Research Associates as of 4Q22. Rolling 8-quarter average of small businesses with sales size between $100k-$25mm
45
The key to our success is continuing to win clients’ primary bank relationships
Are satisfied ~70% digital and ~85% branch satisfaction
Are loyal ~95% retention rate1
Are engaged ~75% use multiple channels2
Have higher balances ~4x higher balances vs. non-primary
Have multiple products ~10ppts higher SMB card ownership
2 of 3
Chase Business Banking clients choose us for
their primary operating account
These clients:
2. An industry-leading
omnichannel service model
anytime, anywhere, in the channel
of their choice
1. A complete suite of products and
services that make Chase the
best place to start, run, and grow a
small business
PRIMARY CLIENTS ARE SATISFIED, LOYAL, AND ENGAGED
Consumer Banking Branch Network Business Banking Card & Connected Commerce
WE EARN PRIMARY BANK RELATIONSHIPS THROUGH
BEST-IN-CLASS SOLUTIONS AND EXPERIENCES
1 Excluding businesses <2 years old from formation
2 Both digital and branch active in 2022
46
Our comprehensive suite of financial products and services makes Chase the best place to start, run, and
grow a small business
✓ Entry-level and premium checking
✓ LegalZoom partnership
✓ Payments services including Zelle, Wires, Bill Pay
✓ Coming soon: Digitizing more customer activities
✓ Coming soon: Invoicing
Banking and Cash Management
Invoicing
✓ Entry-level, premium, and co-brand credit cards
✓ SBA1, small- and large-dollar lending, digital lending
✓ Coming soon: Expanding Credit Journey
Credit Card / Lending
Lending platform modernization
⚫ 6 app inputs
(vs. 50+)2
⚫ <5 mins to
complete
⚫ Automated
post-app
tasks
✓ Merchant Services integrated with core banking
✓ Everyday 401(k)
✓ Fraud Hub
✓ Coming soon: Tap To Pay
✓ Coming soon: Payroll
Merchant and Adjacent Services
Everyday 401(k)
Consumer Banking Branch Network Business Banking Card & Connected Commerce
1 Small Business Administration
2 Comparison reflects comparable product on modernized platform vs. legacy
47
Our best-in-class omnichannel offering allows us to serve our clients anytime, anywhere, in the channel of
their choice
Multi-
channel
~80%
of clients are
digitally active
~65%
of clients are multi-
channel active
Deliver more omnichannel experiences:
⚫ Interactive demos for prospects
⚫ Video meetings for bankers and clients
⚫ Schedule a banker meeting online
Amplify our digital channels with:
⚫ Enhanced merchant offers
⚫ Expanded Credit Journey
⚫ Enhanced customer insights
>1B digital log-ins
in 2022
~85% branch satisfaction,
~70% digital satisfaction
Serving our
clients anytime,
anywhere, in the
channel of their
choice
Digital
People
Physical
Network
~90%
of assigned
clients met with a
Relationship Manager2
~80%
of clients visit a
branch
Continue to leverage our expanding branch
footprint which currently covers 87% of U.S.
small businesses1
Hire ~1,000 Relationship Managers by 2025,
given assigned clients have:
⚫ Higher retention
⚫ More multi-product relationships
⚫ Higher customer satisfaction
~4,800 Chase branches,
>15,000 ATMs
~12,000 Consumer Bankers &
~2,300 Business Relationship
Managers
Consumer Banking Branch Network Business Banking Card & Connected Commerce
1 Small business coverage by CBSA based on Dun and Bradstreet Small Business locations. Small business defined as <$20mm in annual sales size
2 180-day contact rate for clients assigned to either a remote or in-person Business Relationship Manager
48
The value of Business Banking relationships extends to the rest of CCB and JPMC
>15%
of new Middle Market
relationships came from
BB last year
~40%
of total CCB deposits held
by BB clients1
>5ppt
higher share of Private
Bank client wallet when
they have BB relationship2
~50%
more Business Card
clients with a BB
relationship vs. 2019
>75% >2x
of accounts opened by existing CCB
clients are originated without a
marketing offer
higher average BB client revenue when
clients have multiple CCB relationships
(vs. BB-only)
Increased revenue per client
Lower cost of acquisition
Business Banking
generates
tremendous value
for the Firm…
…and benefits
significantly from
CCB and JPMC
Card
Banking &
Wealth
Private
Bank
Commercial
Banking
Business
Banking
Consumer Banking Branch Network Business Banking Card & Connected Commerce
1 Includes deposits held by Business Banking clients in business and personal accounts; as of January 2023
2 Excludes Private Bank clients who are only associated with Business Banking clients generating <$100k sales size, and client records that do not have wallet share data available; as of May 2023
49
We have a compelling opportunity for continued growth
Industry-leading share of a
rapidly-growing market
✓ ~450k small businesses formed each month1
✓ #1 primary bank share2
✓ ~9% annual client growth since 2019
✓ ~80% of balances in noninterest-bearing checking accounts
✓ ~40% of CCB deposits are held by BB clients
✓ ~2,300 Business Relationship Managers held 1.4mm3 client meetings
✓ ~4,800 branches that reach 87% of U.S. small businesses4
✓ ~80% of clients are digitally active, with >1B total log-ins in 2022
Unparalleled scale with a
localized service model
Strong unit economics and
contribution to the Firm
Consumer Banking Branch Network Business Banking Card & Connected Commerce
For footnoted information, refer to slide 97
50
4.8
2.7 2.4
2019 2021 2022
5.9 6.4 6.5
2019 2021 2022
11.5 12.1 13.7
2019 2021 2022
31% 35% 32%
2019 2021 2022
Our Card franchise continues to be the industry leader in sales and outstanding balances
43 47 52
2019 2021 2022
16.4
14.8 16.1
2019 2021 2022
156 140
163
2019 2021 2022
763
893
1,065
2019 2021 2022
Active accounts (mm)2 Average outstandings ($B)
Sales volume ($B) Revenue ($B)3
21% 40% 4%
Risk-adjusted revenue ($B)3,4
19%
Net charge-offs ($B) ROE ex. LLR4
(50%)
Pretax income ex. LLR ($B)4
10%
3.10% 1.94% 1.47%
NCO Rate
(2%)
#1 in card sales volume since 20171
#1 in card outstandings for more than a decade1
98% customer retention in 2022
WE CONTINUED TO SCALE ACTIVE ACCOUNTS AND SALES – AND HAVE SEEN AVERAGE OUTSTANDINGS REBOUND FROM PANDEMIC LOWS
WE MAINTAINED OUR POSITION OF STRENGTH
1Q23 EOP O/S of $180B
Consumer Banking Branch Network Business Banking Card & Connected Commerce
51
For footnoted information, refer to slide 99
Our strategy will drive sustained success while making our business more resilient over time
STRATEGY
Create deeper
customer
relationships
Grow our card
member base across
key segments
Engage through
experiences
customers love
WHAT WINNING LOOKS LIKE
>$30B
volume through our Commerce
platforms in 2025
70 NPS
across Card and Commerce
experiences
⚫ Drive sticky relationships with customers through best-in-class experiences
⚫ Deepen relationships with customers across CCB and merchants across JPMC
⚫ Launch new, tailored products to win in key segments, including SMB and Starter
⚫ Fuel continued growth through our world-class marketing and distribution engine
⚫ Build out our two-sided platform through Connected Commerce
⚫ Continue to expand on our core enablers: payments and lending capabilities
20%
share of industry outstandings
in Card
ACTIONS WE ARE TAKING
Consumer Banking Branch Network Business Banking Card & Connected Commerce
52
10.7%
12.0%
21.8% 22.4%
20.4% 20.4%
2017 2018 2019 2020 2021 2022
We continually launch and refresh Card value propositions to deliver industry leading engagement
sales share3
#1
Peer 1
Peer 2
10.0% 10.8%
16.2% 17.3%
7.0%
8.8%
2017 2018 2019 2020 2021 2022
outstandings share3
#1
Peer 1
Peer 2
24 products launched or refreshed
since 2019
97% of co-brand sales contractually
extended to at least 20271
CARD HIGHLIGHTS
Continually launching and refreshing our world-class card products
while building stronger partnerships to expand our reach
Investing in new lifestyle benefits and experiences to differentiate
our products, and grow engagement with our customer base
3 airport lounges launched, with 2
more coming later this year
~70% of fee-based card demand
driven by Millennial and Gen Z2
Consumer Banking Branch Network Business Banking Card & Connected Commerce
MARKET PERFORMANCE
53
For footnoted information, refer to slide 100
We are investing in products and experiences for key segments to drive growth
Strategic Focus Progress
Starter
Launching Freedom Rise in select channels this year
Leveraging the strategic advantage
of our branches to help new-to-
credit prospects
Affluent
Differentiating with investments in
travel and dining assets and
capabilities
Closely integrating key assets with the Sapphire brand
Small
Business
Expanding our product suite to
better serve the full continuum of
SMB needs
Launched Business Premier in all channels in October 2022
Lounges
Concierge
Services
Dining
Addressable Market
U.S. consumers1
>25mm
U.S. SMBs2
>40mm
U.S. consumers3
>40mm
Consumer Banking Branch Network Business Banking Card & Connected Commerce
54
For footnoted information, refer to slide 101
$3.1
$2.1
$3.8 $4.0
$4.3
$1.3
$1.1
$1.4
$1.7
$1.6
2019 2020 2021 2022 ID Outlook 2022 Actuals
Product Benefits
(incl. co-brand)
Acquisition,
Distribution & Media
Our marketing engine fuels our scale and distribution
CARD GROSS CASH MARKETING SPEND ($B)1 KEY DRIVERS AND PERFORMANCE METRICS
$4.5
$5.9
Revenue
Outlook from 2022 ID Revised Outlook
>30%2 >50%2
New accounts – 2022 vintage vs. 2019
New accounts 14% 23%
Active accounts
Outlook from 2022 ID 2022 Actuals
16% 21%
Total portfolio – 2022 vs. 2019
Sales volume 33% 40%
Annual fee
revenue 20% 28%
$3.2
$5.2
$5.7
Our disciplined approach to marketing enables us to generate predictable returns
Lifetime value >1.5x3 >1.7x3
Consumer Banking Branch Network Business Banking Card & Connected Commerce
55
For footnoted information, refer to slide 102
We are improving productivity to better acquire and serve customers, and optimize expense
⚫ Our channels are getting more productive
Of new Branded card accounts acquired
through owned-channels in 2022 (+3ppts YoY)1
85%
⚫ Our discipline drives more efficient account production
Decrease in customer call-in rates
since 20192
3ppts
Increase in accounts originated from pre-
qualified offers in 2022 vs. 2021
4ppts
⚫ Our investments drive a more seamless experience
Increase in digital active card customers
as % of total card base since 2019
5ppts
Improvement in Card fraud loss rate
since 2019
~1.5bps
Increase in new account production in 2022
vs. 2021
21%
⚫ Our ecosystem is serving customers more efficiently
WE ARE MORE PRODUCTIVE AT ACQUIRING CUSTOMERS… …AND SERVING THEM MORE EFFICIENTLY ONCE ACQUIRED
Consumer Banking Branch Network Business Banking Card & Connected Commerce
56
1 Owned channels include phone, chase.com, refer a friend, retail, and direct mail
2 Call-in rate is defined as the number of customer calls to specialists relative to annual customer statements
Our two-sided platform delivers unmatched value for consumers and brands
Brands
Consumers
>63mm
Digital active customers2
>20
Monthly mobile logins per user
Digital Ecosystem
#1
Credit card issuer with >$1T in sales
>$5.6T
Payments volume1
Consumer Payments
#1
Consumer bank based on deposits
#1
Most visited banking portal in U.S.3
Base Beyond Card
Airlines
Hotels
Offers & Shopping
Dining
And >650 Luxury Hotel & Resort Collection partners
And >500 merchants on Chase Offers in 2022
Benefits
Scale of our assets Breadth of our solutions Richness of our data
No provider can match the:
Connected
Commerce
~300k hotel properties including…
>200 airline partners including…
Consumer Banking Branch Network Business Banking Card & Connected Commerce
57
For footnoted information, refer to slide 103
We are on-track to become a household name in premium leisure travel
>$3B
~$8B
~$15B
2019 2022 2025 Outlook
Chase Travel sales volume ($B)3
✓ On track to hit ~$10B in Chase Travel sales this year
Chase Travel
Creating an end-to-end journey that delivers curated content,
unique experiences, and elevated servicing while operating as
a self-sustaining business
Booking platform that enables end-
to-end control over the experience
Highly-tenured agents that deliver
unique, customized trips
High Tech High Touch
1 in 4
Leisure travel dollars spent
on Chase cards
24%
YoY growth in transactions
through Chase Travel2
Top 5
Consumer leisure
travel provider1
~40%
YoY growth in customers
purchasing travel on Chase2
PERFORMANCE HIGHLIGHTS CHASE TRAVEL VISION
Consumer Banking Branch Network Business Banking Card & Connected Commerce
58
For footnoted information, refer to slide 104
We are applying our consistent playbook to expand beyond Travel to win in Shopping and Dining
Where we are on our strategy
Identify high value experiences
that resonate with card members
Our strategy will migrate category spend to our platforms – driving >$30B in volume and ~$2B in revenue in 2025
Acquire capabilities to create
differentiated on-us journeys and
own the economics
1 3
Accelerate engagement in
existing channels and products
with benefits, rewards, and content
2
Key success metrics1
Addressable spend
Travel
Reaching new customers through
premium servicing and content in Chase Travel
sales volume3
~$8B
Chase Travel visits
~40mm
Category spend on
Chase cards2
>$140B
Shopping
Integrating our platform and data to enable
better targeting and personalization in attribution spend
volume5
>$6B
Offers served to
customers4
>9B
Category spend on
Chase cards2
>$470B
Dining
Expanding access to curated content and
experiences to accelerate engagement Unique monthly
visitors7
>5mm
Venues covered6
>25k
Category spend on
Chase cards2
>$90B
Journey
Make Chase the best platform to
book travel, explore shopping, and
discover new dining experiences
HOW WE’RE APPLYING OUR PLAYBOOK:
OUR COMMERCE PLAYBOOK:
Consumer Banking Branch Network Business Banking Card & Connected Commerce
59
For footnoted information, refer to slide 105
Payments and lending innovation are core enablers of our Connected Commerce strategy
>$5.6T
Payments volume1
Installments at POS
Card-linked installments
>27B
Payment transactions1
2022 HIGHLIGHTS
Pay in 4 Paze
Card-based Pay-over-time solutions Checkout
Credit and debit
Highly engaged payments4 customers have higher average NPS and higher likelihood to have multi-LOB relationships
>67mm
Payments active
customers2
>25mm
Customers transacting >1
times a day
>$1.5T
Credit and debit spend
volume
Live today Live today Launching soon Launching soon3
My Chase Plan originations
scaled 3x faster than BNPL
competitor outflows YoY
SM
Consumer Banking Branch Network Business Banking Card & Connected Commerce
$260.42 $130.21 $86.81
60
For footnoted information, refer to slide 106
We are investing in critical capabilities and experiences to better serve customers across all segments
“Best hotel co-brand
credit card”
– The Points Guy1
“Best hotel travel
card”
– CNN7
“Best cash-back
credit card”
– CNBC Select6
“Best airline
credit card”
– Forbes Advisor5
“Best overall
business card”
– CNET3
70 NPS
On our path to achieving
NPS for select segments, 2022
Usage of machine learning to understand drivers of dissatisfaction
Investments in servicing innovation (e.g., dispute tools, chatbots)
Value of NPS: satisfied customers spend >30% more and attrite ~2x less8
Customer complaints, 2019-2022
“Best card for small
businesses”
– Money.com2
“Best travel rewards
credit card”
– The Points Guy1
“Best premium card
for travel and dining”
– Business Insider4
WE ARE BEING RECOGNIZED FOR THE WORK WE ARE DOING… …AND ARE TAKING ACTION TO BUILD UPON THIS MOMENTUM
Reduction in customer complaints
19%
+3 NPS
for Mass
vs. 2021
+1 NPS
for SMB
vs. 2021
+2 NPS
for Affluent
vs. 2021
Consumer Banking Branch Network Business Banking Card & Connected Commerce
61
For footnoted information, refer to slide 107
Consumer
Bank
Corporate &
Investment
Bank
~25%
of Chase Offers merchants
sourced through our B2B
franchises in 20222
>45%
of Branded Card members
are also Consumer Banking
customers1
~40%
of SMB Card members
have a Business Banking
relationship
~17ppts
higher Card approval rate
when customer has a
deposit account
Being part of the JPMC ecosystem broadens our scale and distribution
Card
Card contributed ~50% of new CCB customers in 2022 – providing a significant deepening opportunity to the franchise1
Consumer Banking Branch Network Business Banking Card & Connected Commerce
Business
Bank
62
1 Excludes small business customers
2 Reflects offers sourced through J.P. Morgan Payments and Business Banking
63
Our competitive advantages will enable sustained outperformance for decades to come
Forward-looking guidance of 25%+ ROE through the cycle
The scale of our
customer relationships is
the catalyst for everything
We operate with
excellence and execute
with discipline
We run this franchise for
the long term, with
unmatched capacity
to invest
The strength and
diversification of our
businesses create
resilience of returns
The Power of the CCB Franchise
64
65
Expert advice
and guidance
Premium
service
Value for
relationship
Elevated service and seamless experiences
⚫ Cross-product priority servicing experience
⚫ Higher limits and enhanced authorizations
⚫ Proactive client servicing
Easy access to a team of experts
⚫ Banker or advisor as a relationship quarterback
⚫ Financial planning, investment, and borrowing advice
⚫ Expanded banker and advisor capacity
Access to our best products and benefits
⚫ Expanded banking and investment services
⚫ Relationship-based pricing across products
⚫ Exclusive lifestyle benefits
First Republic provides capabilities to accelerate our existing affluent strategy
First Republic model CCB affluent strategy
High-touch servicing model
with industry-leading NPS and high client
and employee retention
Team of experts
to serve affluent client needs with a primary
relationship quarterback
Relationship-based lending
to acquire and deepen affluent relationships
Single family Multi-family CRE C&I Capital Call
RMs Business Bankers Preferred Bankers Wealth Managers
Preferred Banking Preferred Banking Offices Wealth
Lending
66
First Republic value to Chase
Deepening opportunity
serving affluent client
lending needs
High quality loan
portfolio
strong LTVs, high FICO
scores
Relationship manager-
led acquisition
to drive firm value beyond
lending
First Republic has a unique operating model and strong loan portfolio
First Republic Portfolio Risk Metrics1
Avg. CLTV
59%
Avg. FICO
774
Avg. Debt-to-
Income
30%
% CA or NY
77%
Avg. Balance
Outstandings3
~$1.1mm
Loan Portfolio2
~$100B
1 First Republic residential loan portfolio; funded loans only; CLTV and DTI reported as of time of origination
2 Prior to fair value marks
3 Average mortgage balance outstanding reflects unpaid principal balance
67
We provide advice across the wealth continuum and continue to grow our channels
Global
Private Bank
Advice-driven platform across
wealth, lending, and banking
Target client:
HNW / UHNW
Private Client Advisors
4,500+
Client investment assets
~$410B
Advisors
450+
Client investment assets
~$190B
Personal
Advisors
Lower-cost
remote advice
Target client:
Mass Affluent
Full-Service Wealth Management
Chase Wealth Management J.P. Morgan Advisors
CCB AWM
Target client: Affluent Target client: Affluent / HNW1 / UHNW2
Added 300+ Advisors in 2022
and on-track to scale
to 6k by 2025
✓ Launched Personal Advisors
to offer lower cost
advice (4Q22)
✓ Rolled out Wealth Plan
to Chase clients and
advisors (4Q22)
✓
Wealth Management Advised Channels
Added ~400 Client Advisors
and on-track to scale
to 4k by 2025
✓
We have invested to strengthen and scale our advised channels
1 High net-worth
2 Ultra high net-worth
68
First Republic Private Wealth Management adds scale to our office-based model
Global
Private Bank
Advice-driven platform across
wealth, lending, and banking
Target client:
HNW / UHNW
Private Client Advisors
4,500+
Client investment assets
~$410B
Advisors
450+
Client investment assets
~$190B
Personal
Advisors
Lower-cost
remote advice
Target client:
Mass Affluent
Full-Service Wealth Management
Chase Wealth Management J.P. Morgan Advisors
CCB AWM
Target client: Affluent
Wealth Management Advised Channels
First Republic Private Wealth
Management
Private Wealth Advisors
~200
Client investment assets
~$200B
Target client: Affluent / HNW1 / UHNW2
1 High net-worth
2 Ultra high net-worth
69
First Republic branches will support our affluent branch segmentation strategy
Formats
Emerging segments Affluent segments
Community Center
(in market)
Private Client Center
(under development)
First Republic
Preferred Banking Offices
Premium locations including SF, NYC, Boston
covering 50% of JPM WM balances
Roles
Community Centers to build trust locally and
promote financial health in underserved communities
Private Client Centers to build wealth brand and
provide exclusive spaces to engage with an
integrated team of experts
Preferred Bankers manage relationships and
provide service
Adapt proven integrated model with dedicated
Community Manager, Small Business Consultant,
and Community Home Lending Advisor roles
Deploy a senior team of experts with Private Client
Bankers & Advisors, Business Relationship
Managers, and Home Lending Advisors
Engagement High-touch servicing model with industry-
leading experience
Tailored local objectives and engagement
methods to meet the distinct needs of underserved
communities
Serve clients across banking, lending and wealth
and curate financial planning and wealth-focused
experiences
Chase Branch Segmentation Strategy
70
71
Notes on non-GAAP financial measures
1. Adjusted expense excludes CCB legal expense and is a non-GAAP financial measure. For 2021, reported noninterest expense was $29,028 million and legal losses
were $55 million; for 2022, reported noninterest expense was $31,208 million and legal losses were $47 million. Management believes this information helps investors
understand the effect of certain items on reported results and provides an alternate presentation of the Firm’s performance
2. Income before income tax expense (pretax income) excluding the change in loan loss reserves (“pretax income ex. LLR”) and return on equity excluding the change in
loan loss reserves (“ROE ex. LLR”) are non-GAAP financial measures. These metrics reflect the exclusion of the portion of the provision for credit losses attributable
to the change in allowance for credit losses. ROE ex. LLR is calculated as net income excluding LLR divided by average common stockholders’ equity. For CCB
average common stockholders’ equity for the full years 2022, 2021 and 2020, refer to page 65 of JPMorgan Chase’s Annual Report on Form 10-K for the year ended
December 31, 2022. For all other periods presented, refer to the CCB Business Segment Results in JPMorgan Chase’s Annual Report on Form 10-K for each
respective year. The table below provides a reconciliation of reported results to these non-GAAP financial measures
Year ended December 31,
(in millions, except ROE) 2012 2013 2014 2015 2016 2017 2018 2019 2020 2021 2022
(1) Pretax income Reported pretax income 17,236 17,808 14,689 15,472 15,053 14,637 19,399 21,950 11,034 27,840 19,793
Adjustments:
Change in loan loss reserves (5,506) (5,490) (1,253) (1,023) 150 320 42 (299) 7,809 (9,750) 1,125
Pretax income ex. LLR 11,730 12,318 13,437 14,449 15,203 14,957 19,441 21,651 18,843 18,090 20,918
(2) Net income Reported net income 10,522 10,715 8,840 9,546 9,418 9,254 14,744 16,575 8,268 20,957 14,916
Adjustments:
Change in loan loss reserves (3,337) (3,300) (742) (632) 93 207 32 (226) 5,843 (7,356) 879
Net income ex. LLR 7,185 7,415 8,098 8,914 9,511 9,462 14,776 16,350 14,111 13,601 15,795
(3) ROE Reported ROE 24% 23% 17% 18% 17% 17% 28% 31% 15% 41% 29%
ROE ex. LLR 16% 15% 15% 17% 18% 18% 28% 31% 26% 26% 31%
72
Notes on slide 3
1. See slide 72
2. Federal Deposit Insurance Corporation (“FDIC”) 2022 Summary of Deposits survey per S&P Global Market Intelligence. Applies a $1B deposit cap to Chase and
industry branches. Includes all commercial banks, savings banks, and savings institutions as defined by the FDIC. Prior periods have been revised to conform to the
current period presentation
3. Based on 2022 sales volume and loans outstanding public disclosures by peers (C, BAC, COF, AXP, DFS) and JPMorgan Chase estimates. Sales volume excludes
private label and Commercial Card. Loans outstanding exclude private label, AXP Charge Card, and Citi Retail Cards
73
Notes on slide 4
1. Businesses and legal entities with decision making rights
2. Federal Deposit Insurance Corporation (“FDIC”) 2022 Summary of Deposits survey per S&P Global Market Intelligence. Applies a $1B deposit cap to Chase and
industry branches. Includes all commercial banks, savings banks, and savings institutions as defined by the FDIC. Prior periods have been revised to conform to the
current period presentation
3. Barlow Research Associates, Primary Bank Market Share Database as of 4Q22. Rolling 8-quarter average of small businesses with revenue of more than $100,000
and less than $25 million
4. Based on 2022 sales volume and loans outstanding public disclosures by peers (C, BAC, COF, AXP, DFS) and JPMorgan Chase estimates. Sales volume excludes
private label and Commercial Card. Loans outstanding exclude private label, AXP Charge Card, and Citi Retail Cards
5. Refers to customers with two or more relationships within the following sub-LOBs: Consumer Banking, Business Banking, Wealth Management, Credit Card, Home
Lending, and Auto
74
Notes on slide 5
1. #1 in active users among digital banking mobile apps based on Data.ai and #1 most-visited banking portal in the U.S. (Chase.com) based on Similarweb
2. 2022 Chase branch network coverage by state. Federal Deposit Insurance Corporation (“FDIC”) 2022 Summary of Deposits survey per S&P Global Market
Intelligence. Includes all commercial banks, savings banks and savings institutions as defined by the FDIC. Prior periods have been revised to conform to the current
period presentation. Numbers do not foot to Form 10-K as FDIC represents branch counts as of June 30th, 2022
3. As of 4Q22. Users of all web and/or mobile platforms who have logged in within the past 90 days
4. Total logins on mobile and web platforms in FY 2022
5. In 2022, we achieved record high satisfaction in our branch and digital channels, determined by overall satisfaction and measured on a scale of 1 to 10. The score is
calculated as the share of “9” and “10” responses as a percent of total responses. Digital channel includes a weighted average of monthly active users of Chase.com
and the Chase Mobile app
75
Notes on slide 6
1. J.P. Morgan Wealth Management referenced in Form 10-K
2. Unique families with primary and joint account owners for open and funded accounts
3. Represents first-time investors with full-service relationships through Chase Wealth Management
4. Includes Chase Travel volumes, cxLoyalty non-Chase clients, and Frosch
5. Refers to customers associated with Business Banking line of business as referenced in Form 10-K
76
Notes on slide 7
1. Masterbrand Brand Health survey data from 1Q23. N = 3,681 completed surveys from random U.S. consumer sample (age 18+, financial decision makers for the
household, lower 48 states), fielded between 1/6/2023 and 3/30/2023. Consideration measured through % of respondents selecting “Probably would consider”,
“Definitely would consider” for question: “Please think about financial service companies in general. The next time you are in the market for a financial product or
service, how likely are you to consider the following providers?”
2. Consumer Banking: Federal Deposit Insurance Corporation (“FDIC”) 2022 Summary of Deposits survey per S&P Global Market Intelligence. Applies a $1B deposit
cap to Chase and industry branches. Includes all commercial banks, savings banks, and savings institutions as defined by the FDIC. Prior periods have been revised
to conform to the current period presentation. Business Banking: Barlow Research Associates, Primary Bank Market Share Database as of 4Q22. Rolling 8-quarter
average of small businesses with revenue of more than $100,000 and less than $25 million. Card: Based on 2022 sales volume and loans outstanding public
disclosures by peers (C, BAC, COF, AXP, DFS) and JPMorgan Chase estimates. Sales volume excludes private label and Commercial Card. Loans outstanding
exclude private label, AXP Charge Card, and Citi Retail Cards
3. Wealth: #1 outflow destination for Chase customers. Merchant: #1 payment provider for BB clients. Based on settlement $ volume (inflows into BB accounts from
merchant servicing providers), not by client count. Data is most recent available, from Feb 1 – Apr 20. Mortgage: Chase clients are defined as having a deposit
relationship or mortgage; based on Chase internal data and CoreLogic data
4. Retail mortgage originations in Home Lending
5. Excludes Commercial Term Lending clients
77
Notes on slide 8
1. See slide 72
2. In the first quarter of 2023, the allocations of revenue and expense to CCB associated with a Merchant Services revenue sharing agreement were discontinued and
are now retained in Payments in CIB. Prior-period amounts have been revised to conform with the current presentation
3. Banking & Wealth Management
78
Notes on slide 11
1. Totals may not sum due to rounding. End of period balances for 1Q22 and 1Q23
2. 1Q22 to 1Q23 customer growth represents balances from new Banking and Wealth Management customers
3. Migration of flows out of checking and savings accounts
4. Net flows for external brokerages, online banks, JPMWM investments. Gross flows for internal migration
5. For Consumer Banking customers who outflow regularly. A customer is considered primary bank if it meets one of the following conditions: ≥15 withdrawals from a
checking account or ≥5 withdrawals from a checking account and ≥$500 of inflows in a given month
6. Migration of flows into checking and savings accounts
7. % of internal yield seeking inflows (incl. JPMWM flows and internal migration) of total yield seeking outflows (incl. JPMWM flows, internal migration, external
brokerages, online banks)
79
Notes on slide 12
1. Totals may not sum due to rounding
2. In the first quarter of 2023, the allocations of revenue and expense to CCB associated with a Merchant Services revenue sharing agreement were discontinued and are
now retained in Payments in CIB. Prior-period amounts have been revised to conform with the current presentation
3. Adjusted to exclude legal expense. See slide 72
80
Notes on slide 13
1. Adjusted expense excludes CCB investments and legal expense and is a non-GAAP financial measure. For 2021, reported noninterest expense was $29.0 billion,
CCB investments were $5.2 billion and legal losses were $55 million; for 2022, reported noninterest expense was $31.2 billion, CCB investments were $7.1 billion
and legal losses were $47 million, respectively. Management believes this information helps investors understand the effect of certain items on reported results and
provides an alternate presentation of the Firm’s performance
2. In the first quarter of 2023, the allocations of revenue and expense to CCB associated with a Merchant Services revenue sharing agreement were discontinued and
are now retained in Payments in CIB. Prior-period amounts have been revised to conform with the current presentation
3. Includes total calls to Consumer Banking, Business Banking, Auto and Card client servicing divided by all Chase consumers and small businesses
4. Includes total check, debit, digital and credit payment / money movement volumes
5. Net operating losses divided by total transaction volume
6. Includes Consumer Banking customers and Business Banking small businesses per branch. Numerator and denominator exclude new builds and market expansion
captured as investments and zero-balance accounts. Reflects 2019-2022 only
7. Tenured Chase Wealth Management & J.P. Morgan Advisors
8. Average annualized deposit sales for branches >5 years old; reflects 2019-2022 only
81
Notes on slide 14
1. Totals may not sum due to rounding
2. Includes Connected Commerce acquisitions of cxLoyalty, FROSCH, The Infatuation, and Figg
3. Gross cash marketing spend represents total outlays in a calendar year, which includes expenses and contra revenues. Contra-revenue may be amortized and not all
recognized in the year the outlay was made
4. Refers to tech product development investment spend, excludes regulatory and controls spend
82
Notes on slide 16
1. Tracks cohort of primary bank customers from March 2020 – March 2023. At time of start in March 2020, cohort includes all primary bank customers, with at least one
year of consumer checking tenure, and greater than $6k of take-home income (payroll, government assistance, unemployment benefits, tax refunds, social security,
and retirement) within last twelve months
2. Represents customers within the cohort who had greater than $6k but less than $30k of take-home income within last twelve months of March 2020
3. Average Daily Balance divided by the total outflow in the month, multiplied by 30 to express in number of days. Includes all the checking and savings (ex. CDs) Chase
accounts that are owned or jointly owned by the customer. Customers without outflow in the month are excluded
4. Source: Bureau of Labor Statistics (CPIU)
5. Tracks income growth for cohort defined in Note 1 above from January 2020 – March 2023, requiring greater than $6k of take-home income (payroll, government
assistance, unemployment benefits, tax refunds, social security, and retirement) within last twelve months of Jan 2020. Additionally, take home income must be greater
than $0 within last twelve months throughout the measurement period
6. Represents customers within the cohort who had greater than $6k but less than $30k of take-home income within last twelve months of January 2020. Additionally,
take home income must be greater than $0 within last twelve months throughout the measurement period
83
Notes on slide 17
1. Based on time frames used in data which differs from time frames Form 10-K
2. Tracks Credit Card customers with 18+ months on book as of January 2019 that are still spend active in March 2023. Lowest income defined as gross income (self
reported) of <$50k
3. Refers to 4Q19 and 1Q23 period-end Card Services loans reported in quarterly earnings supplements
4. Tracks Credit Card accounts that are open in January 2020 and still open in April 2023
5. Percentage change in the number of accounts within the stable cohort holding a revolving balance between January 2020 and April 2023
84
Notes on slide 19
1. Represents refreshed FICO scores
2. Customers who revolve but are not spend active
3. Chase Auto excludes Wholesale (DCS) & Lease
4. Calculated using refreshed Vantage score sourced from Experian
5. Represents FICO scores and LTV at time of origination
6. Includes AWM and Corporate mortgage loans
7. Sourced from Experian
8. Sourced from Lender Share. Data is obtained from market shares relative to lenders participating in Curinos’ retail and correspondent channel origination analytics.
Curinos is not liable for reliance on the data
85
Notes on slide 22
1. As of December 31, 2022
2. CLTV defined as Combined Loan to Value
3. 2010 30+ delinquency rate revised from 10-K to include the impact of Purchased Credit Impaired (PCI) loans to conform to current disclosures
4. HPI defined as Home Price Index
5. All data in HPI forecast chart with exclusion of % originations data sourced from Moody’s Case-Shiller as of April 2023
6. % Held For Investment (HFI) 2022 is Internal Chase Data
86
Notes on slide 24
1. In 2020 Merchant Services along with the associated assets, liabilities, revenue, expenses and headcount were realigned to CIB from CCB and CB. Prior-period
amounts have been revised to conform with the current presentation
2. Certain wealth management clients were realigned from Asset & Wealth Management to Consumer & Community Banking in the fourth quarter of 2020; amounts in
periods prior to 2016, other than client balances, were not revised in connection with the realignment
3. In the first quarter of 2023, the allocations of revenue and expense to CCB associated with a Merchant Services revenue sharing agreement were discontinued and are
now retained in Payments in CIB. Prior-period amounts have been revised to conform with the current presentation
4. See slide 72
5. CCB ROE (ex. LLR) pre 2018 impacted by higher corporate tax rate
6. Board of Governors of the Federal Reserve System, Federal Funds Effective Rate, retrieved from FRED, Federal Reserve Bank of St. Louis
7. Reflects sum of average deposits, average loans, and end of period client investment assets, including the revision referenced in note 2 on this page
8. Federal Deposit Insurance Corporation (“FDIC”) 2022 Summary of Deposits survey per S&P Global Market Intelligence. Applies a $1B deposit cap to Chase and
industry branches for market share. Includes all commercial banks, savings banks, and savings institutions as defined by the FDIC. Prior periods have been revised to
conform to the current period presentation
9. Represents general purpose credit card spend, which excludes private label and Commercial Card. Based on company filings and JPMorgan Chase estimates
10.Barlow Research Associates, Primary Bank Market Share Database. Rolling 8-quarter average of small businesses with revenue of more than $100,000 and less than
$25 million
87
Notes on slide 26
1. Federal Deposit Insurance Corporation (“FDIC”) 2022 Summary of Deposits survey per S&P Global Market Intelligence. Applies a $1B deposit cap to Chase and
industry branches. Includes all commercial banks, savings banks, and savings institutions as defined by the FDIC. Prior periods have been revised to conform to the
current period presentation
2. “Consumer Banking customer” reflects unique individuals that have financial ownership or decision making power with respect to Consumer Banking accounts
3. Refers to primary bank customers with two or more relationships within the following sub-LOBs: Consumer Banking, Business Banking, Wealth Management, Credit
Card, Home Lending, and Auto Lending
4. Federal Deposit Insurance Corporation (“FDIC”) 2022 Summary of Deposits survey per S&P Global Market Intelligence. Top 50 markets were defined based on
industry deposit balances after applying a $1B deposit cap to each branch. Includes all commercial banks, savings banks, and savings institutions as defined by the
FDIC. Prior periods have been revised to conform to the current period presentation. Chase has branch presence in 47 of the top 50 markets; the three markets
without branches are San Juan, Virginia Beach, and Urban Honolulu
5. Deposit and investment balances associated with accounts where the primary owner visited a branch >4 times in 2022
88
Notes on slide 28
1. Federal Deposit Insurance Corporation (“FDIC”) 2022 Summary of Deposits survey per S&P Global Market Intelligence. Applies a $1B deposit exclusion to Chase
and industry branches. Includes all commercial banks, savings banks, and savings institutions as defined by the FDIC. Prior periods have been revised to conform to
the current period presentation
2. Federal Deposit Insurance Corporation (“FDIC”) 2022 Summary of Deposits survey per S&P Global Market Intelligence. Applies a $1B deposit cap to Chase and
industry branches. Includes all commercial banks, savings banks, and savings institutions as defined by the FDIC. Prior periods have been revised to conform to the
current period presentation. Large banks consist of institutions with >$100B in retail deposits
3. Federal Deposit Insurance Corporation (“FDIC”) 2022 Summary of Deposits survey per S&P Global Market Intelligence. Applies a $1B deposit cap to Chase and
industry branches. Includes all commercial banks, savings banks, and savings institutions as defined by the FDIC. Prior periods have been revised to conform to the
current period presentation
4. In 2022 and 1Q23, Chase ranked #1 in retail deposit share based on industry methodologies using Federal Deposit Insurance Corporation (“FDIC”) 2022 Summary of
Deposits survey and EOP deposits for BWM-equivalent businesses. For example, estimating retail deposits performance by applying a $1B cap on FDIC deposits –
$1,094B (Chase), $1,027B (Peer 1), $979B (Peer 2); uncapped methodology – $2,129B (Chase), $1,964B (Peer 1), $1,458B (Peer 2); EOP earnings (national retail
deposits in Banking and Wealth Management) disclosures – 2Q22 earnings: $1,179B (Chase), $1,077B (Peer 1), $892B (Peer 2); 1Q23 earnings: $1,147B (Chase),
$1,045B (Peer 1), $851B (Peer 2)
89
Notes on slide 29
1. A customer is considered primary bank if it meets one of the following conditions: ≥15 withdrawals from a checking account or ≥5 withdrawals from a checking
account and ≥$500 of inflows in a given month
2. Source: One Chase Net Promoter Score (NPS) Survey. Reflects promoters, calculated as share of “9” and “10” responses as a % of total responses
3. Refers to customer satisfaction across all Consumer Banking accountholders
4. Reflects FY 2022 retention for checking customers with a tenure of ≥ 6 months
5. Refers to primary bank customers with two or more relationships within the following sub-LOBs: Consumer Banking, Business Banking, Wealth Management, Credit
Card, Home Lending, and Auto Lending
6. Deposit and investment balances associated with accounts where the primary owner visited a branch >4 times in 2022
7. Percent of Consumer Banking users of all mobile platforms who have logged in within the past 90 days, as of 4Q22
90
Notes on slide 30
1. Inclusive of payments made from all Consumer Banking accounts; payments defined as debits, excluding internal transfers
2. Reflects number of Consumer and Business Banking accounts with a Zelle inflow or outflow in FY 2022
3. Average number of monthly debit transactions during 4Q22 of Consumer Banking checking customers that completed at least one debit card payment during this 90-
day period
4. Percent of Consumer Banking users of all mobile platforms who have logged in within the past 90 days, as of 4Q19 and 4Q22
5. Percent of mobile-active Consumer Banking users who engaged with a financial health tool in 4Q22
6. Total Consumer Banking user logins on mobile and web platforms in FY 2022
91
Notes on slide 32
1. Includes Chase First Banking, Chase High School Checking, Chase College Checking, and Chase Secure Banking
2. Includes Chase Total Checking, Chase Premier Checking, and Chase Sapphire Banking
3. Based on Chase Private Client households
4. Account distribution is based on YE 2022
92
Notes on slide 34
1. Federal Deposit Insurance Corporation (“FDIC”) 2022 Summary of Deposits survey per S&P Global Market Intelligence. Includes all commercial banks, savings
banks and savings institutions as defined by the FDIC. Prior periods have been revised to conform to the current period presentation. Numbers do not foot to Form
10-K as FDIC represents branch counts as of June 30th, 2022
2. Federal Deposit Insurance Corporation (“FDIC”) 2022 Summary of Deposits survey per S&P Global Market Intelligence. Applies a $1B deposit cap to Chase and
industry branches. Includes all commercial banks, savings banks, and savings institutions as defined by the FDIC. Prior periods have been revised to conform to the
current period presentation. Large banks consist of institutions with >$100B in retail deposits
3. Represents large banks’ deposit per branch in 2022
4. Calculated using 2022 FDIC data. Federal Deposit Insurance Corporation (“FDIC”) 2022 Summary of Deposits survey per S&P Global Market Intelligence. Includes
all commercial banks, savings banks and savings institutions as defined by the FDIC. Prior periods have been revised to conform to the current period presentation
5. Calculated using 2017 FDIC data. Federal Deposit Insurance Corporation (“FDIC”) 2022 Summary of Deposits survey per S&P Global Market Intelligence. Includes
all commercial banks, savings banks and savings institutions as defined by the FDIC. Prior periods have been revised to conform to the current period presentation
6. Federal Deposit Insurance Corporation (“FDIC”) 2022 Summary of Deposits survey per S&P Global Market Intelligence. Applies a $1B deposit cap to Chase and
industry branches. Includes all commercial banks, savings banks, and savings institutions as defined by the FDIC. Prior periods have been revised to conform to the
current period presentation
7. Includes Consumer Banking customers and Business Banking small businesses per branch. Numerator and denominator exclude new builds and market expansion
captured as investments and zero-balance accounts. Reflects 2019-2022 only
93
Notes on slide 35
1. Federal Deposit Insurance Corporation (“FDIC”) 2022 Summary of Deposits survey per S&P Global Market Intelligence. Includes all commercial banks, savings
banks and savings institutions as defined by the FDIC. Prior periods have been revised to conform to the current period presentation
2. Federal Deposit Insurance Corporation (“FDIC”) 2022 Summary of Deposits survey per S&P Global Market Intelligence. Applies a $1B deposit cap to Chase and
industry branches. Includes all commercial banks, savings banks, and savings institutions as defined by the FDIC. Prior periods have been revised to conform to the
current period presentation. Large banks consist of institutions with >$100B in retail deposits
3. Federal Deposit Insurance Corporation (“FDIC”) 2022 Summary of Deposits survey per S&P Global Market Intelligence. Applies a $1B deposit cap to Chase and
industry branches. Includes all commercial banks, savings banks, and savings institutions as defined by the FDIC. Prior periods have been revised to conform to the
current period presentation
4. Break-even defined as the first month of two consecutive months of a branch generating positive pre-tax profit
5. Federal Deposit Insurance Corporation (“FDIC”) 2022 Summary of Deposits survey per S&P Global Market Intelligence. Applies a $1B deposit cap to Chase and
industry branches. Includes all commercial banks, savings banks, and savings institutions as defined by the FDIC. Prior periods have been revised to conform to the
current period presentation. Represents the sum of the delta between deposits per branch for mature branches (10+ years, $259mm) and non-mature branches (0-5
years, $79mm; 5-10 years, $154mm) multiplied by the number of branches within that age cohort (0-5 years = 711; 5-10 years = 294)
6. Federal Deposit Insurance Corporation (“FDIC”) 2022 Summary of Deposits survey per S&P Global Market Intelligence. Top 50 markets were defined based on
industry deposit balances after applying a $1B deposit cap to each branch. Includes all commercial banks, savings banks, and savings institutions as defined by the
FDIC. Prior periods have been revised to conform to the current period presentation
94
Notes on slide 36
1. Federal Deposit Insurance Corporation (“FDIC”) 2022 Summary of Deposits survey per S&P Global Market Intelligence. Applies a $1B deposit cap to Chase and
industry branches. Includes all commercial banks, savings banks, and savings institutions as defined by the FDIC. Prior periods have been revised to conform to the
current period presentation
2. Federal Deposit Insurance Corporation (“FDIC”) 2022 Summary of Deposits survey per S&P Global Market Intelligence. Includes all commercial banks, savings
banks and savings institutions as defined by the FDIC. Prior periods have been revised to conform to the current period presentation
3. Excludes trust office
4. Reflects internal new build counts for licensed branch locations opened between calendar year 2012 through calendar year 2022 within the respective CBSAs. Does
not include relocations
95
Notes on slide 37
1. Teller transactions
2. Reflects deposit and investment balances, with engagement channel segments defined based on the level of interaction with branch and digital channels for primary
owners of Consumer Banking accounts. Branch-centric are accountholders who have >4 branch visits per year. Digitally-centric is 12+ digital transactions, 100+
logins, 24+ ACH payments. If both criteria are applicable, then accountholders are multi-channel
3. Tenured bankers. NPV normalized for margins across years
96
Notes on slide 39
1. Federal Deposit Insurance Corporation (“FDIC”) 2022 Summary of Deposits survey per S&P Global Market Intelligence. Includes all commercial banks, savings
banks and savings institutions as defined by the FDIC. Prior periods have been revised to conform to the current period presentation. Numbers do not foot to Form
10-K as FDIC represents branch counts as of June 30th, 2022
2. Grey represents states with zero branch share
3. Coverage defined as one or more branches in a CBSA using U.S. Census Population Data. Based on 2017 estimates for 2017 metrics and 2022 estimates for all
other time periods
4. Drive times and population are derived from ESRI Business Analyst using 2017, 2021, and forward-looking population metrics; drive times are derived from 2021
street network vintage for 2017, 2022, and forward-looking time periods. Branch network is as of YE 2017 and YE 2022
5. Small business coverage by CBSA based on Dun and Bradstreet Small Business locations. Small business defined as <$20mm in annual revenue
6. Federal Deposit Insurance Corporation (“FDIC”) 2022 Summary of Deposits survey per S&P Global Market Intelligence. Applies a $1B deposit cap to Chase and
industry branches. Includes all commercial banks, savings banks, and savings institutions as defined by the FDIC. Prior periods have been revised to conform to the
current period presentation. Addressable deposits represent the sum of all industry deposits in a given CBSA where Chase has at least one branch
97
Notes on slide 49
1. Source: U.S. Census – Business and Industry Time Series, Monthly Business Formation Statistics; not seasonally adjusted; average of FY2022 and 1Q2023
2. Primary bank market share sourced from Barlow Research Associates as of 4Q22. Rolling 8-quarter average of small businesses with sales size between $100k-
$25mm
3. Total meetings in FY2022 between Business Banking clients and either remote or in-person Business Relationship Managers
4. Small business coverage by CBSA based on Dun and Bradstreet Small Business locations. Small business defined as <$20mm in annual sales size
98
Notes on slide 51
1. Based on 2022 sales volume and loans outstanding public disclosures by peers (C, BAC, COF, AXP, DFS) and JPMorgan Chase estimates. Sales volume excludes
private label and Commercial Card. Loans outstanding exclude private label, AXP Charge Card, and Citi Retail Cards
2. Defined as average sales debit active accounts
3. Includes amortization of account origination costs
4. Risk-adjusted revenue, pretax income ex. LLR and ROE ex. LLR are all non-GAAP financial measures. Risk-adjusted revenue is revenue excluding net charge-offs of
$2.4B, $2.7B and $4.8B for the years ended December 31, 2022, December 31, 2021 and December 31, 2019, respectively. Pretax income ex. LLR and ROE ex.
LLR represents pretax income and ROE excluding credit loss reserves of $1.0B, $(7.6)B and $0.5B for the years ended December 31, 2022, December 31, 2021 and
December 31, 2019, respectively. Management believes this information helps investors understand the effect of these items on reported results and provides an
alternate presentation of the Firm’s performance.
99
Notes on slide 53
1. Based on 2022 co-brand portfolio sales volumes
2. Fee-based card demand applies to Branded consumer cards only; Millennials defined as 27-42 and Gen Z as 11-26 year-olds
3. Based on 2017-2022 sales volume and average loans outstanding public disclosures by peers (C, BAC, COF, AXP, DFS) and JPMorgan Chase estimates. Sales
volume excludes private label and Commercial Card. Loans outstanding exclude private label, AXP Charge Card, and Citi Retail
100
Notes on slide 54
1. Based on Chase and Census data
2. According to Bright Query, April 2023
3. Based on Personal Demographics Detail dataset, published by Axiom, December 2022
101
Notes on slide 55
1. Gross cash marketing spend represents total outlays in a calendar year, which includes expenses and contra revenues. Contra-revenue may be amortized and not all
recognized in the year the outlay was made
2. Reflects expected performance of 2022 vintage in Year 5
3. Defined as Net Present Value (NPV) of the vintage; NPV defined as the post-tax lifetime value of all incremental cash flows for the investment, including upfront
investment costs and all other variable revenues and costs resulting, discounted at the cost of equity
102
Notes on slide 57
1. Total payments transaction volume includes debit and credit card sales volume and gross outflows of ACH, ATM, teller, wires, BillPay, PayChase, Zelle, person-to-
person and checks
2. Users of all web and/or mobile platforms who have logged in within the past 90 days
3. #1 most-visited banking website in the U.S. (Chase.com) based on Similarweb
103
Notes on slide 58
1. Based on Travel Weekly Power List 2022, which disclosed 2021 sales volumes; Chase Travel and cxLoyalty 2021 sales volumes were not publicly disclosed on the
Power List; corporate/managed travel providers excluded for purposes of JPMC estimates
2. Represents Chase Ultimate Rewards booking volume
3. Includes Chase Travel volumes, cxLoyalty partner clients, and FROSCH; 2019 includes only Chase Ultimate Rewards
104
Notes on slide 59
1. Reflects 2022 actuals, unless otherwise noted
2. Shopping reflects credit and debit spend; Travel and Dining reflect credit spend only
3. Includes Chase Travel volumes, cxLoyalty partner clients, and FROSCH
4. Number of unique offers viewed by a customer for the first time during a campaign
5. Attribution spend is defined as spend on our cards at Chase Offers merchants once the offer is served and during the offer window (the average offer window is 45
days)
6. Reflects the number of individual geographic business locations featured on The Infatuation website and app (as of April 30, 2023)
7. Reflects the average number of user device identifications to visit The Infatuation website and app within a month (April 2023 LTM)
105
Notes on slide 60
1. Total payments transaction volume includes debit and credit card sales volume and gross outflows of ACH, ATM, teller, wires, BillPay, PayChase, Zelle, person-to-
person and checks
2. Payments active defined as customers who completed >1 payments outflow across any method of payment in 2022
3. Paze screen reflects a contemplated design; subject to change
4. Defined as consumer deposit customers and credit card-only customers who performed >30 payment transactions in a month across all digital, non-digital, and card-
based methods of payments on average in 2022; excludes business banking customers
106
Notes on slide 61
1. The Points Guy Awards, 2022
2. Money.com, March 2023
3. CNET, May 2023
4. Business Insider, May 2023
5. Forbes Advisor, May 2023
6. CNBC Select, May 2023
7. CNN Underscored, May 2023
8. For Net Promoter Score promoters compared to detractors
107
CIB maintained its #1 rank, and our strategy continues to strengthen our business
$48.1B
Revenue
10.0%
Market share
#1
Rank
CIB
$4.5B
Revenue
10.5%
Market share
#3
Rank
Securities
Services
$7.6B
CIB Revenue
$13.9B J.P. Morgan Payments Revenue
8.4%
Market share
#1
Rank
$29.0B
Revenue
11.6%
Market share
#1
Rank
$6.9B
IB Fees
7.9%
Market share
#1
Rank
Markets Payments
Investment
Banking
Complete Diversified At Scale
Global
(based on J.P. Morgan Treasury Services)
2022 CIB OVERVIEW1,2,3
Key strategic pillars
1
Note: J.P. Morgan Payments and Firmwide Payments revenue and expense throughout the CIB presentation predominantly includes CIB and CB unless otherwise noted
1 Financials are as reported. J.P. Morgan Payments revenue excludes the net impact of equity investments
2 Source: Coalition Greenwich Competitor Analytics (CIB, Markets, Payments and Securities Services market share and rank), reflecting JPMorgan Chase’s internal business structure and internal revenue, which may differ from externally disclosed revenue. Rank is based on the Coalition
Index Banks. Payments reflects global J.P. Morgan Treasury Services business (CIB and CB). For additional information, see note 1 on slide 43
3 Source: Dealogic (Investment Banking market share and rank). For additional information, see note 2 on slide 43
CIB performance remained strong amid increased capital requirements and industry wallet decline
ANIMATION
Adjusted net
income ($B)2
Adjusted
ROE (%)2 16% 14% 21% 25% 14%
Note: Prior-period amounts have been revised to conform with the current presentation. For additional information, see notes 1 and 2 on slide 44
1 Source: Coalition Greenwich Competitor Analytics. Industry wallet and market share for CIB, reflecting JPMorgan Chase’s internal business structure and internal revenue. For additional information, see note 1 on slide 43
2 This presentation includes certain non-GAAP financial measures, which exclude the impact of legal expense. Refer to slide 45 for a reconciliation of reported results to these non-GAAP financial measures
$70 $80 $80 $83 $103
Capital ($B)
$11.0 $11.9 $12.3 $17.8 $21.3 $15.0
$35.7 $37.5 $39.4
$49.5
$51.9
$48.1
2017 2018 2019 2020 2021 2022
$381 $381 $375
$431
$456
$438
Industry
wallet ($B)1
JPM market
share (%)1
Revenue ($B)
$70
15%
2
8.6%
9.0% 9.1%
10.3% 10.3% 10.0%
We continue to maintain a leadership position across products and regions
14
10
Peer 1 Peer 2 Peer 3 Peer 4 Peer 5
24
Number of products ranked top 3 (out of 25 products) ■ #1 ■ #2-3
For footnoted information, refer to slide 46
2
10
11
5
13
6
14
10
15
9
1
2017 2022
12
10
1
12
10
2
2017 2022
#1 in 1 additional
product since 2017
Maintained top 3
position in 22 products
#1 in 3 additional
products since 2017
2017 2022
Americas
#1
EMEA
#1
APAC
#3
Number of products ranked ■ #1 ■ #2-3 ■ #4+
2022 GLOBAL LEADERSHIP POSITIONS COMPARED TO PEERS1,2 WE MAINTAINED OUR LEADERSHIP POSITION ACROSS REGIONS
WITH IMPROVEMENT IN SEVERAL PRODUCTS1,2,3,4
3
Market share gains across most businesses and all regions have helped widen the gap to peers
8.6% 10.0%
2017
JPM
Peer 1
Peer 2
Peer 3
Peer 4
MARKET SHARE BY BUSINESS1
2022
MARKET SHARE BY REGION2 MARKET SHARE VS. PEERS3
380
bps
■ 2017 ■ 2022
Investment Banking
-30bps
8.2%
7.9%
Markets
Payments (J.P. Morgan Treasury Services)
Securities Services
+100bps
11.6%
10.6%
+280bps
8.4%
5.6%
+80bps
10.5%
9.7%
10.5% 12.1%
2017 2022
NOT TO SCALE
8.7% 9.4%
4.7% 6.7%
Americas
+160bps
EMEA
+70bps
APAC
+200bps
5.2%
Avg
6.2%
Avg
340
bps
NOT TO SCALE
4
For footnoted information, refer to slide 46
2023 total investment spend $3.9B
Technology investments $3.2B
CIB technology $2.1B
Enterprise technology $1.1B
Digital, Data, and AI/ML $0.3B
Revenue producers $0.2B
Acquisitions $0.1B
Note: Prior-period amounts have been revised to conform with the current presentation. For additional information, see note 1 on slide 44; totals may not sum due to rounding
1 This presentation includes certain non-GAAP financial measures, which exclude the impact of legal expense. Refer to slide 45 for a reconciliation of reported results to these non-GAAP financial measures
We are being disciplined with expenses, with growth driven mainly by wage inflation and investments
$22.3
$23.6 ~$24
$3.0
$3.6 $3.9
$0.0
$(0.2)
$1.5
$0.6 $0.4 $0.2
Investments
$25.3
$27.2 ~$28
ADJUSTED EXPENSE1 ($B)
Market
dependent
⚫ Volume- & revenue-related
⚫ Performance-driven compensation
⚫ Volume-related operations, brokerage,
and marketing
⚫ Structural
⚫ Compensation, including wage inflation
⚫ Regulatory
⚫ T&E normalization
2021 Volume- &
revenue-
related
Structural Investments 2022 Volume- &
revenue-
related
Structural Investments 2023 market
dependent
5
Clients served by 3-4 CIB businesses
The strength and completeness of our CIB businesses create a differentiated ability to serve our clients
Client-centric relationship view
We deploy capital to support our clients’ growth, which is
measured primarily at the relationship level
Complete & harmonized product offering
Partnering with our clients in one product helps us
holistically serve them in their adjacent product needs
~75%
~80%
Clients served by
1-2 businesses
Clients served by
3-4 businesses
~2.3x
Clients served by
1-2 businesses
Clients served by
3-4 businesses
~1.6x
Average revenue (FI & PS clients)
Average revenue (Corporate clients)
Clients served by 3-4 CIB businesses
Financial Institutions (FI) &
Public Sector (PS)
Top 500 clients
Corporates
Top 500 clients
$2B+ revenue opportunity
from further increasing multi-product penetration in these segments
Continuous client engagement across products
Product diversity enables continuous client engagement on
flow business, which helps win episodic business
PRINCIPLES OF HOW WE OPERATE CROSS-BUSINESS IMPACT AND OPPORTUNITIES1,2,3
1 Top 500 CIB clients based on average annual JPM revenue generated during the last 24 months, as of February 2023
2 Number of CIB businesses (Investment Banking, Markets, Payments and Securities Services) that generated at least $1,000 in client revenue over the last 24 months, as of February 2023
3 Average annual JPM revenue generated per client for top 500 clients during the last 24 months, as of February 2023
6
We remain the leading global Markets franchise, with sustained growth and continued client excellence
LEADING MARKETS RANKS GLOBALLY1
11.6%
Market share2
 100bps vs FY17
$29.0B
Revenue
 57% vs FY17
SUSTAINED FINANCIAL GROWTH
Continued client excellence
OMNICHANNEL CONNECTIVITY5
GLOBAL EXPERTISE4
Revenue CAGR (2017-2022)
Voice
7%
Electronic
12%
Americas APAC
EMEA
Leading market share across regions
#1 #1
#1 (tied)
DEEP CLIENT RELATIONSHIPS6
J.P. Morgan offers the
best service quality across
Equities and FICC to
institutional clients
Markets
Across all FICC products,
J.P. Morgan has the highest
number of buy-side clients
expecting to increase business
#1 FICC #1 Equities #1 Research
MULTI-ASSET COUNTERPARTY3
Products: Cash Equities, Equity Derivatives, FX,
Commodities, Credit, Rates, Structured Products, etc.
Client distribution by # of products traded Coalition Greenwich Voice of Client
Survey Highlights
For footnoted information, refer to slide 47
35%
22%
43%
≥ 6
products
4-5 products
≤ 3
products
7
We have gained share across Equities and FICC since 2017 – with further room to grow
1 Revenue is as reported
2 Source: Coalition Greenwich Competitor Analytics (market share and rank). For additional information, see note 1 on slide 43
Markets
#1 rank
#1 rank (tied) #1 rank
FICC revenue ($B) Equities revenue ($B)
FICC MARKET SHARE AND RANK2
EQUITIES MARKET SHARE AND RANK2
#1 rank
$12.8 $12.7
$14.4
$20.9
$16.9
$18.6
$5.7 $6.9
$6.5
$8.6
$10.5
$10.4
2017 2018 2019 2020 2021 2022
$18.5
$19.6
$20.9
$29.5
$27.4
$29.0
MARKETS REVENUE, MARKET SHARE, AND RANK1,2
2017 2018 2019 2020 2021 2022
10.1%
11.3% 11.0%
12.1% 11.7%
12.9%
2017 2018 2019 2020 2021 2022
10.9% 11.4% 11.6%
12.8% 12.4%
11.0%
Markets market share
10.6%
11.4% 11.4%
12.6% 12.1% 11.6%
8
Our Markets franchise is well-positioned to outperform on a relative basis
Markets
163
212
2017-19 Avg. 2020-22 Avg. 2023F
(~4%)
11.1% 12.1%
29.3%
32.0%
2017-2019 Avg. 2020-2022 Avg.
Peers 2-5
JPM
40.4%
44.1%
~370bps
Marginal ROE
Fully-loaded ROE
Cost of capital
NOT TO SCALE
1 Source: Coalition Greenwich Competitor Analytics. Peer ranks are for the respective year. For additional information, see notes 1 and 3 on slide 43
2 Fully-loaded ROE includes allocation of all income (ex-legal) and capital items across the businesses, with legal held in management; Marginal ROE is a way of evaluating the marginal impact of a business if it were to be removed from the overall LOB, assuming that some of the
allocated costs/ capital that are allocated to the LOB would not be reduced, but be redirected to other LOBs
INDUSTRY WALLET PER COALITION1 ($B) MARKET SHARE FOR TOP 5 PLAYERS1 (%) 2023F ROE2 (%)
Industry wallet is expected to soften, but
remain elevated vs. pre-pandemic levels
We continue to benefit from wallet consolidation
among the largest Markets players
Marginal returns are expected to deliver
above the cost of capital
9
We remain focused on being a complete counterparty with differentiated offerings
STRATEGIC DRIVERS CURRENT FOCUS AREAS
Meeting client needs through a complete product set and a holistic coverage model
Markets
Client and
business tools
Advanced data and
analytics
Scalable infrastructure
and systems
KEY ENABLERS
Deploying capital dynamically and with discipline
Extending our reach beyond trade execution
Integrating our digital interface
Extending our e-Trading leadership position
Promoting efficient market structures
Building private credit capabilities
Be a complete
counterparty
Be on the frontier
of secular trends
Be differentiated
across the
trade lifecycle
Gaining share with our largest institutional clients as they grow
10
Sovereign Funds
Securities Services is a leading provider, delivering strong financial performance and consistent market
share growth
Delivering critical services and
solutions at scale – with 100% of
our top 200 clients common to
Markets and Investment Banking
Americas EMEA APAC
~40% ~40% ~20%
100 global markets
Asset Managers
Insurance
17 of top 20 are clients2
7 of top 10 are clients4
of top 10 are clients3
8
Liquidity provisioning to the rest
of the firm
Robust and consistent revenue
Capital-light business
Tailwinds from rising interest rates
For footnoted information, refer to slide 47
Securities Services
AUC6
Deposits6
Market
share9
Revenue7
 22%
Growth vs.
2017
 42%
 80bps
 17%
(+23% fee revenue)
Operating
margin8
30%+
average
2022
$29T
$4.5B
$203B
28%
10.5%
Daily NAVs 25k  64%
BUSINESS STRENGTHS OUR BUSINESS PRESENCE BY THE NUMBERS
SERVING THE TOP INSTITUTIONS1
WELL-DIVERSIFIED GLOBAL PRESENCE5
11
ETFs
⚫ End-to-end automation across
ETF lifecycle: baskets, orders,
and post-trade
Alternatives
⚫ Complete offering across
Alternatives portfolio (hedge,
private equity, private credit,
real assets)
Middle
Office
⚫ Differentiated solution that
leverages the scale and
capabilities of the broader CIB
Data
Solutions
⚫ Accurate, timely, and integrated
data solutions to improve decision
making and to generate alpha
Our investments are delivering both scale and growth to benefit our clients and the franchise
Global
Custody
⚫ Settle ~$900B notional daily
⚫ Provide safekeeping, settlement,
and servicing of listed assets in
100 markets globally
Traditional
Fund
Services
⚫ Deliver 25k daily NAVs
⚫ Support clients in global fund
domiciles across the full range of
fund structures and instrument
types
Trading
Services
⚫ Doubled lendable balances3
⚫ Offer lending and collateral
solutions that help clients optimize
inventory and improve portfolio
returns
Our core businesses deliver
scale and efficiency…
…while investments in enhanced capabilities
are delivering additional growth
Cost per trade
▼ 26%
Market share2
▲ 40bps
Cost per NAV
▼ 16%
Market share2
▲ 440bps
Cost per trade
▼ 84%
Market share2
▲ 640bps
AUA
▲ 34%
AUA
▲ 107%
AUC
▲ 353%
Securities Services
KEY METRICS1 KEY METRICS1
1 All metrics show change from 2017 to 2022
2 Source: Coalition Greenwich Competitor Analytics. Share reflects JPM share of Coalition Index Banks. Custody share based on Global Custody revenue. Traditional Fund Services share based on Fund Administration and Fund Services Other
revenue. Trading Services share based on Agency Securities Lending, Depositary Receipts and Collateral Management revenue. For additional information, see notes 1 and 3 on slide 43
3 Trading services lendable balances doubled compared to peak 2022 lendable balances vs. average 2017
12
We have been ranked #1 in Investment Banking (IB) fees for over a decade and have consistently
achieved top positions across products and regions
North America EMEA APAC
Wallet: $40B
Market share: 10.0%
Wallet: $20B
Market share: 7.6%
Wallet: $16B
Market share: 2.7%
Synergies with the franchise (e.g., Commercial Banking, Private
Bank) deepen client relationships
✓
Differentiated strengths that benefit clients and position us to grow
(e.g., talent, unrivaled breadth in offering)
✓
Continued progress in strategic focus areas (Financial Sponsors,
Private Capital, International, Carbon Transition)
✓
Excellence in execution (e.g., by investing in technology and
analytics, while deploying capital with discipline)
✓
8.2%
2017
8.6%
2018
8.9%
2019
9.1%
2020
9.3%
2021
7.9%
2022
$82 $81 $78
$92
$133
$78
Industry wallet ($B) JPM market share
LATAM
Wallet: $1B
Market share: 10.3%
#1
for more than
a decade
#1
since 2014
#3
among global peers
since 2018
Top 2
since 2018
Source: Dealogic. Regional wallet size and market share metrics are for 2022. For additional information, see note 2 on slide 43
#1 rank since 2009
RANKED #1 BY INVESTMENT BANKING FEES FOR OVER A DECADE FOCUS AREAS FOR DEEP-DIVE DISCUSSION
Investment Banking
13
On track to achieve our $15B firmwide revenue target set last year
✓
World’s largest payments franchise1, occupying a unique place in
the payments industry
✓
Continue to invest to deliver scalability, efficiency, and differentiated
product offerings, but expect investment spend growth to plateau
going forward
✓
Our business architecture builds on our core capabilities to fulfill
evolving client needs and drive higher margins
✓
Note: Prior-period amounts have been revised to conform with the current presentation. For additional information, see notes 1 and 2 on slide 44
1 Source: Coalition Greenwich Competitor Analytics. Reflects global J.P. Morgan Treasury Services business (CIB and CB). Rank is based on the Coalition Index Banks. For additional information, see note 1 on slide 43
CIB revenue ($B)
NII
Fees
Firmwide metrics 2017 2018 2019 2020 2021 2022
Revenue ($B) $9.2 $10.4 $10.2 $9.6 $9.9 $13.9
Avg. deposits ($B) 440 453 483 651 800 779
TS market share1 5.6% 6.1% 6.0% 6.9% 7.2% 8.4%
TS rank1 #2 #1
Our Payments business has grown significantly as a result of both NII and fee growth
Payments
PERFORMANCE (EXCLUDING EQUITY INVESTMENTS) FOCUS AREAS FOR DEEP-DIVE DISCUSSION
Including Equity Investments
2021: $6.5B
2022: $7.6B
$5.4
$5.9 $5.9 $5.7 $6.0
$8.0
2017 2018 2019 2020 2021 2022
14
47%
22%
31%
Average:
2012-19
44%
29%
27%
2020
39%
27%
34%
2021
38%
15%
47%
2022
44%
17%
39%
1Q’23
DCM
ECM
M&A
$77
$92
$133
$78
$16
After a record 2021, the Investment Banking (IB) industry wallet reverted to pre-pandemic levels in 2022,
with a softer start this year
 Financial sponsor dry powder
 Private capital
 Corporate balance sheets
 Debt maturities
? Interest rates
? Valuations
 Geopolitical uncertainty
 Inflation / recession concerns
2%
Average:
2012-19
55%
23%
20%
2%
2020
58%
23%
17%
2%
2021
51%
26%
21%
54%
2022
52%
27% 20%
25%
1%
19%
1Q’23
NAMR
EMEA
APAC
LATAM
$77
$92
$133
$78
$16
2%
Average:
1Q 2012-19
Average:
1Q 2012-19
$19 $19
Source: Dealogic. For additional information, see note 2 on slide 43
GLOBAL WALLET EVOLUTION BY PRODUCT ($B) GLOBAL WALLET EVOLUTION BY REGION ($B) DRIVERS
15
We have been ranked #1 in IB fees for over a decade and have consistently achieved top positions across
products and regions
Ranked #1 by Investment Banking fees for over a decade Continued strong leadership position across products
DCM
ECM
M&A
18 15 15 27 36
7.2%
2017 2018 2019 2020 2021
12
5.7%
2022
3
6.6%
1Q’23
26 29 27 26
45 37
8.4%
2017 2018 2019 2020 2021
8.1%
2022
6
10.1%
1Q’23
#1 rank
#2 rank
4.2%
7.7%
2012 2013 2014 2015 2016 2017 2018 2019
9.1%
2020
9.3%
2021
7.9%
2022
6.1% 6.1%
8.7%
1Q’23
$67
$75 $81 $76 $75
$82 $81 $78
$92
$133
$78
$16
6.1%
39 36 36 40 51
30
8.6%
2017 2018 2019 2020 2021
8.5%
2022
7
8.2%
1Q’23
Industry wallet ($B)
JPM market share
Sum of top 5 boutiques1
Average of top 3 banks (ex-JPM)1
Industry wallet ($B) JPM market share
#1 #1 #2 rank
#2
Source: Dealogic. For additional information, see note 2 on slide 43
1
Top banks and top boutiques refer to the top positions (excluding J.P. Morgan) by year
#1 rank since 2009
16
REGIONS PRODUCTS CLIENTS SECTORS
Priority markets where we
are not #1
(e.g., Australia & Japan)
#1 in North America for
over a decade
#1 in EMEA since 2014
~170bps opportunity to
close gap to #1 in M&A1
~130bps opportunity to
close gap to #1 in ECM1,2
#1 in DCM
since 2012
Leverage franchise to
further deepen and build
new relationships
across segments
(middle market corporates
and sponsors, venture capital)
#1 rank with Corporates
#1 rank with Financial
Institutions
Select
sub-sectors
Strong leadership position
across all sectors
We have several organic growth opportunities at the region, product, client, and sub-sectors level which
will further strengthen our #1 position
Source: Dealogic. For additional information, see note 2 on slide 43
1 Average gap to #1 bank from 2020-2022
2 ECM excludes SPACs and A-share
Note: #1 position based on Dealogic rank for Investment Banking fees. For additional information, see note 2 on slide 43
Key
opportunities
17
Long-standing leadership position
at the sector level
As a leader across sectors, our approach to growth is through investment in priority sub-sectors
We have delivered growth by focusing on
priority sub-sectors…
…and still have an opportunity
in priority sub-sectors
where we have gaps
2017-19 average 2020-22 average
Wallet
(2020-22 average)
JPM market share
+220bps
FinTech $3.4B
+210bps
Retail $3.1B
+100bps
Energy &
Renewables
$8.2B
Sectors opportunity
Rank (2017-2022)1
Consumer & Retail #1
Healthcare #1
Diversified Industrials #1
Energy, Power & Renewables,
Metals & Mining
#1
Financial Institutions #1
Media & Communications #1
Real Estate #1
Technology #2
Sub-Sectors
Sectors
Source: Dealogic. For additional information, see notes 2 and 3 on slide 43
1 Based on aggregate global industry wallet for 2017-2022
2 Based on average global industry wallet for 2017-2022
18
~20%
Priority sub-sectors2
Global IB
industry wallet
With our differentiated strengths, we are uniquely positioned to support our clients
Talent
~25-year average JPM tenure of IB senior leadership1; ~15-year across all IB MDs2
Unmatched
client experience
Fortress balance sheet
Financial strength to consistently support clients across business cycles
1 Senior IB leaders defined as IB management team, IB Global Chairs, IB Vice Chairs
2 Includes IB and Global Corporate Banking MDs
Unrivaled breadth in offering
Scaled products and nuanced expertise across regions and industries
19
Innovation mindset
Evolving client solutions and coverage model to be at the forefront of client needs
Strategic franchise integration across client lifecycle
Multiple client touchpoints and complementary products that strengthen clients as they grow
Commercial Banking:
#1 lead share in
middle market1
We have best-in-class IB coverage and solutions to help clients succeed as their needs evolve
Early and Growth Mature
Client
needs
JPM
IB
offering
&
innovative
solutions
Multi-billion dollar
Direct Lending program
Take public Shareholder value
creation
Business expansion Strategic growth
Debt and equity
funding
Leadership in
Equity Private
Placements
1 out of 5 transactions
awarded Lead Left role2,4
~18% IB share with clients
who award us Lead Left2,5
#1 in Leveraged Loans2,3
Activist Defense
#2
up from #5 in 20196
Dedicated cross-LOB
Innovation Economy
coverage
For footnoted information, refer to slide 48
M&A
Corporate Clarity
Private capital
funding
20
Innovation mindset
Breadth in offering
We partner across the JPM franchise to support clients, adding unique value during IB transactions, and
providing a complete set of offerings that deepen our relationships
Securities
Services
Global Custody
Payments Payments & Commerce Solutions
Liquidity & Account Solutions
Commercial
Banking
Direct loan
Lending
Private Bank
Manages
founder wealth
Raises private
capital for IPO
Investment Solutions
Lending
Equity mgmt.
(Global Shares)
Wealth Advisory
Markets
23% CAGR2
Corporate Derivatives revenue growth
rate generated for IB client transactions
since launch in 2019
Spin
off
EPP M&A
Private Cross-border
Equity
follow-on
IPO M&A
Defense
Investment
Banking
Markets
Provides loan to
investor clients
FX & Hedging
Provides corporate
derivatives
Syndicates and places
securities
Research
Take public Shareholder value
Business expansion Strategic growth
Debt and equity funding
Private capital funding
Client needs
Breadth in offering Strategic franchise integration
Ongoing client touchpoints with flow businesses across JPM strengthen relationships and
keep us top of mind when strategic activity occurs
Manages
spin-off entity
Identifies potential
targets and buyers
Identifies mid-sized
opportunities
Debt
issuance
Commercial Banking
$19B+1
IB revenue generated with CB clients
since 2017
21
1 Includes gross revenue earned by the Firm that are subject to a revenue sharing arrangement with the CIB for products sold to CB clients through the Investment Banking, Markets or Payments businesses. This includes revenue related to fixed income and equity markets products
2 CAGR 2019-2022, current approach / team in place since 2019
o For every dollar we generate with IB corporate clients, we generate a
further $1.4 dollars in additional franchise revenue
Clients value our powerful franchise collaboration model, and reward us for it
Unmatched
client experience
Investment
Banking2
#1
Commercial
Banking:
lead share in
middle market3
#1
Payments4
#1
Private Bank5
#1
Markets4
#1
Securities
Services4
#3
For every dollar we generate with IB corporate clients, clients reward us
with a further $1.4 dollars in additional franchise revenue1
22
1.0
2.4
1.4
IB revenue
from all IB corporate clients
Additional non-IB revenue
from all IB corporate clients
Total franchise revenue
from all IB corporate clients
For footnoted information, refer to slide 48
Multiplier effect
Private Capital
$2.1T market3
✓ Raised $12B+ in proceeds for nearly 60 deals in 2022
✓ Acquired Aumni
✓ Collaborated with CB to launch multi-billion dollar Direct Lending program
Financial Sponsors
$2.1T dry powder1
✓ Grew share in sponsor sell-side deals by +90bps2 in collaboration with
Commercial Banking (CB)
✓ Focused on select industries (technology, healthcare, green economy)
International
$8.1B addressable IB
wallet in focus countries4
✓ Maintained #2 global rank in green IB transactions, in 2022 achieved #2
position across M&A, ECM, and DCM6
✓ IB financed and facilitated $120B+ in support of green activities since 2020;
including advancement of emerging green economy
Carbon Transition
$1.1T global investment
in low-carbon energy
transition5
⚫ Continue investing in high touch servicing of larger deals
⚫ Launch and scale Capital Connect by J.P. Morgan
⚫ Collaborate across franchise to strengthen offering
⚫ Deepen relationships with sponsors
⚫ Identify new M&A opportunities
⚫ CB and Global Corporate Banking (GCB) expansion
⚫ Deepen coverage expertise in Australia, India, China,
Japan, and Middle East
⚫ Deepen coverage in New Economy and Healthcare
⚫ Deepen advisory expertise
⚫ Leverage Centers of Excellence to provide
holistic advice
PROGRESS MADE
OBJECTIVES
✓ Deepened IB presence in Australia and India
✓ Expanded GCB coverage of multi-national companies with APAC presence
✓ Hired top talent to drive growth in New Economy and Healthcare
We have made tangible progress on our strategic priorities
23
For footnoted information, refer to slide 48
In closing
#1 in Investment Banking for over a decade1
Differentiated strengths that benefit clients and position us to grow (e.g., talent, unrivaled breadth in offering)
Synergies with the franchise (e.g., Commercial Banking, Private Bank) deepen client relationships
Continued progress in strategic focus areas (Financial Sponsors, Private Capital, International, Carbon Transition)
Excellence in execution (e.g., by investing in technology and analytics, while deploying capital with discipline)
1
Source: Dealogic. For additional information, see note 2 on slide 43
24
KEY 2022 FIRMWIDE METRICS1
SMB Merchant Services
(4% of revenue)
E-commerce / Marketplaces
(12% of revenue)
Corporates
(52% of revenue)
CLIENT SEGMENTS
Financial Institutions
(33% of revenue)
LOBs
Commercial Banking and
Consumer & Community Banking
(43% of revenue)
Corporate & Investment Bank
(57% of revenue)
J.P. Morgan Payments Overview
vs. 2021:
Revenue
$13.9B
41%
Clients (excl. SMB2)
31k
2k
Average deposits
$779B
$21B
Pre-tax Income
$6.0B
91%3
Note: J.P. Morgan Payments and Firmwide Payments revenue and expense throughout the CIB presentation predominantly includes CIB and CB unless otherwise noted; totals may not sum due to rounding
1 All revenue and PTI numbers exclude the net impact of equity investments unless otherwise noted
2 Excludes 400k active SMB clients across CCB and Payments First
3 2021 PTI was adjusted to include CCB Merchant Services expenses
BUSINESS SEGMENTS
Trade & Working Capital
(3% of revenue)
Merchant Services (MS)
(9% of revenue)
Treasury Services (TS) –
Liquidity & Payments
(88% of revenue)
25
J.P. Morgan Payments delivered record growth in 2022
2021 2022
2021
Rank
2022
Rank
TS market share1 7.2% 8.4% #1 #1
USD SWIFT #1 #1
Avg. payments transaction value/day $9.7T $9.8T
Lockbox market share2 24.3% 29.8% #1 #1
U.S. real-time payments volume3 140mm 162mm #1 #1
Net Promoter Score4 50 54 #1 #1
Digital banking (J.P. Morgan Access®)5 #1 #1
SCF market share6 9.6% 9.9% #3 #3
U.S. merchant acquiring transactions7 32B 36B #1 #1
U.S. merchant transaction value8 $1.7T $2.0T #1 #1
Payments processing accuracy9 >99.999999%
TS
Liquidity
2022
Merchant
Services
TS
Payments
Trade
9.9
10.3
excluding
$0.4B gains
on equity
investments
2021
13.9
13.5
excluding
$0.4B losses
on equity
investments
: Gains / losses on equity investments
LEADERSHIP POSITIONS & GROWTH
FIRMWIDE PAYMENTS REVENUE ($B)
0.1 0.1
For footnoted information, refer to slide 49
0.4
3.4
26
Treasury Services growth outpaced our top competitors as we continue to serve companies – large and
small – around the world
80%+ of the U.S. Fortune 500 Companies
are our Payments clients, generating $500mm+ in
total revenue in 2022
AND OF THE 20 LARGEST GLOBAL COMPANIES2…
expanded their relationship with us in the last year
1 Source: Coalition Greenwich Competitor Analytics. Reflects global J.P. Morgan Treasury Services business (CIB and CB). Rank is based on the Coalition Index Banks. For additional information, see note 1 on slide 43
2 Top 20 companies by market cap are as of May 15, 2023
ANNUAL NUMBER OF MANDATES
WE SERVE MOST OF THE WORLD’S LARGEST COMPANIES
2017 vs. 2022 JPM
Top 3 peer
average
CIB Core Cash Revenue  62%  30%
CIB Corporates Revenue  93%  47%
CIB FIG Revenue  50%  34%
FIRMWIDE TREASURY SERVICES REVENUE ($B)1
17
15
Corporates FIG
2017 2022 2017 2022
1.9x 1.6x
2017 2022
$7.3 $6.5
$11.9
$9.5
Top 3 peer
average
Top 3 peer
average
$0.7
$2.4
27
JPM Rank #2 JPM Rank #1
Our investments are beginning to yield results in Merchant Services, which we believe will drive continued
margin expansion in the business
OUR REVENUE GREW AS WE GAINED MOMENTUM AGAINST TOP COMPETITORS…
… AND OUR INVESTMENTS ARE BEGINNING TO
DRIVE MARGIN EXPANSION
New Unified Gateway and APIs Live
Enhancing developer experience
2022 ($T)
Growth
’22 vs ’21 (%)
JPM (U.S. Volume) $2.0  17%
Traditional Peer 1 (U.S. Volume)1 $1.7  6%
Traditional Peer 2 (U.S. Volume)1
$1.7  9%
Leading Fintech (Global Volume)2
$0.8  26%
International expansion
Expanded beyond U.S., Canada, U.K. and
EU to Brazil and 7 new markets in APAC
New set of value-added services
Offering checkout, tokenization, omni-
channel and biometrics
Integrated value prop across TS and MS
End-to-end payment acceptance and
disbursement
Data and insights
Leveraging unparalleled scale to improve
authorization rates and reduce fraud
NOT TO SCALE
Growth
’22 vs ’21 (%)
17%
11%
2021
… while revenue showed limited growth
2017
3% CAGR
13% CAGR
U.S. MS Volume ($T)
U.S. MS Revenue ($B)
Note: Prior-period amounts have been revised to conform with the current presentation. For additional information, see note 2 on slide 44
1 Source: Nilson
2 Source: Based on externally reported data
28
We expect expense growth to remain at low-to-mid single digits over the medium term as our investments
are fully at scale
EXPENSES GOING FORWARD
FIRMWIDE PAYMENTS EXPENSES ($B)
NOT TO SCALE
2022
Actuals
Volume- &
revenue-related
Investments Structural /
Productivity
2023
Modest increase in 2023 expenses driven primarily
by wage inflation and regulatory surcharges as well
as acquisition-related expenses
Overall, we expect low-to-mid single digit
expense growth for the medium-term
Productivity gains to be delivered by new
operating model integrating product and
technology organizations
Limited increase in investment spend as our
transformation efforts are largely staffed and at scale
As we add clients and volume, modest increase
in structural and volume-related expenses
29
Transactions Engine (Graphite)
We continue to modernize our infrastructure and are making significant progress on cloud migration
2026
2019
⚫ Nearing completion; we continue to win a substantially large
share of liquidity RFPs in the market
⚫ Integrated Gemstone and Renovite acquisitions to
accelerate technology deployment
⚫ Configurable, modern stack live for e-commerce
2022 2023
2024
2016
2024
2017
Liquidity Platform (GLASS)
Next step: Migration from core legacy platforms and decommissioning
Next step: Finalize platform build and complete up to 85% of client migrations
Merchant Acquiring (Helix)
Next step: Commercialize new unified gateway and decommission legacy systems to migrate clients
RE-PLATFORMING OF OUR PROCESSING PLATFORMS CONTINUES…
Progress updates since last year
⚫ Grown to 3rd largest J.P. Morgan Payments platform
30
% of internal applications
Modern Off-Prem Modern On-Prem Heritage
…AS WE MAKE SIGNIFICANT PROGRESS ON CLOUD MIGRATION
We continue to build new platforms that are
foundational to our modernization and cloud efforts
NOT TO SCALE
2021 2023 Medium-term
70%+
15%
60%+
We are expanding our offerings to deliver more value for our clients and unlock higher margins
✔ Leverage our strong
foundation of core
capabilities, controls
and scale
✔ Address evolving
client needs and
personas
✔ Capture higher margin
opportunities,
proportionate to the
value delivered
Embedded Finance
Orchestrate complex money movement and embed banking services in platforms
(e.g., Marketplaces, PayFacs)
FOR OUR
CLIENTS
FOR OUR
CLIENTS’
CLIENTS
KEY PRINCIPLES
Wallets / bank accounts
Onboarding Managed Pay-Outs
SaaS by Industry
Contextualized offerings that address needs of specific industries, either through proprietary (full
stack) or partner (thin stack) offerings
Smart Energy
Healthcare
Data and Capabilities as-a-Service
New products that deliver enhanced experiences, more intelligence and better security for our clients
FX-as-a-Service Security-as-a-Service
Payments Products Innovation
Expanding core payments offerings facilitating global money movement and liquidity management
Real-time payments Alternative payment methods Structured Trade
Commerce
Mobility
Merchant Lending
JPM Coin
OUR STRATEGIC FOCUS AREAS
Selected product examples, not exhaustive
Data-as-a-Service
✔ Harness advanced
AI/ML at scale to
unlock value for us and
our clients
✓ ✓ ✓ ✓
✓
✓
✓
✓ ✓ ✓
✓ ✓
✓
✓
✓ Live ✓ Upcoming Pilot
M
a
r
g
i
n
E
x
p
a
n
s
i
o
n
✓
31
⚫ Updated user interface for improved
navigation and client experience, including
mobile
⚫ Enhanced service tools
⚫ AI-enabled value-added services (e.g., Cash
Flow Intelligence)
⚫ Embedded within leading ERP systems
STRONG DIGITAL PORTAL
SUPPORTING TREASURERS…
~34k
Profiles
~$9T
Monthly Transactions
~6k
Mobile Users
#1
for Overall Digital Capabilities1
2017 2022 Target
~2k
API Clients
…THAT GENERATES
SIGNIFICANT REVENUE …
New Developer Console
coming live in 3Q
…AS WE CONTINUE TO BUILD A NEW
VALUE PROPOSITION FOR DEVELOPERS
Unified API across payment rails
15%
CAGR
9%
CAGR
We continue to enhance the ways our clients can connect with us, focusing on improving developer
experience and ease of use
Firmwide Payments Digital
Channels Fee Revenue
<1.global.api>
1 Source: Coalition Greenwich Digital Transformation Benchmarking 2022 – Large Corporate Segment
2 Target growth rates go out no further than 2025
NOT TO SCALE
2
32
We are beginning to unlock value by transforming the breadth and scale of our data into value-added
products for our clients
Payments Data Lake
Single source, cloud-native platform
that stores and harnesses the data
Validation Services
Customer Insights
We continue to build more use cases in partnership with other Lines of Business (e.g., CCB) and our Strategy & Growth Office
3
Tokenization
Tokenize customer data to store in
proprietary secure vault
Strong data governance
and controls
Data is appropriately encrypted,
depersonalized, and aggregated
Optimization Tools for Merchant Acquiring
2
1
Combined issuing and
acquiring data
Improved authorization
rates
JPM PAYMENTS’ VAST SCOPE OF DATA…
…COMBINED WITH
OUR TOOLS…
…POWERS KEY USE CASES WITH HIGH CLIENT VALUE
Instant Identity Verification
4
Test: onboard and
validate identity
Customized reports with
anonymized insights on
our customers’ customers
Lower fraud rates
Test: face and palm
biometrics
Biometrics and Digital Identity
(in testing)
36B U.S. Annual Merchant Acquiring
Transactions
50%+ U.S. DDA Payment Accounts
#1 USD Clearing Correspondent Bank
~1.3B Unique U.S. Cards
Direct access to Third Party Datasets
(e.g., Early Warning Services – EWS)
33
Extend internationally
through Liink network
0 to 200+ clients
onboarded in <2 years
WE HAVE A STRONG
BUSINESS TODAY…
~120
Currencies
7k+
Clients
~160
Countries
~$190B
Annual FX
Payments Flow
⚫ Joint product development and deep
partnership between Payments and
Markets
⚫ New Transact platform in Markets enables
Corporates to proactively hedge and
manage FX exposures through integrated
pre-trade, trade, and post-trade workflow
⚫ Consistent double digit revenue growth
with both CIB and CB clients
…WITH NEW OPPORTUNITIES…
Global Mass Pay for
Corporates:
Helping platforms and marketplaces
facilitate millions of low-value
transactions around the world in
minutes, with high STP rates
✓
FX-as-a-Service for FIs:
Giving traditional banks a white-label
solution to support their clients…
… and giving fintechs the APIs
needed to connect to global
payments infrastructure
✓
We see strong near-term growth from extending our market-leading FX payments capabilities, in
partnership with our Markets business
2017 2022 Target
… EXPECTED TO DELIVER
STRONG CONTINUED GROWTH
Firmwide Payments FX Revenue1
15%+
CAGR
15%+
CAGR
$1B
1 Portion of Firmwide Payments FX revenue is shared with the Markets business
2 Target growth rates go out no further than 2025
NOT TO SCALE
2
34
Many of our end-to-end Embedded Finance solutions are now live and scaling to support client demand
Client needs
Our
enhanced
product suite
Est. margin
expansion
Unlocks New Revenue Streams
Payment acceptance Manage funds Payment disbursement
Intuitive digital experience, allowing
payments when and how desired
Convenience of managing risk and
complexity of money movement
Hassle-free enrollment of sellers, with
reliable and fast payments
Merchant
Developer
Console
Online
Checkout,
Tokenization
and
Optimization
Omnichannel
(incl.
Biometrics)
Alternative
Methods of
Payments
(incl. Pay-by-
Bank)
Seller Wallet 1
3rd Party
Money
Account
Seller Bank
Account 1
Embedded Finance
Onboarding Accounts Lending
Seller Wallet 2
3-4x 3-4x
….
Seller Bank
Account 2
….
23
In Implementation / Mandated
$15B
2022 U.S. Embedded
Finance TAM1
Client traction
Global Real-
Time Payments
Managed
Pay-Outs
Embedded FX
Payments
1 Calculated based on external market reports and J.P. Morgan Payments internal data
5
Live
140+
In Pipeline
Enabling Key Use
Cases / Industry
Solutions
Retail & Commerce
E-commerce
Mobility
ISVs
Professional Services
Energy
35
Easy account
creation, real-time
access to funds for
customers
Simple customization,
no banking experience
required
Embed financial solutions into
marketplaces and platforms
Video: Embedded Finance Solutions
36
Recognize shoppers
across channels
Unified payment
history
Frictionless in-store
shopping
Video: Omnichannel journey
37
The future of stores with biometric payments
Experience a
faster way to
pay with
biometric
payments
Enroll in biometric
payments and pay
by face
Contactless
payments
Simple in-store
checkout flow
Note: Future biometrics capabilities are under development; features and timelines
are subject to change at the bank's sole discretion
38
Thank You, Emily
Payment Approved
We work closely with the rest of the Firm to deliver value to our clients
Excerpt from Investment Banking section
PAYMENTS IS INTEGRAL TO OUR
FIRMWIDE SUCCESS…
One Client Strategy
With IB and CB…
⚫ Coordinated client coverage and solutioning
⚫ Product innovation and co-creation
Client Lifecycle Engagement
⚫ Day-to-day flow relationship maintains client dialogue and enhances
economics
⚫ Solutions to help clients grow and expand internationally
Cross-LOB Partnerships
⚫ With Markets: FX Payments
⚫ With CCB: Data & Analytics, Payment Network Relationships, Small Business
⚫ With Firmwide Centers of Excellence: Client Onboarding and KYC,
Technology (e.g., Cloud), AI/ML
…AS WE PARTNER WITH OTHER BUSINESSES
ACROSS CLIENTS’ LIFECYCLE
39
2022 Rates +
balances
Organic growth 2023
Outlook
Rates
going
forward
Organic
growth, incl.
balances
Revised
Target
We delivered on our promises made last year and will continue to work towards sustained growth and
higher operating leverage
Targets set at
2022 Investor Day
2022
performance
$15B
Medium-term revenue target
$13.9B
>10%1
Average annual revenue growth
(2021 onwards)
41%
>20%1
Average annual PTI growth
(2021 onwards)
91%
10%1
TS Payments YoY revenue growth
14%
15%1
MS YoY revenue growth (over-time)
8%
15%1
Trade YoY revenue growth
17%
10%
TS market share
8.4%2
20%
SCF market share
9.9%3
FIRMWIDE PAYMENTS REVENUE
NOT TO SCALE
$13.9B
Grow to ~$1B / year
in the medium-term
$15B
Target set
last year
1 Target growth rates go out no further than 2025
2 Source: Coalition Greenwich Competitor Analytics. Reflects global J.P. Morgan Treasury Services business (CIB and CB). For additional information, see note 1 on slide 43
3 Source: Coalition Greenwich Competitor Analytics. SCF represents Supply Chain Finance. Share reflects JPM share of Coalition Index Banks for CIB. For additional information, see note 1 on slide 43
40
Closing thoughts
41
We delivered record revenue and expect client momentum to drive continued organic growth
Our scale, security & controls have earned the trust of our clients, and we are there for them in good and bad times
We build and innovate like a leading technology company, with scale and appropriate controls
Our unified approach across the Firm helps provide unique value to our clients at any scale and geography
Innovation across payments and merchant services will drive margin expansion across our business
1
2
3
4
5
We will build on our leadership position by applying consistent discipline and continuously future-proofing
our model
COMPLETE GLOBAL DIVERSIFIED AT SCALE
Maintaining day-to-day
discipline
Optimizing our current model Transforming for the future
Closing addressable gaps in our wallet
Accelerating organic growth
Attracting and retaining our talent
Modernizing our core technology to
enable scale and faster innovation
1 2 3
Advancing strategic platforms to further
integrate our delivery of the Firm and provide
a better experience for our clients
Monitor and invest in new and emerging
technology (e.g., AI) to develop
future-proof solutions
Continued resilience in the face of
disruption risks to our business
Holistic client servicing across
businesses to bring the best of the Firm
Accelerating organic growth
Agile capital deployment and dynamic
financial management to optimize profits
Geopolitics
Inflation Digitization & AI Carbon transition War for talent
Rates Traditional players New entrants
Market structure
42
~16% ROE through the cycle target
MACRO ENVIRONMENT COMPETITIVE LANDSCAPE
MARKET FORCES
Note: ROE through the cycle target excludes the impact of legal expense
Notes on market share, ranks, and industry wallets
1. Source: Coalition Greenwich Competitor Analytics. Based on JPMorgan Chase’s internal business structure and internal revenue. Excludes the impact of Archegos in 2021
Historical Coalition Greenwich competitor revenue and industry wallets have been rebased to ensure consistent taxonomy and accounting/structural adjustments
Market share reflects share of the overall industry product pool, unless noted that share reflects share of Coalition Index Banks
Rank reflects JPMorgan Chase’s rank amongst Coalition Index Banks as follows:
– CIB and Markets: BAC, BARC, BNPP, CITI, CS, DB, GS, HSBC, JPM, MS, SG and UBS
– Treasury Services and Supply Chain Finance (SCF): BAC, BNPP, CITI, DB, HSBC, JPM, SG, SCB and WFC
– Securities Services: BAC, BBH, BNPP, BNY, CITI, DB, HSBC, JPM, NT, RBC, SCB, SG, and SS
2. Source: Dealogic as of April 3, 2023 (unless otherwise noted) for GIB, ECM, DCM, and M&A rank, market share and industry wallet. ECM excludes shelf deals. DCM includes all bonds, loans, and other debt (i.e.,
securitizations and frequent borrowers), excluding money market and short-term debt
3. Market share changes are rounded to the nearest 10bps
43
1. In the first quarter of 2023, the allocations of revenue and expense to CCB associated with a Merchant Services revenue sharing agreement were discontinued and are now retained in Payments in CIB
2. Revenue adjusted down by $0.1B for 2017 and $0.2B for 2018, 2019 for both CIB and Firmwide Payments for data processing accounting re-class
Additional notes
44
1. The CIB provides certain non-GAAP financial measures. These measures should be viewed in addition to, and not as a substitute for, the CIB’s reported results. The non-GAAP financial measures on slides 2 and 5
exclude the impact of legal expense. Adjusted ROE on slide 2 is calculated as net income after preferred stock costs excluding the impact of legal expense divided by average equity. CIB average equity was $70B,
$70B, $80B, $80B, $83B and $103B for 2017, 2018, 2019, 2020, 2021 and 2022, respectively. The table below provides a reconciliation of reported results to these non-GAAP financial measures
Reconciliation of reported to adjusted results excluding the impact of legal expense
Year ended December 31,
(in millions, except where otherwise noted) 2017 2018 2019 2020 2021 2022
(1) Revenue Reported/ Adjusted 35,667
$ 37,549
$ 39,436
$ 49,451
$ 51,942
$ 48,102
$
(2) Expense Reported 20,259
$ 22,094
$ 22,662
$ 23,773
$ 25,553
$ 27,350
$
Adjustments:
Legal Expenses 18
$ (205)
$ (381)
$ (796)
$ (252)
$ (117)
$
Adjusted 20,277
$ 21,890
$ 22,281
$ 22,977
$ 25,302
$ 27,232
$
(3) Net Income Reported 10,976
$ 11,760
$ 11,919
$ 17,043
$ 21,107
$ 14,925
$
Adjustments:
Legal Expenses (17)
$ 184
$ 347
$ 732
$ 224
$ 86
$
Adjusted 10,959
$ 11,944
$ 12,266
$ 17,775
$ 21,331
$ 15,011
$
(4) ROE Reported 15% 16% 14% 20% 25% 14%
Adjusted 15% 16% 14% 21% 25% 14%
Notes on non-GAAP financial measures
45
Notes on slides 3-4
Slide 3 – We continue to maintain a leadership position across products and regions
1. Source: Coalition Greenwich Competitor Analytics (all ranks excluding GIB, ECM, DCM, and M&A) and Dealogic (GIB, ECM, DCM, and M&A ranks). Includes co-ranked positions as defined by Coalition Greenwich
2. Businesses include CIB, Banking, GIB, M&A, ECM, DCM, CIB Treasury Services, CIB Trade Finance, Markets, FICC, G10 Rates, G10 FX, EM Macro, EM Credit, Commodities, G10 Credit, SPG, Public Finance, G10
Financing, Equities, Cash Equities, Equity Derivatives, Prime Brokerage, Futures, and Securities Services. FY17 includes Credit and does not include EM Credit and G10 Credit. EMEA and APAC do not include Public
Finance
3. Source: Coalition Greenwich Competitor Analytics. 2022 total CIB regional rank for Americas, EMEA and APAC. Ranks are based on the Coalition Index Banks
4. Americas reflects North America and Latin America
For additional information, see notes 1 and 2 on slide 43
Slide 4 - Market share gains across most businesses and all regions have helped widen the gap to peers
1. Source: Coalition Greenwich Competitor Analytics (Markets, Payments and Securities Services), reflecting JPMorgan Chase’s internal business structure and internal revenue; Payments reflects global J.P. Morgan
Treasury Services business (CIB and CB). Dealogic (Investment Banking)
2. Source: Coalition Greenwich Competitor Analytics. Market share for CIB, reflecting JPMorgan Chase’s internal business structure and internal revenue. Americas reflects North America and Latin America
3. Source: Coalition Greenwich Competitor Analytics. Market share for CIB, reflecting JPMorgan Chase’s internal business structure and internal revenue. Peer ranks are for the respective year
For additional information, see notes 1, 2 and 3 on slide 43
46
Notes on slides 7-11
Slide 7 – We remain the leading global Markets franchise, with sustained growth and continued client excellence
1. Source: Coalition Greenwich Competitor Analytics for FICC and Equities ranks; Institutional Investor for Research rank. Ranks for 2022
2. Source: Coalition Greenwich Competitor Analytics
3. Source: Coalition Greenwich Client Analytics. Represents top 1,000 financial institutions (FI) based on wallet size
4. Source: Coalition Greenwich Competitor Analytics (for 2022). Americas reflects North America and Latin America. Ranks are based on JPMorgan Chase’s internal business structure and internal revenue and the
Coalition Index Banks
5. Revenue CAGR is based on internal management revenue
6. Source: Coalition Greenwich Institutional Voice of the Client Analytics (for 2022)
For additional information related to footnotes 1, 2 and 4, see notes 1 and 3 on slide 43
Slide 11 – Securities Services is a leading provider, delivering strong financial performance and consistent market share growth
1. Client (institution) is defined as receiving one or more services across Custody, Fund Services, Trading Services, or Data Solutions
2. Based on Thinking Ahead Institute 2022 Top 500 ranking
3. Based on GlobalSWF.com ranking
4. Based on SWFInstitute.org ranking
5. Based on 2022 revenue
6. AUC is on a spot basis. Deposits are on an average basis
7. 2017 revenue excludes discontinued business
8. Average operating margin is shown from 2017 through 2022. Operating margin excludes credit reserves of $(5)mm and $38mm for 2017 and 2022, respectively
9. Source: Coalition Greenwich Competitor Analytics. For additional information, see notes 1 and 3 on slide 43
47
Notes on slides 20-23
Slide 20 – We have best-in-class IB coverage and solutions to help clients succeed as their needs evolve
1. Source: Coalition Greenwich FY22. $20mm-$500mm
2. Source: Dealogic. For additional information, see note 2 on slide 43
3. Based on aggregate deal value from 2017-2022
4. From 2017-2022; transaction size of at least $500mm
5. From 2017-2022
6. Source: Bloomberg
Slide 22 – Clients value our powerful franchise collaboration model, and reward us for it
1. Analysis based on all IB corporate clients with IB revenue from 2020-22; Franchise revenue includes IB, Payments, Markets, Securities Services, Asset Management, Bank Lending
2. Source: Dealogic. For additional information, see note 2 on slide 43
3. Source: Coalition Greenwich FY22. $20mm-$500mm
4. Source: Coalition Greenwich Competitor Analytics (Markets, Payments and Securities Services rank), reflecting JPMorgan Chase’s internal business structure and internal revenue, which may differ from externally
disclosed revenue. Rank is based on the Coalition Index Banks. Payments reflects global J.P. Morgan Treasury Services business (CIB and CB). For additional information, see note 1 on slide 43
5. Source: Euromoney’s Private Banking Awards 2023
Slide 23 – We have made tangible progress on our strategic priorities
1. Source: Preqin
2. Source: Dealogic. 2020-2022 average share vs. 2012-2019 average share. For additional information, see notes 2 and 3 on slide 43
3. Source: Pitchbook (for Equity Private Placements) and Preqin (for Private Debt)
4. Source: Dealogic as of May 15, 2023. Excludes A-shares and domestic bond issuances
5. Source: Bloomberg NEF: Energy Transition Investment Trends 2023
6. Source: Dealogic as of January 1, 2023
48
Notes on slide 26
Slide 26 – J.P. Morgan Payments delivered record growth in 2022
1. Source: Coalition Greenwich Competitor Analytics. Reflects global J.P. Morgan Treasury Services business (CIB and CB). Rank is based on the Coalition Index Banks. For additional information, see note 1 on slide 43
2. Source: EY Cash Management Ranking Report
3. Source: The Clearing House (TCH); annual volume originated and received
4. Source: Coalition Greenwich US Large Corporate Cash Management 2022 Program. NPS for J.P. Morgan based on Total Market. 2022 Investor Day represented JPM Target Market
5. Source: Coalition Greenwich Digital Transformation Benchmarking 2022 – Large Corporate Segment
6. Source: Coalition Greenwich Competitor Analytics. SCF represents Supply Chain Finance. Share reflects JPM share of Coalition Index Banks for CIB. Prior period amounts have been revised to conform with the latest
analysis from Coalition Greenwich. For additional information, see note 1 on slide 43
7. Source: Nilson. 2022 Investor Day reflected Global Merchant Acquiring transactions / year of 37B in 2021 which is 41B in 2022
8. Source: Nilson. including Visa/Mastercard, pin and other credit volumes
9. Payment errors divided by total transactions processed
49
Commercial Banking – executing a proven strategy
Organic growth driven by continued investment and expansion into select, high-potential
markets and industries – proven, multi-year track record
EXPANDING OUR CLIENT
FRANCHISE
Enabling our teams to serve our clients in a highly-differentiated manner
Data-enabled, consultative teams, equipped with digital tools and powerful analytics
EMPOWERING OUR TEAMS
Rich data assets and a nearly 600TB cloud-based platform that deliver valuable insights
across the firm and to our clients
BUILDING A DATA-DRIVEN
BUSINESS
Investing to deliver more value to clients through our broad-based capabilities
Innovative solutions to help deepen relationships and drive client acquisition
INNOVATING TO EXTEND OUR
COMPETITIVE ADVANTAGE
Relentless focus on operational excellence to deliver a superior client journey
and drive efficiency
ENHANCING THE CLIENT
EXPERIENCE
Rigorous client selection with a long-term, through-the-cycle approach
Strong credit and control culture, with 2022 NCO rate of 4bps
MAINTAINING FORTRESS
PRINCIPLES
Ongoing expense discipline while investing for the long term
Strong returns in 2022 – 16% ROE, with high-quality, resilient, and diversified earnings
DELIVERING STRONG
FINANCIAL RESULTS
1
First Republic Bank – building on our strength
Add quality clients and expand footprint in high-growth markets
Increase support of communities and nonprofit organizations
Deliver the Firm’s capabilities to new clients
Gain access to top talent in key locations
2
Complement our leading Commercial Real Estate portfolio
Maintain strong credit culture and focus on exceptional
client service
Note: Totals may not sum due to rounding
1 First Republic figures estimated as of April 13, 2023 based on data provided by the FDIC; $173B of loans are prior to fair value marks; $92B of deposits include $30B of deposits from large U.S. Banks
…ALIGNS WITH CB’S CLIENT-CENTRIC APPROACH
60%
13%
12%
6%
8%
Single family
Multifamily
Capital call lines
and business
Commercial real estate
Other
Bold indicates categories
most relevant for CB
FIRST REPUBLIC BANK’S MODEL…
Breakdown of loan portfolio
$173B1
$173B
Loans1
$92B
Deposits1
Exceptional client service Strong credit performance
 Robust technology infrastructure and
firmwide utilities to provide scale
 Strong brand recognition to attract the best
talent with global mobility opportunities
 Community impact delivered at scale
 Deep relationships with businesses
and business owners
 Comprehensive liquidity solutions
 Value-added digital solutions
 Extensive network of 4,700+ branches
 Business Banking franchise creates
client flow into CB as businesses grow
 Powerful data and analytics leveraged
across lines of business
JPMorgan Chase platform drives competitive advantage and unmatched value for CB clients
AWM
Corporate CCB
Brand
Community
Impact
Branch
Network
Business
Banking
Private
Bank
Asset
Management
Markets
Technology
Payments CIB
Investment
Banking
Commercial
Banking
3
1 Coalition Greenwich Competitor Analytics (CIB rank), reflecting JPMorgan Chase’s internal business structure and internal revenue, which may differ from externally disclosed revenue. Rank is based on the Coalition Index Banks
 The #1 corporate and investment bank
deepens our strategic relationships1
 Global payments platform with
cross-border capabilities
 Investment capacity for long-term
growth and innovation
Commercial & Industrial (C&I) – segmented to best serve our clients
Corporate &
Investment Bank
Business
Banking
22k
Clients
45k
Prospects
Middle Market Banking and
Specialized Industries
Corporate Client Banking and
Specialized Industries
3k
Clients
3k
Prospects
Financial
Institutions
Multinational
Corporations
Franchise
Nonprofit
Beverage
Life Sciences
Energy
Media and
Entertainment
Healthcare
Technology
Agribusiness
Heavy
Equipment
Apparel
Higher
Education
Government
Real Estate Tech & Disruptive
Commerce
Green
Economy
4
$5.1B
Revenue
$3.9B
Revenue
SECTOR EXPERTISE ACROSS 18 SPECIALIZED INDUSTRIES
Note: Revenue reflects FY 2022; prospect and client figures as of December 31, 2022
Commercial Real Estate (CRE) – positioned for through-the-cycle performance
5
Commercial Term Lending (CTL) | #1 multifamily lender in U.S.1
 Term financing of stabilized properties in supply-constrained markets
 Industry-leading origination process delivered with speed and certainty of execution
 Continued innovation and investment in rental payments solutions
Community Development Banking (CDB) | #3 affordable housing lender in U.S.2
 Range of financing solutions for affordable housing
 Programs to revitalize neighborhoods and community development projects
 Over $10B in financing towards creation of 46k+ affordable housing units since 2020
Real Estate Banking (REB)
 Top-tier investors and developers in major U.S. markets
 Portfolio lending on core property types, such as multifamily, industrial, and retail
 Over 50% of revenue driven by payments and liquidity
$1.5B
Revenue
$0.3B
Revenue
$0.7B
Revenue
Deep sector and
market knowledge
Focus on primary,
supply-constrained markets
Limited exposure to riskier
asset classes
Disciplined market, client,
and asset selection
CYCLE-RESISTANT STRATEGY
Note: Revenue reflects FY 2022 and does not include Corporate Client Banking Real Estate; other figures as of December 31, 2022
For footnoted information, refer to slides 23-24
17%
Return on equity
Commercial Banking – decade-long, sustainable growth with strong returns
$7.1
$11.5
2012 2022
+61%
$2.7
$4.2
2012 2022
+56%
$196
$294
2012 2022
+50%
$2.7
$5.9
2012 2022
+121%
$1.6
$3.0
2012 2022
+86%
6
$120
$224
2012 2022
+86%
40%
Overhead ratio
5 bps
Net charge-off rate
REVENUE1 ($B) AVERAGE DEPOSITS ($B) PAYMENTS REVENUE2 ($B) 10-YEAR AVERAGE METRICS
NET INCOME ($B) AVERAGE LOANS ($B) GROSS IB REVENUE3 ($B)
Note: Totals may not sum due to rounding
For footnoted information, refer to slides 23-24
$53
$1,000
$2,000
2010 Old
Target
2022
$1,542
Organic expansion in Middle Market Banking
Middle Market bankers located
within branch network1
93%
Middle Market
clients
22k
Top 100 MSAs in
Middle Market footprint
78
28k Prospects
7k Clients
3x
Growth in average deposit
balances since 2018
Legacy states
Expansion states
Client and prospect density2
7
Target
MIDDLE MARKET NATIONAL COVERAGE EXPANSION MARKET REVENUE GROWTH ($mm)
Note: Figures as of December 31, 2022
For footnoted information, refer to slides 23-24
32% CAGR
Large, cross-border market opportunity
Mexico
Australia
U.S. Netherlands China
Japan
Korea
Hong Kong
Taiwan
Vietnam
Germany
Canada
Trade corridor with $200B+ annual flow
8
1 International Trade Centre (ITC) trade map; bilateral flow calculated based on sum of export and import trade volumes for FY 2021
2 “A vision for the future of cross-border payments;” McKinsey, data as of 2022
Foreign exchange
Strategic advisory
and M&A
Liquidity
Payments
Bilateral trade corridors with
$200B+ annual flow1
13 Trade volume globally2
$24T
CAGR in cross-border trade
flow since 20172
7%
Trade
GLOBALIZATION OF FINANCIAL SERVICES CROSS-BORDER NEEDS
INTERNATIONAL REVENUE ($mm)1
Global solutions and expertise delivered locally
9
$386
$847
$1,000
2017 2018 2019 2020 2021 2022 Target
17% CAGR
 Local expertise with global footprint – covering nearly 3.2k
multinational clients across 30 countries
 Streamlined approach to complex global treasury management
with access to firmwide solutions
 Uniquely positioned to meet clients’ cross-border needs relative to
regional commercial banks
 Disciplined approach to build long-term franchise value –
covering 500+ clients and 2.5k prospects
 Differentiated value through JPMorgan Chase capabilities
including IB, FX/Trade, payments, liquidity, and lending
 Strong results and growth potential – significantly increasing
revenue and quadrupling deposits since 2019
HELPING CLIENTS EXPAND INTERNATIONALLY
SERVING INTERNATIONALLY-HEADQUARTERED CLIENTS
Note: Figures as of December 31, 2022
1 Denotes non-U.S. revenue from U.S. multinational clients and Corporate Client Banking expansion efforts to serve non-U.S. headquartered companies internationally
Committed to being the most important financial services partner to the Innovation Economy
Dedicated CB coverage for VC firms and portfolio companies
Specialized investment banking coverage
Additional capital and liquidity management solutions
through J.P. Morgan Asset Management
Early-stage lending capabilities and payments solutions
Suite of digital assets designed to serve startup clients
2017 2018 2019 2020 2021 2022
39% CAGR
Innovation Economy revenue
Private Bank focus on founders and VC partners
Global reach accelerated by international expansion
10
CONNECT
Portfolio
companies
VC partners &
company founders
Venture Capital
(VC) firms
CIB
CB
AWM
Firmwide strategy Unique assets for clients
UNMATCHED CAPABILITIES TO SERVE THE VC ECOSYSTEM BROAD-BASED COVERAGE AND POWERFUL SOLUTIONS
CB – EXECUTION OF A LONG-TERM STRATEGY
Positioned to serve clients through every stage of life-cycle
Disciplined, focused approach to Private Equity coverage
of North American IB wallet is sponsor-related2
37%
Global Private Equity dry powder1
$1.2T+
Expansive Middle Market reach of 22k clients and
45k prospects
Focused CB coverage team for Middle Market
financial sponsors
Dedicated advisory and IB coverage resources for
Middle Market sponsors and portfolio companies
Leading leverage finance and Debt Capital Markets teams
Risk discipline through specialized credit and structuring teams
2017 2022
2.1k
3.2k
U.S. PE Middle Market dry powder1
2017 2022
$332B
$421B
U.S. PE Middle Market deal count1
Direct lending solutions provide full range of financing
alternatives
11
SIGNIFICANT OPPORTUNITY IN PRIVATE EQUITY (PE)…
…WITH TREMENDOUS MIDDLE MARKET POTENTIAL
UNMATCHED CAPABILITIES TO CAPTURE OPPORTUNITY
For footnoted information, refer to slides 23-24
1 Includes gross revenues earned by the Firm, that are subject to a revenue sharing arrangement with the CIB, for products sold to CB clients through the Investment Banking, Markets or Payments businesses. This includes revenues related to fixed income and equity markets products
Delivering the #1 corporate and investment bank to CB clients
2012 2022
$1.6
$5.1
$3.0
$4.0
Expanding regional IB coverage with focus on Middle Market
12
Green Economy
International
Middle Market Innovation Economy Private Equity
Healthcare
CB GROSS INVESTMENT BANKING REVENUE1 ($B)
TARGETED GROWTH
INVESTING TO GROW SHARE
6% CAGR
Adding M&A and equity private placement capacity
Deepening our coverage across our growing franchise
Focused on targeted market opportunities
Target
Robust growth in payments and liquidity
2017 2018 2019 2020 2021 2022
$3.8
$4.4 $4.3 $3.8 $3.8
$5.9
9% CAGR
2017 2018 2019 2020 2021 2022
$177 $171 $173
$238
$302 $294
11% CAGR
Actively monitoring deposit market fundamentals
Continued momentum in 2023 –
1Q23 Payments revenue up 98% YoY
13
Uplift in liquidity revenue from higher deposit margins
Strong organic growth through client acquisition and
market share gains
Increased fee revenue driven by strength of our offering and
ongoing investments
~30% of 2022 Middle Market average deposit balances
generated by clients acquired since 2017
Betas managed dynamically through the cycle for each
segment of the business
Balances impacted by expected outflows to higher-yielding
alternative solutions
CB PAYMENTS REVENUE1 ($B) AVERAGE CB DEPOSIT BALANCES ($B)
Note: Totals may not sum due to rounding
For footnoted information, refer to slides 23-24
High-quality loan portfolios
2017 2018 2019 2020 2021 2022
$96 $99 $100
$110
$98
$110
2017 2018 2019 2020 2021 2022
$102 $106 $108 $109 $107 $114
Average 1Q23 loans for CB up 1% quarter-over-quarter, as clients adjust to higher interest rates and economic uncertainty
14
11% increase YoY, driven by higher revolver utilization and
new loan demand
Market is taking a modestly more conservative approach to
credit quality, leverage, and pricing
#1 overall syndicated lender in Middle Market1
7% increase YoY, driven by growth in term lending and
affordable housing
Reduced purchase activity and demand for refinancing
driven by higher interest rates
Elevated level of maturities over next few years
AVERAGE C&I LOANS ($B) AVERAGE CRE LOANS2 ($B)
Note: Commercial and Industrial (C&I) and Commercial Real Estate (CRE) groupings used herein are generally based on client segments and do not align with regulatory definitions
For footnoted information, refer to slides 23-24
Maintaining risk discipline – C&I
 Portfolio credit quality remains strong
 Diversified across industries and regions
 88% of non-investment grade exposure is secured1
 Disciplined, through-the-cycle underwriting
 Dedicated underwriters for targeted industries
 Appropriately reserved for current market environment
2.0%
0.1%
2008 2010 2012 2014 2016 2018 2020 2022
Commercial Banking Peer Average
 Supply chain disruption and inventory shortages have eased
 Higher interest rates and inflation driving margin compression for
certain clients
 Closely watching potentially vulnerable sectors for stress
 Detailed downturn playbook to ensure readiness across a range
of economic scenarios
27%
16%
12%
11%
5%
5%
4%
4%
16%
Consumer & Retail
Industrials
Healthcare
Tech, Media & Telecomm
Oil & Gas
State & Municipal Gov't
Utilities
Automotive
Other
15
1.0%
0.2%
2008
BREAKDOWN BY INDUSTRY2 NET CHARGE-OFF RATE (%)3
MARKET COMMENTARY
SUMMARY
Note: Metrics are as of December 31, 2022 unless otherwise noted
For footnoted information, refer to slides 23-24
Maintaining risk discipline – CRE
 Strong credit performance – FY 2022 NCOs of ~$1mm
 Focused on asset classes with strong through-the-cycle performance
 Over 60% of loans in Commercial Term Lending multifamily portfolio
 Granular portfolio with average loan size of ~$2mm
 Secured by class B/C properties
 Portfolio remains high quality – LTV of ~49%, DSC of 1.8x1
 Minimal exposure in hospitality, homebuilders, condos, and land
67%
9%
9%
5%
10%
0.9% 0.0%
2.3%
3.3%
2008 2010 2012 2014 2016 2018 2020 2022
Commercial Banking Peer Average
16
 Monitoring impact of market liquidity on pricing and yields
 Office: ~9% of CRE exposure
 Majority class A with top tier sponsorship
 Adequately reserved for market uncertainty
 Construction: ~8% of CRE exposure, excluding Affordable Housing
 Highly-selective portfolio
 Majority with repayment recourse of ~30% or more
Multifamily
Industrial
Office
Retail
Other
BREAKDOWN BY PROPERTY TYPE2 NET CHARGE-OFF RATE (%)3
MARKET COMMENTARY
SUMMARY
Note: Metrics are as of December 31, 2022 unless otherwise noted
For footnoted information, refer to slides 23-24
2019 2022 1Q23 Target
JPM CB OH ratio 40% 41% 37% 40%+/-
CB peer avg. OH ratio2 46% 46% 44% –
Strong operating efficiency while investing in our franchise
$3.3
$3.8
$0.7
$0.1
$0.4
$0.2
$0.9
$0.1
$0.4
$0.2
$4.3
$1.0
Volume- &
revenue-driven
Structural Investments 2022 2023
Outlook
Investments
Structural
Volume- &
revenue-driven
$4.0
$4.7
$5.3
2021
+17%
+13%
Investments Volume- & revenue-driven
 Performance-driven comp
 Growth-driven middle office
Structural
 Front office (2+ year tenure)
 Middle/back office
 Technology (run the bank)
 Support functions (e.g., risk)
Investments
 Technology, product, data,
and analytics
 Bankers
 Sales enablement
 Client experience
 Operational excellence
17
Volume- & revenue-driven / Structural
Note: Totals may not sum due to rounding and exclude the impact of the First Republic Bank transaction
For footnoted information, refer to slides 23-24
BREAKDOWN OF EXPENSE
CB ADJUSTED EXPENSE ($B)1
150
Data sources incorporated
167mm+
Companies mapped
23k+
Firmwide users in 2022
18
Cloud-based, client-focused data platform delivering tremendous value
Client
360
External data
Transaction
data
Internal data
Service
activity
CSAT / NPS /
Surveys1
Digital
usage
Capital raised
Company
research
Firmographics
° IB activity
Client value
 Business optimization
 Peer benchmarking
 Cash flow forecasting
Sales enablement
 New lead generation
 Targeted solutioning
 Pricing optimization
Risk decisioning & portfolio mgmt.
 Dynamic portfolio management
 Enhanced risk analytics
 Enriched credit approvals
Operational excellence
 Servicing automation & analytics
 Fraud prevention analytics
 Targeted quality control
DELIVERING BUSINESS VALUE
MEASURING PROGRESS
1 Client Satisfaction (CSAT) and Net Promoter Score (NPS)
Pricing analytics tools to optimize
loan and deposit pricing
Digital, mobile, interactive marketing tools
and collateral to maximize client interactions
Workflow optimization through cross-
functional collaboration and connectivity
Solutions-oriented coverage teams
enabled with holistic view of clients
Targeted training sessions to ensure bankers
are fluent on latest product innovations
Timely market and industry insights to identify
and prioritize opportunities and increase proactivity
Client coverage teams enabled with data-driven tools, insights, and analytics
Client satisfaction
Banker productivity Speed to decision Win rate Revenue Cost
19
Relentless focus on client experience and operational excellence
Client satisfaction Speed Operational risk
Product complexity
Operating leverage Cost to serve
1
Client solutioning
 Engage in analytics-
driven solutioning
 Increase 3rd party
integrations for
connectivity
 Use client insights to
inform new designs
KYC
 Minimize client impact
 Streamline and digitize
documentation
 Automate existing
manual processes
Onboarding
 Reduce onboarding
cycle times
 Streamline and digitize
documentation
 Expand client training
and enablement
Lending
 Enhance data-driven
decisioning
 Increase speed to
commitment
 Simplify client journey
Content delivery
 Deliver digital targeted
JPMC content
 Offer data-driven
analytics and insights
20
Servicing
 Streamline service
channels
 Reduce inquires through
self-service and
product improvements
 Improve case
productivity
2017 2017-2022
Execute growth
initiatives
(longer-term
revenue targets)
Maintain expense
discipline
Optimize
returns
Target
2022
Investment banking2 $2.4B $4.0B
5% CAGR
$3.0B
Overhead ratio 40% 40%+/-
41% 40% average
17%
Return on equity 18%+/-
16% 17% average
Record
Middle Market expansion $0.6B $2.0B
20% CAGR
$1.5B
CB International1 $0.3B $1.0B
17% CAGR
$0.8B
Progress towards targets, driving strong, consistent returns for shareholders
21
1 Denotes non-U.S. revenue from U.S. multinational clients and Corporate Client Banking expansion efforts to serve non-U.S. headquartered companies internationally
2 Includes gross revenues earned by the Firm, that are subject to a revenue sharing arrangement with the CIB, for products sold to CB clients through the Investment Banking, Markets or Payments businesses. This includes revenues related to fixed income and equity markets products
COMPLETE, GLOBAL, AND DIVERSIFIED
 Unmatched ability to support clients’ needs as they grow
 Local delivery of global expertise and broad-based capabilities
 Differentiated platform and competitive advantage of
JPMorgan Chase
Commercial Banking – executing a proven strategy
STRONG, CONSISTENT FINANCIAL PERFORMANCE
 Diversified, resilient revenue streams
 Operating leverage achieved through industry-leading efficiency ratio
 Through-the-cycle growth and steady returns
LARGE AND GROWING ADDRESSABLE MARKET
 Significant organic growth potential
 Extensive reach, both domestically and internationally
 Focused client coverage with specialized expertise
SUSTAINED INVESTMENT WITH COMPOUNDING RESULTS
 New bankers in high-potential markets and industries
 Digital innovation delivering tangible results
 Data-driven strategy anchored by cloud-based, client-centric platform
FORTRESS PRINCIPLES
 Rigorous underwriting and client selection
 Credit portfolio positioned to weather market uncertainty
 End-to-end management focus across compliance and controls
GREAT PEOPLE AND A WINNING CULTURE
 Consultative, solutions-oriented client coverage teams
 Empowered and data-enabled organization
 Focus on driving community impact
22
Slide 5 – Commercial Real Estate (CRE) – positioned for through-the-cycle performance
1. Home Mortgage Disclosure Act data, U.S. Consumer Financial Protection Bureau
2. Affordable Housing Finance, 2022 Lenders Survey, February 2023
Slide 6 – Commercial Banking – decade-long, sustainable growth with strong returns
1. In the first quarter of 2020, the Merchant Services business was realigned from CCB to CIB. With the realignment, revenue is now reported across CCB, CIB and CB based primarily on client
relationship. Financials from 2012 were revised to conform with the current presentation
2. In the fourth quarter of 2022, certain revenue from CIB markets products was reclassified from investment banking to payments. In the first quarter of 2020, the Merchant Services business
was realigned from CCB to CIB. With the realignment, revenue is now reported across CCB, CIB and CB based primarily on client relationship. Financials from 2012 were revised to conform
with the current presentation. Includes growth of $161mm that is also included in the Gross IB Revenue metric
3. Includes gross revenues earned by the Firm, that are subject to a revenue sharing arrangement with the CIB, for products sold to CB clients through the Investment Banking, Markets or
Payments businesses. This includes revenues related to fixed income and equity markets products
Slide 7 – Organic expansion in Middle Market Banking
1. Does not include Middle Market offices outside the U.S.
2. Circles indicate number of clients and prospects in each city
Slide 11 – Disciplined, focused approach to Private Equity coverage
1. PitchBook Data, Inc.
2. Dealogic data for revenue reported between January 1, 2022 through December 31, 2022 in North America only, excluding Money Market, Short-term debt, and ECM Shelf
Slide 13 – Robust growth in payments and liquidity
1. In the fourth quarter of 2022, certain revenue from CIB markets products was reclassified from investment banking to payments. In the first quarter of 2020, the Merchant Services business
was realigned from CCB to CIB. With the realignment, revenue is now reported across CCB, CIB and CB based primarily on client relationship. Financials from 2017-2021 were revised to
conform with the current presentation
Notes for slides 5-7, 11, 13
23
Slide 14 – High-quality loan portfolios
1. Refinitiv
2. Includes Corporate Client Banking Real Estate
Slide 15 – Maintaining risk discipline – C&I
1. The Firm considers internal ratings equivalent to BB+/Ba1 or lower as non-investment grade
2. Portfolios based on sub-LOB are not regulatory definitions; totals may not sum due to rounding and are based on committed exposure
3. Peer average based on CB-equivalent CRE segments or wholesale portfolios at BAC, CMA, FITB, KEY, PNC, USB, WFC, which may not fully align with CB segmentation
Slide 16 – Maintaining risk discipline – CRE
1. Loan to value (LTV) and debt service coverage (DSC) are weighted average calculations of multifamily Commercial Term Lending portfolio for FY 2022
2. Portfolios based on sub-LOB are not regulatory definitions; totals may not sum due to rounding and are based on committed exposure
3. Peer average based on CB-equivalent CRE segments or wholesale portfolios at BAC, CMA, FITB, KEY, PNC, USB, WFC, which may not fully align with CB segmentation
Slide 17 – Strong operating efficiency while investing in our franchise
1. Adjusted expense represents total CB noninterest expense less CB legal expense of $1.7mm for FY 2021 and $5.1mm for FY 2022, respectively
2. Peer average based on CB-equivalent segments at BAC, CMA, FITB, KEY, PNC, TFC and WFC
Notes for slides 14-17
24
1
Asset & Wealth Management overview
DIFFICULT TO
REPLICATE
73%
revenue recurring (10Y avg.)
95%
retention of top senior talent
100+ year
client relationships and track records
MARKET-LEADING
FRANCHISE
$4.3T
AUS1
90%+
JPMAM LT MF 10Y AUM
> peer median2
25%+
healthy ROE and margin
Complete Global Diversified At scale
For footnoted information, refer to slide 18
KEY STRATEGIC PILLARS
#1 and #2
active ETFs in the world are JPMAM3
5
M&A deals successfully closed since 2020
DRIVING INNOVATION &
VALUE CREATION
4,500
dedicated technologists
FORTRESS
PRINCIPLES
2,000+
risk and controls professionals
1bp
net charge-off rate (10Y avg.)
~$400mm
investment research spend
2
6%
7%
5%
AWM is a consistent growth franchise
29%
10Y range: 26%-37%
Pretax margin1
26%
10Y range: 21%-33%
ROE3
Increase YoY Decrease YoY
GPB AM
0.01%
10Y range: 0.05%-(0.01)%
Net charge-off rate3
2012 2013 2014 2015 2016 2017 2018 2019 2020 2021 2022
2.0 2.3 2.3 2.3 2.4 2.7 2.6
3.1
3.7
4.3 4.0
2012 2013 2014 2015 2016 2017 2018 2019 2020 2021 2022
10.0 11.5 12.2 12.3 12.2 13.2 13.4 13.6 14.2
17.0 17.7
2012 2013 2014 2015 2016 2017 2018 2019 2020 2021 2022
2.8 3.3 3.4 3.2 3.5 3.6 3.8 3.8 4.0
6.3 5.8
2.0
2.8
10.0
Market-leading franchise
AWM 6%
GPB 7%
AM 5%
10Y CAGR
AWM 8%
GPB 10%
AM 6%
10Y CAGR
AWM 7%
GPB 9%
AM2 6%
10Y CAGR
REVENUE1 ($B)
PRETAX INCOME1 ($B)
ASSETS UNDER SUPERVISION1 (AUS) ($T)
10-YEAR AVERAGE
Note: Totals may not sum due to rounding
For footnoted information, refer to slide 18
3
Powered by two market-leading franchises
2012 2022
10Y
Growth
⚫ AM ranking by AUM3 (#)
⚫ AM ranking by active AUM3 (#)
⚫ Equity
⚫ Fixed Income
⚫ Multi-Asset Solutions
⚫ Liquidity
⚫ U.S. LT assets4
⚫ International LT assets4
⚫ Global Funds LT assets
⚫ Global Institutional LT assets
⚫ AM advisor revenue productivity ($mm)
#7
#4
$286
$376
$72
$443
$471
$255
$335
$391
$8.2
#5
#3
$618
$644
$240
$653
$974
$521
$742
$754
$12.9
2012 2022
10Y
Growth
⚫ GPB ranking2 (#)
⚫ GPB Ultra High Net Worth ranking2 (#)
⚫ Loans
⚫ Deposits
⚫ Brokerage assets
⚫ Managed assets
⚫ U.S. LT assets
⚫ International LT assets
⚫ Clients with $100mm+ (#)
⚫ Managed accounts (#)
⚫ GPB advisor revenue productivity ($mm)
#3
#1
$79
$141
$225
$212
$189
$61
1,346
0.3mm
$1.8
#1
#1
$214
$233
$512
$559
$510
$107
3,153
1.3mm
$3.0
2.1x
2.0x
1.7x
3.3x
1.5x
2.2x
1.6x
ASSET & WEALTH MANAGEMENT
1.7x
2.6x
2.7x
1.8x
2.3x
4.0x
2.7x
2.3x
1.6x
GLOBAL PRIVATE BANK1 (GPB) ASSET MANAGEMENT (AM)
2.2x
1.9x
+2
-
+2
+1
End of period (EOP), $B, unless noted
Client asset flows ($B)1
$61 $49
$152
2012 2022 1Q23
$1.7
$3.4 $3.7
2012 2022 1Q23
$177
$372 $395
2012 2022 1Q23
Traditional assets ($T)1,5 Alternatives assets ($B)1,5
Market-leading franchise
Note: Totals may not sum due to rounding
For footnoted information, refer to slide 18
4
$1.4
$9.4
2021 Volume- &
revenue-
related
Structural Investments
$1.8
$10.0
2023 Outlook
$10.1
$2.2
Investments
Structural
Volume- &
revenue-
related
2022
$10.8 $0.0
$0.6
$0.4 $11.8
($0.1)
$0.2
$0.4 $12.3
Expense discipline and focused investing
Investments
TOTAL ADJUSTED EXPENSE ($B)1
Note: Totals may not sum due to rounding
For footnoted information, refer to slide 18
Market-leading franchise
Investments
⚫ Technology
⚫ Capabilities
⚫ Advisors
Structural
⚫ Front office (3+ years of tenure)
⚫ Middle / back office
⚫ Support functions (e.g., risk, controls)
⚫ Technology (“run the bank” and efficiencies)
Volume- & revenue-related
⚫ Performance-driven compensation
⚫ Fund distribution fees in AM business
BREAKDOWN OF EXPENSE
5
Technology is the foundation of future growth
Customer and
client experiences
Driving innovation & value creation
Product and
platform
development
Modernize
technology
Embed data and insights into everything
Drive software
development
excellence
Proactively defend against cyber threats
Deliver best-in-class products,
platforms and experiences
Strengthen our development
capabilities and infrastructure
Unlock
the power of data
Protect the Firm
and our customers
strategic apps on Cloud
(50% of infra. spend)
Millions
of research and data reports
analyzed in seconds
50+ AI pilots across AWM
84%
Python trained
non-tech employees
5,400
hours saved through
low-code solutions
131,000
30Y
of proprietary research
into Spectrum GPT
traded on Morgan Money
portal YTD1 (2x YoY)
$1T+ +13%
increase in fraud attempts
YTD3 (after record 2022)
11,000
family offices / clients
attended cyber teach-ins
$31mm fraud prevented YTD1
rated CRM for
Global Private Banks2
#1
reduction in time on custom
performance reporting
99%
For footnoted information, refer to slide 18
6
We’ve remained focused on our growth drivers
Scaling
Asset Management
Building
Alternatives
Executing
M&A
60+
year legacy and track records
~$100B
2Y fundraising
#1
active LT fund flows (5Y)2
#1
active ETF flows (YTD & 3Y)3
Expanding
Global Private Bank
Powering
U.S. Wealth Management
3,100+
GPB Client Advisors
~$1B
asset flows / day7
83
countries with
GPB client coverage
~500
new investors / day6
~4,800
branches
100%
ownership in China JV
2x
revenue in the next 3Y
~$400B
AUS, growing platform with
diversified asset mix4
#3
active Asset Manager (AUM)1
5,000+
U.S. WM Client Advisors
300+
opportunities assessed5
Driving innovation & value creation
For footnoted information, refer to slide 19
1 2 3 5
4
7
2017 2022
18%
Scaling Asset Management
Drive growth through Active ETFs, Separately Managed Accounts (SMAs) and Model Portfolios
STRONG PERFORMANCE
% JPMAM LT MF 10Y AUM > peer median1
Fixed
Income
Multi-Asset
Solutions &
Alternatives
Total
JPMAM
Equity
2012 2022
72%
90%
2012 2022
79%
95%
2012 2022
66%
91%
2012 2022
65%
77%
2012 2022
LT AUM2
1
2012 2022
2012 2022
2012 2022
7%
6%
6%
4%
12%
8%
7%
6%
DRIVING SCALE
CAGR
JPM
$0.2
$54.1
2017 2022
196% #2 in AUM up from #20 in 20173
#1 in flows YTD & 3Y4
ETF Suite of the Year award
(Active ETFs)5
SMAs and Model Portfolios
Active ETFs
FUTURE GROWTH
CAGR
CAGR
Record YTD SMA flows
surpassing FY 20226
10x model usage since 2017
200,000+ external advisors
have access to JPMAM models
AUM ($B)
SMA AUM
Industry
Driving innovation & value creation
For footnoted information, refer to slide 19
8
Building Alternatives
Leverage legacy of strong investment performance to innovate and grow
GPB 3rd Party
Liquid Alts
Hedge Funds
Private Credit
Private Equity
Other
Real Estate
& Infrastructure
2019 1Q23
$265
$395
+49%
AUS, $B7,8
10+
Years
30+
Years
• Commercial Mortgage Loans (’61)
• Real Estate (’70)
• Private Equity (’80)
• Hedge Funds (’92)
• Liquid Alternatives (’98)
• Infrastructure (’06)
• Transportation (’10)
• GPB Vintage Funds (’11)
<10
Years
• Opportunistic Private Credit (’17)
• Timberland (acquired ’21)
• Growth Equity (’21)
18%
Net IRR
NEW
Private Markets for
retail investors
$32B
U.S. Core fund
NAV2
NEW
Non-traded REIT
#1
open-end U.S.
Core fund1
200+
advisory board
seats
14%
net IRR5
NEW
Venture Capital
20+
underlying funds in Buyout,
Healthcare, Impact & Credit4
14%
net IRR6
NEW
Opp. Credit Fund II
NEW
Sustainable Growth
Equity team
NEW
Life Sciences team
4x
AUM 3Y growth
~$1B
commitments made
since inception
REAL ESTATE (50Y+)
PRIVATE EQUITY (40Y+)
INFRASTRUCTURE (10Y+)
GPB VINTAGE FUNDS (10Y+)
GROWTH EQUITY (2Y+)
OPPORTUNISTIC PRIVATE CREDIT (5Y+)
8% Public Market Equivalent3
LEGACY AND INNOVATION GROWING, DIVERSIFIED ASSET MIX
$34B
NAV2
~1,000
underlying
assets2
NEW
Access vehicles for
HNW+ individuals
2
Driving innovation & value creation
For footnoted information, refer to slide 20
Growth
9
Executing M&A
Focus on integration for synergies and solutions
Tax-smart investment
strategies at scale
Timberland investing
and management
Custom, values-based
metrics / port. diagnostics
Cloud-based
share plan software
Onshore China
asset manager
$1.5B aligned to OI insights
and client reporting
1mm+ in plan participants5
from over 100 countries
1,000+ onsite company visits,
annually
9x AUM since acquisition1 13% gross total return (1Y)2
6 divest restrictions on
1.2k+ accounts ($400mm4)
42% growth in plan participants
since acquisition6
$23B+ in client assets
5 Tax-Smart strategies $5.5B in AUM; recent addition
of 250k+ acres3
8 model portfolio providers 122mm+ tCO2e
above-ground stored carbon
SI Resource Center to
educate advisors / deliver insights
$185B in assets under admin.5
64mm+ clients across China
3
Driving innovation & value creation
For footnoted information, refer to slide 20
10
JPMC WORKPLACE
Powering U.S. Wealth Management
Our recent acquisitions will help power next-generation solutions
JPMC CONNECTWEALTH
AWM CCB AWM CCB CB CIB
Employee
banking
Retirement
Share plan
Financial
wellness
Comprehensive workplace solution for
public & private companies and employees
Monitor sector
exposures and
wash sales
Account
aggregation
Values-aligned
investments
Integrated digital
portal
Cross-asset class tax-loss harvesting
and account customization for clients
J.P. Morgan SMA platform + +
WEALTH MANAGEMENT SOLUTIONS
Trusts &
estates
Insurance &
annuities
Brokerage
investments
Share
plan
Deposits &
custody
SBL &
custom lending
Mortgages
Managed
investments
Alternatives
Fund
finance
4
+ +
Driving innovation & value creation
11
2019 2022
2.3x
Expanding Global Private Bank
Continue the momentum with high-quality new hires and world-class training
2019 2022
4.5x
Training hours per GPB new hire
TRAINING
Net new hires, GPB and U.S. WM client advisors1
HIRING
U.S. WM GPB
2019 2022
2.1x
CONTRIBUTION
New GPB advisor revenue as % of GPB revenue1,2
+ =
5
Driving innovation & value creation
For footnoted information, refer to slide 20
12
EOP balances ($B)8
EOP balances ($B)2
Disciplined lending, deposits and money market funds
EOP balances ($B)2
Net charge-off / (recovery) rate (%)3
Vast majority
of net deposit migration
stays within the firm5
#1
in Global Institutional
Money Market Funds AUM6
81%
of clients also utilize
other solutions4
Fortress principles
97%
of loans
collateralized
#1
Jumbo mortgage provider1
LENDING DEPOSITS
$129
$146
$158
$187
$218 $214 $211
2017 2018 2019 2020 2021 2022 1Q23
$141 $133
$143
$199
$282
$233 $226
2017 2018 2019 2020 2021 2022 1Q23
MONEY MARKET FUNDS
$370
$488
$563
$688
$754
$680
$797
2017 2018 2019 2020 2021 2022 1Q23
77%+
increase in searches for
J.P. Morgan Global Liquidity7
0.01 0.00
0.00
0.01
(0.01)
0.02
0.00
For footnoted information, refer to slide 21
13
EMPOWERING CLIENTS THROUGH CHALLENGES
Helping clients navigate challenging times
Fortress principles
$246B
$536B
2006 2009
+118%
$233B
$439B
2011 2014
+88%
$271B
$375B
2019 2021
+38%
2008 crisis
CAPTURING MONEY-IN-MOTION DURING PIVOTAL MARKET EVENTS
Rebound post-GFC Low rates
Money market funds1 LT active funds2 Income strategies
AUM
Growth
40k new GPB accounts opened in 10 weeks7
$136B Liquidity net flows YTD4
Insights
+2 points increase in OSAT in one quarter6
Fiduciary mindset Impact
22mm portfolio positions analyzed daily
3.8mm Guide to the Markets views YTD4
48k Digital Portfolio Insight analyses YTD5
203 4/5-star funds
600+ investment strategies3
2x Eye on the Market engagement YTD4
For footnoted information, refer to slide 21
14
JPMC platform delivers unmatched value through cross-LOB partnership
AWM
CCB CIB
Portfolio
Companies
Co-location
Payments
Securities
Services
Cards
Data
Analytics
Branches
Corp Brand
MLTs
Difficult to replicate
23 Wall
#1 Corporate and
Investment Bank2
#1 Fortune’s
Most Admired Bank4
#1 Retail
Bank1
#1 Commercial
Bank3
POWER OF ONE FIRM
CB
Local cross-LOB leadership 23 WALL
50
Market Leadership
Teams (MLTs)
700+
senior leader members
Deliver the Firm’s breadth & expertise locally to
our clients, our employees, and in the
communities where we live and do business
Provide institutional access to the Firm’s
deal flow, balance sheet, intellectual capital, &
co-invest opportunities with world’s largest families
16+ years
of avg. tenure at JPM
Families with total net worth >$1B
1,000+ families & principals globally
$5T+ in private family capital
$250mm+ transaction size
1st annual survey with participation from
77 principals across the globe ($5B avg. net
worth), with assets in 18 different industries
SCOs
43
Senior Country
Officers (SCOs)
U.S. International
For footnoted information, refer to slide 21
15
2013 2014 2015 2016 2017 2018 2019 2020 2021 2022 1Q23
Fixed Income
Equity
Multi-Asset
Alternatives
Liquidity
Brokerage
Custody
Deposits
Maximizing our strengths to deliver value to clients and shareholders
≥$0 <$0
Asset
Class /
Product
Channel
GPB + U.S. WM
Retail
Institutional
Region
U.S.
LatAm
EMEA
Asia
AUM
AUS
Assets
Assets
Assets
=
AUS
+
AUM
19th consecutive year of net new inflows
JPMC TOTAL CLIENT ASSET FLOWS ($B)1
(LT AUM + Liquidity + AUS + U.S. WM AUS + CPC Deposits)
(2Q18-1Q23)
Publicly traded peers only
GS5 $0.7
#5
BLK2 $1.8
#1
$1.3
#2 MS3
SCHW4 $0.8
#4
#3 JPMC1 $1.2
5Y TOTAL CLIENT
ASSET FLOWS ($T)
Diversified, leading businesses
to deliver strong financial results
MARKET-LEADING
FRANCHISE
Constantly investing & innovating
for our clients and shareholders
DRIVING INNOVATION &
VALUE CREATION
Resilience through diligent
risk management and controls
FORTRESS
PRINCIPLES
Mutual strategic benefits of
being part of the JPMC ecosystem
DIFFICULT
TO REPLICATE
For footnoted information, refer to slide 21
16
Exceeding expectations and achieving targets
Meeting targets
Results range1
3- to 5-year
targets (+/-),
as of 2020
5% 25%+
25%+
4%
REVENUE
GROWTH
PRETAX
MARGIN
ROE
LT AUM
FLOWS
✓ ✓ 
5% 8% 2%
2021 2022
2020
✓ ✓
✓
5% 19% 5%
2021 2022
2020
✓ ✓ ✓
28% 37% 33%
2021 2022
2020
✓ ✓ ✓
28% 33% 25%
2021 2022
2020
For footnoted information, refer to slide 22
17
Unparalleled strength of JPMorgan Chase
JPMC
CCB CIB
AWM
#1 IB fees2
#1 Markets revenue3
#1 Treasury Services revenue4
#1 Private Bank7
#1 LT active fund flows (5Y)8
#1 U.S. retail deposits
#1 U.S. credit card issuer1
#1 Primary business bank
#1 Multifamily lender5
#1 Middle Market bookrunner6
FORTUNE’S TOP 5 MOST ADMIRED
COMPANIES IN THE WORLD
CB
For footnoted information, refer to slide 22
18
Notes on slides 1-5
Slide 1 – Asset & Wealth Management overview
1. Total AUS as of March 31, 2023. AUS = Assets Under Supervision. AUS also referred to as client assets
2. All quartile rankings, the assigned peer categories and the asset values used to derive this analysis are sourced from the fund ranking providers. Quartile rankings are done on the net-of-fee absolute return of
each fund. The data providers re-dominate the asset values into U.S. dollars. This % of AUM is based on fund performance and associated peer rankings at the share class level for U.S.-domiciled funds, at a
“primary share class” level to represent the quartile ranking of U.K., Luxembourg and Hong Kong funds, and at the fund level for all other funds. The “primary share class” is defined as C share class for
European funds and Acc share class for Hong Kong and Taiwan funds. In case the share classes defined are not available, the oldest share class is used as the primary share class. The performance data
could have been different if all share classes would have been included. Past performance is not indicative of future results. Effective September 2021, the Firm has changed the peer group ranking source
from Lipper to Morningstar for U.S.-domiciled funds (except for Municipal and Investor Funds) and Taiwan-domiciled funds, to better align these funds to the providers and peer groups it believes most
appropriately reflects their competitive positioning. This change may positively or adversely impact, substantially in some cases, the quartile rankings for one or more of these funds as compared with how they
would have been ranked by Lipper for this reporting period or future reporting periods. The source for determining the rankings for all other funds remains the same. The classifications in terms of product
suites and product engines shown are J.P. Morgan’s own and are based on internal investment management structures
3. Source: Bloomberg
Slide 2 – AWM is a consistent growth franchise
1. In the fourth quarter of 2020, the Firm realigned certain Wealth Management clients from Asset & Wealth Management to Consumer & Community Banking. Prior-period amounts have been revised to conform
with the current presentation. Historical revenue revised as a result of the adoption of the new accounting guidance for revenue recognition, effective January 1, 2018
2. Global Funds and Global Institutional client segments
3. In the fourth quarter of 2020, the Firm realigned certain Wealth Management clients from Asset & Wealth Management to Consumer & Community Banking. Before 2018, amounts have not been revised to
conform with the current presentation
Slide 3 – Powered by two market-leading franchises
1. In the fourth quarter of 2020, the Firm realigned certain Wealth Management clients from Asset & Wealth Management to Consumer & Community Banking. Prior-period amounts have been revised to conform
with the current presentation, unless otherwise noted
2. Source: Euromoney
3. Source: Public filings, company websites and press releases. Active / passive split based on most recently available data
4. Global Funds and Global Institutional AUM
5. Client assets = Traditional Assets + Alternatives Assets + Deposits
Slide 4 – Expense discipline and focused investing
1. Adjusted expense is a non-GAAP financial measure, which represents noninterest expense excluding legal expense of $113mm, $25mm, and $41mm for the full-year 2021, 2022, and for the three months
ended in March 31, 2023, respectively
Slide 5 – Technology is the foundation of future growth
1. Data as of April 30, 2023
2. Source: Financial Times
3. Data as of April 30, 2023, YoY growth over same period in 2022
19
Notes on slides 6-7
Slide 6 – We’ve remained focused on our growth drivers
1. Source: Public filings, company websites and press releases. Active / passive split based on most recently available data
2. Source: ISS Market Intelligence Simfund
3. Source: Morningstar. YTD as of April 30, 2023
4. As of March 31, 2023
5. Includes evaluation of potential M&A and Strategic Investment opportunities since January 2020
6. Based on first-time investors and number of business days from January 1, 2023 to March 31, 2023
7. Based on net asset flows and number of business days from January 1, 2023 to March 31, 2023
Slide 7 – Scaling Asset Management
1. All quartile rankings, the assigned peer categories and the asset values used to derive this analysis are sourced from the fund ranking providers. Quartile rankings are done on the net-of-fee absolute return of
each fund. The data providers re-dominate the asset values into U.S. dollars. This % of AUM is based on fund performance and associated peer rankings at the share class level for U.S.-domiciled funds, at a
“primary share class” level to represent the quartile ranking of U.K., Luxembourg and Hong Kong funds, and at the fund level for all other funds. The “primary share class” is defined as C share class for
European funds and Acc share class for Hong Kong and Taiwan funds. In case the share classes defined are not available, the oldest share class is used as the primary share class. The performance data
could have been different if all share classes would have been included. Past performance is not indicative of future results. Effective September 2021, the Firm has changed the peer group ranking source
from Lipper to Morningstar for U.S.-domiciled funds (except for Municipal and Investor Funds) and Taiwan-domiciled funds, to better align these funds to the providers and peer groups it believes most
appropriately reflects their competitive positioning. This change may positively or adversely impact, substantially in some cases, the quartile rankings for one or more of these funds as compared with how they
would have been ranked by Lipper for this reporting period or future reporting periods. The source for determining the rankings for all other funds remains the same. The classifications in terms of product
suites and product engines shown are J.P. Morgan’s own and are based on internal investment management structures
2. Asset classes shown are based on internal investment management structures, which may differ from public reporting. Industry CAGR sourced from McKinsey Performance Lens
3. Source: Morningstar
4. Source: Morningstar. YTD as of April 30, 2023
5. Source: With Intelligence
6. Data as of April 30, 2023
20
Notes on slides 8-11
Slide 8 – Building Alternatives
1. Source: ODCE Core Competitor Snapshot, 4Q22. Rank based on gross asset value
2. As of March 31, 2023
3. Performance as of December 31, 2022. Net performance is net of underlying fees and expenses, net of Advisor management and Advisor incentive fees. Net performance represents PEG fund level cash flows
and valuations, as experienced by the underlying investors in aggregate, and are inclusive of underlying fees and expenses as well as Advisor management and incentive fees. Based on Global Private Equity
vintages launched 2014-2021. Public Market Equivalent is MSCI World
4. As of January 31, 2023
5. Gross Internal Rate of Return (“IRR”) is calculated on cash flows between underlying fund investments and the applicable Vintage fund and is net of Underlying Funds’ investment fees and expenses, but gross of
the applicable Vintage fund’s fees and expenses. Net IRR is calculated on aggregate cash flows between Vintage fund investors and the applicable Vintage fund and is net of the applicable Vintage fund’s fees
and expenses (excluding origination fees). Gross and net IRRs are not necessarily representative of an individual investor’s experience primarily due to tiered management fees, the exclusion of origination fees
paid by investors from the calculation of net IRR and cash flows being measured at the applicable Vintage fund level and not the individual investor level. To the extent the net IRRs reflected the payment of
origination fees and management fees applicable to certain investors such net IRRs would be lower. Based on Offshore vintages. Figures as of June 30, 2022
6. Performance as September 30, 2022. Based on Fund I performance calculated from date of first capital call August 16, 2019 to September 30, 2022 and calculation includes the use of subscription line financing.
From 30 June 2022 Fund IRR is calculated as per U.S. GAAP defined approach. Net calculations include costs, financing fees, and carried interest accrual
7. In the fourth quarter of 2020, the Firm realigned certain Wealth Management clients from Asset & Wealth Management to Consumer & Community Banking. Prior-period amounts have been revised to conform
with the current presentation
8. Prior-period amounts have been restated to include changes in product categorization
Slide 9 – Executing M&A
1. Acquisition announced on December 2020; data as of April 30, 2023
2. Time-weighted total return based on all discretionary funds and separate accounts managed by Campbell Global as of December 31, 2022
3. Announced February 2023
4. Data as of February 1, 2023
5. Data as of April 30, 2023
6. Growth through April 30, 2023. Acquired March 2022
Slide 11 – Expanding Global Private Bank
1. In the fourth quarter of 2020, the Firm realigned certain Wealth Management clients from Asset & Wealth Management to Consumer & Community Banking. Prior-period amounts have been revised to conform
with the current presentation
2. New GPB advisor revenue as % of GPB revenue is the total revenue from new GPB advisors over total GPB revenue
21
Notes on slides 12-15
Slide 12 – Disciplined lending, deposits and money market funds
1. #1 mortgage lender across all home values ($1mm, $3mm, $5mm, $10mm+) for U.S. households with at least $10mm in net worth; source: KYC, Suitability, Lending, Wealth-X, FactSet, PitchBook, CoreLogic
2. In the fourth quarter of 2020, the Firm realigned certain Wealth Management clients from Asset & Wealth Management to Consumer & Community Banking. Prior-period amounts have been revised to conform
with the current presentation
3. In the fourth quarter of 2020, the Firm realigned certain Wealth Management clients from Asset & Wealth Management to Consumer & Community Banking. Before 2018, amounts have not been revised to
conform with the current presentation
4. Clients with account balance of $10k+; other solutions include IM, T&E, Lending, Mortgage, Brokerage/Custody, IRS Annuity
5. Excluding tax payments in 2021-2022
6. Source: iMoneyNet as of May 12, 2023
7. During peak volatility in March 2023
8. Includes assets managed on behalf of other product teams
Slide 13 – Helping clients navigate challenging times
1. Source: iMoneyNet
2. Source: ISS Market Intelligence Simfund
3. Asset Management strategies
4. Data as of May 19, 2023
5. Data as of April 30, 2023
6. Survey data as of November 30, 2022 and March 31, 2023
7. Includes accounts opened from March to May 2023
Slide 14 – JPMC platform delivers unmatched value through cross-LOB partnership
1. See slide 17, footnote 1
2. See slide 17, footnotes 2-4
3. See slide 17, footnotes 5-6
4. JPMorgan Chase ranked #5 overall in most admired companies in the world, and the only bank (financial institution) in the top five
Slide 15 – Maximizing our strengths to deliver value to clients and shareholders
1. Includes Asset & Wealth Management client assets, U.S. Wealth Management investments and Chase Private Client deposits. In the fourth quarter of 2020, the Firm realigned certain Wealth Management
clients from Asset & Wealth Management to Consumer & Community Banking. Prior-period amounts have been revised to conform with the current presentation
2. Total AUM net flows
3. Investment Management total net flows, Wealth Management fee-based asset flows 2018 and Wealth Management net new assets 2019-1Q23. Excludes impact from acquisitions of Solium, E-Trade, Eaton
Vance and Cook Street
4. Investor Services net new assets. Excludes impact from asset consolidation due to acquisitions of TD Ameritrade and USAA’s Investment Management Company
5. Firmwide total AUS net flows. Excludes impacts from acquisitions of NNIP, Verus, S&P Investment Advisory Services, United Capital, and Rocaton, and divestiture of Australia business
22
Notes on slides 16-17
Slide 16 – Exceeding expectations and achieving targets
1. In the fourth quarter of 2020, the Firm realigned certain Wealth Management clients from Asset & Wealth Management to Consumer & Community Banking. Prior-period amounts have been revised to conform
with the current presentation
Slide 17 – Unparalleled strength of JPMorgan Chase
1. Based on 2022 sales volume and loans outstanding disclosures by peers (American Express Company (AXP), Bank of America Corporation, Capital One Financial Corporation, Citigroup Inc. and Discover
Financial Services) and JPMorgan Chase estimates. Sales volume excludes private label and Commercial Card. AXP reflects the U.S. Consumer segment and JPMorgan Chase estimates for AXP’s U.S.
small business sales. Loans outstanding exclude private label, AXP Charge Card, Citi Retail Cards, and Commercial Card
2. Source: Dealogic as of January 2, 2023
3. Source: Coalition Greenwich Competitor Analytics (preliminary for FY22). Market share is based on JPMorgan Chase’s internal business structure and revenue. Ranks are based on Coalition Index Banks for
Markets
4. Source: Coalition Greenwich Competitor Analytics (preliminary for FY22). Reflects global firmwide Treasury Services business (CIB and CB). Market share is based on JPMorgan Chase’s internal business
structure, footprint and revenues. Ranks are based on Coalition Index Banks for Treasury Services
5. Source: S&P Global Market Intelligence as of December 31, 2022
6. Source: Refinitiv LPC, FY22
7. Source: Euromoney
8. Source: ISS Market Intelligence Simfund

J.P. Morgan: Consolidated-Full-Presentation.pdf

  • 2.
    Topics of discussion Firmoverview Operating environment Financial results Outlook Conclusion 1
  • 3.
    We have aproven operating model that is supported by a consistent strategic framework Complete Global Diversified At Scale ⚫ Customer centric and easy to do business with ⚫ Comprehensive set of products and services ⚫ Focus on safety and security ⚫ Powerful brands ⚫ Continuously investing in the future while maintaining expense discipline ⚫ Focus on customer experience and innovation ⚫ Employer of choice for top and diverse talent ⚫ Fortress balance sheet ⚫ Risk governance and controls ⚫ Culture and conduct ⚫ Operational resilience ⚫ Investing in and supporting our communities ⚫ Integrating environmental sustainability into business and operating decisions ⚫ Serving a diverse customer base ⚫ Promoting sound governance Exceptional client franchises Unwavering principles Long-term shareholder value Sustainable business practices 2
  • 4.
    We have leadingclient and customer-centric franchises CCB AWM CB CIB IB fees4 Markets revenue5 Treasury Services revenue6 Rated Private Bank in the World7 LT active fund flows (5-yr)8 U.S. retail deposits1 U.S. credit card issuer2 Primary Business Bank3 Multifamily lender9 Middle Market bookrunner10 CCB U.S. retail deposits1 7.1% 10.9% Credit card sales11 20.5% 22.4% Client investment assets $159B $647B ⚫ #1 retail deposit share in top three U.S. markets: NYC, LA and Chicago CIB Investment Banking fees4 7.7% 7.9% Markets revenue5 8.6% 11.6% 5.6% 8.4% ⚫ Operate in 100+ markets globally CB Gross IB revenue13 $1.6B $3.0B Payments revenue14 $2.7B $5.9B ⚫ International presence in 34 locations and 66% CB Int’l revenue growth '19-'22 AWM Client assets15 $2.0T $4.0T 72% 90% ⚫ 19 straight years of positive net new flows; $1.6T since 201217 Market share 2012 2022 +380bps +260bps +190bps +3.5x +4.1x +3.5x +20bps +3.5x +300bps +3.5x +280bps +3.5x +1.9x +3.5x +121% +3.5x +100% +3.5x +18ppts Long-term mutual fund AUM outperforming over 10 years16 Treasury Services revenue6 For footnoted information, refer to slide 21 12 3
  • 5.
    Being complete, global,diversified and at scale enables us to meet clients’ and customers’ needs across the spectrum and through cycles… CCB2 CIB2 CB AWM Corp. Revenue1 by segment ($B) $111 $123 $132 51 51 55 38 49 48 9 9 12 13 14 18 2018 2020 2022 OUR DIVERSE BUSINESS MIX PERFORMS THROUGH CYCLES… $111 $123 $132 53 47 62 39 47 41 2018 2020 2022 20 29 29 NII3 NIR3 Markets Revenue1 by type ($B) …AND OUR CLIENTS AND CUSTOMERS BENEFIT FROM A COMPLETE AND AT-SCALE OFFERING $3.7T Total assets Wealth Management Commercial Real Estate Fixed Income Markets Global Private Bank International Consumer Initiatives $2.8T AUM 79mm U.S. consumers $4.0T Client assets 294k Employees across 60+ countries >90% Of Fortune 500 companies do business with us $5.6T Consumer payments4 $10T Daily payment processing5 Payments Asset Management M&A ECM DCM Equity Markets Lending Securities Services Middle Market Corporate Client Consumer Banking Business Banking Card Services Home Lending Auto For footnoted information, refer to slide 22 100+ Markets globally 4
  • 6.
    …strengthening relationships throughmulti-LOB partnerships and delivering all of JPMorgan Chase to clients throughout their lifetimes Individuals Small Businesses Middle Markets Larger Corporates Financial & Investment Markets / SS Banking Payments GPB AM CCB CIB CB AWM 50 Market Leadership Teams in the U.S. 7 U.S. regions; 700+ senior leaders 43 Senior Country Officers globally All focused on cross-LOB growth opportunities ~30% of leaders have cross business/function experience1 Denotes primary relationships Our product completeness and scale make us uniquely positioned to strengthen our value proposition to each client segment ✓ ✓ ✓ ✓ ✓ ✓ ✓ ✓ ✓ ✓ ✓ ✓ ✓ ✓ ✓ ✓ ✓ Relationships with adjacent segments (e.g., employees) or cross-LOB solution CIB CB AWM CCB Select cross-LOB solutions strengthening segment value propositions Advanced Chase Wealth Management products and capabilities powered by Global PB Payment solutions including real time bill payment and global remittances Integrated Payment solutions (QuickAccept) embedded into Chase Complete Banking Employee benefits and retirement accounts provided by Everyday 401K Payment solutions tailored to Middle Market and specific sectors (e.g., Healthcare, e- Commerce) Sponsor and VC coverage spanning portfolio companies, GPs and Founders Global Shares for capital table management and share plan management for employees Range of customized lending, treasury, markets, and custody solutions to meet needs of complex financial institutions ✓ ✓ ✓ ✓ ✓ ✓ ✓ ✓ ✓ ✓ ✓ ✓ ✓ ✓ ✓ For footnoted information, refer to slide 22 Our value proposition is further enhanced by constant investment in Technology ✓ ✓ 5
  • 7.
    There are multiplesources of uncertainty ahead Macro environment ⚫ Health of the consumer ⚫ Interaction between interest rates, persistent inflation and ongoing tight labor market We are prepared to deliver for our clients, customers and stakeholders in any environment ⚫ Pace of QT ⚫ Debt ceiling Geopolitical ⚫ Ongoing war in Ukraine ⚫ US / China relations Regulatory ⚫ CCAR / SCB ⚫ Basel III endgame / holistic review ⚫ Heightened scrutiny of the banking sector overall ⚫ FDIC-related items 6
  • 8.
    Cybersecurity and riskmanagement remain non-negotiable priorities Provide operational resiliency and security Address multi-jurisdictional sanctions Protect clients’ assets, money in movement and data Minimize fraud and cyber risk Comply with AML1 laws and KYC2 protocols We are an integral part of a safe, sound and resilient financial system Compliance Fraud Cyber KYC Control Management Legal Finance Risk For footnoted information, refer to slide 22 We are an integral part of a safe, sound and resilient financial system Three lines of defense Front Line Units Independent Risk Management Internal Audit Human Resources Technology 7
  • 9.
    We remain committedto advancing a sustainable and inclusive economy Sustainable Development Target: $2.5T over 10 years1 Racial Equity Commitment: $30B over 5 years1 Community Development Striving to advance economic inclusion in developed markets $102B cumulative progress by the end of 2022 $482B reported progress by the end of 2022 ~$29B Approved funding of ~$18B in loans to incentivize the preservation of nearly 170k affordable housing rental units in the U.S. Opened 16 Community Center Branches2 and hired 146 Community Managers Refinanced 14,000+ incremental mortgage loans totaling ~$3B Invested $100mm+ of equity in Minority Depository Institutions and Community Development Financial Institutions 406,000 net new low-cost checking accounts with no overdraft fees Development Finance Working to support socioeconomic development in emerging economies $204B Green $1T goal Aiming to drive climate action and sustainable resource management $176B For footnoted information, refer to slide 22 95% 19% 8
  • 10.
    9% compound annual growth ratesince 2004 $15 $16 $19 $22 $23 $27 $30 $34 $39 $41 $45 $48 $51 $54 $56 $61 $66 $72 $73 '04 '05 '06 '07 '08 '09 '10 '11 '12 '13 '14 '15 '16 '17 '18 '19 '20 '21 '22 Our strong track record has laid the foundation for our continued success TBVPS1 ($) STRONG TRACK RECORD OF PERFORMANCE AND GROWTH… 18% ROTCE1 $132B Revenue3 58% Overhead ratio3 445bps > peers2 $38B Net Income vs. 69% for peers2 vs. 12% for peers2 …MAKING US WHO WE ARE TODAY… Complete Global At Scale Diversified “We are committed to achieving high quality of earnings. This means consistently investing in our businesses” - Jamie Dimon, 2007 …AND CONSISTENTLY INVESTING… Technology Bankers, Advisors & Branches Marketing Digital, Data, AI & Product Design New and Expanded Businesses …AND PREPARING US FOR THE FUTURE For footnoted information, refer to slide 22 2022 9
  • 11.
    For footnoted information,refer to slide 22 $1.4T HQLA and marketable securities 140% Bank LCR $488B Total Loss-Absorbing Capacity 5.9% Firm SLR 13.8% Standardized CET1 ratio LIQUID BALANCE SHEET $460B Our fortress balance sheet principles are designed so we can be a pillar of strength in any environment 114% Firm LCR 13.9% Advanced CET1 ratio STRONG CAPITAL POSITION Tier 1 $254B $488B TLAC Allowance JPM Current JPM Loss- Absorbing Capacity All U.S. bank loan losses during the GFC4 As of March 31, 2023 Sources of liquidity1 $1.6T $2.3T Deposits1 NIM3: 4Q21 3.1% 1.9% 3.8% (120bps) 190bps Cash HQLA-eligible securities2 Other unencumbered securities2 $203B $453B $421B $557B $236B $421B 4Q19 1Q23 ~$600B increase in liquidity sources $1.4T $0.9T 10 $713B $1,113B $855B $1,208B 4Q19 1Q23 ~$800B net deposit inflows since QE restarted CCB CIB, CB, AWM, Corp.
  • 12.
    2023 Outlook as of1Q23 Impact of First Republic 2023 Outlook Medium-term NII ex. Markets outlook increasing to ~$84B due to First Republic, though sources of uncertainty remain ~$84 ⚫ Deposit reprice ⚫ Magnitude and timing ⚫ Competitive dynamics and consumer behavior ⚫ Balance sheet growth and mix ⚫ Card Services revolve normalization ⚫ Securities reinvestment strategy ⚫ Impact of policy choices and macro environment ⚫ Pace of quantitative tightening (QT) ⚫ Path of Fed Funds rate ⚫ Size and terms of RRP ⚫ Severity of any recession 1Q23 $20.9 NET INTEREST INCOME EX. MARKETS1 ($B) SOURCES OF UNCERTAINTY 2Q23 3Q23 4Q23 $81 Mid-$70s ~$3 Medium-term impact to be determined For footnoted information, refer to slide 23 Assumes Fed Funds target upper bound reaches 4.75% by year end, with two cuts in 4Q23 Assumptions Mid-single digit loan growth Card Services revolve growth continues Moderate Wholesale loan growth Deposits down slightly YoY Rate headwinds partially offset by moderate loan growth Assumptions Meaningful catch up in deposit repricing as lags are removed from the current run rate Potential upside from First Republic franchise 11
  • 13.
    Should the termsof RRP be reevaluated given the extent of deposit drainage? Credit extension How long can unprecedented pace of QT continue before triggering reserve scarcity? System-wide deposit levels will depend on how QT interacts with RRP and customer behavior Key questions U.S. Treasury MMFs FHLB $18.1 $17.1 17 ($0.4) ($0.6) ($0.7) $0.8 Dec '21 Loans and securities Fed B/S TGA and RRP Other Apr '23 Size of Fed balance sheet Federal Reserve Increase balance sheet (“QE”) Decrease balance sheet (“QT”) Outlook: continued QT (~$80B per month) Mix of Fed liabilities Increase in AUM, invested in non- RRP assets (e.g., T-bills) Increase in AUM, invested in Fed’s RRP facility Outlook: growth in RRP likely to continue absent increase in available T-bills Spending of Treasury General Account (TGA) Issue treasuries to increase TGA Outlook: ~neutral over time Growth in advances, if funded by MMFs selling RRP Growth in advances, if funded by discount notes purchased using bank deposits Individuals, corporations and institutions Increases deposits Repay loans / purchase securities from banks Outlook: modest loan growth to continue Evolution of U.S. commercial bank deposits ($T)1 Fed B/S TGA & RRP Loans & securities Regardless of macro pressures on deposits, our strategy remains the same: focus on maintaining primary banking relationships Borrow from / sell securities to banks Decreases deposits FHLB & other2 vs. $4.6T Fed B/S expansion during QE (Feb ‘20 – Dec ’21) For footnoted information, refer to slide 23 12
  • 14.
    Our 2023 expenseoutlook is unchanged excluding expenses associated with First Republic ADJUSTED EXPENSE1 ($B) 1 2 31 33 27 28 5 5 12 12 2022 2023 Outlook before First Republic Impact of First Republic 2023 Outlook ~$5 ~$81 CCB CIB CB AWM Corp. $76 ⚫ ~$2B increase in investment expense ⚫ ~$3B increase in structural expense ⚫ Includes $0.6B of investments transitioned into BAU ⚫ Includes $0.5B of FDIC assessment announced in 2022 ⚫ Modest decrease in volume- and revenue- related expense ~$3.5 ~$84.5 ⚫ Includes integration costs 2024 CONSIDERATIONS FDIC CONSIDERATIONS ⚫ Moderating labor inflation ⚫ Continued investments ⚫ Market-dependent increase in volume- and revenue-related expenses ⚫ Continued efficiencies ⚫ Integration costs related to First Republic ⚫ Potential increases to regular-way FDIC assessments For footnoted information, refer to slide 23 ⚫ Finalization of special assessment related to systemic risk determination ⚫ Based on May 11 NPR: – Approximately $3B, pre-tax – Likely to be accrued in 2023 ⚫ Assessment associated with First Republic ⚫ No indication of a special assessment ⚫ $13B estimated loss to the DIF can be rebuilt through regular-way assessments ⚫ Potential redesign to deposit insurance special assessment FDIC 13
  • 15.
    We continue toinvest in positioning the Firm for long-term success $5.6 $6.7 $7.2 0.3 1.9 2.3 2.7 2.6 3.2 3.2 0.2 0.2 0.3 0.7 0.8 0.9 2021 2022 2023 Technology Investments …TECHNOLOGY… Total investment expense ($B) CCB CIB CB AWM Corp. $10.9 $13.7 $15.7 0.5 0.3 0.6 5.2 7.1 7.9 3.0 3.6 3.9 0.7 0.9 1.0 1.4 1.8 2.2 2021 2022 2023 OPPORTUNITIES ACROSS ALL BUSINESSES… $1.7 $2.2 $2.7 2021 2022 2023 $2.1 $2.6 $3.0 2021 2022 2023 $0.7 $1.5 $1.2 2021 2022 2023 Bankers, Advisors & Branches Marketing Digital, Data, AI & Product Design New and Expanded Businesses Commerce Int. Consumer $0.7 $0.9 $1.0 2021 2022 2023 Other1 …AND BEYOND Totals may not sum due to rounding; for footnoted information, refer to slide 23 $0.2 $0.6 2021 2022 2023 $0.0 14
  • 16.
    The regulatory capitalenvironment is uncertain… Today Comment period NPR Phase-in period Final rule Final implementation MULTIPLE FACTORS AT PLAY, THOUGH ANY POTENTIAL REGULATORY CHANGES WON’T BE IMMEDIATE 4.5% GSIB CCyB Lending RWA – “the denominator” Buffers – “the ratio” 1Q25 earliest 4.0% 0% Today Rule ? ? Period ? Final implementation ? Trading (incl. Repos & FRTB) SCB Operational Risk and CVA Although the ultimate direction of the various components of capital requirements is uncertain, we are prepared for overall requirements to increase Basel III endgame Holistic review 15
  • 17.
    …but we havestrong organic capital generation capabilities For footnoted information, refer to slide 23 11.9% 13.8% 1Q22 1Q23 1Q24 13.5% target Our organic capital generation and proven balance sheet discipline enable us to dynamically adjust to headwinds and pursue strategic opportunities 1Q22 – 1Q23 reflects actuals 1Q23 – 1Q24 is illustrative and based on analyst estimates as of 4/27 (before First Republic) 11.2% 13.5% 12.5% Regulatory Requirement Organic capital generation (net income, less dividends1) RWA change SCB: GSIB: 3.2% 3.5% 4.0% 4.0% 4.0%? 4.5% ORGANIC CAPITAL GENERATION AND EVOLUTION OF CET1 RATIO FROM 1Q22 TO 1Q24 Includes RWA mitigation efforts RWA growth2 ~40bps per quarter2 Potential uses: ⚫ FDIC special assessment ⚫ 2023 SCB uncertainty ⚫ Potential regulatory changes ⚫ Additional business growth ⚫ Distributions ~$20B of excess capital available Includes net repurchases and AOCI ~40bps First Republic impact 13.0% 16
  • 18.
    Credit remains benign,but we expect continued normalization throughout the year 5.8% 5.3% Q0 Q1 Q2 Q3 Q4 Q5 Q6 Q7 Q8 WE ARE RESERVED FOR PEAK UNEMPLOYMENT OF 5.8% IN LATE 20241 8-quarter weighted average UER forecasts (%) 10.3 11.4 1.9 1.7 6.5 9.5 18.7 22.8 4Q21 total allowance Economic drivers Loan growth / mix and credit quality 1Q23 total allowance Card Services Consumer ex. Card Wholesale Firmwide allowance ($B) WE HAVE BUILT RESERVES AS THE OUTLOOK HAS DETERIORATED 3 WE EXPECT NORMALIZED NCOS BY THE END OF 2023 NCO rate (%) 0.6% 0.6% 0.3% 0.3% 2019 2020 2021 2022 2023 Outlook Card Services Consumer ex. Card Wholesale Firmwide 3.10% 2.93% 1.94% 1.47% 2.60% For footnoted information, refer to slide 23 4Q21 1Q23 Pre-pandemic 2017 – 2019 average 3,4 2 17
  • 19.
    18% 2022 Medium-term We arepositioned to generate strong ROTCE in a variety of recessionary scenarios For footnoted information, refer to slide 23 Deposit outcomes Credit normalization and possible deterioration Impact of policy choices Investment banking wallet recovery and new normal Inflation Regulatory items Loan growth THE BALANCE OF RISKS SKEWS TO THE DOWNSIDE… …BUT WE CAN STILL DELIVER STRONG RETURNS IN A RECESSION Illustrative ROTCE1 path by recessionary scenario 17% through the cycle target Moderate to deep, early Moderate, delayed Recession depth, timing Moderate to deep, early Shallow, gradual Shallow, early Well below Well above Fed Funds Rate vs. LT policy Slightly above Above Below Sharply abating Persistent Inflation Slowly abating Less persistent Abating Recessionary scenarios 1Q22 – 4Q22 quarterly ROTCE 20% 18
  • 20.
    We remain committedto serving our clients and customers with the full breadth of our offering, while producing strong returns for all our constituents ~17% ROTCE target ~$84B 2023 NII and NII ex. Markets ~$84.5B 2023 adjusted expense 13.5% Target CET1 ratio at 1Q24 Promotes stronger and deeper relationships with customers Allows us to serve more clients everywhere Supports more stable earnings in any operating environment Offsets margin compression through volume growth and facilitates efficiencies Complete Global Diversified At Scale See notes on slide 20 for additional information on ROTCE, NII ex. Markets and adjusted expense 19
  • 21.
    Notes on non-GAAPfinancial measures 1. In addition to analyzing the Firm’s results on a reported basis, management reviews Firmwide results, including the overhead ratio, on a “managed” basis; these Firmwide managed basis results are non-GAAP financial measures. The Firm also reviews the results of the lines of business on a managed basis. The Firm’s definition of managed basis starts, in each case, with the reported U.S. GAAP results and includes certain reclassifications to present total net revenue for the Firm and each of the reportable business segments on a fully taxable-equivalent basis. Accordingly, revenue from investments that receive tax credits and tax-exempt securities is presented in the managed results on a basis comparable to taxable investments and securities. These financial measures allow management to assess the comparability of revenue from year-to-year arising from both taxable and tax-exempt sources. The corresponding income tax impact related to tax- exempt items is recorded within income tax expense. These adjustments have no impact on net income as reported by the Firm as a whole or by the lines of business. For a reconciliation of the Firm’s results from a reported to managed basis for the full years 2020, 2021 and 2022, refer to page 58 of JPMorgan Chase’s Annual Report on Form 10-K for the year ended December 31, 2022 (“2022 Form 10-K”). For all other periods presented, refer to the Explanation and Reconciliation of the Firm’s Use of Non-GAAP Financial Measures disclosure in JPMorgan Chase’s Annual Report on Form 10-K for each respective year 2. In addition to reviewing net interest income (“NII”), net yield, and noninterest revenue (“NIR”) on a managed basis, management also reviews these metrics excluding CIB Markets (“Markets”, which is composed of Fixed Income Markets and Equity Markets). Markets revenue consists of principal transactions, fees, commissions and other income, as well as net interest income. These metrics, which exclude Markets, are non-GAAP financial measures. Management reviews these metrics to assess the performance of the Firm’s lending, investing (including asset-liability management) and deposit-raising activities, without the volatility associated with Markets activities. In addition, management also assesses Markets business performance on a total revenue basis as offsets may occur across revenue lines. For example, securities that generate net interest income may be risk-managed by derivatives that are reflected at fair value in principal transactions revenue. Management believes that disclosure of these measures provides investors and analysts with alternative measures to analyze the revenue trends of the Firm. For a reconciliation of NII, net yield, and NIR from reported to excluding Markets for the full year 2022 and the first quarter of 2023, refer to page 59 of JPMorgan Chase’s 2022 Form 10-K and page 17 of JPMorgan Chase’s Quarterly Report on Form 10-Q for the quarter ended March 31, 2023, respectively. For all other periods presented, refer to the Explanation and Reconciliation of the Firm’s Use of Non-GAAP Financial Measures disclosure in JPMorgan Chase’s Annual Report on Form 10-K for each respective year 3. Tangible common equity (“TCE”), return on tangible common equity (“ROTCE”) and tangible book value per share (“TBVPS”), are each non-GAAP financial measures. TCE represents the Firm’s common stockholders’ equity (i.e., total stockholders’ equity less preferred stock) less goodwill and identifiable intangible assets (other than mortgage servicing rights), net of related deferred tax liabilities. ROTCE measures the Firm’s net income applicable to common equity as a percentage of average TCE. TBVPS represents the Firm’s TCE at period-end divided by common shares at period-end. TCE, ROTCE and TBVPS are utilized by the Firm, as well as investors and analysts, in assessing the Firm’s use of equity. For a reconciliation from common stockholders’ equity to TCE for the full years 2020, 2021 and 2022, refer to page 60 of JPMorgan Chase’s 2022 Form 10-K. For all other periods presented, refer to the Explanation and Reconciliation of the Firm’s Use of Non-GAAP Financial Measures disclosure in JPMorgan Chase’s Annual Report on Form 10-K for each respective year 4. Adjusted expense, which excludes Firmwide legal expense, is a non-GAAP financial measure. Adjusted noninterest expense excludes Firmwide legal expense of $266mm for the full year ended December 31, 2022. Management believes this information helps investors understand the effect of certain items on reported results and provides an alternate presentation of the Firm’s performance 20
  • 22.
    Notes on slide3 Slide 3 – We have leading client and customer-centric franchises 1. Federal Deposit Insurance Corporation (FDIC) 2022 Summary of Deposits survey per S&P Global Market Intelligence applies a $1B deposit cap to Chase and industry branches for market share. While many of our branches have more than $1B in retail deposits, applying a cap consistently to ourselves and the industry is critical to the integrity of this measurement. Includes all commercial banks, savings banks and savings institutions as defined by the FDIC 2. Based on 2022 sales volume and loans outstanding disclosures by peers (American Express Company (AXP), Bank of America Corporation, Capital One Financial Corporation, Citigroup Inc. and Discover Financial Services) and JPMorgan Chase estimates. Sales volume excludes private label and Commercial Card. AXP reflects the U.S. Consumer segment and JPMorgan Chase estimates for AXP’s U.S. small business sales. Loans outstanding exclude private label, AXP Charge Card, Citi Retail Cards and Commercial Card 3. Barlow Research Associates, Primary Bank Market Share Database as of 4Q22. Rolling 8-quarter average of small businesses with revenue of more than $100,000 and less than $25mm 4. Dealogic as of April 3, 2023. Rank for 2022 5. Coalition Greenwich Competitor Analytics. Based on JPMorgan Chase’s internal business structure and revenue. Rank for 2022, based on Coalition Index Banks for Markets 6. Coalition Greenwich Competitor Analytics. Reflects global J.P. Morgan Treasury Services business (CIB and CB). Based on JPMorgan Chase’s internal business structure and revenue. Rank for 2022, based on Coalition Index Banks for Treasury Services 7. Euromoney 8. Active ETF Rank (Simfund) 9. In the U.S.. S&P Global Market Intelligence as of December 31, 2022 10. Refinitiv LPC, 2022 11. Represents general purpose credit card spend, which excludes private label and Commercial Card. Based on company filings and JPMorgan Chase estimates 12. Data as of 2017 13. Includes gross revenues earned by the Firm, that are subject to a revenue sharing arrangement with the CIB, for products sold to CB clients through the Investment Banking, Markets or Payments businesses. This includes revenues related to fixed income and equity markets products 14. In the fourth quarter of 2022, certain revenue from CIB markets products was reclassified from investment banking to payments. In the first quarter of 2020, the Merchant Services business was realigned from CCB to CIB. With the realignment, revenue is now reported across CCB, CIB and CB based primarily on client relationship. Financials from 2012 were revised to conform with the current presentation. Includes growth of $161mm that is also included in the Gross IB revenue metric 15. In the fourth quarter of 2020, the Firm realigned certain wealth management clients from AWM to CCB. Prior-period amounts have been revised to conform with the current presentation 16. 90% of 10-year J.P. Morgan Asset Management long-term mutual fund AUM performed above peer median. All quartile rankings, the assigned peer categories and the asset values used to derive this analysis are sourced from the fund ranking providers. Quartile rankings are done on the net-of-fee absolute return of each fund. The data providers re-denominate the asset values into U.S. dollars. This % of AUM is based on fund performance and associated peer rankings at the share class level for U.S.-domiciled funds, at a “primary share class” level to represent the quartile ranking of U.K., Luxembourg and Hong Kong funds, and at the fund level for all other funds. The “primary share class” is defined as C share class for European funds and Acc share class for Hong Kong and Taiwan funds. In case the share classes defined are not available, the oldest share class is used as the primary share class. The performance data could have been different if all share classes would have been included. Past performance is not indicative of future results. Effective September 2021, the Firm has changed the peer group ranking source from Lipper to Morningstar for U.S.-domiciled funds (except for Municipal and Investor Funds) and Taiwan-domiciled funds, to better align these funds to the providers and peer groups it believes most appropriately reflects their competitive positioning. This change may positively or adversely impact, substantially in some cases, the quartile rankings for one or more of these funds as compared with how they would have been ranked by Lipper for this reporting period or future reporting periods. The source for determining the rankings for all other funds remains the same. The classifications in terms of product suites and product engines shown are J.P. Morgan’s own and are based on internal investment management structures 17. Refers to total client asset flows 21
  • 23.
    Notes on slides4-10 Slide 4 – Being complete, global, diversified and at scale enables us to meet clients’ and customers’ needs across the spectrum and through cycles… 1. Totals may not sum due to rounding. See note 1 on slide 20 2. In the first quarter of 2023, the allocations of revenue and expense to CCB associated with a Merchant Services revenue sharing agreement were discontinued and are now retained in Payments in CIB. Prior-period amounts have been revised to conform with this presentation 3. Ex. Markets. See note 2 on slide 20 4. Total payment volumes reflect Consumer and Small Business customers’ digital (ACH, BillPay, PayChase, Zelle, RTP, External Transfers, Digital Wires), Non-digital (Non-digital Wires, ATM, Teller, Checks) and credit and debit card payment outflows 5. Based on firmwide data using regulatory reporting guidelines as prescribed by the Federal Reserve Board Slide 5 – …strengthening relationships through multi-LOB partnerships and delivering all of JPMorgan Chase to clients throughout their lifetimes 1. As of May 5, 2023, 30% of MD employees up to two levels down from the Operating Committee had cross-sub-LOB and/or cross-function mobility since 2017 Slide 7 – Cybersecurity and risk management remain non-negotiable priorities 1. Anti-money laundering (“AML”) 2. Know your customer (“KYC”) Slide 8 – We remain committed to advancing a sustainable and inclusive economy 1. Select highlights, refer to our 2022 ESG report for additional detail 2. Total Community Center Branches as of April 30, 2023 Slide 9 – Our strong track record has laid the foundation for our continued success 1. See note 3 on slide 20 2. Peers include Bank of America, Citigroup, Goldman Sachs, Morgan Stanley and Wells Fargo 3. See note 1 on slide 20 Slide 10 – Our fortress balance sheet principles are designed so we can be a pillar of strength in any environment 1. Totals may not sum due to rounding. Deposits are average for the quarter 2. HQLA-eligible securities includes the Firm’s average eligible HQLA securities and average eligible HQLA securities held by JPMorgan Chase Bank, National Association ("JPMorgan Chase Bank, N.A.") that is in excess of its stand-alone 100% minimum LCR requirement and not transferable to non-bank affiliates, and thus excluded from the Firm’s reported HQLA under the LCR rule. Other unencumbered securities includes other end- of-period unencumbered marketable securities, such as equity and debt securities 3. Net yield on average interest-earning assets excluding Markets. See note 2 on slide 20 4. All U.S. banks’ loan losses for the Great Financial Crisis calculated as losses for peak loss years (2009-2011). S&P Capital IQ 22
  • 24.
    Notes on slides11-18 Slide 11 – NII ex. Markets outlook increasing to ~$84B due to First Republic, though sources of uncertainty remain 1. See notes 1 and 2 on slide 20 Slide 12 – System-wide deposit levels will depend on how QT interacts with RRP and customer behavior 1. Totals may not sum due to rounding 2. Includes items from both the Fed balance sheet and all Commercial Banks balance sheets that influence deposits but are not reflected in the other data presented Slide 13 – Our 2023 expense outlook is unchanged excluding expenses associated with First Republic 1. See note 4 on slide 20. Totals may not sum due to rounding Slide 14 – We continue to invest in positioning the Firm for long-term success 1. Other includes selected LOB-related acquisition expenses and investments associated with the company’s real estate expenses Slide 16 – …but we have strong organic capital generation capabilities 1. Dividends include common and preferred stock dividends 2. Represents the median consensus of research analyst estimates as of April 27, 2023 Slide 17 – Credit remains benign, but we expect continued normalization throughout the year 1. As of March 31, 2023 2. Wholesale includes allowance for credit losses in Corporate 3. Totals may not sum due to rounding; 4Q21 and 1Q23 total allowance include $42mm and $90mm, respectively, on investment securities 4. On January 1, 2023, the Firm adopted changes to the TDR accounting guidance. The adoption of this guidance resulted in a net reduction in the allowance for loan losses of approximately $600mm Slide 18 – We are positioned to generate strong ROTCE in a variety of recessionary scenarios 1. See note 3 on slide 20. ROTCE ranges indicated are estimates 23
  • 26.
    We continue toexecute against our technology strategy Deliver best-in-class products, platforms, and experiences Unlock the power of data Strengthen our development capabilities and infrastructure Customer and client experiences Product and platform development Modernize technology Drive software development excellence Embed data and insights into everything ⚫ Continued to release new products and experiences that delight our customers: ⚫ Account validation: custom-built engine that validates bank accounts to protect customers ⚫ Cash optimization: enable utilization of residual cash to generate alpha ⚫ Connected Commerce: ecosystem of products connected via reusable APIs ⚫ Fusion: cloud-native data management and reporting platform ⚫ Versana: reduce settlement times and improve liquidity management for syndicated loan market ⚫ Improved speed-to-market of product features by 20% (in days) ⚫ Continued application modernization through refactoring, SaaS replacement, and legacy decommissioning ⚫ Enabled multi-vendor public cloud as target state infrastructure ⚫ Completed ~60% of our application migrations to strategic data centers ⚫ Optimized data center footprint to facilitate public cloud journey ⚫ Ahead of our plan to deliver $1B business value ⚫ +34% YoY growth in AI/ML use cases in production ⚫ Accelerated large- language-model (LLM) enablement ⚫ Matured ability to respond to new threats, including quantum safe encryption ⚫ Delivered business value through cyber as a differentiator ⚫ Maintained flat expense relative to volume increases Proactively defend against cyber threats Protect the Firm and our customers 1 2 3 4 1
  • 27.
    Products, platforms, andexperiences $4.0B Modernize technology and software development excellence $3.2B Unlock the power of data Protect the Firm and our customers Total $7.2B $0.7 $1.1 $0.5 $0.5 2019 2021 Structural / volume- related Investments 2022 Structural / volume- related Investments 2023 $11.7 $12.5 $14.3 $15.3 +7% CAGR Our expense growth is driven by investments, volumes, and structural factors CAGR 2019-23 11% 4% CIB $3.2B CCB $2.7B AWM $0.9B CB $0.3B Total $7.2B Infrastructure Software licenses Application and production support Wage inflation +$0.5 Volumes / other +$0.5 Internal efficiencies ($0.5) 2 Wage inflation +$0.6 Volumes / other +$0.5 Internal efficiencies ($0.4) TECH INVESTMENTS BY STRATEGY, 2023 FULLY LOADED TECH INVESTMENTS BY LOB, 2023 RUN THE BANK INCLUDES Investments / change the bank Run the bank TOTAL TECHNOLOGY EXPENSE ($B) Note that totals may not sum due to rounding
  • 28.
    ◼ Increase utilizationof cloud and reduce data center footprint ◼ Break monolithic applications into modular and API-driven architecture to improve cost elasticity ◼ Improve engineer capacity through agile adoption and elimination of non- value adding activities ◼ High levels of automation (testing, release, production support) and streamlined software delivery through our platforms We have delivered $0.5B against our $1.5B productivity target 3 ~$300mm through engineering efficiencies and labor productivity ~$200mm in infrastructure productivity OUR 3-YEAR COMMITMENT FROM INVESTOR DAY 2022 PROGRESS WE’VE MADE Modernizing technology and software development excellence will drive cost efficiency across the total spend and slow our expense growth Total spend breakdown Opportunity size Opportunity levers Total Spend ($B) Engineering Product, design, application support, and other Infrastructure and software 14.1 15-20% ~10% in infrastructure cost efficiency in productivity and cost efficiency Software development excellence Modernize technology ~$1.5B in productivity and cost efficiencies over the next 3 years Strengthen our software development capabilities and infrastructure 2
  • 29.
    ~560 2022 2023 +14% Growth inSaaS applications We continue to modernize our technology estate while keeping infrastructure RTB expense relatively flat 4 ⚫ We have increased SaaS adoption to replace non-differentiating applications with industry-leading SaaS solutions ⚫ And we have continued our legacy application decommissioning journey ⚫ In the last year, we have been modernizing our on-premise infrastructure and growing cloud use ⚫ Over time, this has resulted in our infrastructure run-the-bank expense remaining relatively flat while our volumes have increased 30% 38% 2022 2023 Cloud as a percentage of total infra spend ~60% of in-scope applications have fully migrated to our modern data centers 2019 2022 +50% Storage and compute volumes 2019 2022 +2% CAGR Infrastructure run-the-bank expense Strengthen our software development capabilities and infrastructure 2 WE’VE MADE SIGNIFICANT PROGRESS IN MODERNIZING APPLICATIONS… …WHILE MODERNIZING OUR INFRASTRUCTURE & SUPPORTING GROWING VOLUMES ~490 ~2,200 ~2,500 2022 2023 +300 Volume of applications decommissioned since 2017
  • 30.
    We’ve made progresson technology modernization and engineering excellence to drive efficiencies in feature delivery and slow our expense growth AGILITY Adopt and continuously improve agile practices to free engineer capacity SPEED Accelerate development and deployment of features into production STABILITY Minimize failed changes and unplanned outages 60% of apps 60% of teams 100% of apps LAUNCH PLAN …tracking towards ~100% Toolchain adoption by YE 2023 84% On Enterprise Toolchain Exceeded 80% 2022 target 5 Strengthen our software development capabilities and infrastructure 2 WHAT WE MEASURE ACROSS SOFTWARE DEVELOPMENT LIFECYCLE COVERAGE EXAMPLE OUTCOMES WE’VE ACHIEVED IN 1 YEAR 99.9% change success rate while change volumes have gone up ~60% ~70% of CCB teams improved YoY performance on agile practices ~20% improvement in days from backlog to deployment
  • 31.
    Our modernization strategyis enabling us to deliver significant value across the business 6 Strengthen our software development capabilities and infrastructure 2 Completed migration of internet- facing Chase.com to the public cloud in 4Q22, serving all customers through Amazon Web Services Chase.com 22% increase in change volume 15 Chase.com releases weekly, 2 mobile app releases monthly 100% customers onboarded (including 63mm+ active digital customers) Moving up-funnel to meet customers earlier in their journeys, protecting our core franchise, and disrupting incumbents in Commerce Connected Commerce Innovative API-driven platform to automate partner onboarding and simplify integration with Chase ecosystem 35% increase in speed to deliver product features YoY Offers and recommendations delivered $350mm impact over two months in 2023 Graphite is a scalable, modern strategic platform for processing payments globally, including real-time payments JPM Payments Transaction Engine Third largest payments platform by volume Reduced time to launch a new real-time payment market from ~18 months to ~3-6 months Each payment capability built with its own independent component architecture Regulatory data warehouse responsible for global regulatory reporting for Cash Equities, Futures, and Options in 15+ countries Markets Regulatory Reporting Platform Reduced monthly running cost by >50% Running on public cloud, enabling real-time audit trail calculation and report generation Increased ability to scale to 2.5B trades per day on public cloud from 500mm trades per day on-premise
  • 32.
    $1.5B target 2021 20222023 3.6x AI/ML driven business impact 7 Unlock the power of data 3 Building an industry-leading team WE EXPECT TO BEAT OUR AI/ML IMPACT TARGETS CONTINUING TO ACCELERATE THE POWER OF OUR DATA AND AI/ML We continue to prioritize our investment in Data and AI/ML, and see increasing value in our businesses Expanding our technology platforms Select thematic examples across our 300+ use cases in production Personalization of products and experiences for retail customers Deepening client relationships through improved analytics and insights ~25 use cases ~$220mm impact in 2022 ~60 use cases ~$100mm impact in 2022 1 JPMC ranked number one in the Evident AI Index (January 2023), the first public benchmark of major banks on their AI maturity 600+ ML engineers data scientists 900+ 200+ AI researchers Ranked #1 Evident AI Index1 ⚫ Improving capabilities, with embedded governance and Responsible AI ⚫ Integrating ML Ops capability to support teams to develop models faster and measure performance ⚫ Increased use cases leveraging firmwide model development and training platform by 2.2x YoY
  • 33.
    We continue toevolve our best-in-class Cyber capabilities through a dynamic threat environment 8 2022 2020 2023 2021 Security alerts processed per day Advising U.S. Government and policy makers to improve public-private partnership and enhance cybersecurity for critical infrastructure Automating security controls by default in development, data, and infrastructure platforms, reducing the number of required developer actions by over 60% Further strengthening access and authentication, improving user experience while lowering the burden of managing passwords Engaging with NIST1 as a financial services member of the National Cybersecurity Center of Excellence and collaborating on post-quantum cryptography migration guidelines 2022 2023 Cybersecurity exercises and simulations 2022 2023 Supplier vulnerabilities proactively mitigated by JPMC 2022 2023 Cyber-related expenditure 1 National Institute of Standards and Technology Reduced required actions and introduced straight-through-processing for cloud regulatory compliance resulting in automated approval for over 60% of deployments Protect the firm and our customers 4 MANAGING EXPENSE WHILE DOING MORE CREATING VALUE WHILE PROTECTING THE FIRM AND FINANCIAL SERVICES INDUSTRY CRITICAL INFRASTRUCTURE +22% >2x +66% +4% CAGR
  • 34.
    We are wellpositioned to lead across our businesses, backed by resilient, innovative technology, for years to come Unlock the power of data Protect the Firm and our customers Deliver best-in-class products and experiences to customers Strengthen our software development capabilities and infrastructure 1 2 3 4 9 Continued to release new products and experiences that delight our customers Improved speed-to-market of product features by 20% $0.5B productivity impact delivered against $1.5B target ~100% Enterprise Toolchain adoption by year-end Ahead of our plan to deliver $1B business value 300+ use cases in production $1.5B value target to be delivered by year-end 2023 Creating value while protecting our Firm and customers Optimizing our expense while volumes increase
  • 35.
    S T RI C T L Y P R I V A T E A N D C O N F I D E N T I A L
  • 36.
    We have aconsistent set of strategic priorities Growing and deepening relationships by engaging customers1 with products and services they love and expanding our distribution Delivering financial performance that is consistently best-in-class Leveraging data and technology to drive speed to market and deliver customer value ⚫ Grow our customer base through new-to-bank relationships in Consumer Bank and Card ⚫ Engage customers with improved experiences across human and digital channels ⚫ Deepen relationships with a focus on Business Banking, Wealth Management, and Commerce ⚫ Operate resilient businesses with best-in-class returns ⚫ Scale core businesses and invest for long-term growth Protecting our customers and the firm through a strong risk and controls environment Cultivating talent to build high-performing, diverse teams where culture is a competitive advantage ⚫ Optimize channels, products, and platforms to deliver customer and business value ⚫ Modernize applications, infrastructure, and data to future-proof the business ⚫ Drive disciplined risk, controls, and governance processes ⚫ Leverage our risk platforms as responsible growth engines ⚫ Create a culture where our people come to work with heart, curiosity, and courage ⚫ Be known as a company that serves customers, communities, and each other in a first- class way Strategy Enablers Outcome 1 5 2 3 4 1 “Customer” includes both consumers and small businesses and reflects unique individuals and business entities that have financial ownership or decision-making power with respect to accounts 2
  • 37.
    We have deliveredagainst our commitments Added net ~3mm customers to the CCB franchise Continued to scale distribution by opening 114 branches, while adding 240+ Business Relationship Managers and 300+ Advisors Launched Personal Advisors and Wealth Plan for Chase clients and advisors Launched Ink Business Premier, Pay in 4 on debit to select customers, and ChaseTravel.com for cardholders Targeted and delivered ~$8B in volume through Travel platform – on track for ~$15B by 2025 Migrated nearly 30% of data to the public cloud – on track for 50% by end of 2023 Delivered $500mm+ in value from AI/ML programs Continued to operate in a strong risk and controls environment Attracted top talent and reduced attrition Generated ~$40B in net interest income vs. ~$38B guidance from last year Incurred ~$31B in adjusted expense1 vs. ~$32B guidance from last year Delivered 29% ROE on net income of $14.9B Extended #1 position in retail deposit share2 by 60bps Extended #1 position in card by outstandings3 by 74bps Strategy Enablers Outcome ✓ ✓ ✓ ✓ ✓ ✓ ✓ ✓ ✓ ✓ ✓ ✓ ✓ ✓ STRATEGIC PRIORITIES AND COMMITMENTS For footnoted information, refer to slide 73 3
  • 38.
    73.6 74.3 76.379.0 4.6 4.9 5.3 5.7 2019 2020 2021 2022 Small businesses Consumers We continue to drive significant customer growth – the catalyst for the franchise Retail deposit share2 9.1% (#3) 9.6% (#3) 10.3% (#1) 10.9% (#1) Business Banking primary bank share3 9.4% (#1) 9.5% (#1) 9.2% (#1) 9.3% (#1) Card sales share4 22.4% (#1) 22.3% (#1) 22.4% (#1) 22.4% (#1) Card O/S share4 16.6% (#1) 16.6% (#1) 16.5% (#1) 17.3% (#1) CCB customers (mm) Since 2019, we have grown our overall customer base by 8% and multi-LOB relationships5 by ~20% 8% 1 For footnoted information, refer to slide 74 4
  • 39.
    We strive tomake it easy to do business with us by engaging customers across channels In 2022, we achieved record high satisfaction across channels5 active digital customers3 63mm+ digital logins4 >15B mobile logins per user per month >20 unique visitors to branches per day ~900k U.S. population within a 10-min. drive to a branch 60% customers met with a banker >20mm #1 Digital banking platform1 1st Retail bank in all lower 48 states2 Enabling customers to manage their full financial lives through our digital banking, lending, and investing capabilities Our branch network is a local storefront for customers who want to engage with our bankers and advisors Increasing branch density For footnoted information, refer to slide 75 5
  • 40.
    We are investingacross our lines of business to serve more of our client needs CONNECTED COMMERCE Customers (mm) 1.6 2.2 2.3 2019 2021 2022 45% Relationships2 (mm) 2.9 3.5 3.8 2019 2021 2022 >75% of Business Banking clients also have a Consumer Banking relationship >85% of first-time investors come from banker referrals3 BUSINESS BANKING Clients5 (mm) WEALTH MANAGEMENT1 Enabled by recent acquisitions >$3 ~$4 ~$8 2019 2021 2022 Chase Travel sales volume ($B) 4 >2x 30% For footnoted information, refer to slide 76 6
  • 41.
    We generate tremendousfranchise value from operating our businesses within CCB and the broader firm World-class capabilities across the firm 100% of J.P. Morgan Wealth Management investments through Asset & Wealth Management Solutions throughout customers’ lifecycles >15% of new Middle Market relationships came from Business Banking last year Unmatched omnichannel distribution Scale of our franchise Leading financial services brand #1 in prospect consideration across peer institutions1 $7B+ in investments to drive sustained growth while delivering industry leading returns CCB JPM Customer Value Employee Value Enterprise Value ~50% of Commercial & Private Banking clients visit our branch network5 Branch network as a storefront for JPMC #1 #1 #1 Consumer Banking Business Banking Card Wealth Merchant Mortgage #1 #1 #2 For Chase clients3 In the industry2 75%+ of mortgage originations4, Business Banking clients, and wealth relationships from existing customers For footnoted information, refer to slide 77 7
  • 42.
    2019 2021 2022 Averagedeposits ($B) $698 $1,055 $1,163 Average loans ($B) $478 $434 $439 Average Card outstandings ($B) $156 $140 $163 Revenue ($B)2 $55.0 $49.9 $54.8 Deposit margin3 2.48% 1.27% 1.71% Expense ($B)2 $28.1 $29.0 $31.2 ROE 31.0% 41.0% 29.0% $21.7 $18.1 $20.9 We continue to deliver strong financial performance CCB Pretax Income ex. LLR ($B)1,2 For footnoted information, refer to slide 78 8
  • 43.
    $49.9 $54.8 $3.5 $1.9 ($0.7) ($0.7) $1.0 2021 Macrorate Volume Overdraft changes Margin MSR / Other 2022 We continue to drive core growth in the business: 2021-2022 ▲ Deposit growth ▲ Card loan and spend growth ▼ Increase in Card acquisition costs ▼ Home Lending production volumes ▼ Auto leases 1 In the first quarter of 2023, the allocations of revenue and expense to CCB associated with a Merchant Services revenue sharing agreement were discontinued and are now retained in Payments in CIB. Prior-period amounts have been revised to conform with the current presentation 2 Totals may not sum due to rounding Net Interest Income ($B) 2022 Actual ~$40 2023 Outlook ex. FRC ~$50 (▲~$10 vs. ‘22) ▲ Card loan yield ▼ Home Lending production margin ▼ Card renewals and refreshes 2 CCB REVENUE ($B)1 9
  • 44.
    $49.1 $54.8 ($5.1) $13.0 ($1.0) ($0.3) ($0.9) 2012 Macro rateVolume Overdraft changes Margin MSR / Other 2022 Revenue walk: 2012-2022 Net Interest Income ($B) 2022 Actual ~$40 2023 Outlook ex. FRC ~$50 (▲~$10 vs. ‘22) Deposit Margin2 2.57% Deposit Margin2 1.71% 1 In the first quarter of 2023, the allocations of revenue and expense to CCB associated with a Merchant Services revenue sharing agreement were discontinued and are now retained in Payments in CIB. Prior-period amounts have been revised to conform with the current presentation 2 Banking & Wealth Management CCB REVENUE ($B)1 10
  • 45.
    $1,173 $1,134 $80 ($47) ($118) $46 1Q22 Customer growthCustomer activity Yield-seeking outflows Yield-seeking inflows 1Q23 We are retaining and growing primary bank relationships and capturing money in motion ▼ JPM WM investments ▼ Internal migration3 ▼ External brokerages ▼ Online banks ▲ Internal migration6 ▲ Net new money $35 JPM WM investments $81 retention of yield seeking flows7 ~60% of banking customers outflow to an online bank with no change in primary bank %5 ~5% YoY customer growth2 >3% Total yield-seeking inflows 4 52% checking 52% checking Core Drivers ~4% For footnoted information, refer to slide 79 decline in deposit balances driven by higher taxes and spend BANKING & WEALTH MANAGEMENT DEPOSIT BALANCES ($B)1 11
  • 46.
    23.9 24.2 We aremaintaining expense discipline while we continue to invest for the future $23.8 $24.0 ~$25 $29.0 $(0.8) $0.9 $0.1 $31.2 ~$(0.1) ~$1.1 ~$0.3 ~$33 $1.9 ~$0.7 2021 Volume- & revenue-related Structural Investments Other 2022 Actuals Volume- & revenue-related Structural Investments Other 2023 Outlook Investments ▲ Wage inflation ▲ Higher headcount ▲ Technology ▼ Auto lease depreciation ▲ Core volume growth ▲ Salesforce incentives $7.0 $5.2 2022 ▲ FDIC base assessment CCB ADJUSTED EXPENSE ($B)1,2,3 For footnoted information, refer to slide 80 ex. FRC 12
  • 47.
    2021 2022 2023 Outlook ~3%CAGR $23.8B ~$25B ~30% Customers per branch6 >15% Tenured Advisors7 >15% Sales productivity per branch8 BRANCH NETWORK & FIELD COST PER ACCOUNT $24.0B 2019 2022 2023 Outlook (5%) For footnoted information, refer to slide 81 >20% Servicing calls per customer3 >50% Total transaction volume4 ~5% Fraud loss rate per transaction5 OPERATIONS & FRAUD COST PER ACCOUNT 2019 2022 2023 Outlook (11%) We are realizing benefits of scale and efficiencies across our business ADJUSTED EXPENSE1,2 (EX. INVESTMENTS)ARE GROWING MODESTLY Other volume- related Other structural Tech production Operations & fraud Branch network & field 13
  • 48.
    $7.1 ~$7.9 $2.7 $3.1 $3.2 $3.9 $1.2 $0.9 2022 2023 Outlook From2022-2023, we will continue to invest in growing the franchise Wealth Management Connected Commerce2 Branch Network Marketing ⚫ Roll-off of travel platform operating expenses ⚫ Deal integration & amortization (cxLoyalty, FROSCH) ⚫ Advisor hiring ⚫ New builds in expansion and mature markets ⚫ Banker hiring ⚫ Acquisitions & deepening ⚫ Branding 6 year payback 4 year break-even 4 year break-even 2 – 3x ROI Growth businesses $0.5 $0.4 $1.4 $2.5 Note: marketing investments are part of ~$8B total gross marketing spend3 Technology & product ⚫ Channels, products, and platform development ⚫ Infrastructure, applications, and data modernization ~50% pays back in <5 years4 Disciplined investment process – focus on long-term growth and profitability $0.71 2023 Status 2022 Return Profile ✓ ✓ ✓ ✓ ✓ Distribution For footnoted information, refer to slide 82 14 CCB INVESTMENTS REPRESENT ~$7.9B OF ~$15.7B IN TOTAL FIRMWIDE INVESTMENTS ($B)
  • 49.
    We continue todeliver customer and business value as we modernize our technology $1.2 $1.4 $1.1 $1.3 $0.3 $0.4 2022 2023 Outlook ~$3.1 Tech modernization Product & design org Tech modernization: Improve speed and quality to help future-proof the business Tech product development: Deliver experiences customers love Tech product development $2.7 Channels Evolve our self-service and digital capabilities Products Offer new products and features Platforms Continuously improve to meet customer needs Digital channels Improved self-service capabilities to reduce call volumes by 20% per customer since 2019 Engagement Total active digital users up 20% vs. 2019 as we continue to launch new features and products Account opening ~11mm accounts opened digitally, up 37% vs. 2019 $0.4 Infrastructure Increase resiliency, scalability, and delivery Applications Faster speed to market Data Transform our data housing and consumption New data centers & public cloud ~50% of applications have migrated out of legacy data centers, on track to migrate ~95% by YE 2024 Interoperability ~65% of customer digital account opening flows moved to target platform, on track to reach 99% goal by YE 2023 Cloud migration ~30% of data is in the public cloud, on target to reach 50% by YE 2023 Looking forward we expect total CCB investment spend growth to moderate – consistent with a profitable growing franchise IMPACT BEING DRIVEN BY OUR TECHNOLOGY INVESTMENTS (SELECT EXAMPLES) 1 Note: Totals may not sum due to rounding 15 TECHNOLOGY AND PRODUCT INVESTMENTS ($B)1
  • 50.
    We closely monitorthe health of our consumers’ balance sheets (1 of 2) Median balances are down from their peak but remain up from pre-pandemic levels Historical avg. Pandemic high Mar '23 Median deposit balances Total population Historical avg. Pandemic high Mar '23 Median operating cash buffers3 (days) Total population Jan ‘20 Mar ‘23 17% 19% Median nominal income growth vs. inflation Inflation rate Nominal income growth (Stable cohort - all incomes) Nominal income growth (Stable cohort - lowest incomes) Operating cash buffers remain above pre-pandemic levels and continue to slowly normalize Nominal incomes are up but inflation has impacted real wage gains All incomes +84% +21% Lowest incomes2 +115% +31% All incomes +126% +75% Lowest incomes2 +183% +92% 31% 4 Stable cohort1 Stable cohort1 5 6 For footnoted information, refer to slide 83 16 98% 54% 84% 21%
  • 51.
    We closely monitorthe health of our consumers’ balance sheets (2 of 2) 39% 11% 9% 36% 4% 3% FY22 vs. FY19 Apr YTD ('23 vs. '22) Apr ('23 vs. '22) Total credit and debit spend growth1 Total population Change in credit spend Change in debit spend Overall, spend remains solid as our portfolio is growing We also track the same customers’ spend over time and see they have recently started to trade down $169 $180 4Q19 1Q23 Period-end card outstandings ($B)3 7% O/S ($) per account Revolve O/S ($) over same time period up ~3% While the number of customers who revolve continues to normalize, those that do revolve have higher balances 10% O/S ($) per revolving account Driven by… 14% % of revolvers (#)5 17% 2.4% - 0… 20% 3.5% 0.3% FY22 vs. FY19 Apr YTD ('23 vs. '22) Apr ('23 vs. '22) Credit spend growth1 Stable cohort2 All incomes Lowest incomes (1.2%) Total population (9%) Stable cohort4 (All incomes) (5%) All incomes +15% / +23% +3% / +2% (2%) / 0% Lowest incomes +19% / +23% +4% / +2% 0% / 0% Stable credit cohort discretionary and non-discretionary spend mix Total population +38% / +38% +10% / +8% +7% / +6% Credit and debit discretionary and non-discretionary spend mix For footnoted information, refer to slide 84 17
  • 52.
    We’ve maintained aprudent risk profile while we continue to grow the business (1 of 2) Card1 Issuer Sub-Prime Mix Sub-Prime Mix 30+ DQs Net Credit Losses 3 4Q19 4Q22 4Q22 as a % of 4Q19 4Q22 as a % of 4Q19 Peer 1 N/D N/D 63% 46% Chase 16% 13% 78% 54% Peer 2 18% 16% 77% 56% Peer 3 20% 18% 97% 70% Peer 4 23% 20% 79% 59% Peer 5 32% 20% 79% 70% Peer 6 28% 26% 82% 68% Peer 7 33% 31% 87% 75% Auto1,2 Issuer 30+ DQs Net Credit Losses 3 4Q22 as a % of 4Q19 4Q22 as a % of 4Q19 Peer 1 82% 87% Chase 89% 80% Peer 2 99% 111% Peer 3 103% 137% INDUSTRY RISK PERFORMANCE METRICS 1 Peer information sourced from public disclosures 2 Chase Auto excludes Wholesale (DCS) & Lease 3 Represents net charge-offs 18
  • 53.
    We’ve maintained aprudent risk profile while we continue to grow the business (2 of 2) 2012 2019 2022 Card % of portfolio <660 FICO score1 16% 16% 13% % of outstandings from balance parker segment2 20% 9% 5% Auto3 % of portfolio <660 credit score4 22% 18% 16% % of portfolio <660 FICO score and LTV >1205 1.6% 2.1% 1.3% Home Lending6 Owned-portfolio avg. FICO1 692 758 769 Owned-portfolio avg. CLTV 79% 55% 51% 2019 2022 ∆ Card % of originations <660 credit score Industry7 10% 13% 3ppts Chase 3% 3% - Auto3 % of originations with term ≥84 months Industry7 12% 18% 6ppts Chase 5% 5% - Home Lending % LTV >80 HFI jumbo origination mix Industry8 11% 13% 2ppts Chase 9% 10% 1ppt ORIGINATION RISK METRICS PORTFOLIO RISK METRICS For footnoted information, refer to slide 85 19
  • 54.
    Credit continues toreturn to pre-pandemic levels ⚫ Consumer balance sheets and credit remain healthy, continuing a path of normalization ⚫ Leading credit indicators – notably early delinquency roll-rates – remain below pre-pandemic levels ⚫ Card entry to delinquency rates are ~80% of pre-pandemic levels, up from the low point in 2Q21 ⚫ Chase Auto loan portfolio loss performance has normalized to pre-pandemic levels 2019 2020 2021 2022 2023 Outlook Card 3.10% 2.93% 1.94% 1.47% ~2.6% Auto 0.33% 0.20% 0.05% 0.21% ~0.5% Retail only 0.44% 0.25% 0.04% 0.24% ~0.55% Home Lending (0.05%) (0.09%) (0.17%) (0.14%) ~0.0% Business Banking1 0.58% 0.57% 0.53% 0.40% ~0.6% ex. Overdraft 0.47% 0.48% 0.41% 0.17% ~0.35% < 3.5% 2024 Outlook > 3.5% 2025 Outlook CREDIT RISK OUTLOOK NET CHARGE-OFF GUIDANCE 1 Excludes Paycheck Protection Program loans 20
  • 55.
    ⚫ Primary driverof stress scenario is unemployment rate (UER) ⚫ Losses typically lag UER, and will vary depending on when UER peaks and shape of recovery ⚫ Table on the right shows annualized average losses over the two-year period 1Q24-4Q25, and cumulative losses over the same period Annualized avg. (%) Cumulative ($) Central case ~3.5% ~$15.5B Moderate recession scenario ~4.8% ~$18.8B Incremental +130bps +$3.3B Estimated 2-Year net credit losses (2024-2025) Unemployment rate 0% 1% 2% 3% 4% 5% 6% 7% 8% 4Q22 1Q23 2Q23 3Q23 4Q23 1Q24 2Q24 3Q24 4Q24 1Q25 2Q25 3Q25 4Q25 1Q26 2Q26 3Q26 4Q26 Moderate recession (peak 3Q24) Central case 5.1% 7.1% KEY ASSUMPTIONS – NOT AN OUTLOOK1 Stress scenario analysis for Card 1 Federal Reserve's 2022 DFAST Results and Methodology Disclosure remains instructive data point for more severe recession 21
  • 56.
    Our Home Lendingportfolio is in a position of strength with low delinquencies and strong LTVs Our business is well-positioned given current levels of equity and portfolio quality Home Lending portfolio by CLTV1,2 30+ Delinquency % (based on $) Financial Crisis Pre-Covid Current 20103 Mar ‘20 Mar ‘23 13.5% 1.5% 0.8% We continue to prepare for a variety of stress scenarios 30+ delinquency rate at 0.2% if vintages prior to 2010 are excluded ~5% of portfolio resides in 80%+ HPI trough (5%) (15%) Peak UER 5.1% 7.1% Central case Moderate recession Estimated 2024-2025 NCOs ($mm) < 100 < 300 47% 21% 16% 11% 4% 1% <50% 50-60% 60-70% 70-80% 80-90% >=90% Home prices remain elevated but have begun to decline from recent peaks Major markets with >10% forecasted HPI4,5 declines from peak to YE 2023 ▪ Additional expected decline (current to Dec’23) ▪ Actual decline (2022 peak to current) ▪ % HFI 2022 originations6 -13% -11% -10% -9% -11% -6% -9% -7% -9% -6% -8% -6% -7% -7% -7% -8% -6% -8% -5% -7% -4% -7% -5% -3% 9% 6% 2% 3% 3% 1% 1% 3% 1% 1% 4% 11% -20% -18% -17% -17% -16% -14% -14% -14% -13% -13% -13% -10% San Francisco-Oakland-Hayward, CA Seattle-Tacoma-Bellevue, WA Austin-Round Rock, TX Phoenix-Mesa-Scottsdale, AZ San Jose-Sunnyvale-Santa Clara, CA Portland-Vancouver-Hillsboro, OR-WA Las Vegas-Henderson-Paradise, NV Denver-Aurora-Lakewood, CO Sacramento-Roseville-Arden-Arcade, CA Nashville-Davidson-Murfreesboro-Franklin, TN San Diego-Carlsbad, CA Los Angeles-Long Beach-Anaheim, CA For footnoted information, refer to slide 86 22
  • 57.
    We run ourbusiness for the long-term and manage through cycles Forward-looking guidance of 25%+ ROE through the cycle Current outlook is uncertain as macro factors may pressure short term returns Benefits of reprice lags Deposit outlook Credit trends We leverage the power of the CCB franchise remaining confident in our strategies through cycles Scale of our customer relationships Strength and diversification of our businesses Operational excellence and discipline Investment through cycles with unmatched capacity 23
  • 58.
    We have consistentlydriven core growth and strong returns over the long term For footnoted information, refer to slide 87 $11.7 $12.3 $13.4 $14.4 $15.2 $15.0 $19.4 $21.7 $18.8 $18.1 $20.9 2012 2013 2014 2015 2016 2017 2018 2019 2020 2021 2022 $1,066 $2,249 7.1% (#3) 10.9% (#1) 20.5% (#2) 22.4% (#1) 17.7% (#1) 17.3% (#1) 6.2% (#3) 9.3% (#1) Fed Funds effective rate6 CCB pretax income ex. LLR ($B)5 CCB ROE ex. LLR5 Client balances ($B)7: 8% CAGR Retail deposit share (%)8: +380bps Card sales market share (%)9: +190bps BB Primary bank share (%)10: +310bps 0.14% 0.11% 0.09% 0.13% 0.40% 1.00% 1.83% 2.16% 0.38% 0.08% 1.68% 16% 15% 15% 17% 18% 18% 28% 31% 26% 26% 31% Card O/S share (%): (40bps) Card O/S share is up >200bps since 2012 when adjusting for risk- appetite CONSUMER & COMMUNITY BANKING – 10-YEAR PERFORMANCE1,2,3,4 24
  • 59.
  • 60.
    We are makingstrong progress against our strategy #1 retail bank based on deposits1 Consumer Banking Branch Network ⚫ Grow: ~40mm customers, up 14% since 20192 ⚫ Engage: ~80% primary bank ⚫ Deepen: ~50% of primary customers are multi-LOB3 1st bank in all lower 48 states ⚫ Grow: #1 deposit share in 11 of top 50 markets4 ⚫ Engage: >75% of balances held by regular branch visitors5 ⚫ Deepen: ~20% increase in banker productivity since 2019 Optimize and extend our branch network to reach and gain trust in more local communities Strengthen and tailor our customer value propositions to extend leadership position Consumer Banking Branch Network Business Banking Card & Connected Commerce WE’RE THE MARKET LEADER OUR STRATEGY IS WORKING AND WE WILL EXTEND OUR LEAD For footnoted information, refer to slide 88 26
  • 61.
    We have continuedto drive core growth in our business Consumer Banking Branch Network Business Banking Card & Connected Commerce 27 1 “Consumer Banking customer” reflects unique individuals that have financial ownership or decision making power with respect to Consumer Banking accounts 14% 11% 35.4 37.9 39.2 40.4 2019 2020 2021 2022 14% We added 1.6mm net new checking accounts in 2022 4.5% CAGR Consumer Banking customers (mm)1 Average deposits ($B) $535 $629 $772 $848 Debit card sales ($B) $314 $339 $414 $431
  • 62.
    18.3% 11.3% 10.1% Our core customergrowth has driven significant outperformance 9.1% 9.9% 9.8% 10.9% 10.3% 9.8% 2019 2022 2019 2022 2019 2022 #3 #1 #1 #2 #2 #3 Rank4 +180bps +40bps flat Chase Peer 1 Peer 2 Chase Large Banks2 Industry (ex. Chase) 3-year deposit CAGR1 WE OUTPERFORMED PEERS IN DEPOSIT GROWTH SINCE 2019… National retail deposit share3 …WHICH HAS LED TO ~180BPS OF DEPOSIT SHARE GAIN Consumer Banking Branch Network Business Banking Card & Connected Commerce For footnoted information, refer to slide 89 28
  • 63.
    Satisfied Loyal Engaged Our primary bankcustomers are satisfied, loyal, and engaged ~80% of primary bank customers would recommend Chase2 of Consumer Banking checking customers partner with us as their primary bank1 ~80% of Consumer Banking Gen Z and Millennial consumer checking customers are primary bank retention rate among primary bank customers4 >95% >75% >75% >75% of customers are mobile active7 of balances held by customers who regularly use branches6 customer satisfaction across branch and digital channels3 Record high of primary bank customers choose Chase for other financial needs5 ~50% Consumer Banking Branch Network Business Banking Card & Connected Commerce For footnoted information, refer to slide 90 29
  • 64.
    Our customers engagewith Chase to make payments and manage their finances 2019 2022 Cash & check Debit Digital ~40% (25%) ~26mm active Zelle customers2 >35 monthly debit transactions per active debit customer3 2019 2022 Mobile-active >75% +9ppts Not mobile-active ~50% of mobile-active Consumer Banking users engage with our financial health tools5 ~9B digital logins by Consumer Banking users6 Transactions by method of payment1 CUSTOMERS ARE SHIFTING TO DIGITAL PAYMENTS… Mobile engagement4 …AND USING THE CHASE APP TO MANAGE THEIR FINANCES Consumer Banking Branch Network Business Banking Card & Connected Commerce For footnoted information, refer to slide 91 30
  • 65.
    Wealth Management Business Banking Credit Card Home Lending >75% of retail volumeis from Consumer Banking customers >75% of Business Banking clients also have a Consumer Banking relationship >45% of Branded Card members are also Consumer Banking customers1 ~90% of Wealth Management relationships also have a Consumer Banking relationship2 ~50% of Consumer Banking primary customers are engaged across products Increases relationship value Strengthens banking relationship Lowers cost of acquisition Consumer Banking CONSUMER BANKING SERVES A HIGH PROPORTION OF CUSTOMERS ACROSS EACH LOB AND GENERATES TREMENDOUS VALUE FOR THE FIRM Consumer Banking Branch Network Business Banking Card & Connected Commerce 31 1 Excludes small business customers 2 Consumer and small businesses with Wealth Management relationships with balances >$0
  • 66.
    We continue tostrengthen our value proposition to meet the needs of customers across segments 2019 2022 2019 2022 Products & Services Advice ⚫ Launched Early Direct Deposit on Secure Banking ⚫ Launching Freedom Rise for new-to-credit ⚫ Scaled Community Centers and branches to build trust and financial health locally ⚫ Developing Credit Journey features for credit building and new-to-credit ⚫ Deployed higher yield options for cash management ⚫ Improved payments experiences ⚫ Launched Wealth Plan to help clients plan for the future ⚫ Adding banker and advisor capacity to serve more client needs Low-cost entry to banking with tailored solutions to build financial health Relationship proposition to meet banking, lending, and investing needs 2019 2022 ⚫ Strengthened Overdraft Assist with next day no fee / $50 buffer ⚫ Launched Pay in 4 to select customers ⚫ Launched Personal Advisors for mass affluent clients looking for low-cost advice ⚫ Continuing branch expansion to serve more communities Full-service banking solution to meet spend, save, and liquidity needs Emerging segments Affluent segments Mass market segments ~75% ~5% ~20% % of accounts4 # OF LOW-COST CHECKING ACCOUNTS1 # OF MASS MARKET CHECKING ACCOUNTS2 # OF PRIVATE CLIENT RELATIONSHIPS WITH DEPOSITS AND INVESTMENTS3 Consumer Banking Branch Network Business Banking Card & Connected Commerce ~40% ~10% ~30% For footnoted information, refer to slide 92 32
  • 67.
  • 68.
    5,293 4,831 2017 2022 We haveaccelerated our growth as we have extended and optimized our branch network $119 $227 2017 2022 Chase Large banks2 (ex. Chase) % of current network opened in the last five years4 15% 3% % of network consolidated in the last five years5 22% 24% (1.8%) CAGR Large Banks2 (ex. Chase) (4.7%) CAGR 13.8% CAGR Large banks2 (ex. Chase) $165mm3 Chase Large banks2 (ex. Chase) Deposits per branch (10+ years cohort)4 $259mm $170mm Deposits per branch (5-10 years cohort)4 $154mm $97mm BRANCH COUNT1 DEPOSITS PER BRANCH ($mm)1,6 Consumer Banking Branch Network Business Banking Card & Connected Commerce We have increased the number of consumer and small business customers per branch by ~30% from 2019 to 20227 For footnoted information, refer to slide 93 34
  • 69.
    Network expansion createsan unparalleled growth engine Meaningful contribution: 7% 3% 15% 5% 3% 6% 79% 88% 94% Chase Large banks2 (ex. Chase) 0-5 years 10+ years ~$85B in deposit growth since 2017 from branches <10 years old3 5-10 years ~4 year break-even on new builds4 More upside: ~$160B in incremental deposits as our branches mature to look like our seasoned network5 <5% branch share in 19 of the top 50 markets, including 3 of the top 10 (DC, Boston, Philadelphia)1,6 Industry Branch network by age cohort1 WE HAVE INVESTED IN NEW BRANCHES FASTER THAN PEERS THESE INVESTMENTS ARE CONTRIBUTING MEANINGFULLY TO OUR PERFORMANCE, WITH MORE UPSIDE Consumer Banking Branch Network Business Banking Card & Connected Commerce For footnoted information, refer to slide 94 35
  • 70.
    We have ademonstrated ability to grow in different starting positions and markets 11.6% 14.8% 20.4% 2012 2017 2022 1.6% 4.2% 6.3% 2012 2017 2022 0.8% 2012 2017 2022 Out of footprint 8.8ppts 111 new builds from 2012-20224 ~$9B deposit growth from 2012-20221 ~$2B deposit growth from 2017-20221 4.7ppts 13.7% 16.5% 16.9% Branch share2 5.7% 6.7% 8.7% Branch share2 0.0% 0.0% 2.6% Branch share2,3 ~$86B deposit growth from 2012-20221 42 new builds from 2017-20224 35 new builds from 2012-20224 0.8ppts Deposit share1 LOS ANGELES Deposit share1 ATLANTA Deposit share1 BOSTON Consumer Banking Branch Network Business Banking Card & Connected Commerce For footnoted information, refer to slide 95 36
  • 71.
    Branches are animportant part of our omnichannel service and engagement model 2019 2022 Branch- centric Multi- channel Digitally- centric 2019 2022 >75% of balances are held by customers who regularly use branches (~25%) ~20% Everyday branch transactions1 WE ENABLE CUSTOMERS TO SELF-SERVE Balance by customer channel engagement behavior2 CUSTOMERS CONTINUE TO VISIT BRANCHES Productivity per banker3 WE ARE MEETING MORE CLIENT NEEDS Consumer Banking Branch Network Business Banking Card & Connected Commerce For footnoted information, refer to slide 96 37
  • 72.
    Wealth Management Business Banking Credit Card Home Lending Our branches arethe storefront for JPMC across lines of business ~50% of mortgages are originated in branches2 ~85% of business checking accounts are opened in branches ~25% of Branded credit cards are opened in branches >85% of first-time investors come from banker referrals1 Branch team of experts OUR BRANCH TEAMS GENERATE TREMENDOUS VALUE FOR THE FIRM ACROSS CCB AND JPMC MORE BROADLY Creates a talent pipeline Serves a wide range of client needs Drives acquisitions across channels Consumer Banking Branch Network Business Banking Card & Connected Commerce 38 1 Represents first-time investors with full-service relationships through Chase Wealth Management 2 Represents mortgage originations from branch Home Lending Advisors
  • 73.
    We are extendingour network to cover more Americans and gain trust in local communities 5,293 Branches1 4,831 ~60% U.S. population coverage by market3 ~80% 50% U.S. population coverage within a 10-minute drive time4 60% 68% Small business coverage5 87% $4.4T Addressable deposits6 $7.9T ~85% coverage by market Looking ahead: ~70% coverage within a 10-minute drive time 2017 CHASE BRANCH NETWORK COVERAGE BY STATE1 2022 CHASE BRANCH NETWORK COVERAGE BY STATE1 Consumer Banking Branch Network Business Banking Card & Connected Commerce Increasing branch share2 For footnoted information, refer to slide 97 39
  • 74.
  • 75.
    41 585 The small businessecosystem remains healthy despite economic headwinds Monthly small business formations (#k)1 Small business formations are elevated vs. pre-pandemic… 40 140 240 340 440 540 640 Jan-19 Jan-20 Jan-21 Jan-22 Jan-23 Consumer Banking Branch Network Business Banking Card & Connected Commerce Small business optimism index2 …and while optimism remains low… 80 85 90 95 100 105 110 Jan-19 Jan-20 Jan-21 Jan-22 Jan-23 Cash buffers (# of days of reserves, indexed to start of period)3 …our clients are healthy, with strong cash buffers… 30-day delinquency rates (relative to start of period)3 …and relatively low delinquencies 60% 80% 100% 120% 140% 160% 180% 200% Jan-19 Jan-20 Jan-21 Jan-22 Jan-23 -0.8% -0.4% 0.0% 0.4% 0.8% 615 355 101 90 100% 187% 130% Start 91 Pandemic peak Jan-19 Jan-20 Jan-21 Jan-22 Jan-23 +46bps -13bps -80bps -40bps 0bps +40bps +80bps 1 Source: U.S. Census – Business and Industry Time Series, Monthly Business Formation Statistics; not seasonally adjusted 2 Source: NFIB: Optimism Index 3 Cash buffers data based on fixed cohort of clients active in both January 2020 and November 2022, with balances/outflows tracked from January 2019–March 2023; delinquency rates based on both Business Banking line/loan and Chase Small Business Card – excl. PPP loans, overdrafts
  • 76.
    42 We serve ~6mmsmall- and medium-sized businesses (SMBs) across Chase for Business1 Consumer Banking Entrepreneurs who start businesses Chase for Business <$20mm sales size Commercial Banking ~$20mm-$2B sales size2 Corporate & Investment Bank >$2B sales size Business Banking Business Card Payments Services #1 Primary bank market share3 Today’s focus #2 SMB credit card spend3 #1 Payment provider for Business Banking clients1 Consumer Banking Branch Network Business Banking Card & Connected Commerce 1 6MM client count as of December 2022; payment provider rank as of April 2023 2 Annual sales size thresholds are directional and do not apply to select core segments and specialized industries within Commercial Banking 3 Primary bank market share sourced from Barlow Research Associates as of 4Q22. Rolling 8-quarter average of small businesses with sales size between $100k-$25mm; SMB credit card spend share based on internal estimates of Nilson (only 2021 available) and 2022 actuals if available
  • 77.
    43 We help businessesof all sizes start, run, and grow with Chase WE SERVE ALL TYPES OF SMALL- AND MEDIUM-SIZED BUSINESSES… ~65% of BB clients start in Consumer Banking ~30% of large BB clients started as small clients2 >15% of new Middle Market relationships come from BB1 Start Run Grow ~40% ~50% ~10% <$100k $100k-$1mm >$1mm (1) Professional Services (2) Real Estate (3) Construction (4) Retail (5) Healthcare (6) Transportation (7) Other 6.2% 9.3% 2012 2022 #3 #1 +310bps Primary bank market share and rank3 Annual sales size and industry mix of BB clients Consumer Banking Branch Network Business Banking Card & Connected Commerce 1 2 3 4 5 6 7 …HELPING THEM START, RUN, AND GROW… …EARNING US THE RIGHT TO BE THE TOP BUSINESS BANK IN THE U.S. 1 Data reflects FY2022 2 Large clients defined as businesses with an annual sales size of $1mm or greater; Small clients defined as businesses with an annual sales size of under $1mm; captures client sales size growth between 2020 and 2022 3 Primary bank market share sourced from Barlow Research Associates as of 4Q22. Rolling 8-quarter average of small businesses with sales size between $100k-$25mm
  • 78.
    44 Our business isgrowing rapidly and delivers strong economics Business Banking clients (mm) 2.9 3.2 3.5 3.8 0 0.5 1 1.5 2 2.5 3 3.5 4 2019 2020 2021 2022 Average deposits ($B) $136 $175 $226 $259 Average loans ex. PPP ($B) $24 $24 $22 $20 Primary bank rank1 #1 #1 #1 #1 30% OUR BUSINESS HAS GROWN SIGNIFICANTLY… ~3x higher balances per average BB account vs. average Consumer Banking account ~80% of balances in noninterest- bearing checking accounts ~9% CAGR + 90% since ‘19 We originated >340k net new checking accounts in 2022 Consumer Banking Branch Network Business Banking Card & Connected Commerce …THESE RELATIONSHIPS HAVE STRONG ECONOMICS 1 Primary bank market share sourced from Barlow Research Associates as of 4Q22. Rolling 8-quarter average of small businesses with sales size between $100k-$25mm
  • 79.
    45 The key toour success is continuing to win clients’ primary bank relationships Are satisfied ~70% digital and ~85% branch satisfaction Are loyal ~95% retention rate1 Are engaged ~75% use multiple channels2 Have higher balances ~4x higher balances vs. non-primary Have multiple products ~10ppts higher SMB card ownership 2 of 3 Chase Business Banking clients choose us for their primary operating account These clients: 2. An industry-leading omnichannel service model anytime, anywhere, in the channel of their choice 1. A complete suite of products and services that make Chase the best place to start, run, and grow a small business PRIMARY CLIENTS ARE SATISFIED, LOYAL, AND ENGAGED Consumer Banking Branch Network Business Banking Card & Connected Commerce WE EARN PRIMARY BANK RELATIONSHIPS THROUGH BEST-IN-CLASS SOLUTIONS AND EXPERIENCES 1 Excluding businesses <2 years old from formation 2 Both digital and branch active in 2022
  • 80.
    46 Our comprehensive suiteof financial products and services makes Chase the best place to start, run, and grow a small business ✓ Entry-level and premium checking ✓ LegalZoom partnership ✓ Payments services including Zelle, Wires, Bill Pay ✓ Coming soon: Digitizing more customer activities ✓ Coming soon: Invoicing Banking and Cash Management Invoicing ✓ Entry-level, premium, and co-brand credit cards ✓ SBA1, small- and large-dollar lending, digital lending ✓ Coming soon: Expanding Credit Journey Credit Card / Lending Lending platform modernization ⚫ 6 app inputs (vs. 50+)2 ⚫ <5 mins to complete ⚫ Automated post-app tasks ✓ Merchant Services integrated with core banking ✓ Everyday 401(k) ✓ Fraud Hub ✓ Coming soon: Tap To Pay ✓ Coming soon: Payroll Merchant and Adjacent Services Everyday 401(k) Consumer Banking Branch Network Business Banking Card & Connected Commerce 1 Small Business Administration 2 Comparison reflects comparable product on modernized platform vs. legacy
  • 81.
    47 Our best-in-class omnichanneloffering allows us to serve our clients anytime, anywhere, in the channel of their choice Multi- channel ~80% of clients are digitally active ~65% of clients are multi- channel active Deliver more omnichannel experiences: ⚫ Interactive demos for prospects ⚫ Video meetings for bankers and clients ⚫ Schedule a banker meeting online Amplify our digital channels with: ⚫ Enhanced merchant offers ⚫ Expanded Credit Journey ⚫ Enhanced customer insights >1B digital log-ins in 2022 ~85% branch satisfaction, ~70% digital satisfaction Serving our clients anytime, anywhere, in the channel of their choice Digital People Physical Network ~90% of assigned clients met with a Relationship Manager2 ~80% of clients visit a branch Continue to leverage our expanding branch footprint which currently covers 87% of U.S. small businesses1 Hire ~1,000 Relationship Managers by 2025, given assigned clients have: ⚫ Higher retention ⚫ More multi-product relationships ⚫ Higher customer satisfaction ~4,800 Chase branches, >15,000 ATMs ~12,000 Consumer Bankers & ~2,300 Business Relationship Managers Consumer Banking Branch Network Business Banking Card & Connected Commerce 1 Small business coverage by CBSA based on Dun and Bradstreet Small Business locations. Small business defined as <$20mm in annual sales size 2 180-day contact rate for clients assigned to either a remote or in-person Business Relationship Manager
  • 82.
    48 The value ofBusiness Banking relationships extends to the rest of CCB and JPMC >15% of new Middle Market relationships came from BB last year ~40% of total CCB deposits held by BB clients1 >5ppt higher share of Private Bank client wallet when they have BB relationship2 ~50% more Business Card clients with a BB relationship vs. 2019 >75% >2x of accounts opened by existing CCB clients are originated without a marketing offer higher average BB client revenue when clients have multiple CCB relationships (vs. BB-only) Increased revenue per client Lower cost of acquisition Business Banking generates tremendous value for the Firm… …and benefits significantly from CCB and JPMC Card Banking & Wealth Private Bank Commercial Banking Business Banking Consumer Banking Branch Network Business Banking Card & Connected Commerce 1 Includes deposits held by Business Banking clients in business and personal accounts; as of January 2023 2 Excludes Private Bank clients who are only associated with Business Banking clients generating <$100k sales size, and client records that do not have wallet share data available; as of May 2023
  • 83.
    49 We have acompelling opportunity for continued growth Industry-leading share of a rapidly-growing market ✓ ~450k small businesses formed each month1 ✓ #1 primary bank share2 ✓ ~9% annual client growth since 2019 ✓ ~80% of balances in noninterest-bearing checking accounts ✓ ~40% of CCB deposits are held by BB clients ✓ ~2,300 Business Relationship Managers held 1.4mm3 client meetings ✓ ~4,800 branches that reach 87% of U.S. small businesses4 ✓ ~80% of clients are digitally active, with >1B total log-ins in 2022 Unparalleled scale with a localized service model Strong unit economics and contribution to the Firm Consumer Banking Branch Network Business Banking Card & Connected Commerce For footnoted information, refer to slide 97
  • 84.
  • 85.
    4.8 2.7 2.4 2019 20212022 5.9 6.4 6.5 2019 2021 2022 11.5 12.1 13.7 2019 2021 2022 31% 35% 32% 2019 2021 2022 Our Card franchise continues to be the industry leader in sales and outstanding balances 43 47 52 2019 2021 2022 16.4 14.8 16.1 2019 2021 2022 156 140 163 2019 2021 2022 763 893 1,065 2019 2021 2022 Active accounts (mm)2 Average outstandings ($B) Sales volume ($B) Revenue ($B)3 21% 40% 4% Risk-adjusted revenue ($B)3,4 19% Net charge-offs ($B) ROE ex. LLR4 (50%) Pretax income ex. LLR ($B)4 10% 3.10% 1.94% 1.47% NCO Rate (2%) #1 in card sales volume since 20171 #1 in card outstandings for more than a decade1 98% customer retention in 2022 WE CONTINUED TO SCALE ACTIVE ACCOUNTS AND SALES – AND HAVE SEEN AVERAGE OUTSTANDINGS REBOUND FROM PANDEMIC LOWS WE MAINTAINED OUR POSITION OF STRENGTH 1Q23 EOP O/S of $180B Consumer Banking Branch Network Business Banking Card & Connected Commerce 51 For footnoted information, refer to slide 99
  • 86.
    Our strategy willdrive sustained success while making our business more resilient over time STRATEGY Create deeper customer relationships Grow our card member base across key segments Engage through experiences customers love WHAT WINNING LOOKS LIKE >$30B volume through our Commerce platforms in 2025 70 NPS across Card and Commerce experiences ⚫ Drive sticky relationships with customers through best-in-class experiences ⚫ Deepen relationships with customers across CCB and merchants across JPMC ⚫ Launch new, tailored products to win in key segments, including SMB and Starter ⚫ Fuel continued growth through our world-class marketing and distribution engine ⚫ Build out our two-sided platform through Connected Commerce ⚫ Continue to expand on our core enablers: payments and lending capabilities 20% share of industry outstandings in Card ACTIONS WE ARE TAKING Consumer Banking Branch Network Business Banking Card & Connected Commerce 52
  • 87.
    10.7% 12.0% 21.8% 22.4% 20.4% 20.4% 20172018 2019 2020 2021 2022 We continually launch and refresh Card value propositions to deliver industry leading engagement sales share3 #1 Peer 1 Peer 2 10.0% 10.8% 16.2% 17.3% 7.0% 8.8% 2017 2018 2019 2020 2021 2022 outstandings share3 #1 Peer 1 Peer 2 24 products launched or refreshed since 2019 97% of co-brand sales contractually extended to at least 20271 CARD HIGHLIGHTS Continually launching and refreshing our world-class card products while building stronger partnerships to expand our reach Investing in new lifestyle benefits and experiences to differentiate our products, and grow engagement with our customer base 3 airport lounges launched, with 2 more coming later this year ~70% of fee-based card demand driven by Millennial and Gen Z2 Consumer Banking Branch Network Business Banking Card & Connected Commerce MARKET PERFORMANCE 53 For footnoted information, refer to slide 100
  • 88.
    We are investingin products and experiences for key segments to drive growth Strategic Focus Progress Starter Launching Freedom Rise in select channels this year Leveraging the strategic advantage of our branches to help new-to- credit prospects Affluent Differentiating with investments in travel and dining assets and capabilities Closely integrating key assets with the Sapphire brand Small Business Expanding our product suite to better serve the full continuum of SMB needs Launched Business Premier in all channels in October 2022 Lounges Concierge Services Dining Addressable Market U.S. consumers1 >25mm U.S. SMBs2 >40mm U.S. consumers3 >40mm Consumer Banking Branch Network Business Banking Card & Connected Commerce 54 For footnoted information, refer to slide 101
  • 89.
    $3.1 $2.1 $3.8 $4.0 $4.3 $1.3 $1.1 $1.4 $1.7 $1.6 2019 20202021 2022 ID Outlook 2022 Actuals Product Benefits (incl. co-brand) Acquisition, Distribution & Media Our marketing engine fuels our scale and distribution CARD GROSS CASH MARKETING SPEND ($B)1 KEY DRIVERS AND PERFORMANCE METRICS $4.5 $5.9 Revenue Outlook from 2022 ID Revised Outlook >30%2 >50%2 New accounts – 2022 vintage vs. 2019 New accounts 14% 23% Active accounts Outlook from 2022 ID 2022 Actuals 16% 21% Total portfolio – 2022 vs. 2019 Sales volume 33% 40% Annual fee revenue 20% 28% $3.2 $5.2 $5.7 Our disciplined approach to marketing enables us to generate predictable returns Lifetime value >1.5x3 >1.7x3 Consumer Banking Branch Network Business Banking Card & Connected Commerce 55 For footnoted information, refer to slide 102
  • 90.
    We are improvingproductivity to better acquire and serve customers, and optimize expense ⚫ Our channels are getting more productive Of new Branded card accounts acquired through owned-channels in 2022 (+3ppts YoY)1 85% ⚫ Our discipline drives more efficient account production Decrease in customer call-in rates since 20192 3ppts Increase in accounts originated from pre- qualified offers in 2022 vs. 2021 4ppts ⚫ Our investments drive a more seamless experience Increase in digital active card customers as % of total card base since 2019 5ppts Improvement in Card fraud loss rate since 2019 ~1.5bps Increase in new account production in 2022 vs. 2021 21% ⚫ Our ecosystem is serving customers more efficiently WE ARE MORE PRODUCTIVE AT ACQUIRING CUSTOMERS… …AND SERVING THEM MORE EFFICIENTLY ONCE ACQUIRED Consumer Banking Branch Network Business Banking Card & Connected Commerce 56 1 Owned channels include phone, chase.com, refer a friend, retail, and direct mail 2 Call-in rate is defined as the number of customer calls to specialists relative to annual customer statements
  • 91.
    Our two-sided platformdelivers unmatched value for consumers and brands Brands Consumers >63mm Digital active customers2 >20 Monthly mobile logins per user Digital Ecosystem #1 Credit card issuer with >$1T in sales >$5.6T Payments volume1 Consumer Payments #1 Consumer bank based on deposits #1 Most visited banking portal in U.S.3 Base Beyond Card Airlines Hotels Offers & Shopping Dining And >650 Luxury Hotel & Resort Collection partners And >500 merchants on Chase Offers in 2022 Benefits Scale of our assets Breadth of our solutions Richness of our data No provider can match the: Connected Commerce ~300k hotel properties including… >200 airline partners including… Consumer Banking Branch Network Business Banking Card & Connected Commerce 57 For footnoted information, refer to slide 103
  • 92.
    We are on-trackto become a household name in premium leisure travel >$3B ~$8B ~$15B 2019 2022 2025 Outlook Chase Travel sales volume ($B)3 ✓ On track to hit ~$10B in Chase Travel sales this year Chase Travel Creating an end-to-end journey that delivers curated content, unique experiences, and elevated servicing while operating as a self-sustaining business Booking platform that enables end- to-end control over the experience Highly-tenured agents that deliver unique, customized trips High Tech High Touch 1 in 4 Leisure travel dollars spent on Chase cards 24% YoY growth in transactions through Chase Travel2 Top 5 Consumer leisure travel provider1 ~40% YoY growth in customers purchasing travel on Chase2 PERFORMANCE HIGHLIGHTS CHASE TRAVEL VISION Consumer Banking Branch Network Business Banking Card & Connected Commerce 58 For footnoted information, refer to slide 104
  • 93.
    We are applyingour consistent playbook to expand beyond Travel to win in Shopping and Dining Where we are on our strategy Identify high value experiences that resonate with card members Our strategy will migrate category spend to our platforms – driving >$30B in volume and ~$2B in revenue in 2025 Acquire capabilities to create differentiated on-us journeys and own the economics 1 3 Accelerate engagement in existing channels and products with benefits, rewards, and content 2 Key success metrics1 Addressable spend Travel Reaching new customers through premium servicing and content in Chase Travel sales volume3 ~$8B Chase Travel visits ~40mm Category spend on Chase cards2 >$140B Shopping Integrating our platform and data to enable better targeting and personalization in attribution spend volume5 >$6B Offers served to customers4 >9B Category spend on Chase cards2 >$470B Dining Expanding access to curated content and experiences to accelerate engagement Unique monthly visitors7 >5mm Venues covered6 >25k Category spend on Chase cards2 >$90B Journey Make Chase the best platform to book travel, explore shopping, and discover new dining experiences HOW WE’RE APPLYING OUR PLAYBOOK: OUR COMMERCE PLAYBOOK: Consumer Banking Branch Network Business Banking Card & Connected Commerce 59 For footnoted information, refer to slide 105
  • 94.
    Payments and lendinginnovation are core enablers of our Connected Commerce strategy >$5.6T Payments volume1 Installments at POS Card-linked installments >27B Payment transactions1 2022 HIGHLIGHTS Pay in 4 Paze Card-based Pay-over-time solutions Checkout Credit and debit Highly engaged payments4 customers have higher average NPS and higher likelihood to have multi-LOB relationships >67mm Payments active customers2 >25mm Customers transacting >1 times a day >$1.5T Credit and debit spend volume Live today Live today Launching soon Launching soon3 My Chase Plan originations scaled 3x faster than BNPL competitor outflows YoY SM Consumer Banking Branch Network Business Banking Card & Connected Commerce $260.42 $130.21 $86.81 60 For footnoted information, refer to slide 106
  • 95.
    We are investingin critical capabilities and experiences to better serve customers across all segments “Best hotel co-brand credit card” – The Points Guy1 “Best hotel travel card” – CNN7 “Best cash-back credit card” – CNBC Select6 “Best airline credit card” – Forbes Advisor5 “Best overall business card” – CNET3 70 NPS On our path to achieving NPS for select segments, 2022 Usage of machine learning to understand drivers of dissatisfaction Investments in servicing innovation (e.g., dispute tools, chatbots) Value of NPS: satisfied customers spend >30% more and attrite ~2x less8 Customer complaints, 2019-2022 “Best card for small businesses” – Money.com2 “Best travel rewards credit card” – The Points Guy1 “Best premium card for travel and dining” – Business Insider4 WE ARE BEING RECOGNIZED FOR THE WORK WE ARE DOING… …AND ARE TAKING ACTION TO BUILD UPON THIS MOMENTUM Reduction in customer complaints 19% +3 NPS for Mass vs. 2021 +1 NPS for SMB vs. 2021 +2 NPS for Affluent vs. 2021 Consumer Banking Branch Network Business Banking Card & Connected Commerce 61 For footnoted information, refer to slide 107
  • 96.
    Consumer Bank Corporate & Investment Bank ~25% of ChaseOffers merchants sourced through our B2B franchises in 20222 >45% of Branded Card members are also Consumer Banking customers1 ~40% of SMB Card members have a Business Banking relationship ~17ppts higher Card approval rate when customer has a deposit account Being part of the JPMC ecosystem broadens our scale and distribution Card Card contributed ~50% of new CCB customers in 2022 – providing a significant deepening opportunity to the franchise1 Consumer Banking Branch Network Business Banking Card & Connected Commerce Business Bank 62 1 Excludes small business customers 2 Reflects offers sourced through J.P. Morgan Payments and Business Banking
  • 97.
  • 98.
    Our competitive advantageswill enable sustained outperformance for decades to come Forward-looking guidance of 25%+ ROE through the cycle The scale of our customer relationships is the catalyst for everything We operate with excellence and execute with discipline We run this franchise for the long term, with unmatched capacity to invest The strength and diversification of our businesses create resilience of returns The Power of the CCB Franchise 64
  • 99.
  • 100.
    Expert advice and guidance Premium service Valuefor relationship Elevated service and seamless experiences ⚫ Cross-product priority servicing experience ⚫ Higher limits and enhanced authorizations ⚫ Proactive client servicing Easy access to a team of experts ⚫ Banker or advisor as a relationship quarterback ⚫ Financial planning, investment, and borrowing advice ⚫ Expanded banker and advisor capacity Access to our best products and benefits ⚫ Expanded banking and investment services ⚫ Relationship-based pricing across products ⚫ Exclusive lifestyle benefits First Republic provides capabilities to accelerate our existing affluent strategy First Republic model CCB affluent strategy High-touch servicing model with industry-leading NPS and high client and employee retention Team of experts to serve affluent client needs with a primary relationship quarterback Relationship-based lending to acquire and deepen affluent relationships Single family Multi-family CRE C&I Capital Call RMs Business Bankers Preferred Bankers Wealth Managers Preferred Banking Preferred Banking Offices Wealth Lending 66
  • 101.
    First Republic valueto Chase Deepening opportunity serving affluent client lending needs High quality loan portfolio strong LTVs, high FICO scores Relationship manager- led acquisition to drive firm value beyond lending First Republic has a unique operating model and strong loan portfolio First Republic Portfolio Risk Metrics1 Avg. CLTV 59% Avg. FICO 774 Avg. Debt-to- Income 30% % CA or NY 77% Avg. Balance Outstandings3 ~$1.1mm Loan Portfolio2 ~$100B 1 First Republic residential loan portfolio; funded loans only; CLTV and DTI reported as of time of origination 2 Prior to fair value marks 3 Average mortgage balance outstanding reflects unpaid principal balance 67
  • 102.
    We provide adviceacross the wealth continuum and continue to grow our channels Global Private Bank Advice-driven platform across wealth, lending, and banking Target client: HNW / UHNW Private Client Advisors 4,500+ Client investment assets ~$410B Advisors 450+ Client investment assets ~$190B Personal Advisors Lower-cost remote advice Target client: Mass Affluent Full-Service Wealth Management Chase Wealth Management J.P. Morgan Advisors CCB AWM Target client: Affluent Target client: Affluent / HNW1 / UHNW2 Added 300+ Advisors in 2022 and on-track to scale to 6k by 2025 ✓ Launched Personal Advisors to offer lower cost advice (4Q22) ✓ Rolled out Wealth Plan to Chase clients and advisors (4Q22) ✓ Wealth Management Advised Channels Added ~400 Client Advisors and on-track to scale to 4k by 2025 ✓ We have invested to strengthen and scale our advised channels 1 High net-worth 2 Ultra high net-worth 68
  • 103.
    First Republic PrivateWealth Management adds scale to our office-based model Global Private Bank Advice-driven platform across wealth, lending, and banking Target client: HNW / UHNW Private Client Advisors 4,500+ Client investment assets ~$410B Advisors 450+ Client investment assets ~$190B Personal Advisors Lower-cost remote advice Target client: Mass Affluent Full-Service Wealth Management Chase Wealth Management J.P. Morgan Advisors CCB AWM Target client: Affluent Wealth Management Advised Channels First Republic Private Wealth Management Private Wealth Advisors ~200 Client investment assets ~$200B Target client: Affluent / HNW1 / UHNW2 1 High net-worth 2 Ultra high net-worth 69
  • 104.
    First Republic brancheswill support our affluent branch segmentation strategy Formats Emerging segments Affluent segments Community Center (in market) Private Client Center (under development) First Republic Preferred Banking Offices Premium locations including SF, NYC, Boston covering 50% of JPM WM balances Roles Community Centers to build trust locally and promote financial health in underserved communities Private Client Centers to build wealth brand and provide exclusive spaces to engage with an integrated team of experts Preferred Bankers manage relationships and provide service Adapt proven integrated model with dedicated Community Manager, Small Business Consultant, and Community Home Lending Advisor roles Deploy a senior team of experts with Private Client Bankers & Advisors, Business Relationship Managers, and Home Lending Advisors Engagement High-touch servicing model with industry- leading experience Tailored local objectives and engagement methods to meet the distinct needs of underserved communities Serve clients across banking, lending and wealth and curate financial planning and wealth-focused experiences Chase Branch Segmentation Strategy 70
  • 105.
  • 106.
    Notes on non-GAAPfinancial measures 1. Adjusted expense excludes CCB legal expense and is a non-GAAP financial measure. For 2021, reported noninterest expense was $29,028 million and legal losses were $55 million; for 2022, reported noninterest expense was $31,208 million and legal losses were $47 million. Management believes this information helps investors understand the effect of certain items on reported results and provides an alternate presentation of the Firm’s performance 2. Income before income tax expense (pretax income) excluding the change in loan loss reserves (“pretax income ex. LLR”) and return on equity excluding the change in loan loss reserves (“ROE ex. LLR”) are non-GAAP financial measures. These metrics reflect the exclusion of the portion of the provision for credit losses attributable to the change in allowance for credit losses. ROE ex. LLR is calculated as net income excluding LLR divided by average common stockholders’ equity. For CCB average common stockholders’ equity for the full years 2022, 2021 and 2020, refer to page 65 of JPMorgan Chase’s Annual Report on Form 10-K for the year ended December 31, 2022. For all other periods presented, refer to the CCB Business Segment Results in JPMorgan Chase’s Annual Report on Form 10-K for each respective year. The table below provides a reconciliation of reported results to these non-GAAP financial measures Year ended December 31, (in millions, except ROE) 2012 2013 2014 2015 2016 2017 2018 2019 2020 2021 2022 (1) Pretax income Reported pretax income 17,236 17,808 14,689 15,472 15,053 14,637 19,399 21,950 11,034 27,840 19,793 Adjustments: Change in loan loss reserves (5,506) (5,490) (1,253) (1,023) 150 320 42 (299) 7,809 (9,750) 1,125 Pretax income ex. LLR 11,730 12,318 13,437 14,449 15,203 14,957 19,441 21,651 18,843 18,090 20,918 (2) Net income Reported net income 10,522 10,715 8,840 9,546 9,418 9,254 14,744 16,575 8,268 20,957 14,916 Adjustments: Change in loan loss reserves (3,337) (3,300) (742) (632) 93 207 32 (226) 5,843 (7,356) 879 Net income ex. LLR 7,185 7,415 8,098 8,914 9,511 9,462 14,776 16,350 14,111 13,601 15,795 (3) ROE Reported ROE 24% 23% 17% 18% 17% 17% 28% 31% 15% 41% 29% ROE ex. LLR 16% 15% 15% 17% 18% 18% 28% 31% 26% 26% 31% 72
  • 107.
    Notes on slide3 1. See slide 72 2. Federal Deposit Insurance Corporation (“FDIC”) 2022 Summary of Deposits survey per S&P Global Market Intelligence. Applies a $1B deposit cap to Chase and industry branches. Includes all commercial banks, savings banks, and savings institutions as defined by the FDIC. Prior periods have been revised to conform to the current period presentation 3. Based on 2022 sales volume and loans outstanding public disclosures by peers (C, BAC, COF, AXP, DFS) and JPMorgan Chase estimates. Sales volume excludes private label and Commercial Card. Loans outstanding exclude private label, AXP Charge Card, and Citi Retail Cards 73
  • 108.
    Notes on slide4 1. Businesses and legal entities with decision making rights 2. Federal Deposit Insurance Corporation (“FDIC”) 2022 Summary of Deposits survey per S&P Global Market Intelligence. Applies a $1B deposit cap to Chase and industry branches. Includes all commercial banks, savings banks, and savings institutions as defined by the FDIC. Prior periods have been revised to conform to the current period presentation 3. Barlow Research Associates, Primary Bank Market Share Database as of 4Q22. Rolling 8-quarter average of small businesses with revenue of more than $100,000 and less than $25 million 4. Based on 2022 sales volume and loans outstanding public disclosures by peers (C, BAC, COF, AXP, DFS) and JPMorgan Chase estimates. Sales volume excludes private label and Commercial Card. Loans outstanding exclude private label, AXP Charge Card, and Citi Retail Cards 5. Refers to customers with two or more relationships within the following sub-LOBs: Consumer Banking, Business Banking, Wealth Management, Credit Card, Home Lending, and Auto 74
  • 109.
    Notes on slide5 1. #1 in active users among digital banking mobile apps based on Data.ai and #1 most-visited banking portal in the U.S. (Chase.com) based on Similarweb 2. 2022 Chase branch network coverage by state. Federal Deposit Insurance Corporation (“FDIC”) 2022 Summary of Deposits survey per S&P Global Market Intelligence. Includes all commercial banks, savings banks and savings institutions as defined by the FDIC. Prior periods have been revised to conform to the current period presentation. Numbers do not foot to Form 10-K as FDIC represents branch counts as of June 30th, 2022 3. As of 4Q22. Users of all web and/or mobile platforms who have logged in within the past 90 days 4. Total logins on mobile and web platforms in FY 2022 5. In 2022, we achieved record high satisfaction in our branch and digital channels, determined by overall satisfaction and measured on a scale of 1 to 10. The score is calculated as the share of “9” and “10” responses as a percent of total responses. Digital channel includes a weighted average of monthly active users of Chase.com and the Chase Mobile app 75
  • 110.
    Notes on slide6 1. J.P. Morgan Wealth Management referenced in Form 10-K 2. Unique families with primary and joint account owners for open and funded accounts 3. Represents first-time investors with full-service relationships through Chase Wealth Management 4. Includes Chase Travel volumes, cxLoyalty non-Chase clients, and Frosch 5. Refers to customers associated with Business Banking line of business as referenced in Form 10-K 76
  • 111.
    Notes on slide7 1. Masterbrand Brand Health survey data from 1Q23. N = 3,681 completed surveys from random U.S. consumer sample (age 18+, financial decision makers for the household, lower 48 states), fielded between 1/6/2023 and 3/30/2023. Consideration measured through % of respondents selecting “Probably would consider”, “Definitely would consider” for question: “Please think about financial service companies in general. The next time you are in the market for a financial product or service, how likely are you to consider the following providers?” 2. Consumer Banking: Federal Deposit Insurance Corporation (“FDIC”) 2022 Summary of Deposits survey per S&P Global Market Intelligence. Applies a $1B deposit cap to Chase and industry branches. Includes all commercial banks, savings banks, and savings institutions as defined by the FDIC. Prior periods have been revised to conform to the current period presentation. Business Banking: Barlow Research Associates, Primary Bank Market Share Database as of 4Q22. Rolling 8-quarter average of small businesses with revenue of more than $100,000 and less than $25 million. Card: Based on 2022 sales volume and loans outstanding public disclosures by peers (C, BAC, COF, AXP, DFS) and JPMorgan Chase estimates. Sales volume excludes private label and Commercial Card. Loans outstanding exclude private label, AXP Charge Card, and Citi Retail Cards 3. Wealth: #1 outflow destination for Chase customers. Merchant: #1 payment provider for BB clients. Based on settlement $ volume (inflows into BB accounts from merchant servicing providers), not by client count. Data is most recent available, from Feb 1 – Apr 20. Mortgage: Chase clients are defined as having a deposit relationship or mortgage; based on Chase internal data and CoreLogic data 4. Retail mortgage originations in Home Lending 5. Excludes Commercial Term Lending clients 77
  • 112.
    Notes on slide8 1. See slide 72 2. In the first quarter of 2023, the allocations of revenue and expense to CCB associated with a Merchant Services revenue sharing agreement were discontinued and are now retained in Payments in CIB. Prior-period amounts have been revised to conform with the current presentation 3. Banking & Wealth Management 78
  • 113.
    Notes on slide11 1. Totals may not sum due to rounding. End of period balances for 1Q22 and 1Q23 2. 1Q22 to 1Q23 customer growth represents balances from new Banking and Wealth Management customers 3. Migration of flows out of checking and savings accounts 4. Net flows for external brokerages, online banks, JPMWM investments. Gross flows for internal migration 5. For Consumer Banking customers who outflow regularly. A customer is considered primary bank if it meets one of the following conditions: ≥15 withdrawals from a checking account or ≥5 withdrawals from a checking account and ≥$500 of inflows in a given month 6. Migration of flows into checking and savings accounts 7. % of internal yield seeking inflows (incl. JPMWM flows and internal migration) of total yield seeking outflows (incl. JPMWM flows, internal migration, external brokerages, online banks) 79
  • 114.
    Notes on slide12 1. Totals may not sum due to rounding 2. In the first quarter of 2023, the allocations of revenue and expense to CCB associated with a Merchant Services revenue sharing agreement were discontinued and are now retained in Payments in CIB. Prior-period amounts have been revised to conform with the current presentation 3. Adjusted to exclude legal expense. See slide 72 80
  • 115.
    Notes on slide13 1. Adjusted expense excludes CCB investments and legal expense and is a non-GAAP financial measure. For 2021, reported noninterest expense was $29.0 billion, CCB investments were $5.2 billion and legal losses were $55 million; for 2022, reported noninterest expense was $31.2 billion, CCB investments were $7.1 billion and legal losses were $47 million, respectively. Management believes this information helps investors understand the effect of certain items on reported results and provides an alternate presentation of the Firm’s performance 2. In the first quarter of 2023, the allocations of revenue and expense to CCB associated with a Merchant Services revenue sharing agreement were discontinued and are now retained in Payments in CIB. Prior-period amounts have been revised to conform with the current presentation 3. Includes total calls to Consumer Banking, Business Banking, Auto and Card client servicing divided by all Chase consumers and small businesses 4. Includes total check, debit, digital and credit payment / money movement volumes 5. Net operating losses divided by total transaction volume 6. Includes Consumer Banking customers and Business Banking small businesses per branch. Numerator and denominator exclude new builds and market expansion captured as investments and zero-balance accounts. Reflects 2019-2022 only 7. Tenured Chase Wealth Management & J.P. Morgan Advisors 8. Average annualized deposit sales for branches >5 years old; reflects 2019-2022 only 81
  • 116.
    Notes on slide14 1. Totals may not sum due to rounding 2. Includes Connected Commerce acquisitions of cxLoyalty, FROSCH, The Infatuation, and Figg 3. Gross cash marketing spend represents total outlays in a calendar year, which includes expenses and contra revenues. Contra-revenue may be amortized and not all recognized in the year the outlay was made 4. Refers to tech product development investment spend, excludes regulatory and controls spend 82
  • 117.
    Notes on slide16 1. Tracks cohort of primary bank customers from March 2020 – March 2023. At time of start in March 2020, cohort includes all primary bank customers, with at least one year of consumer checking tenure, and greater than $6k of take-home income (payroll, government assistance, unemployment benefits, tax refunds, social security, and retirement) within last twelve months 2. Represents customers within the cohort who had greater than $6k but less than $30k of take-home income within last twelve months of March 2020 3. Average Daily Balance divided by the total outflow in the month, multiplied by 30 to express in number of days. Includes all the checking and savings (ex. CDs) Chase accounts that are owned or jointly owned by the customer. Customers without outflow in the month are excluded 4. Source: Bureau of Labor Statistics (CPIU) 5. Tracks income growth for cohort defined in Note 1 above from January 2020 – March 2023, requiring greater than $6k of take-home income (payroll, government assistance, unemployment benefits, tax refunds, social security, and retirement) within last twelve months of Jan 2020. Additionally, take home income must be greater than $0 within last twelve months throughout the measurement period 6. Represents customers within the cohort who had greater than $6k but less than $30k of take-home income within last twelve months of January 2020. Additionally, take home income must be greater than $0 within last twelve months throughout the measurement period 83
  • 118.
    Notes on slide17 1. Based on time frames used in data which differs from time frames Form 10-K 2. Tracks Credit Card customers with 18+ months on book as of January 2019 that are still spend active in March 2023. Lowest income defined as gross income (self reported) of <$50k 3. Refers to 4Q19 and 1Q23 period-end Card Services loans reported in quarterly earnings supplements 4. Tracks Credit Card accounts that are open in January 2020 and still open in April 2023 5. Percentage change in the number of accounts within the stable cohort holding a revolving balance between January 2020 and April 2023 84
  • 119.
    Notes on slide19 1. Represents refreshed FICO scores 2. Customers who revolve but are not spend active 3. Chase Auto excludes Wholesale (DCS) & Lease 4. Calculated using refreshed Vantage score sourced from Experian 5. Represents FICO scores and LTV at time of origination 6. Includes AWM and Corporate mortgage loans 7. Sourced from Experian 8. Sourced from Lender Share. Data is obtained from market shares relative to lenders participating in Curinos’ retail and correspondent channel origination analytics. Curinos is not liable for reliance on the data 85
  • 120.
    Notes on slide22 1. As of December 31, 2022 2. CLTV defined as Combined Loan to Value 3. 2010 30+ delinquency rate revised from 10-K to include the impact of Purchased Credit Impaired (PCI) loans to conform to current disclosures 4. HPI defined as Home Price Index 5. All data in HPI forecast chart with exclusion of % originations data sourced from Moody’s Case-Shiller as of April 2023 6. % Held For Investment (HFI) 2022 is Internal Chase Data 86
  • 121.
    Notes on slide24 1. In 2020 Merchant Services along with the associated assets, liabilities, revenue, expenses and headcount were realigned to CIB from CCB and CB. Prior-period amounts have been revised to conform with the current presentation 2. Certain wealth management clients were realigned from Asset & Wealth Management to Consumer & Community Banking in the fourth quarter of 2020; amounts in periods prior to 2016, other than client balances, were not revised in connection with the realignment 3. In the first quarter of 2023, the allocations of revenue and expense to CCB associated with a Merchant Services revenue sharing agreement were discontinued and are now retained in Payments in CIB. Prior-period amounts have been revised to conform with the current presentation 4. See slide 72 5. CCB ROE (ex. LLR) pre 2018 impacted by higher corporate tax rate 6. Board of Governors of the Federal Reserve System, Federal Funds Effective Rate, retrieved from FRED, Federal Reserve Bank of St. Louis 7. Reflects sum of average deposits, average loans, and end of period client investment assets, including the revision referenced in note 2 on this page 8. Federal Deposit Insurance Corporation (“FDIC”) 2022 Summary of Deposits survey per S&P Global Market Intelligence. Applies a $1B deposit cap to Chase and industry branches for market share. Includes all commercial banks, savings banks, and savings institutions as defined by the FDIC. Prior periods have been revised to conform to the current period presentation 9. Represents general purpose credit card spend, which excludes private label and Commercial Card. Based on company filings and JPMorgan Chase estimates 10.Barlow Research Associates, Primary Bank Market Share Database. Rolling 8-quarter average of small businesses with revenue of more than $100,000 and less than $25 million 87
  • 122.
    Notes on slide26 1. Federal Deposit Insurance Corporation (“FDIC”) 2022 Summary of Deposits survey per S&P Global Market Intelligence. Applies a $1B deposit cap to Chase and industry branches. Includes all commercial banks, savings banks, and savings institutions as defined by the FDIC. Prior periods have been revised to conform to the current period presentation 2. “Consumer Banking customer” reflects unique individuals that have financial ownership or decision making power with respect to Consumer Banking accounts 3. Refers to primary bank customers with two or more relationships within the following sub-LOBs: Consumer Banking, Business Banking, Wealth Management, Credit Card, Home Lending, and Auto Lending 4. Federal Deposit Insurance Corporation (“FDIC”) 2022 Summary of Deposits survey per S&P Global Market Intelligence. Top 50 markets were defined based on industry deposit balances after applying a $1B deposit cap to each branch. Includes all commercial banks, savings banks, and savings institutions as defined by the FDIC. Prior periods have been revised to conform to the current period presentation. Chase has branch presence in 47 of the top 50 markets; the three markets without branches are San Juan, Virginia Beach, and Urban Honolulu 5. Deposit and investment balances associated with accounts where the primary owner visited a branch >4 times in 2022 88
  • 123.
    Notes on slide28 1. Federal Deposit Insurance Corporation (“FDIC”) 2022 Summary of Deposits survey per S&P Global Market Intelligence. Applies a $1B deposit exclusion to Chase and industry branches. Includes all commercial banks, savings banks, and savings institutions as defined by the FDIC. Prior periods have been revised to conform to the current period presentation 2. Federal Deposit Insurance Corporation (“FDIC”) 2022 Summary of Deposits survey per S&P Global Market Intelligence. Applies a $1B deposit cap to Chase and industry branches. Includes all commercial banks, savings banks, and savings institutions as defined by the FDIC. Prior periods have been revised to conform to the current period presentation. Large banks consist of institutions with >$100B in retail deposits 3. Federal Deposit Insurance Corporation (“FDIC”) 2022 Summary of Deposits survey per S&P Global Market Intelligence. Applies a $1B deposit cap to Chase and industry branches. Includes all commercial banks, savings banks, and savings institutions as defined by the FDIC. Prior periods have been revised to conform to the current period presentation 4. In 2022 and 1Q23, Chase ranked #1 in retail deposit share based on industry methodologies using Federal Deposit Insurance Corporation (“FDIC”) 2022 Summary of Deposits survey and EOP deposits for BWM-equivalent businesses. For example, estimating retail deposits performance by applying a $1B cap on FDIC deposits – $1,094B (Chase), $1,027B (Peer 1), $979B (Peer 2); uncapped methodology – $2,129B (Chase), $1,964B (Peer 1), $1,458B (Peer 2); EOP earnings (national retail deposits in Banking and Wealth Management) disclosures – 2Q22 earnings: $1,179B (Chase), $1,077B (Peer 1), $892B (Peer 2); 1Q23 earnings: $1,147B (Chase), $1,045B (Peer 1), $851B (Peer 2) 89
  • 124.
    Notes on slide29 1. A customer is considered primary bank if it meets one of the following conditions: ≥15 withdrawals from a checking account or ≥5 withdrawals from a checking account and ≥$500 of inflows in a given month 2. Source: One Chase Net Promoter Score (NPS) Survey. Reflects promoters, calculated as share of “9” and “10” responses as a % of total responses 3. Refers to customer satisfaction across all Consumer Banking accountholders 4. Reflects FY 2022 retention for checking customers with a tenure of ≥ 6 months 5. Refers to primary bank customers with two or more relationships within the following sub-LOBs: Consumer Banking, Business Banking, Wealth Management, Credit Card, Home Lending, and Auto Lending 6. Deposit and investment balances associated with accounts where the primary owner visited a branch >4 times in 2022 7. Percent of Consumer Banking users of all mobile platforms who have logged in within the past 90 days, as of 4Q22 90
  • 125.
    Notes on slide30 1. Inclusive of payments made from all Consumer Banking accounts; payments defined as debits, excluding internal transfers 2. Reflects number of Consumer and Business Banking accounts with a Zelle inflow or outflow in FY 2022 3. Average number of monthly debit transactions during 4Q22 of Consumer Banking checking customers that completed at least one debit card payment during this 90- day period 4. Percent of Consumer Banking users of all mobile platforms who have logged in within the past 90 days, as of 4Q19 and 4Q22 5. Percent of mobile-active Consumer Banking users who engaged with a financial health tool in 4Q22 6. Total Consumer Banking user logins on mobile and web platforms in FY 2022 91
  • 126.
    Notes on slide32 1. Includes Chase First Banking, Chase High School Checking, Chase College Checking, and Chase Secure Banking 2. Includes Chase Total Checking, Chase Premier Checking, and Chase Sapphire Banking 3. Based on Chase Private Client households 4. Account distribution is based on YE 2022 92
  • 127.
    Notes on slide34 1. Federal Deposit Insurance Corporation (“FDIC”) 2022 Summary of Deposits survey per S&P Global Market Intelligence. Includes all commercial banks, savings banks and savings institutions as defined by the FDIC. Prior periods have been revised to conform to the current period presentation. Numbers do not foot to Form 10-K as FDIC represents branch counts as of June 30th, 2022 2. Federal Deposit Insurance Corporation (“FDIC”) 2022 Summary of Deposits survey per S&P Global Market Intelligence. Applies a $1B deposit cap to Chase and industry branches. Includes all commercial banks, savings banks, and savings institutions as defined by the FDIC. Prior periods have been revised to conform to the current period presentation. Large banks consist of institutions with >$100B in retail deposits 3. Represents large banks’ deposit per branch in 2022 4. Calculated using 2022 FDIC data. Federal Deposit Insurance Corporation (“FDIC”) 2022 Summary of Deposits survey per S&P Global Market Intelligence. Includes all commercial banks, savings banks and savings institutions as defined by the FDIC. Prior periods have been revised to conform to the current period presentation 5. Calculated using 2017 FDIC data. Federal Deposit Insurance Corporation (“FDIC”) 2022 Summary of Deposits survey per S&P Global Market Intelligence. Includes all commercial banks, savings banks and savings institutions as defined by the FDIC. Prior periods have been revised to conform to the current period presentation 6. Federal Deposit Insurance Corporation (“FDIC”) 2022 Summary of Deposits survey per S&P Global Market Intelligence. Applies a $1B deposit cap to Chase and industry branches. Includes all commercial banks, savings banks, and savings institutions as defined by the FDIC. Prior periods have been revised to conform to the current period presentation 7. Includes Consumer Banking customers and Business Banking small businesses per branch. Numerator and denominator exclude new builds and market expansion captured as investments and zero-balance accounts. Reflects 2019-2022 only 93
  • 128.
    Notes on slide35 1. Federal Deposit Insurance Corporation (“FDIC”) 2022 Summary of Deposits survey per S&P Global Market Intelligence. Includes all commercial banks, savings banks and savings institutions as defined by the FDIC. Prior periods have been revised to conform to the current period presentation 2. Federal Deposit Insurance Corporation (“FDIC”) 2022 Summary of Deposits survey per S&P Global Market Intelligence. Applies a $1B deposit cap to Chase and industry branches. Includes all commercial banks, savings banks, and savings institutions as defined by the FDIC. Prior periods have been revised to conform to the current period presentation. Large banks consist of institutions with >$100B in retail deposits 3. Federal Deposit Insurance Corporation (“FDIC”) 2022 Summary of Deposits survey per S&P Global Market Intelligence. Applies a $1B deposit cap to Chase and industry branches. Includes all commercial banks, savings banks, and savings institutions as defined by the FDIC. Prior periods have been revised to conform to the current period presentation 4. Break-even defined as the first month of two consecutive months of a branch generating positive pre-tax profit 5. Federal Deposit Insurance Corporation (“FDIC”) 2022 Summary of Deposits survey per S&P Global Market Intelligence. Applies a $1B deposit cap to Chase and industry branches. Includes all commercial banks, savings banks, and savings institutions as defined by the FDIC. Prior periods have been revised to conform to the current period presentation. Represents the sum of the delta between deposits per branch for mature branches (10+ years, $259mm) and non-mature branches (0-5 years, $79mm; 5-10 years, $154mm) multiplied by the number of branches within that age cohort (0-5 years = 711; 5-10 years = 294) 6. Federal Deposit Insurance Corporation (“FDIC”) 2022 Summary of Deposits survey per S&P Global Market Intelligence. Top 50 markets were defined based on industry deposit balances after applying a $1B deposit cap to each branch. Includes all commercial banks, savings banks, and savings institutions as defined by the FDIC. Prior periods have been revised to conform to the current period presentation 94
  • 129.
    Notes on slide36 1. Federal Deposit Insurance Corporation (“FDIC”) 2022 Summary of Deposits survey per S&P Global Market Intelligence. Applies a $1B deposit cap to Chase and industry branches. Includes all commercial banks, savings banks, and savings institutions as defined by the FDIC. Prior periods have been revised to conform to the current period presentation 2. Federal Deposit Insurance Corporation (“FDIC”) 2022 Summary of Deposits survey per S&P Global Market Intelligence. Includes all commercial banks, savings banks and savings institutions as defined by the FDIC. Prior periods have been revised to conform to the current period presentation 3. Excludes trust office 4. Reflects internal new build counts for licensed branch locations opened between calendar year 2012 through calendar year 2022 within the respective CBSAs. Does not include relocations 95
  • 130.
    Notes on slide37 1. Teller transactions 2. Reflects deposit and investment balances, with engagement channel segments defined based on the level of interaction with branch and digital channels for primary owners of Consumer Banking accounts. Branch-centric are accountholders who have >4 branch visits per year. Digitally-centric is 12+ digital transactions, 100+ logins, 24+ ACH payments. If both criteria are applicable, then accountholders are multi-channel 3. Tenured bankers. NPV normalized for margins across years 96
  • 131.
    Notes on slide39 1. Federal Deposit Insurance Corporation (“FDIC”) 2022 Summary of Deposits survey per S&P Global Market Intelligence. Includes all commercial banks, savings banks and savings institutions as defined by the FDIC. Prior periods have been revised to conform to the current period presentation. Numbers do not foot to Form 10-K as FDIC represents branch counts as of June 30th, 2022 2. Grey represents states with zero branch share 3. Coverage defined as one or more branches in a CBSA using U.S. Census Population Data. Based on 2017 estimates for 2017 metrics and 2022 estimates for all other time periods 4. Drive times and population are derived from ESRI Business Analyst using 2017, 2021, and forward-looking population metrics; drive times are derived from 2021 street network vintage for 2017, 2022, and forward-looking time periods. Branch network is as of YE 2017 and YE 2022 5. Small business coverage by CBSA based on Dun and Bradstreet Small Business locations. Small business defined as <$20mm in annual revenue 6. Federal Deposit Insurance Corporation (“FDIC”) 2022 Summary of Deposits survey per S&P Global Market Intelligence. Applies a $1B deposit cap to Chase and industry branches. Includes all commercial banks, savings banks, and savings institutions as defined by the FDIC. Prior periods have been revised to conform to the current period presentation. Addressable deposits represent the sum of all industry deposits in a given CBSA where Chase has at least one branch 97
  • 132.
    Notes on slide49 1. Source: U.S. Census – Business and Industry Time Series, Monthly Business Formation Statistics; not seasonally adjusted; average of FY2022 and 1Q2023 2. Primary bank market share sourced from Barlow Research Associates as of 4Q22. Rolling 8-quarter average of small businesses with sales size between $100k- $25mm 3. Total meetings in FY2022 between Business Banking clients and either remote or in-person Business Relationship Managers 4. Small business coverage by CBSA based on Dun and Bradstreet Small Business locations. Small business defined as <$20mm in annual sales size 98
  • 133.
    Notes on slide51 1. Based on 2022 sales volume and loans outstanding public disclosures by peers (C, BAC, COF, AXP, DFS) and JPMorgan Chase estimates. Sales volume excludes private label and Commercial Card. Loans outstanding exclude private label, AXP Charge Card, and Citi Retail Cards 2. Defined as average sales debit active accounts 3. Includes amortization of account origination costs 4. Risk-adjusted revenue, pretax income ex. LLR and ROE ex. LLR are all non-GAAP financial measures. Risk-adjusted revenue is revenue excluding net charge-offs of $2.4B, $2.7B and $4.8B for the years ended December 31, 2022, December 31, 2021 and December 31, 2019, respectively. Pretax income ex. LLR and ROE ex. LLR represents pretax income and ROE excluding credit loss reserves of $1.0B, $(7.6)B and $0.5B for the years ended December 31, 2022, December 31, 2021 and December 31, 2019, respectively. Management believes this information helps investors understand the effect of these items on reported results and provides an alternate presentation of the Firm’s performance. 99
  • 134.
    Notes on slide53 1. Based on 2022 co-brand portfolio sales volumes 2. Fee-based card demand applies to Branded consumer cards only; Millennials defined as 27-42 and Gen Z as 11-26 year-olds 3. Based on 2017-2022 sales volume and average loans outstanding public disclosures by peers (C, BAC, COF, AXP, DFS) and JPMorgan Chase estimates. Sales volume excludes private label and Commercial Card. Loans outstanding exclude private label, AXP Charge Card, and Citi Retail 100
  • 135.
    Notes on slide54 1. Based on Chase and Census data 2. According to Bright Query, April 2023 3. Based on Personal Demographics Detail dataset, published by Axiom, December 2022 101
  • 136.
    Notes on slide55 1. Gross cash marketing spend represents total outlays in a calendar year, which includes expenses and contra revenues. Contra-revenue may be amortized and not all recognized in the year the outlay was made 2. Reflects expected performance of 2022 vintage in Year 5 3. Defined as Net Present Value (NPV) of the vintage; NPV defined as the post-tax lifetime value of all incremental cash flows for the investment, including upfront investment costs and all other variable revenues and costs resulting, discounted at the cost of equity 102
  • 137.
    Notes on slide57 1. Total payments transaction volume includes debit and credit card sales volume and gross outflows of ACH, ATM, teller, wires, BillPay, PayChase, Zelle, person-to- person and checks 2. Users of all web and/or mobile platforms who have logged in within the past 90 days 3. #1 most-visited banking website in the U.S. (Chase.com) based on Similarweb 103
  • 138.
    Notes on slide58 1. Based on Travel Weekly Power List 2022, which disclosed 2021 sales volumes; Chase Travel and cxLoyalty 2021 sales volumes were not publicly disclosed on the Power List; corporate/managed travel providers excluded for purposes of JPMC estimates 2. Represents Chase Ultimate Rewards booking volume 3. Includes Chase Travel volumes, cxLoyalty partner clients, and FROSCH; 2019 includes only Chase Ultimate Rewards 104
  • 139.
    Notes on slide59 1. Reflects 2022 actuals, unless otherwise noted 2. Shopping reflects credit and debit spend; Travel and Dining reflect credit spend only 3. Includes Chase Travel volumes, cxLoyalty partner clients, and FROSCH 4. Number of unique offers viewed by a customer for the first time during a campaign 5. Attribution spend is defined as spend on our cards at Chase Offers merchants once the offer is served and during the offer window (the average offer window is 45 days) 6. Reflects the number of individual geographic business locations featured on The Infatuation website and app (as of April 30, 2023) 7. Reflects the average number of user device identifications to visit The Infatuation website and app within a month (April 2023 LTM) 105
  • 140.
    Notes on slide60 1. Total payments transaction volume includes debit and credit card sales volume and gross outflows of ACH, ATM, teller, wires, BillPay, PayChase, Zelle, person-to- person and checks 2. Payments active defined as customers who completed >1 payments outflow across any method of payment in 2022 3. Paze screen reflects a contemplated design; subject to change 4. Defined as consumer deposit customers and credit card-only customers who performed >30 payment transactions in a month across all digital, non-digital, and card- based methods of payments on average in 2022; excludes business banking customers 106
  • 141.
    Notes on slide61 1. The Points Guy Awards, 2022 2. Money.com, March 2023 3. CNET, May 2023 4. Business Insider, May 2023 5. Forbes Advisor, May 2023 6. CNBC Select, May 2023 7. CNN Underscored, May 2023 8. For Net Promoter Score promoters compared to detractors 107
  • 143.
    CIB maintained its#1 rank, and our strategy continues to strengthen our business $48.1B Revenue 10.0% Market share #1 Rank CIB $4.5B Revenue 10.5% Market share #3 Rank Securities Services $7.6B CIB Revenue $13.9B J.P. Morgan Payments Revenue 8.4% Market share #1 Rank $29.0B Revenue 11.6% Market share #1 Rank $6.9B IB Fees 7.9% Market share #1 Rank Markets Payments Investment Banking Complete Diversified At Scale Global (based on J.P. Morgan Treasury Services) 2022 CIB OVERVIEW1,2,3 Key strategic pillars 1 Note: J.P. Morgan Payments and Firmwide Payments revenue and expense throughout the CIB presentation predominantly includes CIB and CB unless otherwise noted 1 Financials are as reported. J.P. Morgan Payments revenue excludes the net impact of equity investments 2 Source: Coalition Greenwich Competitor Analytics (CIB, Markets, Payments and Securities Services market share and rank), reflecting JPMorgan Chase’s internal business structure and internal revenue, which may differ from externally disclosed revenue. Rank is based on the Coalition Index Banks. Payments reflects global J.P. Morgan Treasury Services business (CIB and CB). For additional information, see note 1 on slide 43 3 Source: Dealogic (Investment Banking market share and rank). For additional information, see note 2 on slide 43
  • 144.
    CIB performance remainedstrong amid increased capital requirements and industry wallet decline ANIMATION Adjusted net income ($B)2 Adjusted ROE (%)2 16% 14% 21% 25% 14% Note: Prior-period amounts have been revised to conform with the current presentation. For additional information, see notes 1 and 2 on slide 44 1 Source: Coalition Greenwich Competitor Analytics. Industry wallet and market share for CIB, reflecting JPMorgan Chase’s internal business structure and internal revenue. For additional information, see note 1 on slide 43 2 This presentation includes certain non-GAAP financial measures, which exclude the impact of legal expense. Refer to slide 45 for a reconciliation of reported results to these non-GAAP financial measures $70 $80 $80 $83 $103 Capital ($B) $11.0 $11.9 $12.3 $17.8 $21.3 $15.0 $35.7 $37.5 $39.4 $49.5 $51.9 $48.1 2017 2018 2019 2020 2021 2022 $381 $381 $375 $431 $456 $438 Industry wallet ($B)1 JPM market share (%)1 Revenue ($B) $70 15% 2 8.6% 9.0% 9.1% 10.3% 10.3% 10.0%
  • 145.
    We continue tomaintain a leadership position across products and regions 14 10 Peer 1 Peer 2 Peer 3 Peer 4 Peer 5 24 Number of products ranked top 3 (out of 25 products) ■ #1 ■ #2-3 For footnoted information, refer to slide 46 2 10 11 5 13 6 14 10 15 9 1 2017 2022 12 10 1 12 10 2 2017 2022 #1 in 1 additional product since 2017 Maintained top 3 position in 22 products #1 in 3 additional products since 2017 2017 2022 Americas #1 EMEA #1 APAC #3 Number of products ranked ■ #1 ■ #2-3 ■ #4+ 2022 GLOBAL LEADERSHIP POSITIONS COMPARED TO PEERS1,2 WE MAINTAINED OUR LEADERSHIP POSITION ACROSS REGIONS WITH IMPROVEMENT IN SEVERAL PRODUCTS1,2,3,4 3
  • 146.
    Market share gainsacross most businesses and all regions have helped widen the gap to peers 8.6% 10.0% 2017 JPM Peer 1 Peer 2 Peer 3 Peer 4 MARKET SHARE BY BUSINESS1 2022 MARKET SHARE BY REGION2 MARKET SHARE VS. PEERS3 380 bps ■ 2017 ■ 2022 Investment Banking -30bps 8.2% 7.9% Markets Payments (J.P. Morgan Treasury Services) Securities Services +100bps 11.6% 10.6% +280bps 8.4% 5.6% +80bps 10.5% 9.7% 10.5% 12.1% 2017 2022 NOT TO SCALE 8.7% 9.4% 4.7% 6.7% Americas +160bps EMEA +70bps APAC +200bps 5.2% Avg 6.2% Avg 340 bps NOT TO SCALE 4 For footnoted information, refer to slide 46
  • 147.
    2023 total investmentspend $3.9B Technology investments $3.2B CIB technology $2.1B Enterprise technology $1.1B Digital, Data, and AI/ML $0.3B Revenue producers $0.2B Acquisitions $0.1B Note: Prior-period amounts have been revised to conform with the current presentation. For additional information, see note 1 on slide 44; totals may not sum due to rounding 1 This presentation includes certain non-GAAP financial measures, which exclude the impact of legal expense. Refer to slide 45 for a reconciliation of reported results to these non-GAAP financial measures We are being disciplined with expenses, with growth driven mainly by wage inflation and investments $22.3 $23.6 ~$24 $3.0 $3.6 $3.9 $0.0 $(0.2) $1.5 $0.6 $0.4 $0.2 Investments $25.3 $27.2 ~$28 ADJUSTED EXPENSE1 ($B) Market dependent ⚫ Volume- & revenue-related ⚫ Performance-driven compensation ⚫ Volume-related operations, brokerage, and marketing ⚫ Structural ⚫ Compensation, including wage inflation ⚫ Regulatory ⚫ T&E normalization 2021 Volume- & revenue- related Structural Investments 2022 Volume- & revenue- related Structural Investments 2023 market dependent 5
  • 148.
    Clients served by3-4 CIB businesses The strength and completeness of our CIB businesses create a differentiated ability to serve our clients Client-centric relationship view We deploy capital to support our clients’ growth, which is measured primarily at the relationship level Complete & harmonized product offering Partnering with our clients in one product helps us holistically serve them in their adjacent product needs ~75% ~80% Clients served by 1-2 businesses Clients served by 3-4 businesses ~2.3x Clients served by 1-2 businesses Clients served by 3-4 businesses ~1.6x Average revenue (FI & PS clients) Average revenue (Corporate clients) Clients served by 3-4 CIB businesses Financial Institutions (FI) & Public Sector (PS) Top 500 clients Corporates Top 500 clients $2B+ revenue opportunity from further increasing multi-product penetration in these segments Continuous client engagement across products Product diversity enables continuous client engagement on flow business, which helps win episodic business PRINCIPLES OF HOW WE OPERATE CROSS-BUSINESS IMPACT AND OPPORTUNITIES1,2,3 1 Top 500 CIB clients based on average annual JPM revenue generated during the last 24 months, as of February 2023 2 Number of CIB businesses (Investment Banking, Markets, Payments and Securities Services) that generated at least $1,000 in client revenue over the last 24 months, as of February 2023 3 Average annual JPM revenue generated per client for top 500 clients during the last 24 months, as of February 2023 6
  • 149.
    We remain theleading global Markets franchise, with sustained growth and continued client excellence LEADING MARKETS RANKS GLOBALLY1 11.6% Market share2  100bps vs FY17 $29.0B Revenue  57% vs FY17 SUSTAINED FINANCIAL GROWTH Continued client excellence OMNICHANNEL CONNECTIVITY5 GLOBAL EXPERTISE4 Revenue CAGR (2017-2022) Voice 7% Electronic 12% Americas APAC EMEA Leading market share across regions #1 #1 #1 (tied) DEEP CLIENT RELATIONSHIPS6 J.P. Morgan offers the best service quality across Equities and FICC to institutional clients Markets Across all FICC products, J.P. Morgan has the highest number of buy-side clients expecting to increase business #1 FICC #1 Equities #1 Research MULTI-ASSET COUNTERPARTY3 Products: Cash Equities, Equity Derivatives, FX, Commodities, Credit, Rates, Structured Products, etc. Client distribution by # of products traded Coalition Greenwich Voice of Client Survey Highlights For footnoted information, refer to slide 47 35% 22% 43% ≥ 6 products 4-5 products ≤ 3 products 7
  • 150.
    We have gainedshare across Equities and FICC since 2017 – with further room to grow 1 Revenue is as reported 2 Source: Coalition Greenwich Competitor Analytics (market share and rank). For additional information, see note 1 on slide 43 Markets #1 rank #1 rank (tied) #1 rank FICC revenue ($B) Equities revenue ($B) FICC MARKET SHARE AND RANK2 EQUITIES MARKET SHARE AND RANK2 #1 rank $12.8 $12.7 $14.4 $20.9 $16.9 $18.6 $5.7 $6.9 $6.5 $8.6 $10.5 $10.4 2017 2018 2019 2020 2021 2022 $18.5 $19.6 $20.9 $29.5 $27.4 $29.0 MARKETS REVENUE, MARKET SHARE, AND RANK1,2 2017 2018 2019 2020 2021 2022 10.1% 11.3% 11.0% 12.1% 11.7% 12.9% 2017 2018 2019 2020 2021 2022 10.9% 11.4% 11.6% 12.8% 12.4% 11.0% Markets market share 10.6% 11.4% 11.4% 12.6% 12.1% 11.6% 8
  • 151.
    Our Markets franchiseis well-positioned to outperform on a relative basis Markets 163 212 2017-19 Avg. 2020-22 Avg. 2023F (~4%) 11.1% 12.1% 29.3% 32.0% 2017-2019 Avg. 2020-2022 Avg. Peers 2-5 JPM 40.4% 44.1% ~370bps Marginal ROE Fully-loaded ROE Cost of capital NOT TO SCALE 1 Source: Coalition Greenwich Competitor Analytics. Peer ranks are for the respective year. For additional information, see notes 1 and 3 on slide 43 2 Fully-loaded ROE includes allocation of all income (ex-legal) and capital items across the businesses, with legal held in management; Marginal ROE is a way of evaluating the marginal impact of a business if it were to be removed from the overall LOB, assuming that some of the allocated costs/ capital that are allocated to the LOB would not be reduced, but be redirected to other LOBs INDUSTRY WALLET PER COALITION1 ($B) MARKET SHARE FOR TOP 5 PLAYERS1 (%) 2023F ROE2 (%) Industry wallet is expected to soften, but remain elevated vs. pre-pandemic levels We continue to benefit from wallet consolidation among the largest Markets players Marginal returns are expected to deliver above the cost of capital 9
  • 152.
    We remain focusedon being a complete counterparty with differentiated offerings STRATEGIC DRIVERS CURRENT FOCUS AREAS Meeting client needs through a complete product set and a holistic coverage model Markets Client and business tools Advanced data and analytics Scalable infrastructure and systems KEY ENABLERS Deploying capital dynamically and with discipline Extending our reach beyond trade execution Integrating our digital interface Extending our e-Trading leadership position Promoting efficient market structures Building private credit capabilities Be a complete counterparty Be on the frontier of secular trends Be differentiated across the trade lifecycle Gaining share with our largest institutional clients as they grow 10
  • 153.
    Sovereign Funds Securities Servicesis a leading provider, delivering strong financial performance and consistent market share growth Delivering critical services and solutions at scale – with 100% of our top 200 clients common to Markets and Investment Banking Americas EMEA APAC ~40% ~40% ~20% 100 global markets Asset Managers Insurance 17 of top 20 are clients2 7 of top 10 are clients4 of top 10 are clients3 8 Liquidity provisioning to the rest of the firm Robust and consistent revenue Capital-light business Tailwinds from rising interest rates For footnoted information, refer to slide 47 Securities Services AUC6 Deposits6 Market share9 Revenue7  22% Growth vs. 2017  42%  80bps  17% (+23% fee revenue) Operating margin8 30%+ average 2022 $29T $4.5B $203B 28% 10.5% Daily NAVs 25k  64% BUSINESS STRENGTHS OUR BUSINESS PRESENCE BY THE NUMBERS SERVING THE TOP INSTITUTIONS1 WELL-DIVERSIFIED GLOBAL PRESENCE5 11
  • 154.
    ETFs ⚫ End-to-end automationacross ETF lifecycle: baskets, orders, and post-trade Alternatives ⚫ Complete offering across Alternatives portfolio (hedge, private equity, private credit, real assets) Middle Office ⚫ Differentiated solution that leverages the scale and capabilities of the broader CIB Data Solutions ⚫ Accurate, timely, and integrated data solutions to improve decision making and to generate alpha Our investments are delivering both scale and growth to benefit our clients and the franchise Global Custody ⚫ Settle ~$900B notional daily ⚫ Provide safekeeping, settlement, and servicing of listed assets in 100 markets globally Traditional Fund Services ⚫ Deliver 25k daily NAVs ⚫ Support clients in global fund domiciles across the full range of fund structures and instrument types Trading Services ⚫ Doubled lendable balances3 ⚫ Offer lending and collateral solutions that help clients optimize inventory and improve portfolio returns Our core businesses deliver scale and efficiency… …while investments in enhanced capabilities are delivering additional growth Cost per trade ▼ 26% Market share2 ▲ 40bps Cost per NAV ▼ 16% Market share2 ▲ 440bps Cost per trade ▼ 84% Market share2 ▲ 640bps AUA ▲ 34% AUA ▲ 107% AUC ▲ 353% Securities Services KEY METRICS1 KEY METRICS1 1 All metrics show change from 2017 to 2022 2 Source: Coalition Greenwich Competitor Analytics. Share reflects JPM share of Coalition Index Banks. Custody share based on Global Custody revenue. Traditional Fund Services share based on Fund Administration and Fund Services Other revenue. Trading Services share based on Agency Securities Lending, Depositary Receipts and Collateral Management revenue. For additional information, see notes 1 and 3 on slide 43 3 Trading services lendable balances doubled compared to peak 2022 lendable balances vs. average 2017 12
  • 155.
    We have beenranked #1 in Investment Banking (IB) fees for over a decade and have consistently achieved top positions across products and regions North America EMEA APAC Wallet: $40B Market share: 10.0% Wallet: $20B Market share: 7.6% Wallet: $16B Market share: 2.7% Synergies with the franchise (e.g., Commercial Banking, Private Bank) deepen client relationships ✓ Differentiated strengths that benefit clients and position us to grow (e.g., talent, unrivaled breadth in offering) ✓ Continued progress in strategic focus areas (Financial Sponsors, Private Capital, International, Carbon Transition) ✓ Excellence in execution (e.g., by investing in technology and analytics, while deploying capital with discipline) ✓ 8.2% 2017 8.6% 2018 8.9% 2019 9.1% 2020 9.3% 2021 7.9% 2022 $82 $81 $78 $92 $133 $78 Industry wallet ($B) JPM market share LATAM Wallet: $1B Market share: 10.3% #1 for more than a decade #1 since 2014 #3 among global peers since 2018 Top 2 since 2018 Source: Dealogic. Regional wallet size and market share metrics are for 2022. For additional information, see note 2 on slide 43 #1 rank since 2009 RANKED #1 BY INVESTMENT BANKING FEES FOR OVER A DECADE FOCUS AREAS FOR DEEP-DIVE DISCUSSION Investment Banking 13
  • 156.
    On track toachieve our $15B firmwide revenue target set last year ✓ World’s largest payments franchise1, occupying a unique place in the payments industry ✓ Continue to invest to deliver scalability, efficiency, and differentiated product offerings, but expect investment spend growth to plateau going forward ✓ Our business architecture builds on our core capabilities to fulfill evolving client needs and drive higher margins ✓ Note: Prior-period amounts have been revised to conform with the current presentation. For additional information, see notes 1 and 2 on slide 44 1 Source: Coalition Greenwich Competitor Analytics. Reflects global J.P. Morgan Treasury Services business (CIB and CB). Rank is based on the Coalition Index Banks. For additional information, see note 1 on slide 43 CIB revenue ($B) NII Fees Firmwide metrics 2017 2018 2019 2020 2021 2022 Revenue ($B) $9.2 $10.4 $10.2 $9.6 $9.9 $13.9 Avg. deposits ($B) 440 453 483 651 800 779 TS market share1 5.6% 6.1% 6.0% 6.9% 7.2% 8.4% TS rank1 #2 #1 Our Payments business has grown significantly as a result of both NII and fee growth Payments PERFORMANCE (EXCLUDING EQUITY INVESTMENTS) FOCUS AREAS FOR DEEP-DIVE DISCUSSION Including Equity Investments 2021: $6.5B 2022: $7.6B $5.4 $5.9 $5.9 $5.7 $6.0 $8.0 2017 2018 2019 2020 2021 2022 14
  • 158.
    47% 22% 31% Average: 2012-19 44% 29% 27% 2020 39% 27% 34% 2021 38% 15% 47% 2022 44% 17% 39% 1Q’23 DCM ECM M&A $77 $92 $133 $78 $16 After a record2021, the Investment Banking (IB) industry wallet reverted to pre-pandemic levels in 2022, with a softer start this year  Financial sponsor dry powder  Private capital  Corporate balance sheets  Debt maturities ? Interest rates ? Valuations  Geopolitical uncertainty  Inflation / recession concerns 2% Average: 2012-19 55% 23% 20% 2% 2020 58% 23% 17% 2% 2021 51% 26% 21% 54% 2022 52% 27% 20% 25% 1% 19% 1Q’23 NAMR EMEA APAC LATAM $77 $92 $133 $78 $16 2% Average: 1Q 2012-19 Average: 1Q 2012-19 $19 $19 Source: Dealogic. For additional information, see note 2 on slide 43 GLOBAL WALLET EVOLUTION BY PRODUCT ($B) GLOBAL WALLET EVOLUTION BY REGION ($B) DRIVERS 15
  • 159.
    We have beenranked #1 in IB fees for over a decade and have consistently achieved top positions across products and regions Ranked #1 by Investment Banking fees for over a decade Continued strong leadership position across products DCM ECM M&A 18 15 15 27 36 7.2% 2017 2018 2019 2020 2021 12 5.7% 2022 3 6.6% 1Q’23 26 29 27 26 45 37 8.4% 2017 2018 2019 2020 2021 8.1% 2022 6 10.1% 1Q’23 #1 rank #2 rank 4.2% 7.7% 2012 2013 2014 2015 2016 2017 2018 2019 9.1% 2020 9.3% 2021 7.9% 2022 6.1% 6.1% 8.7% 1Q’23 $67 $75 $81 $76 $75 $82 $81 $78 $92 $133 $78 $16 6.1% 39 36 36 40 51 30 8.6% 2017 2018 2019 2020 2021 8.5% 2022 7 8.2% 1Q’23 Industry wallet ($B) JPM market share Sum of top 5 boutiques1 Average of top 3 banks (ex-JPM)1 Industry wallet ($B) JPM market share #1 #1 #2 rank #2 Source: Dealogic. For additional information, see note 2 on slide 43 1 Top banks and top boutiques refer to the top positions (excluding J.P. Morgan) by year #1 rank since 2009 16
  • 160.
    REGIONS PRODUCTS CLIENTSSECTORS Priority markets where we are not #1 (e.g., Australia & Japan) #1 in North America for over a decade #1 in EMEA since 2014 ~170bps opportunity to close gap to #1 in M&A1 ~130bps opportunity to close gap to #1 in ECM1,2 #1 in DCM since 2012 Leverage franchise to further deepen and build new relationships across segments (middle market corporates and sponsors, venture capital) #1 rank with Corporates #1 rank with Financial Institutions Select sub-sectors Strong leadership position across all sectors We have several organic growth opportunities at the region, product, client, and sub-sectors level which will further strengthen our #1 position Source: Dealogic. For additional information, see note 2 on slide 43 1 Average gap to #1 bank from 2020-2022 2 ECM excludes SPACs and A-share Note: #1 position based on Dealogic rank for Investment Banking fees. For additional information, see note 2 on slide 43 Key opportunities 17
  • 161.
    Long-standing leadership position atthe sector level As a leader across sectors, our approach to growth is through investment in priority sub-sectors We have delivered growth by focusing on priority sub-sectors… …and still have an opportunity in priority sub-sectors where we have gaps 2017-19 average 2020-22 average Wallet (2020-22 average) JPM market share +220bps FinTech $3.4B +210bps Retail $3.1B +100bps Energy & Renewables $8.2B Sectors opportunity Rank (2017-2022)1 Consumer & Retail #1 Healthcare #1 Diversified Industrials #1 Energy, Power & Renewables, Metals & Mining #1 Financial Institutions #1 Media & Communications #1 Real Estate #1 Technology #2 Sub-Sectors Sectors Source: Dealogic. For additional information, see notes 2 and 3 on slide 43 1 Based on aggregate global industry wallet for 2017-2022 2 Based on average global industry wallet for 2017-2022 18 ~20% Priority sub-sectors2 Global IB industry wallet
  • 162.
    With our differentiatedstrengths, we are uniquely positioned to support our clients Talent ~25-year average JPM tenure of IB senior leadership1; ~15-year across all IB MDs2 Unmatched client experience Fortress balance sheet Financial strength to consistently support clients across business cycles 1 Senior IB leaders defined as IB management team, IB Global Chairs, IB Vice Chairs 2 Includes IB and Global Corporate Banking MDs Unrivaled breadth in offering Scaled products and nuanced expertise across regions and industries 19 Innovation mindset Evolving client solutions and coverage model to be at the forefront of client needs Strategic franchise integration across client lifecycle Multiple client touchpoints and complementary products that strengthen clients as they grow
  • 163.
    Commercial Banking: #1 leadshare in middle market1 We have best-in-class IB coverage and solutions to help clients succeed as their needs evolve Early and Growth Mature Client needs JPM IB offering & innovative solutions Multi-billion dollar Direct Lending program Take public Shareholder value creation Business expansion Strategic growth Debt and equity funding Leadership in Equity Private Placements 1 out of 5 transactions awarded Lead Left role2,4 ~18% IB share with clients who award us Lead Left2,5 #1 in Leveraged Loans2,3 Activist Defense #2 up from #5 in 20196 Dedicated cross-LOB Innovation Economy coverage For footnoted information, refer to slide 48 M&A Corporate Clarity Private capital funding 20 Innovation mindset Breadth in offering
  • 164.
    We partner acrossthe JPM franchise to support clients, adding unique value during IB transactions, and providing a complete set of offerings that deepen our relationships Securities Services Global Custody Payments Payments & Commerce Solutions Liquidity & Account Solutions Commercial Banking Direct loan Lending Private Bank Manages founder wealth Raises private capital for IPO Investment Solutions Lending Equity mgmt. (Global Shares) Wealth Advisory Markets 23% CAGR2 Corporate Derivatives revenue growth rate generated for IB client transactions since launch in 2019 Spin off EPP M&A Private Cross-border Equity follow-on IPO M&A Defense Investment Banking Markets Provides loan to investor clients FX & Hedging Provides corporate derivatives Syndicates and places securities Research Take public Shareholder value Business expansion Strategic growth Debt and equity funding Private capital funding Client needs Breadth in offering Strategic franchise integration Ongoing client touchpoints with flow businesses across JPM strengthen relationships and keep us top of mind when strategic activity occurs Manages spin-off entity Identifies potential targets and buyers Identifies mid-sized opportunities Debt issuance Commercial Banking $19B+1 IB revenue generated with CB clients since 2017 21 1 Includes gross revenue earned by the Firm that are subject to a revenue sharing arrangement with the CIB for products sold to CB clients through the Investment Banking, Markets or Payments businesses. This includes revenue related to fixed income and equity markets products 2 CAGR 2019-2022, current approach / team in place since 2019
  • 165.
    o For everydollar we generate with IB corporate clients, we generate a further $1.4 dollars in additional franchise revenue Clients value our powerful franchise collaboration model, and reward us for it Unmatched client experience Investment Banking2 #1 Commercial Banking: lead share in middle market3 #1 Payments4 #1 Private Bank5 #1 Markets4 #1 Securities Services4 #3 For every dollar we generate with IB corporate clients, clients reward us with a further $1.4 dollars in additional franchise revenue1 22 1.0 2.4 1.4 IB revenue from all IB corporate clients Additional non-IB revenue from all IB corporate clients Total franchise revenue from all IB corporate clients For footnoted information, refer to slide 48 Multiplier effect
  • 166.
    Private Capital $2.1T market3 ✓Raised $12B+ in proceeds for nearly 60 deals in 2022 ✓ Acquired Aumni ✓ Collaborated with CB to launch multi-billion dollar Direct Lending program Financial Sponsors $2.1T dry powder1 ✓ Grew share in sponsor sell-side deals by +90bps2 in collaboration with Commercial Banking (CB) ✓ Focused on select industries (technology, healthcare, green economy) International $8.1B addressable IB wallet in focus countries4 ✓ Maintained #2 global rank in green IB transactions, in 2022 achieved #2 position across M&A, ECM, and DCM6 ✓ IB financed and facilitated $120B+ in support of green activities since 2020; including advancement of emerging green economy Carbon Transition $1.1T global investment in low-carbon energy transition5 ⚫ Continue investing in high touch servicing of larger deals ⚫ Launch and scale Capital Connect by J.P. Morgan ⚫ Collaborate across franchise to strengthen offering ⚫ Deepen relationships with sponsors ⚫ Identify new M&A opportunities ⚫ CB and Global Corporate Banking (GCB) expansion ⚫ Deepen coverage expertise in Australia, India, China, Japan, and Middle East ⚫ Deepen coverage in New Economy and Healthcare ⚫ Deepen advisory expertise ⚫ Leverage Centers of Excellence to provide holistic advice PROGRESS MADE OBJECTIVES ✓ Deepened IB presence in Australia and India ✓ Expanded GCB coverage of multi-national companies with APAC presence ✓ Hired top talent to drive growth in New Economy and Healthcare We have made tangible progress on our strategic priorities 23 For footnoted information, refer to slide 48
  • 167.
    In closing #1 inInvestment Banking for over a decade1 Differentiated strengths that benefit clients and position us to grow (e.g., talent, unrivaled breadth in offering) Synergies with the franchise (e.g., Commercial Banking, Private Bank) deepen client relationships Continued progress in strategic focus areas (Financial Sponsors, Private Capital, International, Carbon Transition) Excellence in execution (e.g., by investing in technology and analytics, while deploying capital with discipline) 1 Source: Dealogic. For additional information, see note 2 on slide 43 24
  • 169.
    KEY 2022 FIRMWIDEMETRICS1 SMB Merchant Services (4% of revenue) E-commerce / Marketplaces (12% of revenue) Corporates (52% of revenue) CLIENT SEGMENTS Financial Institutions (33% of revenue) LOBs Commercial Banking and Consumer & Community Banking (43% of revenue) Corporate & Investment Bank (57% of revenue) J.P. Morgan Payments Overview vs. 2021: Revenue $13.9B 41% Clients (excl. SMB2) 31k 2k Average deposits $779B $21B Pre-tax Income $6.0B 91%3 Note: J.P. Morgan Payments and Firmwide Payments revenue and expense throughout the CIB presentation predominantly includes CIB and CB unless otherwise noted; totals may not sum due to rounding 1 All revenue and PTI numbers exclude the net impact of equity investments unless otherwise noted 2 Excludes 400k active SMB clients across CCB and Payments First 3 2021 PTI was adjusted to include CCB Merchant Services expenses BUSINESS SEGMENTS Trade & Working Capital (3% of revenue) Merchant Services (MS) (9% of revenue) Treasury Services (TS) – Liquidity & Payments (88% of revenue) 25
  • 170.
    J.P. Morgan Paymentsdelivered record growth in 2022 2021 2022 2021 Rank 2022 Rank TS market share1 7.2% 8.4% #1 #1 USD SWIFT #1 #1 Avg. payments transaction value/day $9.7T $9.8T Lockbox market share2 24.3% 29.8% #1 #1 U.S. real-time payments volume3 140mm 162mm #1 #1 Net Promoter Score4 50 54 #1 #1 Digital banking (J.P. Morgan Access®)5 #1 #1 SCF market share6 9.6% 9.9% #3 #3 U.S. merchant acquiring transactions7 32B 36B #1 #1 U.S. merchant transaction value8 $1.7T $2.0T #1 #1 Payments processing accuracy9 >99.999999% TS Liquidity 2022 Merchant Services TS Payments Trade 9.9 10.3 excluding $0.4B gains on equity investments 2021 13.9 13.5 excluding $0.4B losses on equity investments : Gains / losses on equity investments LEADERSHIP POSITIONS & GROWTH FIRMWIDE PAYMENTS REVENUE ($B) 0.1 0.1 For footnoted information, refer to slide 49 0.4 3.4 26
  • 171.
    Treasury Services growthoutpaced our top competitors as we continue to serve companies – large and small – around the world 80%+ of the U.S. Fortune 500 Companies are our Payments clients, generating $500mm+ in total revenue in 2022 AND OF THE 20 LARGEST GLOBAL COMPANIES2… expanded their relationship with us in the last year 1 Source: Coalition Greenwich Competitor Analytics. Reflects global J.P. Morgan Treasury Services business (CIB and CB). Rank is based on the Coalition Index Banks. For additional information, see note 1 on slide 43 2 Top 20 companies by market cap are as of May 15, 2023 ANNUAL NUMBER OF MANDATES WE SERVE MOST OF THE WORLD’S LARGEST COMPANIES 2017 vs. 2022 JPM Top 3 peer average CIB Core Cash Revenue  62%  30% CIB Corporates Revenue  93%  47% CIB FIG Revenue  50%  34% FIRMWIDE TREASURY SERVICES REVENUE ($B)1 17 15 Corporates FIG 2017 2022 2017 2022 1.9x 1.6x 2017 2022 $7.3 $6.5 $11.9 $9.5 Top 3 peer average Top 3 peer average $0.7 $2.4 27 JPM Rank #2 JPM Rank #1
  • 172.
    Our investments arebeginning to yield results in Merchant Services, which we believe will drive continued margin expansion in the business OUR REVENUE GREW AS WE GAINED MOMENTUM AGAINST TOP COMPETITORS… … AND OUR INVESTMENTS ARE BEGINNING TO DRIVE MARGIN EXPANSION New Unified Gateway and APIs Live Enhancing developer experience 2022 ($T) Growth ’22 vs ’21 (%) JPM (U.S. Volume) $2.0  17% Traditional Peer 1 (U.S. Volume)1 $1.7  6% Traditional Peer 2 (U.S. Volume)1 $1.7  9% Leading Fintech (Global Volume)2 $0.8  26% International expansion Expanded beyond U.S., Canada, U.K. and EU to Brazil and 7 new markets in APAC New set of value-added services Offering checkout, tokenization, omni- channel and biometrics Integrated value prop across TS and MS End-to-end payment acceptance and disbursement Data and insights Leveraging unparalleled scale to improve authorization rates and reduce fraud NOT TO SCALE Growth ’22 vs ’21 (%) 17% 11% 2021 … while revenue showed limited growth 2017 3% CAGR 13% CAGR U.S. MS Volume ($T) U.S. MS Revenue ($B) Note: Prior-period amounts have been revised to conform with the current presentation. For additional information, see note 2 on slide 44 1 Source: Nilson 2 Source: Based on externally reported data 28
  • 173.
    We expect expensegrowth to remain at low-to-mid single digits over the medium term as our investments are fully at scale EXPENSES GOING FORWARD FIRMWIDE PAYMENTS EXPENSES ($B) NOT TO SCALE 2022 Actuals Volume- & revenue-related Investments Structural / Productivity 2023 Modest increase in 2023 expenses driven primarily by wage inflation and regulatory surcharges as well as acquisition-related expenses Overall, we expect low-to-mid single digit expense growth for the medium-term Productivity gains to be delivered by new operating model integrating product and technology organizations Limited increase in investment spend as our transformation efforts are largely staffed and at scale As we add clients and volume, modest increase in structural and volume-related expenses 29
  • 174.
    Transactions Engine (Graphite) Wecontinue to modernize our infrastructure and are making significant progress on cloud migration 2026 2019 ⚫ Nearing completion; we continue to win a substantially large share of liquidity RFPs in the market ⚫ Integrated Gemstone and Renovite acquisitions to accelerate technology deployment ⚫ Configurable, modern stack live for e-commerce 2022 2023 2024 2016 2024 2017 Liquidity Platform (GLASS) Next step: Migration from core legacy platforms and decommissioning Next step: Finalize platform build and complete up to 85% of client migrations Merchant Acquiring (Helix) Next step: Commercialize new unified gateway and decommission legacy systems to migrate clients RE-PLATFORMING OF OUR PROCESSING PLATFORMS CONTINUES… Progress updates since last year ⚫ Grown to 3rd largest J.P. Morgan Payments platform 30 % of internal applications Modern Off-Prem Modern On-Prem Heritage …AS WE MAKE SIGNIFICANT PROGRESS ON CLOUD MIGRATION We continue to build new platforms that are foundational to our modernization and cloud efforts NOT TO SCALE 2021 2023 Medium-term 70%+ 15% 60%+
  • 175.
    We are expandingour offerings to deliver more value for our clients and unlock higher margins ✔ Leverage our strong foundation of core capabilities, controls and scale ✔ Address evolving client needs and personas ✔ Capture higher margin opportunities, proportionate to the value delivered Embedded Finance Orchestrate complex money movement and embed banking services in platforms (e.g., Marketplaces, PayFacs) FOR OUR CLIENTS FOR OUR CLIENTS’ CLIENTS KEY PRINCIPLES Wallets / bank accounts Onboarding Managed Pay-Outs SaaS by Industry Contextualized offerings that address needs of specific industries, either through proprietary (full stack) or partner (thin stack) offerings Smart Energy Healthcare Data and Capabilities as-a-Service New products that deliver enhanced experiences, more intelligence and better security for our clients FX-as-a-Service Security-as-a-Service Payments Products Innovation Expanding core payments offerings facilitating global money movement and liquidity management Real-time payments Alternative payment methods Structured Trade Commerce Mobility Merchant Lending JPM Coin OUR STRATEGIC FOCUS AREAS Selected product examples, not exhaustive Data-as-a-Service ✔ Harness advanced AI/ML at scale to unlock value for us and our clients ✓ ✓ ✓ ✓ ✓ ✓ ✓ ✓ ✓ ✓ ✓ ✓ ✓ ✓ ✓ Live ✓ Upcoming Pilot M a r g i n E x p a n s i o n ✓ 31
  • 176.
    ⚫ Updated userinterface for improved navigation and client experience, including mobile ⚫ Enhanced service tools ⚫ AI-enabled value-added services (e.g., Cash Flow Intelligence) ⚫ Embedded within leading ERP systems STRONG DIGITAL PORTAL SUPPORTING TREASURERS… ~34k Profiles ~$9T Monthly Transactions ~6k Mobile Users #1 for Overall Digital Capabilities1 2017 2022 Target ~2k API Clients …THAT GENERATES SIGNIFICANT REVENUE … New Developer Console coming live in 3Q …AS WE CONTINUE TO BUILD A NEW VALUE PROPOSITION FOR DEVELOPERS Unified API across payment rails 15% CAGR 9% CAGR We continue to enhance the ways our clients can connect with us, focusing on improving developer experience and ease of use Firmwide Payments Digital Channels Fee Revenue <1.global.api> 1 Source: Coalition Greenwich Digital Transformation Benchmarking 2022 – Large Corporate Segment 2 Target growth rates go out no further than 2025 NOT TO SCALE 2 32
  • 177.
    We are beginningto unlock value by transforming the breadth and scale of our data into value-added products for our clients Payments Data Lake Single source, cloud-native platform that stores and harnesses the data Validation Services Customer Insights We continue to build more use cases in partnership with other Lines of Business (e.g., CCB) and our Strategy & Growth Office 3 Tokenization Tokenize customer data to store in proprietary secure vault Strong data governance and controls Data is appropriately encrypted, depersonalized, and aggregated Optimization Tools for Merchant Acquiring 2 1 Combined issuing and acquiring data Improved authorization rates JPM PAYMENTS’ VAST SCOPE OF DATA… …COMBINED WITH OUR TOOLS… …POWERS KEY USE CASES WITH HIGH CLIENT VALUE Instant Identity Verification 4 Test: onboard and validate identity Customized reports with anonymized insights on our customers’ customers Lower fraud rates Test: face and palm biometrics Biometrics and Digital Identity (in testing) 36B U.S. Annual Merchant Acquiring Transactions 50%+ U.S. DDA Payment Accounts #1 USD Clearing Correspondent Bank ~1.3B Unique U.S. Cards Direct access to Third Party Datasets (e.g., Early Warning Services – EWS) 33 Extend internationally through Liink network 0 to 200+ clients onboarded in <2 years
  • 178.
    WE HAVE ASTRONG BUSINESS TODAY… ~120 Currencies 7k+ Clients ~160 Countries ~$190B Annual FX Payments Flow ⚫ Joint product development and deep partnership between Payments and Markets ⚫ New Transact platform in Markets enables Corporates to proactively hedge and manage FX exposures through integrated pre-trade, trade, and post-trade workflow ⚫ Consistent double digit revenue growth with both CIB and CB clients …WITH NEW OPPORTUNITIES… Global Mass Pay for Corporates: Helping platforms and marketplaces facilitate millions of low-value transactions around the world in minutes, with high STP rates ✓ FX-as-a-Service for FIs: Giving traditional banks a white-label solution to support their clients… … and giving fintechs the APIs needed to connect to global payments infrastructure ✓ We see strong near-term growth from extending our market-leading FX payments capabilities, in partnership with our Markets business 2017 2022 Target … EXPECTED TO DELIVER STRONG CONTINUED GROWTH Firmwide Payments FX Revenue1 15%+ CAGR 15%+ CAGR $1B 1 Portion of Firmwide Payments FX revenue is shared with the Markets business 2 Target growth rates go out no further than 2025 NOT TO SCALE 2 34
  • 179.
    Many of ourend-to-end Embedded Finance solutions are now live and scaling to support client demand Client needs Our enhanced product suite Est. margin expansion Unlocks New Revenue Streams Payment acceptance Manage funds Payment disbursement Intuitive digital experience, allowing payments when and how desired Convenience of managing risk and complexity of money movement Hassle-free enrollment of sellers, with reliable and fast payments Merchant Developer Console Online Checkout, Tokenization and Optimization Omnichannel (incl. Biometrics) Alternative Methods of Payments (incl. Pay-by- Bank) Seller Wallet 1 3rd Party Money Account Seller Bank Account 1 Embedded Finance Onboarding Accounts Lending Seller Wallet 2 3-4x 3-4x …. Seller Bank Account 2 …. 23 In Implementation / Mandated $15B 2022 U.S. Embedded Finance TAM1 Client traction Global Real- Time Payments Managed Pay-Outs Embedded FX Payments 1 Calculated based on external market reports and J.P. Morgan Payments internal data 5 Live 140+ In Pipeline Enabling Key Use Cases / Industry Solutions Retail & Commerce E-commerce Mobility ISVs Professional Services Energy 35
  • 180.
    Easy account creation, real-time accessto funds for customers Simple customization, no banking experience required Embed financial solutions into marketplaces and platforms Video: Embedded Finance Solutions 36
  • 181.
    Recognize shoppers across channels Unifiedpayment history Frictionless in-store shopping Video: Omnichannel journey 37
  • 182.
    The future ofstores with biometric payments Experience a faster way to pay with biometric payments Enroll in biometric payments and pay by face Contactless payments Simple in-store checkout flow Note: Future biometrics capabilities are under development; features and timelines are subject to change at the bank's sole discretion 38 Thank You, Emily Payment Approved
  • 183.
    We work closelywith the rest of the Firm to deliver value to our clients Excerpt from Investment Banking section PAYMENTS IS INTEGRAL TO OUR FIRMWIDE SUCCESS… One Client Strategy With IB and CB… ⚫ Coordinated client coverage and solutioning ⚫ Product innovation and co-creation Client Lifecycle Engagement ⚫ Day-to-day flow relationship maintains client dialogue and enhances economics ⚫ Solutions to help clients grow and expand internationally Cross-LOB Partnerships ⚫ With Markets: FX Payments ⚫ With CCB: Data & Analytics, Payment Network Relationships, Small Business ⚫ With Firmwide Centers of Excellence: Client Onboarding and KYC, Technology (e.g., Cloud), AI/ML …AS WE PARTNER WITH OTHER BUSINESSES ACROSS CLIENTS’ LIFECYCLE 39
  • 184.
    2022 Rates + balances Organicgrowth 2023 Outlook Rates going forward Organic growth, incl. balances Revised Target We delivered on our promises made last year and will continue to work towards sustained growth and higher operating leverage Targets set at 2022 Investor Day 2022 performance $15B Medium-term revenue target $13.9B >10%1 Average annual revenue growth (2021 onwards) 41% >20%1 Average annual PTI growth (2021 onwards) 91% 10%1 TS Payments YoY revenue growth 14% 15%1 MS YoY revenue growth (over-time) 8% 15%1 Trade YoY revenue growth 17% 10% TS market share 8.4%2 20% SCF market share 9.9%3 FIRMWIDE PAYMENTS REVENUE NOT TO SCALE $13.9B Grow to ~$1B / year in the medium-term $15B Target set last year 1 Target growth rates go out no further than 2025 2 Source: Coalition Greenwich Competitor Analytics. Reflects global J.P. Morgan Treasury Services business (CIB and CB). For additional information, see note 1 on slide 43 3 Source: Coalition Greenwich Competitor Analytics. SCF represents Supply Chain Finance. Share reflects JPM share of Coalition Index Banks for CIB. For additional information, see note 1 on slide 43 40
  • 185.
    Closing thoughts 41 We deliveredrecord revenue and expect client momentum to drive continued organic growth Our scale, security & controls have earned the trust of our clients, and we are there for them in good and bad times We build and innovate like a leading technology company, with scale and appropriate controls Our unified approach across the Firm helps provide unique value to our clients at any scale and geography Innovation across payments and merchant services will drive margin expansion across our business 1 2 3 4 5
  • 187.
    We will buildon our leadership position by applying consistent discipline and continuously future-proofing our model COMPLETE GLOBAL DIVERSIFIED AT SCALE Maintaining day-to-day discipline Optimizing our current model Transforming for the future Closing addressable gaps in our wallet Accelerating organic growth Attracting and retaining our talent Modernizing our core technology to enable scale and faster innovation 1 2 3 Advancing strategic platforms to further integrate our delivery of the Firm and provide a better experience for our clients Monitor and invest in new and emerging technology (e.g., AI) to develop future-proof solutions Continued resilience in the face of disruption risks to our business Holistic client servicing across businesses to bring the best of the Firm Accelerating organic growth Agile capital deployment and dynamic financial management to optimize profits Geopolitics Inflation Digitization & AI Carbon transition War for talent Rates Traditional players New entrants Market structure 42 ~16% ROE through the cycle target MACRO ENVIRONMENT COMPETITIVE LANDSCAPE MARKET FORCES Note: ROE through the cycle target excludes the impact of legal expense
  • 188.
    Notes on marketshare, ranks, and industry wallets 1. Source: Coalition Greenwich Competitor Analytics. Based on JPMorgan Chase’s internal business structure and internal revenue. Excludes the impact of Archegos in 2021 Historical Coalition Greenwich competitor revenue and industry wallets have been rebased to ensure consistent taxonomy and accounting/structural adjustments Market share reflects share of the overall industry product pool, unless noted that share reflects share of Coalition Index Banks Rank reflects JPMorgan Chase’s rank amongst Coalition Index Banks as follows: – CIB and Markets: BAC, BARC, BNPP, CITI, CS, DB, GS, HSBC, JPM, MS, SG and UBS – Treasury Services and Supply Chain Finance (SCF): BAC, BNPP, CITI, DB, HSBC, JPM, SG, SCB and WFC – Securities Services: BAC, BBH, BNPP, BNY, CITI, DB, HSBC, JPM, NT, RBC, SCB, SG, and SS 2. Source: Dealogic as of April 3, 2023 (unless otherwise noted) for GIB, ECM, DCM, and M&A rank, market share and industry wallet. ECM excludes shelf deals. DCM includes all bonds, loans, and other debt (i.e., securitizations and frequent borrowers), excluding money market and short-term debt 3. Market share changes are rounded to the nearest 10bps 43
  • 189.
    1. In thefirst quarter of 2023, the allocations of revenue and expense to CCB associated with a Merchant Services revenue sharing agreement were discontinued and are now retained in Payments in CIB 2. Revenue adjusted down by $0.1B for 2017 and $0.2B for 2018, 2019 for both CIB and Firmwide Payments for data processing accounting re-class Additional notes 44
  • 190.
    1. The CIBprovides certain non-GAAP financial measures. These measures should be viewed in addition to, and not as a substitute for, the CIB’s reported results. The non-GAAP financial measures on slides 2 and 5 exclude the impact of legal expense. Adjusted ROE on slide 2 is calculated as net income after preferred stock costs excluding the impact of legal expense divided by average equity. CIB average equity was $70B, $70B, $80B, $80B, $83B and $103B for 2017, 2018, 2019, 2020, 2021 and 2022, respectively. The table below provides a reconciliation of reported results to these non-GAAP financial measures Reconciliation of reported to adjusted results excluding the impact of legal expense Year ended December 31, (in millions, except where otherwise noted) 2017 2018 2019 2020 2021 2022 (1) Revenue Reported/ Adjusted 35,667 $ 37,549 $ 39,436 $ 49,451 $ 51,942 $ 48,102 $ (2) Expense Reported 20,259 $ 22,094 $ 22,662 $ 23,773 $ 25,553 $ 27,350 $ Adjustments: Legal Expenses 18 $ (205) $ (381) $ (796) $ (252) $ (117) $ Adjusted 20,277 $ 21,890 $ 22,281 $ 22,977 $ 25,302 $ 27,232 $ (3) Net Income Reported 10,976 $ 11,760 $ 11,919 $ 17,043 $ 21,107 $ 14,925 $ Adjustments: Legal Expenses (17) $ 184 $ 347 $ 732 $ 224 $ 86 $ Adjusted 10,959 $ 11,944 $ 12,266 $ 17,775 $ 21,331 $ 15,011 $ (4) ROE Reported 15% 16% 14% 20% 25% 14% Adjusted 15% 16% 14% 21% 25% 14% Notes on non-GAAP financial measures 45
  • 191.
    Notes on slides3-4 Slide 3 – We continue to maintain a leadership position across products and regions 1. Source: Coalition Greenwich Competitor Analytics (all ranks excluding GIB, ECM, DCM, and M&A) and Dealogic (GIB, ECM, DCM, and M&A ranks). Includes co-ranked positions as defined by Coalition Greenwich 2. Businesses include CIB, Banking, GIB, M&A, ECM, DCM, CIB Treasury Services, CIB Trade Finance, Markets, FICC, G10 Rates, G10 FX, EM Macro, EM Credit, Commodities, G10 Credit, SPG, Public Finance, G10 Financing, Equities, Cash Equities, Equity Derivatives, Prime Brokerage, Futures, and Securities Services. FY17 includes Credit and does not include EM Credit and G10 Credit. EMEA and APAC do not include Public Finance 3. Source: Coalition Greenwich Competitor Analytics. 2022 total CIB regional rank for Americas, EMEA and APAC. Ranks are based on the Coalition Index Banks 4. Americas reflects North America and Latin America For additional information, see notes 1 and 2 on slide 43 Slide 4 - Market share gains across most businesses and all regions have helped widen the gap to peers 1. Source: Coalition Greenwich Competitor Analytics (Markets, Payments and Securities Services), reflecting JPMorgan Chase’s internal business structure and internal revenue; Payments reflects global J.P. Morgan Treasury Services business (CIB and CB). Dealogic (Investment Banking) 2. Source: Coalition Greenwich Competitor Analytics. Market share for CIB, reflecting JPMorgan Chase’s internal business structure and internal revenue. Americas reflects North America and Latin America 3. Source: Coalition Greenwich Competitor Analytics. Market share for CIB, reflecting JPMorgan Chase’s internal business structure and internal revenue. Peer ranks are for the respective year For additional information, see notes 1, 2 and 3 on slide 43 46
  • 192.
    Notes on slides7-11 Slide 7 – We remain the leading global Markets franchise, with sustained growth and continued client excellence 1. Source: Coalition Greenwich Competitor Analytics for FICC and Equities ranks; Institutional Investor for Research rank. Ranks for 2022 2. Source: Coalition Greenwich Competitor Analytics 3. Source: Coalition Greenwich Client Analytics. Represents top 1,000 financial institutions (FI) based on wallet size 4. Source: Coalition Greenwich Competitor Analytics (for 2022). Americas reflects North America and Latin America. Ranks are based on JPMorgan Chase’s internal business structure and internal revenue and the Coalition Index Banks 5. Revenue CAGR is based on internal management revenue 6. Source: Coalition Greenwich Institutional Voice of the Client Analytics (for 2022) For additional information related to footnotes 1, 2 and 4, see notes 1 and 3 on slide 43 Slide 11 – Securities Services is a leading provider, delivering strong financial performance and consistent market share growth 1. Client (institution) is defined as receiving one or more services across Custody, Fund Services, Trading Services, or Data Solutions 2. Based on Thinking Ahead Institute 2022 Top 500 ranking 3. Based on GlobalSWF.com ranking 4. Based on SWFInstitute.org ranking 5. Based on 2022 revenue 6. AUC is on a spot basis. Deposits are on an average basis 7. 2017 revenue excludes discontinued business 8. Average operating margin is shown from 2017 through 2022. Operating margin excludes credit reserves of $(5)mm and $38mm for 2017 and 2022, respectively 9. Source: Coalition Greenwich Competitor Analytics. For additional information, see notes 1 and 3 on slide 43 47
  • 193.
    Notes on slides20-23 Slide 20 – We have best-in-class IB coverage and solutions to help clients succeed as their needs evolve 1. Source: Coalition Greenwich FY22. $20mm-$500mm 2. Source: Dealogic. For additional information, see note 2 on slide 43 3. Based on aggregate deal value from 2017-2022 4. From 2017-2022; transaction size of at least $500mm 5. From 2017-2022 6. Source: Bloomberg Slide 22 – Clients value our powerful franchise collaboration model, and reward us for it 1. Analysis based on all IB corporate clients with IB revenue from 2020-22; Franchise revenue includes IB, Payments, Markets, Securities Services, Asset Management, Bank Lending 2. Source: Dealogic. For additional information, see note 2 on slide 43 3. Source: Coalition Greenwich FY22. $20mm-$500mm 4. Source: Coalition Greenwich Competitor Analytics (Markets, Payments and Securities Services rank), reflecting JPMorgan Chase’s internal business structure and internal revenue, which may differ from externally disclosed revenue. Rank is based on the Coalition Index Banks. Payments reflects global J.P. Morgan Treasury Services business (CIB and CB). For additional information, see note 1 on slide 43 5. Source: Euromoney’s Private Banking Awards 2023 Slide 23 – We have made tangible progress on our strategic priorities 1. Source: Preqin 2. Source: Dealogic. 2020-2022 average share vs. 2012-2019 average share. For additional information, see notes 2 and 3 on slide 43 3. Source: Pitchbook (for Equity Private Placements) and Preqin (for Private Debt) 4. Source: Dealogic as of May 15, 2023. Excludes A-shares and domestic bond issuances 5. Source: Bloomberg NEF: Energy Transition Investment Trends 2023 6. Source: Dealogic as of January 1, 2023 48
  • 194.
    Notes on slide26 Slide 26 – J.P. Morgan Payments delivered record growth in 2022 1. Source: Coalition Greenwich Competitor Analytics. Reflects global J.P. Morgan Treasury Services business (CIB and CB). Rank is based on the Coalition Index Banks. For additional information, see note 1 on slide 43 2. Source: EY Cash Management Ranking Report 3. Source: The Clearing House (TCH); annual volume originated and received 4. Source: Coalition Greenwich US Large Corporate Cash Management 2022 Program. NPS for J.P. Morgan based on Total Market. 2022 Investor Day represented JPM Target Market 5. Source: Coalition Greenwich Digital Transformation Benchmarking 2022 – Large Corporate Segment 6. Source: Coalition Greenwich Competitor Analytics. SCF represents Supply Chain Finance. Share reflects JPM share of Coalition Index Banks for CIB. Prior period amounts have been revised to conform with the latest analysis from Coalition Greenwich. For additional information, see note 1 on slide 43 7. Source: Nilson. 2022 Investor Day reflected Global Merchant Acquiring transactions / year of 37B in 2021 which is 41B in 2022 8. Source: Nilson. including Visa/Mastercard, pin and other credit volumes 9. Payment errors divided by total transactions processed 49
  • 196.
    Commercial Banking –executing a proven strategy Organic growth driven by continued investment and expansion into select, high-potential markets and industries – proven, multi-year track record EXPANDING OUR CLIENT FRANCHISE Enabling our teams to serve our clients in a highly-differentiated manner Data-enabled, consultative teams, equipped with digital tools and powerful analytics EMPOWERING OUR TEAMS Rich data assets and a nearly 600TB cloud-based platform that deliver valuable insights across the firm and to our clients BUILDING A DATA-DRIVEN BUSINESS Investing to deliver more value to clients through our broad-based capabilities Innovative solutions to help deepen relationships and drive client acquisition INNOVATING TO EXTEND OUR COMPETITIVE ADVANTAGE Relentless focus on operational excellence to deliver a superior client journey and drive efficiency ENHANCING THE CLIENT EXPERIENCE Rigorous client selection with a long-term, through-the-cycle approach Strong credit and control culture, with 2022 NCO rate of 4bps MAINTAINING FORTRESS PRINCIPLES Ongoing expense discipline while investing for the long term Strong returns in 2022 – 16% ROE, with high-quality, resilient, and diversified earnings DELIVERING STRONG FINANCIAL RESULTS 1
  • 197.
    First Republic Bank– building on our strength Add quality clients and expand footprint in high-growth markets Increase support of communities and nonprofit organizations Deliver the Firm’s capabilities to new clients Gain access to top talent in key locations 2 Complement our leading Commercial Real Estate portfolio Maintain strong credit culture and focus on exceptional client service Note: Totals may not sum due to rounding 1 First Republic figures estimated as of April 13, 2023 based on data provided by the FDIC; $173B of loans are prior to fair value marks; $92B of deposits include $30B of deposits from large U.S. Banks …ALIGNS WITH CB’S CLIENT-CENTRIC APPROACH 60% 13% 12% 6% 8% Single family Multifamily Capital call lines and business Commercial real estate Other Bold indicates categories most relevant for CB FIRST REPUBLIC BANK’S MODEL… Breakdown of loan portfolio $173B1 $173B Loans1 $92B Deposits1 Exceptional client service Strong credit performance
  • 198.
     Robust technologyinfrastructure and firmwide utilities to provide scale  Strong brand recognition to attract the best talent with global mobility opportunities  Community impact delivered at scale  Deep relationships with businesses and business owners  Comprehensive liquidity solutions  Value-added digital solutions  Extensive network of 4,700+ branches  Business Banking franchise creates client flow into CB as businesses grow  Powerful data and analytics leveraged across lines of business JPMorgan Chase platform drives competitive advantage and unmatched value for CB clients AWM Corporate CCB Brand Community Impact Branch Network Business Banking Private Bank Asset Management Markets Technology Payments CIB Investment Banking Commercial Banking 3 1 Coalition Greenwich Competitor Analytics (CIB rank), reflecting JPMorgan Chase’s internal business structure and internal revenue, which may differ from externally disclosed revenue. Rank is based on the Coalition Index Banks  The #1 corporate and investment bank deepens our strategic relationships1  Global payments platform with cross-border capabilities  Investment capacity for long-term growth and innovation
  • 199.
    Commercial & Industrial(C&I) – segmented to best serve our clients Corporate & Investment Bank Business Banking 22k Clients 45k Prospects Middle Market Banking and Specialized Industries Corporate Client Banking and Specialized Industries 3k Clients 3k Prospects Financial Institutions Multinational Corporations Franchise Nonprofit Beverage Life Sciences Energy Media and Entertainment Healthcare Technology Agribusiness Heavy Equipment Apparel Higher Education Government Real Estate Tech & Disruptive Commerce Green Economy 4 $5.1B Revenue $3.9B Revenue SECTOR EXPERTISE ACROSS 18 SPECIALIZED INDUSTRIES Note: Revenue reflects FY 2022; prospect and client figures as of December 31, 2022
  • 200.
    Commercial Real Estate(CRE) – positioned for through-the-cycle performance 5 Commercial Term Lending (CTL) | #1 multifamily lender in U.S.1  Term financing of stabilized properties in supply-constrained markets  Industry-leading origination process delivered with speed and certainty of execution  Continued innovation and investment in rental payments solutions Community Development Banking (CDB) | #3 affordable housing lender in U.S.2  Range of financing solutions for affordable housing  Programs to revitalize neighborhoods and community development projects  Over $10B in financing towards creation of 46k+ affordable housing units since 2020 Real Estate Banking (REB)  Top-tier investors and developers in major U.S. markets  Portfolio lending on core property types, such as multifamily, industrial, and retail  Over 50% of revenue driven by payments and liquidity $1.5B Revenue $0.3B Revenue $0.7B Revenue Deep sector and market knowledge Focus on primary, supply-constrained markets Limited exposure to riskier asset classes Disciplined market, client, and asset selection CYCLE-RESISTANT STRATEGY Note: Revenue reflects FY 2022 and does not include Corporate Client Banking Real Estate; other figures as of December 31, 2022 For footnoted information, refer to slides 23-24
  • 201.
    17% Return on equity CommercialBanking – decade-long, sustainable growth with strong returns $7.1 $11.5 2012 2022 +61% $2.7 $4.2 2012 2022 +56% $196 $294 2012 2022 +50% $2.7 $5.9 2012 2022 +121% $1.6 $3.0 2012 2022 +86% 6 $120 $224 2012 2022 +86% 40% Overhead ratio 5 bps Net charge-off rate REVENUE1 ($B) AVERAGE DEPOSITS ($B) PAYMENTS REVENUE2 ($B) 10-YEAR AVERAGE METRICS NET INCOME ($B) AVERAGE LOANS ($B) GROSS IB REVENUE3 ($B) Note: Totals may not sum due to rounding For footnoted information, refer to slides 23-24
  • 202.
    $53 $1,000 $2,000 2010 Old Target 2022 $1,542 Organic expansionin Middle Market Banking Middle Market bankers located within branch network1 93% Middle Market clients 22k Top 100 MSAs in Middle Market footprint 78 28k Prospects 7k Clients 3x Growth in average deposit balances since 2018 Legacy states Expansion states Client and prospect density2 7 Target MIDDLE MARKET NATIONAL COVERAGE EXPANSION MARKET REVENUE GROWTH ($mm) Note: Figures as of December 31, 2022 For footnoted information, refer to slides 23-24 32% CAGR
  • 203.
    Large, cross-border marketopportunity Mexico Australia U.S. Netherlands China Japan Korea Hong Kong Taiwan Vietnam Germany Canada Trade corridor with $200B+ annual flow 8 1 International Trade Centre (ITC) trade map; bilateral flow calculated based on sum of export and import trade volumes for FY 2021 2 “A vision for the future of cross-border payments;” McKinsey, data as of 2022 Foreign exchange Strategic advisory and M&A Liquidity Payments Bilateral trade corridors with $200B+ annual flow1 13 Trade volume globally2 $24T CAGR in cross-border trade flow since 20172 7% Trade GLOBALIZATION OF FINANCIAL SERVICES CROSS-BORDER NEEDS
  • 204.
    INTERNATIONAL REVENUE ($mm)1 Globalsolutions and expertise delivered locally 9 $386 $847 $1,000 2017 2018 2019 2020 2021 2022 Target 17% CAGR  Local expertise with global footprint – covering nearly 3.2k multinational clients across 30 countries  Streamlined approach to complex global treasury management with access to firmwide solutions  Uniquely positioned to meet clients’ cross-border needs relative to regional commercial banks  Disciplined approach to build long-term franchise value – covering 500+ clients and 2.5k prospects  Differentiated value through JPMorgan Chase capabilities including IB, FX/Trade, payments, liquidity, and lending  Strong results and growth potential – significantly increasing revenue and quadrupling deposits since 2019 HELPING CLIENTS EXPAND INTERNATIONALLY SERVING INTERNATIONALLY-HEADQUARTERED CLIENTS Note: Figures as of December 31, 2022 1 Denotes non-U.S. revenue from U.S. multinational clients and Corporate Client Banking expansion efforts to serve non-U.S. headquartered companies internationally
  • 205.
    Committed to beingthe most important financial services partner to the Innovation Economy Dedicated CB coverage for VC firms and portfolio companies Specialized investment banking coverage Additional capital and liquidity management solutions through J.P. Morgan Asset Management Early-stage lending capabilities and payments solutions Suite of digital assets designed to serve startup clients 2017 2018 2019 2020 2021 2022 39% CAGR Innovation Economy revenue Private Bank focus on founders and VC partners Global reach accelerated by international expansion 10 CONNECT Portfolio companies VC partners & company founders Venture Capital (VC) firms CIB CB AWM Firmwide strategy Unique assets for clients UNMATCHED CAPABILITIES TO SERVE THE VC ECOSYSTEM BROAD-BASED COVERAGE AND POWERFUL SOLUTIONS CB – EXECUTION OF A LONG-TERM STRATEGY Positioned to serve clients through every stage of life-cycle
  • 206.
    Disciplined, focused approachto Private Equity coverage of North American IB wallet is sponsor-related2 37% Global Private Equity dry powder1 $1.2T+ Expansive Middle Market reach of 22k clients and 45k prospects Focused CB coverage team for Middle Market financial sponsors Dedicated advisory and IB coverage resources for Middle Market sponsors and portfolio companies Leading leverage finance and Debt Capital Markets teams Risk discipline through specialized credit and structuring teams 2017 2022 2.1k 3.2k U.S. PE Middle Market dry powder1 2017 2022 $332B $421B U.S. PE Middle Market deal count1 Direct lending solutions provide full range of financing alternatives 11 SIGNIFICANT OPPORTUNITY IN PRIVATE EQUITY (PE)… …WITH TREMENDOUS MIDDLE MARKET POTENTIAL UNMATCHED CAPABILITIES TO CAPTURE OPPORTUNITY For footnoted information, refer to slides 23-24
  • 207.
    1 Includes grossrevenues earned by the Firm, that are subject to a revenue sharing arrangement with the CIB, for products sold to CB clients through the Investment Banking, Markets or Payments businesses. This includes revenues related to fixed income and equity markets products Delivering the #1 corporate and investment bank to CB clients 2012 2022 $1.6 $5.1 $3.0 $4.0 Expanding regional IB coverage with focus on Middle Market 12 Green Economy International Middle Market Innovation Economy Private Equity Healthcare CB GROSS INVESTMENT BANKING REVENUE1 ($B) TARGETED GROWTH INVESTING TO GROW SHARE 6% CAGR Adding M&A and equity private placement capacity Deepening our coverage across our growing franchise Focused on targeted market opportunities Target
  • 208.
    Robust growth inpayments and liquidity 2017 2018 2019 2020 2021 2022 $3.8 $4.4 $4.3 $3.8 $3.8 $5.9 9% CAGR 2017 2018 2019 2020 2021 2022 $177 $171 $173 $238 $302 $294 11% CAGR Actively monitoring deposit market fundamentals Continued momentum in 2023 – 1Q23 Payments revenue up 98% YoY 13 Uplift in liquidity revenue from higher deposit margins Strong organic growth through client acquisition and market share gains Increased fee revenue driven by strength of our offering and ongoing investments ~30% of 2022 Middle Market average deposit balances generated by clients acquired since 2017 Betas managed dynamically through the cycle for each segment of the business Balances impacted by expected outflows to higher-yielding alternative solutions CB PAYMENTS REVENUE1 ($B) AVERAGE CB DEPOSIT BALANCES ($B) Note: Totals may not sum due to rounding For footnoted information, refer to slides 23-24
  • 209.
    High-quality loan portfolios 20172018 2019 2020 2021 2022 $96 $99 $100 $110 $98 $110 2017 2018 2019 2020 2021 2022 $102 $106 $108 $109 $107 $114 Average 1Q23 loans for CB up 1% quarter-over-quarter, as clients adjust to higher interest rates and economic uncertainty 14 11% increase YoY, driven by higher revolver utilization and new loan demand Market is taking a modestly more conservative approach to credit quality, leverage, and pricing #1 overall syndicated lender in Middle Market1 7% increase YoY, driven by growth in term lending and affordable housing Reduced purchase activity and demand for refinancing driven by higher interest rates Elevated level of maturities over next few years AVERAGE C&I LOANS ($B) AVERAGE CRE LOANS2 ($B) Note: Commercial and Industrial (C&I) and Commercial Real Estate (CRE) groupings used herein are generally based on client segments and do not align with regulatory definitions For footnoted information, refer to slides 23-24
  • 210.
    Maintaining risk discipline– C&I  Portfolio credit quality remains strong  Diversified across industries and regions  88% of non-investment grade exposure is secured1  Disciplined, through-the-cycle underwriting  Dedicated underwriters for targeted industries  Appropriately reserved for current market environment 2.0% 0.1% 2008 2010 2012 2014 2016 2018 2020 2022 Commercial Banking Peer Average  Supply chain disruption and inventory shortages have eased  Higher interest rates and inflation driving margin compression for certain clients  Closely watching potentially vulnerable sectors for stress  Detailed downturn playbook to ensure readiness across a range of economic scenarios 27% 16% 12% 11% 5% 5% 4% 4% 16% Consumer & Retail Industrials Healthcare Tech, Media & Telecomm Oil & Gas State & Municipal Gov't Utilities Automotive Other 15 1.0% 0.2% 2008 BREAKDOWN BY INDUSTRY2 NET CHARGE-OFF RATE (%)3 MARKET COMMENTARY SUMMARY Note: Metrics are as of December 31, 2022 unless otherwise noted For footnoted information, refer to slides 23-24
  • 211.
    Maintaining risk discipline– CRE  Strong credit performance – FY 2022 NCOs of ~$1mm  Focused on asset classes with strong through-the-cycle performance  Over 60% of loans in Commercial Term Lending multifamily portfolio  Granular portfolio with average loan size of ~$2mm  Secured by class B/C properties  Portfolio remains high quality – LTV of ~49%, DSC of 1.8x1  Minimal exposure in hospitality, homebuilders, condos, and land 67% 9% 9% 5% 10% 0.9% 0.0% 2.3% 3.3% 2008 2010 2012 2014 2016 2018 2020 2022 Commercial Banking Peer Average 16  Monitoring impact of market liquidity on pricing and yields  Office: ~9% of CRE exposure  Majority class A with top tier sponsorship  Adequately reserved for market uncertainty  Construction: ~8% of CRE exposure, excluding Affordable Housing  Highly-selective portfolio  Majority with repayment recourse of ~30% or more Multifamily Industrial Office Retail Other BREAKDOWN BY PROPERTY TYPE2 NET CHARGE-OFF RATE (%)3 MARKET COMMENTARY SUMMARY Note: Metrics are as of December 31, 2022 unless otherwise noted For footnoted information, refer to slides 23-24
  • 212.
    2019 2022 1Q23Target JPM CB OH ratio 40% 41% 37% 40%+/- CB peer avg. OH ratio2 46% 46% 44% – Strong operating efficiency while investing in our franchise $3.3 $3.8 $0.7 $0.1 $0.4 $0.2 $0.9 $0.1 $0.4 $0.2 $4.3 $1.0 Volume- & revenue-driven Structural Investments 2022 2023 Outlook Investments Structural Volume- & revenue-driven $4.0 $4.7 $5.3 2021 +17% +13% Investments Volume- & revenue-driven  Performance-driven comp  Growth-driven middle office Structural  Front office (2+ year tenure)  Middle/back office  Technology (run the bank)  Support functions (e.g., risk) Investments  Technology, product, data, and analytics  Bankers  Sales enablement  Client experience  Operational excellence 17 Volume- & revenue-driven / Structural Note: Totals may not sum due to rounding and exclude the impact of the First Republic Bank transaction For footnoted information, refer to slides 23-24 BREAKDOWN OF EXPENSE CB ADJUSTED EXPENSE ($B)1
  • 213.
    150 Data sources incorporated 167mm+ Companiesmapped 23k+ Firmwide users in 2022 18 Cloud-based, client-focused data platform delivering tremendous value Client 360 External data Transaction data Internal data Service activity CSAT / NPS / Surveys1 Digital usage Capital raised Company research Firmographics ° IB activity Client value  Business optimization  Peer benchmarking  Cash flow forecasting Sales enablement  New lead generation  Targeted solutioning  Pricing optimization Risk decisioning & portfolio mgmt.  Dynamic portfolio management  Enhanced risk analytics  Enriched credit approvals Operational excellence  Servicing automation & analytics  Fraud prevention analytics  Targeted quality control DELIVERING BUSINESS VALUE MEASURING PROGRESS 1 Client Satisfaction (CSAT) and Net Promoter Score (NPS)
  • 214.
    Pricing analytics toolsto optimize loan and deposit pricing Digital, mobile, interactive marketing tools and collateral to maximize client interactions Workflow optimization through cross- functional collaboration and connectivity Solutions-oriented coverage teams enabled with holistic view of clients Targeted training sessions to ensure bankers are fluent on latest product innovations Timely market and industry insights to identify and prioritize opportunities and increase proactivity Client coverage teams enabled with data-driven tools, insights, and analytics Client satisfaction Banker productivity Speed to decision Win rate Revenue Cost 19
  • 215.
    Relentless focus onclient experience and operational excellence Client satisfaction Speed Operational risk Product complexity Operating leverage Cost to serve 1 Client solutioning  Engage in analytics- driven solutioning  Increase 3rd party integrations for connectivity  Use client insights to inform new designs KYC  Minimize client impact  Streamline and digitize documentation  Automate existing manual processes Onboarding  Reduce onboarding cycle times  Streamline and digitize documentation  Expand client training and enablement Lending  Enhance data-driven decisioning  Increase speed to commitment  Simplify client journey Content delivery  Deliver digital targeted JPMC content  Offer data-driven analytics and insights 20 Servicing  Streamline service channels  Reduce inquires through self-service and product improvements  Improve case productivity
  • 216.
    2017 2017-2022 Execute growth initiatives (longer-term revenuetargets) Maintain expense discipline Optimize returns Target 2022 Investment banking2 $2.4B $4.0B 5% CAGR $3.0B Overhead ratio 40% 40%+/- 41% 40% average 17% Return on equity 18%+/- 16% 17% average Record Middle Market expansion $0.6B $2.0B 20% CAGR $1.5B CB International1 $0.3B $1.0B 17% CAGR $0.8B Progress towards targets, driving strong, consistent returns for shareholders 21 1 Denotes non-U.S. revenue from U.S. multinational clients and Corporate Client Banking expansion efforts to serve non-U.S. headquartered companies internationally 2 Includes gross revenues earned by the Firm, that are subject to a revenue sharing arrangement with the CIB, for products sold to CB clients through the Investment Banking, Markets or Payments businesses. This includes revenues related to fixed income and equity markets products
  • 217.
    COMPLETE, GLOBAL, ANDDIVERSIFIED  Unmatched ability to support clients’ needs as they grow  Local delivery of global expertise and broad-based capabilities  Differentiated platform and competitive advantage of JPMorgan Chase Commercial Banking – executing a proven strategy STRONG, CONSISTENT FINANCIAL PERFORMANCE  Diversified, resilient revenue streams  Operating leverage achieved through industry-leading efficiency ratio  Through-the-cycle growth and steady returns LARGE AND GROWING ADDRESSABLE MARKET  Significant organic growth potential  Extensive reach, both domestically and internationally  Focused client coverage with specialized expertise SUSTAINED INVESTMENT WITH COMPOUNDING RESULTS  New bankers in high-potential markets and industries  Digital innovation delivering tangible results  Data-driven strategy anchored by cloud-based, client-centric platform FORTRESS PRINCIPLES  Rigorous underwriting and client selection  Credit portfolio positioned to weather market uncertainty  End-to-end management focus across compliance and controls GREAT PEOPLE AND A WINNING CULTURE  Consultative, solutions-oriented client coverage teams  Empowered and data-enabled organization  Focus on driving community impact 22
  • 218.
    Slide 5 –Commercial Real Estate (CRE) – positioned for through-the-cycle performance 1. Home Mortgage Disclosure Act data, U.S. Consumer Financial Protection Bureau 2. Affordable Housing Finance, 2022 Lenders Survey, February 2023 Slide 6 – Commercial Banking – decade-long, sustainable growth with strong returns 1. In the first quarter of 2020, the Merchant Services business was realigned from CCB to CIB. With the realignment, revenue is now reported across CCB, CIB and CB based primarily on client relationship. Financials from 2012 were revised to conform with the current presentation 2. In the fourth quarter of 2022, certain revenue from CIB markets products was reclassified from investment banking to payments. In the first quarter of 2020, the Merchant Services business was realigned from CCB to CIB. With the realignment, revenue is now reported across CCB, CIB and CB based primarily on client relationship. Financials from 2012 were revised to conform with the current presentation. Includes growth of $161mm that is also included in the Gross IB Revenue metric 3. Includes gross revenues earned by the Firm, that are subject to a revenue sharing arrangement with the CIB, for products sold to CB clients through the Investment Banking, Markets or Payments businesses. This includes revenues related to fixed income and equity markets products Slide 7 – Organic expansion in Middle Market Banking 1. Does not include Middle Market offices outside the U.S. 2. Circles indicate number of clients and prospects in each city Slide 11 – Disciplined, focused approach to Private Equity coverage 1. PitchBook Data, Inc. 2. Dealogic data for revenue reported between January 1, 2022 through December 31, 2022 in North America only, excluding Money Market, Short-term debt, and ECM Shelf Slide 13 – Robust growth in payments and liquidity 1. In the fourth quarter of 2022, certain revenue from CIB markets products was reclassified from investment banking to payments. In the first quarter of 2020, the Merchant Services business was realigned from CCB to CIB. With the realignment, revenue is now reported across CCB, CIB and CB based primarily on client relationship. Financials from 2017-2021 were revised to conform with the current presentation Notes for slides 5-7, 11, 13 23
  • 219.
    Slide 14 –High-quality loan portfolios 1. Refinitiv 2. Includes Corporate Client Banking Real Estate Slide 15 – Maintaining risk discipline – C&I 1. The Firm considers internal ratings equivalent to BB+/Ba1 or lower as non-investment grade 2. Portfolios based on sub-LOB are not regulatory definitions; totals may not sum due to rounding and are based on committed exposure 3. Peer average based on CB-equivalent CRE segments or wholesale portfolios at BAC, CMA, FITB, KEY, PNC, USB, WFC, which may not fully align with CB segmentation Slide 16 – Maintaining risk discipline – CRE 1. Loan to value (LTV) and debt service coverage (DSC) are weighted average calculations of multifamily Commercial Term Lending portfolio for FY 2022 2. Portfolios based on sub-LOB are not regulatory definitions; totals may not sum due to rounding and are based on committed exposure 3. Peer average based on CB-equivalent CRE segments or wholesale portfolios at BAC, CMA, FITB, KEY, PNC, USB, WFC, which may not fully align with CB segmentation Slide 17 – Strong operating efficiency while investing in our franchise 1. Adjusted expense represents total CB noninterest expense less CB legal expense of $1.7mm for FY 2021 and $5.1mm for FY 2022, respectively 2. Peer average based on CB-equivalent segments at BAC, CMA, FITB, KEY, PNC, TFC and WFC Notes for slides 14-17 24
  • 221.
    1 Asset & WealthManagement overview DIFFICULT TO REPLICATE 73% revenue recurring (10Y avg.) 95% retention of top senior talent 100+ year client relationships and track records MARKET-LEADING FRANCHISE $4.3T AUS1 90%+ JPMAM LT MF 10Y AUM > peer median2 25%+ healthy ROE and margin Complete Global Diversified At scale For footnoted information, refer to slide 18 KEY STRATEGIC PILLARS #1 and #2 active ETFs in the world are JPMAM3 5 M&A deals successfully closed since 2020 DRIVING INNOVATION & VALUE CREATION 4,500 dedicated technologists FORTRESS PRINCIPLES 2,000+ risk and controls professionals 1bp net charge-off rate (10Y avg.) ~$400mm investment research spend
  • 222.
    2 6% 7% 5% AWM is aconsistent growth franchise 29% 10Y range: 26%-37% Pretax margin1 26% 10Y range: 21%-33% ROE3 Increase YoY Decrease YoY GPB AM 0.01% 10Y range: 0.05%-(0.01)% Net charge-off rate3 2012 2013 2014 2015 2016 2017 2018 2019 2020 2021 2022 2.0 2.3 2.3 2.3 2.4 2.7 2.6 3.1 3.7 4.3 4.0 2012 2013 2014 2015 2016 2017 2018 2019 2020 2021 2022 10.0 11.5 12.2 12.3 12.2 13.2 13.4 13.6 14.2 17.0 17.7 2012 2013 2014 2015 2016 2017 2018 2019 2020 2021 2022 2.8 3.3 3.4 3.2 3.5 3.6 3.8 3.8 4.0 6.3 5.8 2.0 2.8 10.0 Market-leading franchise AWM 6% GPB 7% AM 5% 10Y CAGR AWM 8% GPB 10% AM 6% 10Y CAGR AWM 7% GPB 9% AM2 6% 10Y CAGR REVENUE1 ($B) PRETAX INCOME1 ($B) ASSETS UNDER SUPERVISION1 (AUS) ($T) 10-YEAR AVERAGE Note: Totals may not sum due to rounding For footnoted information, refer to slide 18
  • 223.
    3 Powered by twomarket-leading franchises 2012 2022 10Y Growth ⚫ AM ranking by AUM3 (#) ⚫ AM ranking by active AUM3 (#) ⚫ Equity ⚫ Fixed Income ⚫ Multi-Asset Solutions ⚫ Liquidity ⚫ U.S. LT assets4 ⚫ International LT assets4 ⚫ Global Funds LT assets ⚫ Global Institutional LT assets ⚫ AM advisor revenue productivity ($mm) #7 #4 $286 $376 $72 $443 $471 $255 $335 $391 $8.2 #5 #3 $618 $644 $240 $653 $974 $521 $742 $754 $12.9 2012 2022 10Y Growth ⚫ GPB ranking2 (#) ⚫ GPB Ultra High Net Worth ranking2 (#) ⚫ Loans ⚫ Deposits ⚫ Brokerage assets ⚫ Managed assets ⚫ U.S. LT assets ⚫ International LT assets ⚫ Clients with $100mm+ (#) ⚫ Managed accounts (#) ⚫ GPB advisor revenue productivity ($mm) #3 #1 $79 $141 $225 $212 $189 $61 1,346 0.3mm $1.8 #1 #1 $214 $233 $512 $559 $510 $107 3,153 1.3mm $3.0 2.1x 2.0x 1.7x 3.3x 1.5x 2.2x 1.6x ASSET & WEALTH MANAGEMENT 1.7x 2.6x 2.7x 1.8x 2.3x 4.0x 2.7x 2.3x 1.6x GLOBAL PRIVATE BANK1 (GPB) ASSET MANAGEMENT (AM) 2.2x 1.9x +2 - +2 +1 End of period (EOP), $B, unless noted Client asset flows ($B)1 $61 $49 $152 2012 2022 1Q23 $1.7 $3.4 $3.7 2012 2022 1Q23 $177 $372 $395 2012 2022 1Q23 Traditional assets ($T)1,5 Alternatives assets ($B)1,5 Market-leading franchise Note: Totals may not sum due to rounding For footnoted information, refer to slide 18
  • 224.
    4 $1.4 $9.4 2021 Volume- & revenue- related StructuralInvestments $1.8 $10.0 2023 Outlook $10.1 $2.2 Investments Structural Volume- & revenue- related 2022 $10.8 $0.0 $0.6 $0.4 $11.8 ($0.1) $0.2 $0.4 $12.3 Expense discipline and focused investing Investments TOTAL ADJUSTED EXPENSE ($B)1 Note: Totals may not sum due to rounding For footnoted information, refer to slide 18 Market-leading franchise Investments ⚫ Technology ⚫ Capabilities ⚫ Advisors Structural ⚫ Front office (3+ years of tenure) ⚫ Middle / back office ⚫ Support functions (e.g., risk, controls) ⚫ Technology (“run the bank” and efficiencies) Volume- & revenue-related ⚫ Performance-driven compensation ⚫ Fund distribution fees in AM business BREAKDOWN OF EXPENSE
  • 225.
    5 Technology is thefoundation of future growth Customer and client experiences Driving innovation & value creation Product and platform development Modernize technology Embed data and insights into everything Drive software development excellence Proactively defend against cyber threats Deliver best-in-class products, platforms and experiences Strengthen our development capabilities and infrastructure Unlock the power of data Protect the Firm and our customers strategic apps on Cloud (50% of infra. spend) Millions of research and data reports analyzed in seconds 50+ AI pilots across AWM 84% Python trained non-tech employees 5,400 hours saved through low-code solutions 131,000 30Y of proprietary research into Spectrum GPT traded on Morgan Money portal YTD1 (2x YoY) $1T+ +13% increase in fraud attempts YTD3 (after record 2022) 11,000 family offices / clients attended cyber teach-ins $31mm fraud prevented YTD1 rated CRM for Global Private Banks2 #1 reduction in time on custom performance reporting 99% For footnoted information, refer to slide 18
  • 226.
    6 We’ve remained focusedon our growth drivers Scaling Asset Management Building Alternatives Executing M&A 60+ year legacy and track records ~$100B 2Y fundraising #1 active LT fund flows (5Y)2 #1 active ETF flows (YTD & 3Y)3 Expanding Global Private Bank Powering U.S. Wealth Management 3,100+ GPB Client Advisors ~$1B asset flows / day7 83 countries with GPB client coverage ~500 new investors / day6 ~4,800 branches 100% ownership in China JV 2x revenue in the next 3Y ~$400B AUS, growing platform with diversified asset mix4 #3 active Asset Manager (AUM)1 5,000+ U.S. WM Client Advisors 300+ opportunities assessed5 Driving innovation & value creation For footnoted information, refer to slide 19 1 2 3 5 4
  • 227.
    7 2017 2022 18% Scaling AssetManagement Drive growth through Active ETFs, Separately Managed Accounts (SMAs) and Model Portfolios STRONG PERFORMANCE % JPMAM LT MF 10Y AUM > peer median1 Fixed Income Multi-Asset Solutions & Alternatives Total JPMAM Equity 2012 2022 72% 90% 2012 2022 79% 95% 2012 2022 66% 91% 2012 2022 65% 77% 2012 2022 LT AUM2 1 2012 2022 2012 2022 2012 2022 7% 6% 6% 4% 12% 8% 7% 6% DRIVING SCALE CAGR JPM $0.2 $54.1 2017 2022 196% #2 in AUM up from #20 in 20173 #1 in flows YTD & 3Y4 ETF Suite of the Year award (Active ETFs)5 SMAs and Model Portfolios Active ETFs FUTURE GROWTH CAGR CAGR Record YTD SMA flows surpassing FY 20226 10x model usage since 2017 200,000+ external advisors have access to JPMAM models AUM ($B) SMA AUM Industry Driving innovation & value creation For footnoted information, refer to slide 19
  • 228.
    8 Building Alternatives Leverage legacyof strong investment performance to innovate and grow GPB 3rd Party Liquid Alts Hedge Funds Private Credit Private Equity Other Real Estate & Infrastructure 2019 1Q23 $265 $395 +49% AUS, $B7,8 10+ Years 30+ Years • Commercial Mortgage Loans (’61) • Real Estate (’70) • Private Equity (’80) • Hedge Funds (’92) • Liquid Alternatives (’98) • Infrastructure (’06) • Transportation (’10) • GPB Vintage Funds (’11) <10 Years • Opportunistic Private Credit (’17) • Timberland (acquired ’21) • Growth Equity (’21) 18% Net IRR NEW Private Markets for retail investors $32B U.S. Core fund NAV2 NEW Non-traded REIT #1 open-end U.S. Core fund1 200+ advisory board seats 14% net IRR5 NEW Venture Capital 20+ underlying funds in Buyout, Healthcare, Impact & Credit4 14% net IRR6 NEW Opp. Credit Fund II NEW Sustainable Growth Equity team NEW Life Sciences team 4x AUM 3Y growth ~$1B commitments made since inception REAL ESTATE (50Y+) PRIVATE EQUITY (40Y+) INFRASTRUCTURE (10Y+) GPB VINTAGE FUNDS (10Y+) GROWTH EQUITY (2Y+) OPPORTUNISTIC PRIVATE CREDIT (5Y+) 8% Public Market Equivalent3 LEGACY AND INNOVATION GROWING, DIVERSIFIED ASSET MIX $34B NAV2 ~1,000 underlying assets2 NEW Access vehicles for HNW+ individuals 2 Driving innovation & value creation For footnoted information, refer to slide 20 Growth
  • 229.
    9 Executing M&A Focus onintegration for synergies and solutions Tax-smart investment strategies at scale Timberland investing and management Custom, values-based metrics / port. diagnostics Cloud-based share plan software Onshore China asset manager $1.5B aligned to OI insights and client reporting 1mm+ in plan participants5 from over 100 countries 1,000+ onsite company visits, annually 9x AUM since acquisition1 13% gross total return (1Y)2 6 divest restrictions on 1.2k+ accounts ($400mm4) 42% growth in plan participants since acquisition6 $23B+ in client assets 5 Tax-Smart strategies $5.5B in AUM; recent addition of 250k+ acres3 8 model portfolio providers 122mm+ tCO2e above-ground stored carbon SI Resource Center to educate advisors / deliver insights $185B in assets under admin.5 64mm+ clients across China 3 Driving innovation & value creation For footnoted information, refer to slide 20
  • 230.
    10 JPMC WORKPLACE Powering U.S.Wealth Management Our recent acquisitions will help power next-generation solutions JPMC CONNECTWEALTH AWM CCB AWM CCB CB CIB Employee banking Retirement Share plan Financial wellness Comprehensive workplace solution for public & private companies and employees Monitor sector exposures and wash sales Account aggregation Values-aligned investments Integrated digital portal Cross-asset class tax-loss harvesting and account customization for clients J.P. Morgan SMA platform + + WEALTH MANAGEMENT SOLUTIONS Trusts & estates Insurance & annuities Brokerage investments Share plan Deposits & custody SBL & custom lending Mortgages Managed investments Alternatives Fund finance 4 + + Driving innovation & value creation
  • 231.
    11 2019 2022 2.3x Expanding GlobalPrivate Bank Continue the momentum with high-quality new hires and world-class training 2019 2022 4.5x Training hours per GPB new hire TRAINING Net new hires, GPB and U.S. WM client advisors1 HIRING U.S. WM GPB 2019 2022 2.1x CONTRIBUTION New GPB advisor revenue as % of GPB revenue1,2 + = 5 Driving innovation & value creation For footnoted information, refer to slide 20
  • 232.
    12 EOP balances ($B)8 EOPbalances ($B)2 Disciplined lending, deposits and money market funds EOP balances ($B)2 Net charge-off / (recovery) rate (%)3 Vast majority of net deposit migration stays within the firm5 #1 in Global Institutional Money Market Funds AUM6 81% of clients also utilize other solutions4 Fortress principles 97% of loans collateralized #1 Jumbo mortgage provider1 LENDING DEPOSITS $129 $146 $158 $187 $218 $214 $211 2017 2018 2019 2020 2021 2022 1Q23 $141 $133 $143 $199 $282 $233 $226 2017 2018 2019 2020 2021 2022 1Q23 MONEY MARKET FUNDS $370 $488 $563 $688 $754 $680 $797 2017 2018 2019 2020 2021 2022 1Q23 77%+ increase in searches for J.P. Morgan Global Liquidity7 0.01 0.00 0.00 0.01 (0.01) 0.02 0.00 For footnoted information, refer to slide 21
  • 233.
    13 EMPOWERING CLIENTS THROUGHCHALLENGES Helping clients navigate challenging times Fortress principles $246B $536B 2006 2009 +118% $233B $439B 2011 2014 +88% $271B $375B 2019 2021 +38% 2008 crisis CAPTURING MONEY-IN-MOTION DURING PIVOTAL MARKET EVENTS Rebound post-GFC Low rates Money market funds1 LT active funds2 Income strategies AUM Growth 40k new GPB accounts opened in 10 weeks7 $136B Liquidity net flows YTD4 Insights +2 points increase in OSAT in one quarter6 Fiduciary mindset Impact 22mm portfolio positions analyzed daily 3.8mm Guide to the Markets views YTD4 48k Digital Portfolio Insight analyses YTD5 203 4/5-star funds 600+ investment strategies3 2x Eye on the Market engagement YTD4 For footnoted information, refer to slide 21
  • 234.
    14 JPMC platform deliversunmatched value through cross-LOB partnership AWM CCB CIB Portfolio Companies Co-location Payments Securities Services Cards Data Analytics Branches Corp Brand MLTs Difficult to replicate 23 Wall #1 Corporate and Investment Bank2 #1 Fortune’s Most Admired Bank4 #1 Retail Bank1 #1 Commercial Bank3 POWER OF ONE FIRM CB Local cross-LOB leadership 23 WALL 50 Market Leadership Teams (MLTs) 700+ senior leader members Deliver the Firm’s breadth & expertise locally to our clients, our employees, and in the communities where we live and do business Provide institutional access to the Firm’s deal flow, balance sheet, intellectual capital, & co-invest opportunities with world’s largest families 16+ years of avg. tenure at JPM Families with total net worth >$1B 1,000+ families & principals globally $5T+ in private family capital $250mm+ transaction size 1st annual survey with participation from 77 principals across the globe ($5B avg. net worth), with assets in 18 different industries SCOs 43 Senior Country Officers (SCOs) U.S. International For footnoted information, refer to slide 21
  • 235.
    15 2013 2014 20152016 2017 2018 2019 2020 2021 2022 1Q23 Fixed Income Equity Multi-Asset Alternatives Liquidity Brokerage Custody Deposits Maximizing our strengths to deliver value to clients and shareholders ≥$0 <$0 Asset Class / Product Channel GPB + U.S. WM Retail Institutional Region U.S. LatAm EMEA Asia AUM AUS Assets Assets Assets = AUS + AUM 19th consecutive year of net new inflows JPMC TOTAL CLIENT ASSET FLOWS ($B)1 (LT AUM + Liquidity + AUS + U.S. WM AUS + CPC Deposits) (2Q18-1Q23) Publicly traded peers only GS5 $0.7 #5 BLK2 $1.8 #1 $1.3 #2 MS3 SCHW4 $0.8 #4 #3 JPMC1 $1.2 5Y TOTAL CLIENT ASSET FLOWS ($T) Diversified, leading businesses to deliver strong financial results MARKET-LEADING FRANCHISE Constantly investing & innovating for our clients and shareholders DRIVING INNOVATION & VALUE CREATION Resilience through diligent risk management and controls FORTRESS PRINCIPLES Mutual strategic benefits of being part of the JPMC ecosystem DIFFICULT TO REPLICATE For footnoted information, refer to slide 21
  • 236.
    16 Exceeding expectations andachieving targets Meeting targets Results range1 3- to 5-year targets (+/-), as of 2020 5% 25%+ 25%+ 4% REVENUE GROWTH PRETAX MARGIN ROE LT AUM FLOWS ✓ ✓  5% 8% 2% 2021 2022 2020 ✓ ✓ ✓ 5% 19% 5% 2021 2022 2020 ✓ ✓ ✓ 28% 37% 33% 2021 2022 2020 ✓ ✓ ✓ 28% 33% 25% 2021 2022 2020 For footnoted information, refer to slide 22
  • 237.
    17 Unparalleled strength ofJPMorgan Chase JPMC CCB CIB AWM #1 IB fees2 #1 Markets revenue3 #1 Treasury Services revenue4 #1 Private Bank7 #1 LT active fund flows (5Y)8 #1 U.S. retail deposits #1 U.S. credit card issuer1 #1 Primary business bank #1 Multifamily lender5 #1 Middle Market bookrunner6 FORTUNE’S TOP 5 MOST ADMIRED COMPANIES IN THE WORLD CB For footnoted information, refer to slide 22
  • 238.
    18 Notes on slides1-5 Slide 1 – Asset & Wealth Management overview 1. Total AUS as of March 31, 2023. AUS = Assets Under Supervision. AUS also referred to as client assets 2. All quartile rankings, the assigned peer categories and the asset values used to derive this analysis are sourced from the fund ranking providers. Quartile rankings are done on the net-of-fee absolute return of each fund. The data providers re-dominate the asset values into U.S. dollars. This % of AUM is based on fund performance and associated peer rankings at the share class level for U.S.-domiciled funds, at a “primary share class” level to represent the quartile ranking of U.K., Luxembourg and Hong Kong funds, and at the fund level for all other funds. The “primary share class” is defined as C share class for European funds and Acc share class for Hong Kong and Taiwan funds. In case the share classes defined are not available, the oldest share class is used as the primary share class. The performance data could have been different if all share classes would have been included. Past performance is not indicative of future results. Effective September 2021, the Firm has changed the peer group ranking source from Lipper to Morningstar for U.S.-domiciled funds (except for Municipal and Investor Funds) and Taiwan-domiciled funds, to better align these funds to the providers and peer groups it believes most appropriately reflects their competitive positioning. This change may positively or adversely impact, substantially in some cases, the quartile rankings for one or more of these funds as compared with how they would have been ranked by Lipper for this reporting period or future reporting periods. The source for determining the rankings for all other funds remains the same. The classifications in terms of product suites and product engines shown are J.P. Morgan’s own and are based on internal investment management structures 3. Source: Bloomberg Slide 2 – AWM is a consistent growth franchise 1. In the fourth quarter of 2020, the Firm realigned certain Wealth Management clients from Asset & Wealth Management to Consumer & Community Banking. Prior-period amounts have been revised to conform with the current presentation. Historical revenue revised as a result of the adoption of the new accounting guidance for revenue recognition, effective January 1, 2018 2. Global Funds and Global Institutional client segments 3. In the fourth quarter of 2020, the Firm realigned certain Wealth Management clients from Asset & Wealth Management to Consumer & Community Banking. Before 2018, amounts have not been revised to conform with the current presentation Slide 3 – Powered by two market-leading franchises 1. In the fourth quarter of 2020, the Firm realigned certain Wealth Management clients from Asset & Wealth Management to Consumer & Community Banking. Prior-period amounts have been revised to conform with the current presentation, unless otherwise noted 2. Source: Euromoney 3. Source: Public filings, company websites and press releases. Active / passive split based on most recently available data 4. Global Funds and Global Institutional AUM 5. Client assets = Traditional Assets + Alternatives Assets + Deposits Slide 4 – Expense discipline and focused investing 1. Adjusted expense is a non-GAAP financial measure, which represents noninterest expense excluding legal expense of $113mm, $25mm, and $41mm for the full-year 2021, 2022, and for the three months ended in March 31, 2023, respectively Slide 5 – Technology is the foundation of future growth 1. Data as of April 30, 2023 2. Source: Financial Times 3. Data as of April 30, 2023, YoY growth over same period in 2022
  • 239.
    19 Notes on slides6-7 Slide 6 – We’ve remained focused on our growth drivers 1. Source: Public filings, company websites and press releases. Active / passive split based on most recently available data 2. Source: ISS Market Intelligence Simfund 3. Source: Morningstar. YTD as of April 30, 2023 4. As of March 31, 2023 5. Includes evaluation of potential M&A and Strategic Investment opportunities since January 2020 6. Based on first-time investors and number of business days from January 1, 2023 to March 31, 2023 7. Based on net asset flows and number of business days from January 1, 2023 to March 31, 2023 Slide 7 – Scaling Asset Management 1. All quartile rankings, the assigned peer categories and the asset values used to derive this analysis are sourced from the fund ranking providers. Quartile rankings are done on the net-of-fee absolute return of each fund. The data providers re-dominate the asset values into U.S. dollars. This % of AUM is based on fund performance and associated peer rankings at the share class level for U.S.-domiciled funds, at a “primary share class” level to represent the quartile ranking of U.K., Luxembourg and Hong Kong funds, and at the fund level for all other funds. The “primary share class” is defined as C share class for European funds and Acc share class for Hong Kong and Taiwan funds. In case the share classes defined are not available, the oldest share class is used as the primary share class. The performance data could have been different if all share classes would have been included. Past performance is not indicative of future results. Effective September 2021, the Firm has changed the peer group ranking source from Lipper to Morningstar for U.S.-domiciled funds (except for Municipal and Investor Funds) and Taiwan-domiciled funds, to better align these funds to the providers and peer groups it believes most appropriately reflects their competitive positioning. This change may positively or adversely impact, substantially in some cases, the quartile rankings for one or more of these funds as compared with how they would have been ranked by Lipper for this reporting period or future reporting periods. The source for determining the rankings for all other funds remains the same. The classifications in terms of product suites and product engines shown are J.P. Morgan’s own and are based on internal investment management structures 2. Asset classes shown are based on internal investment management structures, which may differ from public reporting. Industry CAGR sourced from McKinsey Performance Lens 3. Source: Morningstar 4. Source: Morningstar. YTD as of April 30, 2023 5. Source: With Intelligence 6. Data as of April 30, 2023
  • 240.
    20 Notes on slides8-11 Slide 8 – Building Alternatives 1. Source: ODCE Core Competitor Snapshot, 4Q22. Rank based on gross asset value 2. As of March 31, 2023 3. Performance as of December 31, 2022. Net performance is net of underlying fees and expenses, net of Advisor management and Advisor incentive fees. Net performance represents PEG fund level cash flows and valuations, as experienced by the underlying investors in aggregate, and are inclusive of underlying fees and expenses as well as Advisor management and incentive fees. Based on Global Private Equity vintages launched 2014-2021. Public Market Equivalent is MSCI World 4. As of January 31, 2023 5. Gross Internal Rate of Return (“IRR”) is calculated on cash flows between underlying fund investments and the applicable Vintage fund and is net of Underlying Funds’ investment fees and expenses, but gross of the applicable Vintage fund’s fees and expenses. Net IRR is calculated on aggregate cash flows between Vintage fund investors and the applicable Vintage fund and is net of the applicable Vintage fund’s fees and expenses (excluding origination fees). Gross and net IRRs are not necessarily representative of an individual investor’s experience primarily due to tiered management fees, the exclusion of origination fees paid by investors from the calculation of net IRR and cash flows being measured at the applicable Vintage fund level and not the individual investor level. To the extent the net IRRs reflected the payment of origination fees and management fees applicable to certain investors such net IRRs would be lower. Based on Offshore vintages. Figures as of June 30, 2022 6. Performance as September 30, 2022. Based on Fund I performance calculated from date of first capital call August 16, 2019 to September 30, 2022 and calculation includes the use of subscription line financing. From 30 June 2022 Fund IRR is calculated as per U.S. GAAP defined approach. Net calculations include costs, financing fees, and carried interest accrual 7. In the fourth quarter of 2020, the Firm realigned certain Wealth Management clients from Asset & Wealth Management to Consumer & Community Banking. Prior-period amounts have been revised to conform with the current presentation 8. Prior-period amounts have been restated to include changes in product categorization Slide 9 – Executing M&A 1. Acquisition announced on December 2020; data as of April 30, 2023 2. Time-weighted total return based on all discretionary funds and separate accounts managed by Campbell Global as of December 31, 2022 3. Announced February 2023 4. Data as of February 1, 2023 5. Data as of April 30, 2023 6. Growth through April 30, 2023. Acquired March 2022 Slide 11 – Expanding Global Private Bank 1. In the fourth quarter of 2020, the Firm realigned certain Wealth Management clients from Asset & Wealth Management to Consumer & Community Banking. Prior-period amounts have been revised to conform with the current presentation 2. New GPB advisor revenue as % of GPB revenue is the total revenue from new GPB advisors over total GPB revenue
  • 241.
    21 Notes on slides12-15 Slide 12 – Disciplined lending, deposits and money market funds 1. #1 mortgage lender across all home values ($1mm, $3mm, $5mm, $10mm+) for U.S. households with at least $10mm in net worth; source: KYC, Suitability, Lending, Wealth-X, FactSet, PitchBook, CoreLogic 2. In the fourth quarter of 2020, the Firm realigned certain Wealth Management clients from Asset & Wealth Management to Consumer & Community Banking. Prior-period amounts have been revised to conform with the current presentation 3. In the fourth quarter of 2020, the Firm realigned certain Wealth Management clients from Asset & Wealth Management to Consumer & Community Banking. Before 2018, amounts have not been revised to conform with the current presentation 4. Clients with account balance of $10k+; other solutions include IM, T&E, Lending, Mortgage, Brokerage/Custody, IRS Annuity 5. Excluding tax payments in 2021-2022 6. Source: iMoneyNet as of May 12, 2023 7. During peak volatility in March 2023 8. Includes assets managed on behalf of other product teams Slide 13 – Helping clients navigate challenging times 1. Source: iMoneyNet 2. Source: ISS Market Intelligence Simfund 3. Asset Management strategies 4. Data as of May 19, 2023 5. Data as of April 30, 2023 6. Survey data as of November 30, 2022 and March 31, 2023 7. Includes accounts opened from March to May 2023 Slide 14 – JPMC platform delivers unmatched value through cross-LOB partnership 1. See slide 17, footnote 1 2. See slide 17, footnotes 2-4 3. See slide 17, footnotes 5-6 4. JPMorgan Chase ranked #5 overall in most admired companies in the world, and the only bank (financial institution) in the top five Slide 15 – Maximizing our strengths to deliver value to clients and shareholders 1. Includes Asset & Wealth Management client assets, U.S. Wealth Management investments and Chase Private Client deposits. In the fourth quarter of 2020, the Firm realigned certain Wealth Management clients from Asset & Wealth Management to Consumer & Community Banking. Prior-period amounts have been revised to conform with the current presentation 2. Total AUM net flows 3. Investment Management total net flows, Wealth Management fee-based asset flows 2018 and Wealth Management net new assets 2019-1Q23. Excludes impact from acquisitions of Solium, E-Trade, Eaton Vance and Cook Street 4. Investor Services net new assets. Excludes impact from asset consolidation due to acquisitions of TD Ameritrade and USAA’s Investment Management Company 5. Firmwide total AUS net flows. Excludes impacts from acquisitions of NNIP, Verus, S&P Investment Advisory Services, United Capital, and Rocaton, and divestiture of Australia business
  • 242.
    22 Notes on slides16-17 Slide 16 – Exceeding expectations and achieving targets 1. In the fourth quarter of 2020, the Firm realigned certain Wealth Management clients from Asset & Wealth Management to Consumer & Community Banking. Prior-period amounts have been revised to conform with the current presentation Slide 17 – Unparalleled strength of JPMorgan Chase 1. Based on 2022 sales volume and loans outstanding disclosures by peers (American Express Company (AXP), Bank of America Corporation, Capital One Financial Corporation, Citigroup Inc. and Discover Financial Services) and JPMorgan Chase estimates. Sales volume excludes private label and Commercial Card. AXP reflects the U.S. Consumer segment and JPMorgan Chase estimates for AXP’s U.S. small business sales. Loans outstanding exclude private label, AXP Charge Card, Citi Retail Cards, and Commercial Card 2. Source: Dealogic as of January 2, 2023 3. Source: Coalition Greenwich Competitor Analytics (preliminary for FY22). Market share is based on JPMorgan Chase’s internal business structure and revenue. Ranks are based on Coalition Index Banks for Markets 4. Source: Coalition Greenwich Competitor Analytics (preliminary for FY22). Reflects global firmwide Treasury Services business (CIB and CB). Market share is based on JPMorgan Chase’s internal business structure, footprint and revenues. Ranks are based on Coalition Index Banks for Treasury Services 5. Source: S&P Global Market Intelligence as of December 31, 2022 6. Source: Refinitiv LPC, FY22 7. Source: Euromoney 8. Source: ISS Market Intelligence Simfund