Download to read offline


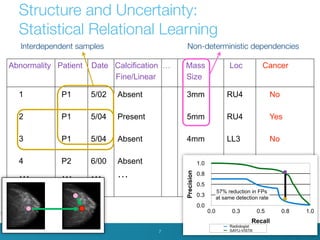


The document outlines the mission and research focus of the Declarative Languages and Artificial Intelligence Research Group at KU Leuven, emphasizing complex data handling, machine learning, and data mining techniques. It also discusses the application of these technologies in various domains, such as bioinformatics and clinical genetics, while illustrating specific research methodologies like probabilistic programming and network-based approaches. Additionally, there are mentions of various projects on energy optimization and sports analytics, showcasing the practical implications of their research.