
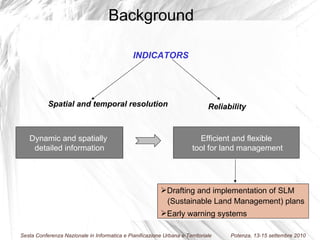
Download to read offline
![The MLI considers that persistent mechanical interventions strongly alter soil chemical-physical properties since repeated passes causes a stratum of compacted soil having a low permeability (ploughsole formation). It limits the root expansion and water penetration, and in the worse situation creates asphyxiation conditions that bring on vegetation cover degradation and reduction in crop production Non compacted soil Compacted soil Methods MLI - Level of agricultural mechanization [Duiker, 2004]](https://image.slidesharecdn.com/2-imbrendapresentationinput2010-100920043704-phpapp01/85/Gli-indicatori-per-la-stima-della-vulnerabilita-alla-land-degradation-da-fattori-antropici-strumenti-per-una-efficace-pianificazione-territoriale-di-Vito-Imbrenda-Maria-Grazia-D-Emilio-Maria-Lanfredi-Maria-Ragosta-Tiziana-Simoniello-12-320.jpg)
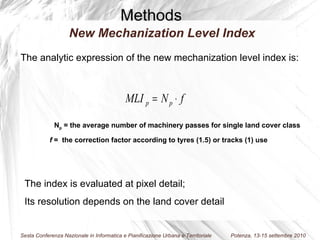
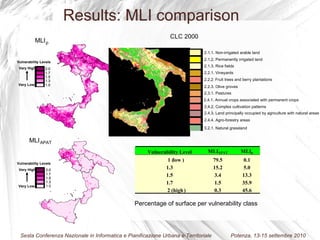
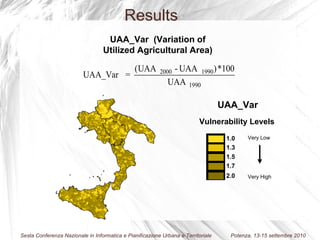
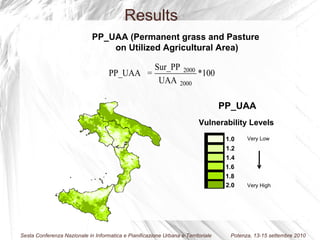
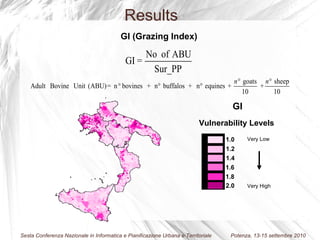
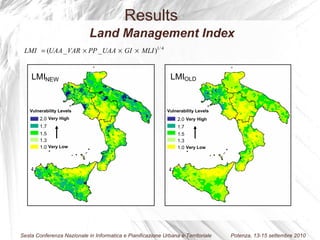
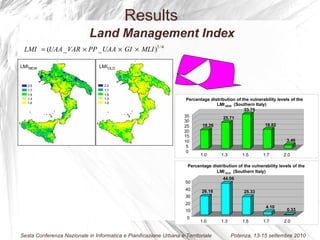
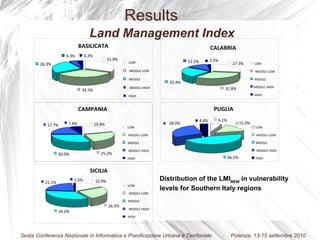
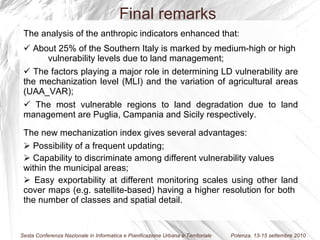

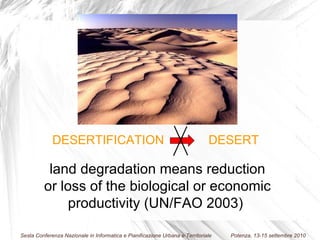
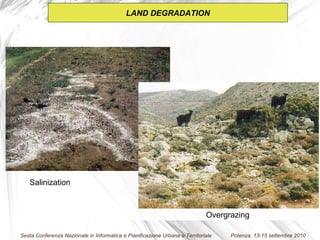
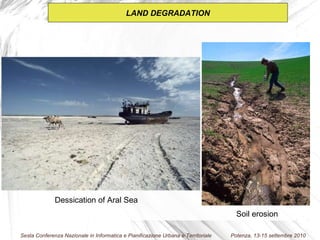
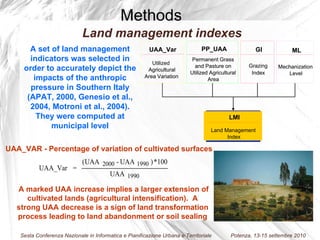
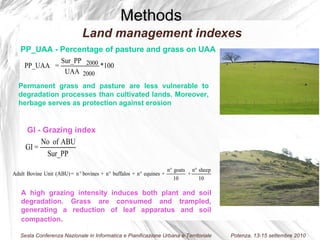
The document discusses indicators for estimating vulnerability to anthropogenic land degradation in order to effectively plan territorial development. It presents a set of land management indicators calculated at the municipal level, including utilized agricultural area variation, percentage of pasture/grassland, grazing index, and a new mechanization level index. Analysis shows about 25% of southern Italy has medium-high or high vulnerability levels due to land management factors, with the most vulnerable regions being Puglia, Campania, and Sicily.


