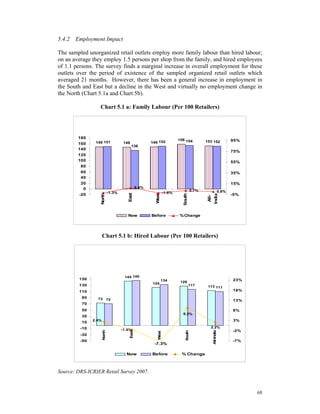
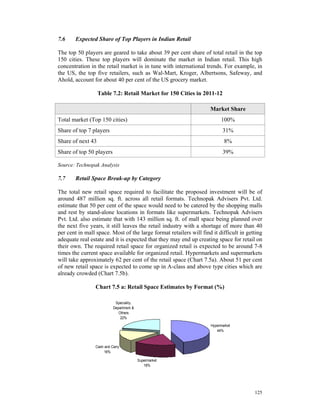
This document provides an overview and summary of a study on the impact of organized retailing on the unorganized sector in India.
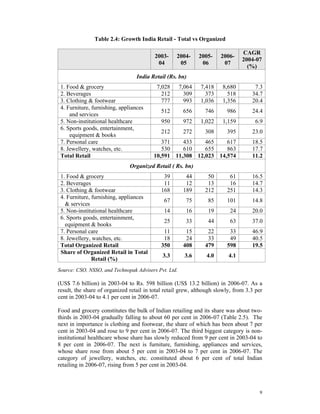
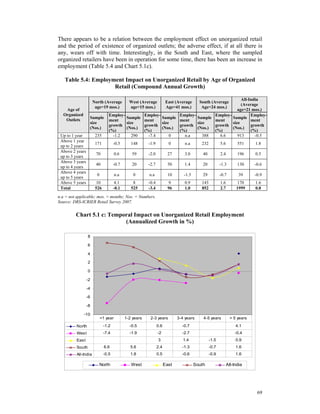
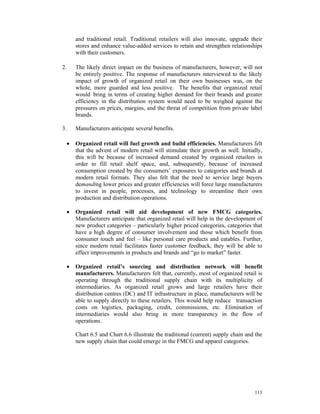
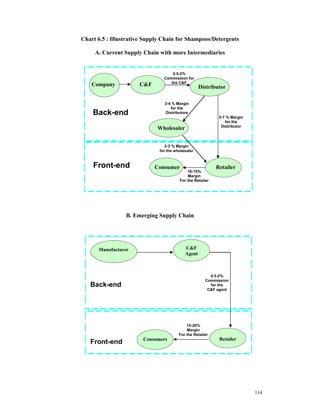
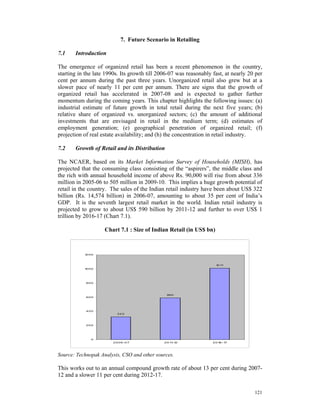
The study estimates that total retail business in India will grow at 13% annually from $322 billion in 2006-07 to $590 billion in 2011-12. It finds that both unorganized and organized retail are expected to grow substantially and coexist, with unorganized retail growing at 10% annually and organized retail growing much faster at 45-50% annually.
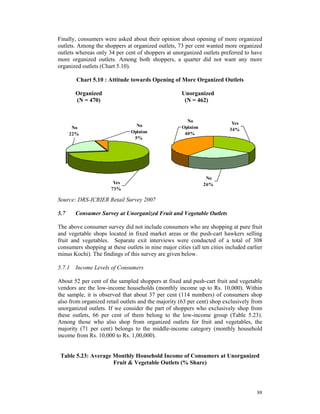
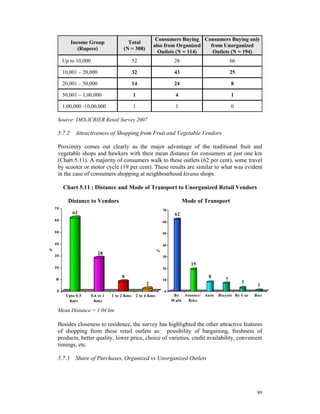
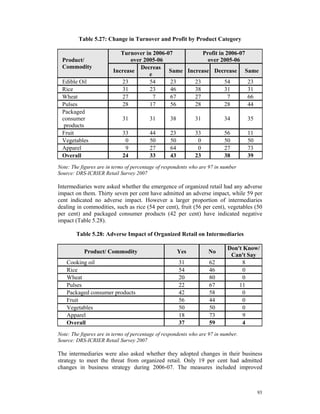
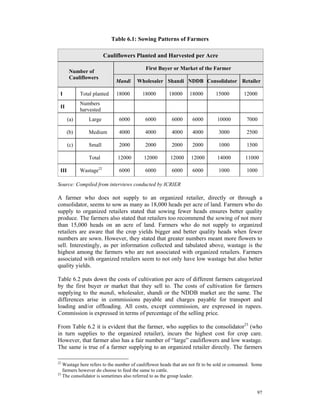
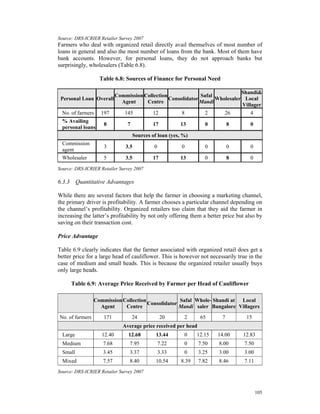
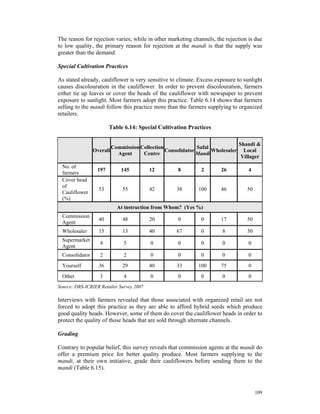
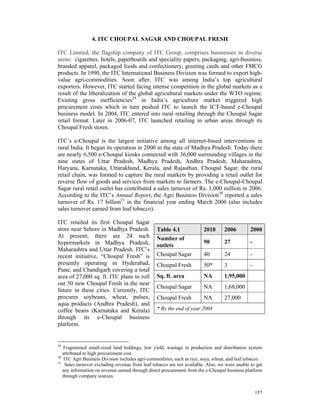
One surprising finding is that low-income consumers save more through shopping at organized retail outlets due to targeted discount shopping. Farmers also benefit from direct sales to organized retailers, realizing higher prices and profits than selling to intermediaries

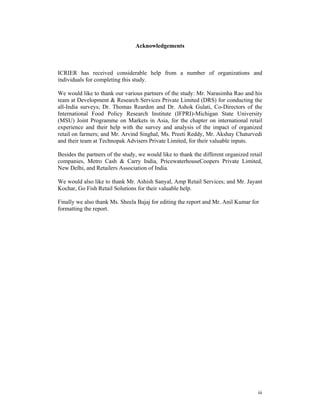
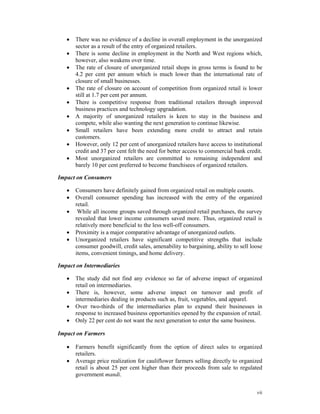
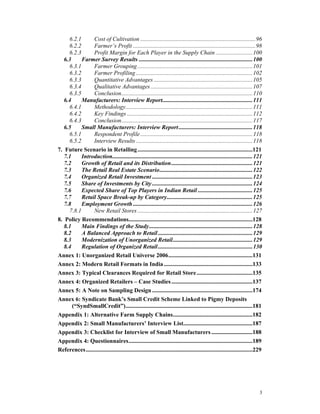
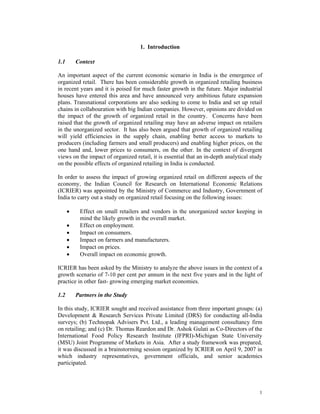
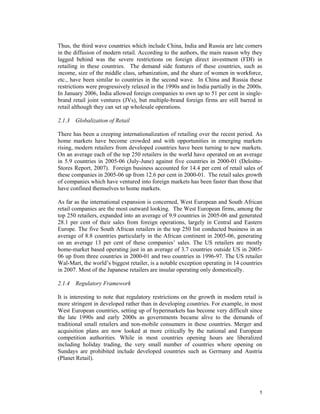
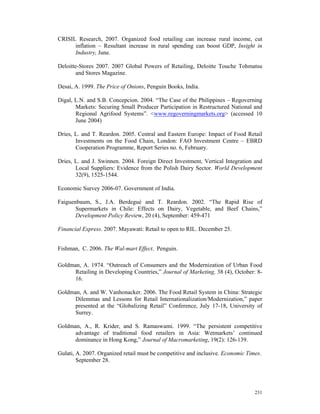
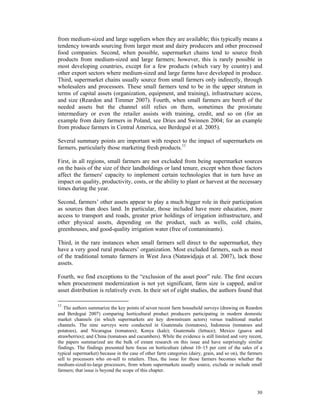
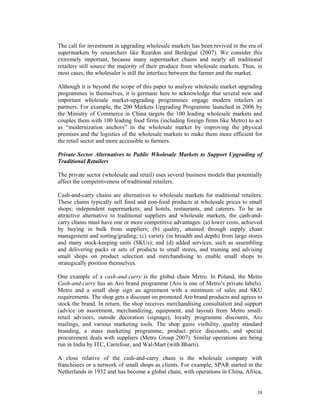
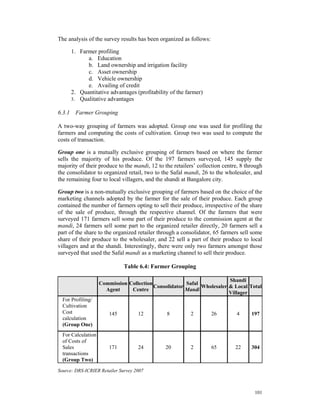
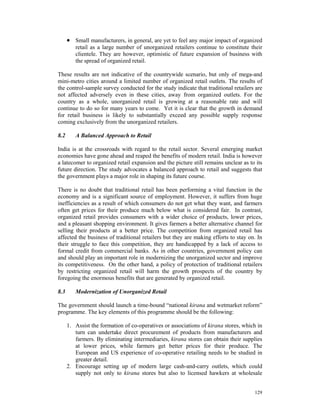
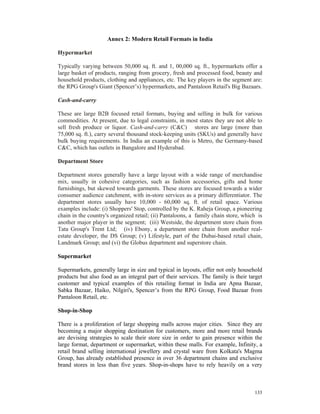
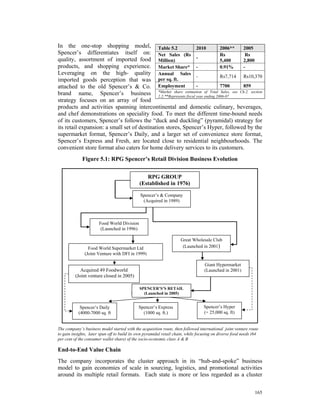
![began recovering in the 2000s. Matahari doubled its sales between 2002 and 2006,
becoming a billion-dollar chain by 2006. The share of foreign chains (one European
and one Hong Kong) in the top-seven chains is now 40 per cent. However, because
the sector is still fragmented, foreign chains do not have more than a 20 per cent
share, similar to the situation in China.
FDI combined with financing from either the competitive or leading local investors
led to the rapid consolidation and multinationalization of the supermarket sectors in
developing countries over the past decade, with the trend again correlated with the
waves. The rapid consolidation of the sector in those regions mirrors what is
occurring in the United States and Europe. For example, in Latin America the top-five
chains per country have 65 per cent of the supermarket sector compared with 50 per
cent in the United States (although Kinsey [2004] reports that is rapidly increasing)
and 72 per cent in France.
3.3.3 Domestic Policies Concerning Retail
Domestic regulations of the commerce sector can either promote supermarket
diffusion or hinder it. The overall body of regulations can push and pull both ways,
with promotion or hindrance winning out in different phases of supermarket diffusion.
The authors’ perception is that the regulatory balance appears to favour supermarket
diffusion in most developing countries today.
Modern Retail Diffusion Encouraged by Domestic Policies
Several sets of policies are promoting supermarkets and hindering traditional retail in
developing countries today.
Developing countries have a tradition of establishing policies promoting the
development of supermarkets. In the 1960s and 1970s in Latin America, Malaysia,
and Hong Kong, among other countries, governments were keen to promote the tiny
supermarket sectors in the name of food sector modernization. Promotion
programmes were based on the previously described perception of the traditional
retail sector as weak and inefficient, a drag on increasing overall competitiveness and
efficiency. Most of these promotion programmes were artificial and not yet consonant
with overall economic transformation nor fed by private sector investment; thus, few
succeeded.
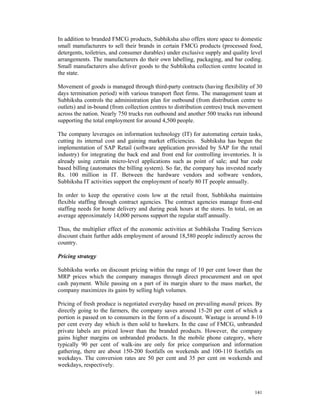
In the 1990s and 2000s, many governments directly supported supermarket
development as part of modernization policies, although at the same time those
governments had policies limiting or regulating supermarkets and supporting
traditional retailers (Goldman et al. 1999). An example is tax exoneration to
supermarkets setting up in municipalities in Russia (Dries and Reardon 2005) or
South Korea (Lee and Reardon 2005). Some governments have even directly invested
in modern retail explicitly to modernize the food distribution sector as well as
generate revenue for government. For example, in China the semi-public chains
operate as profit-oriented enterprises and compete with private firms. State-sponsored
companies get easy access to credit, cheap real estate, and other benefits (Hu et al.
2004).
22](https://image.slidesharecdn.com/unorganizedretailinindia-120106025607-phpapp01/85/Unorganized-retail-in-india-37-320.jpg)
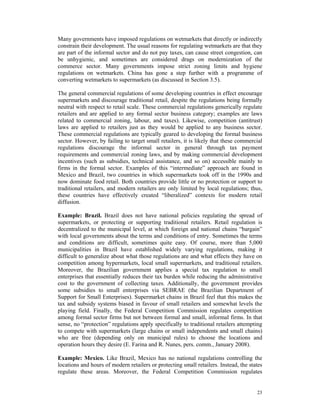
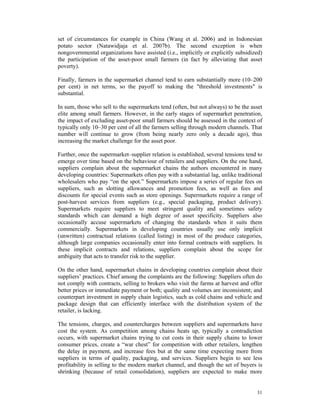
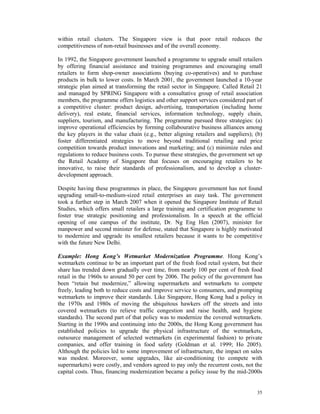
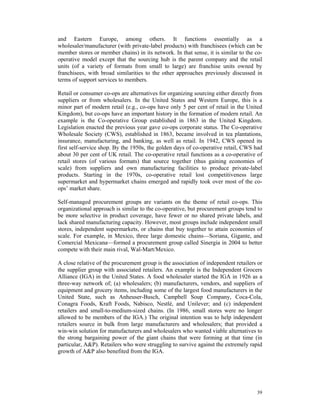
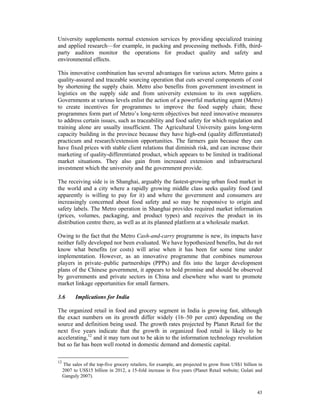
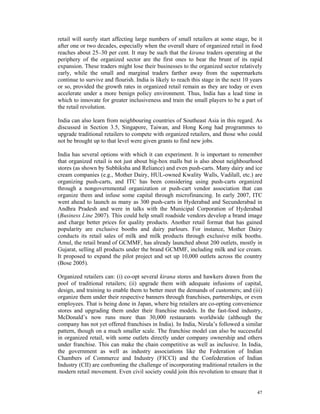

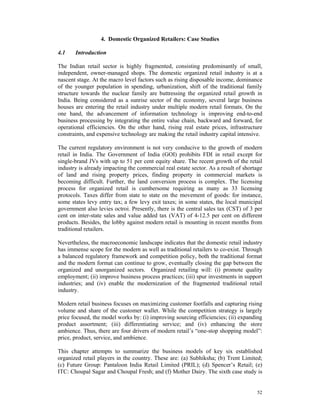

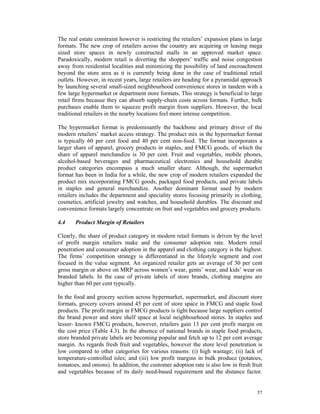
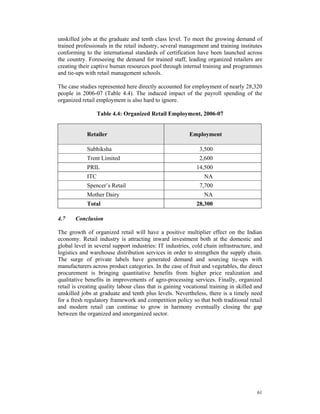

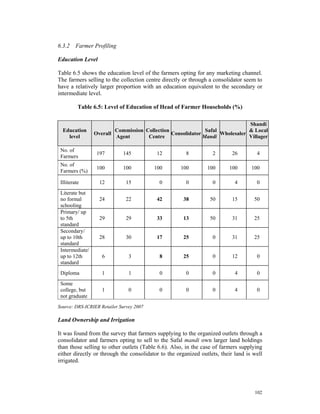
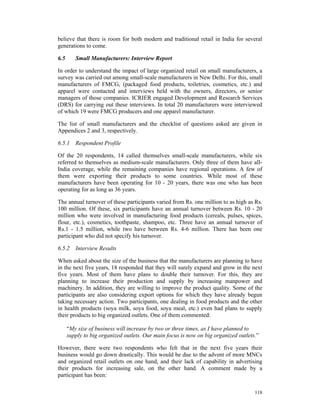
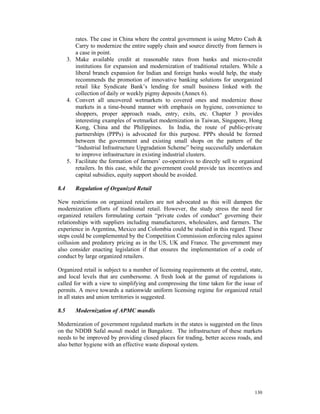
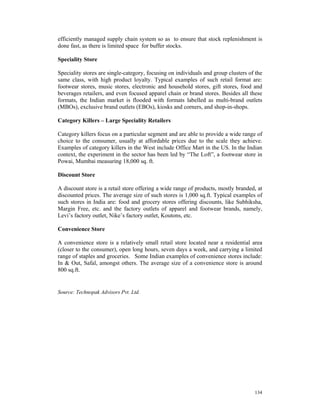
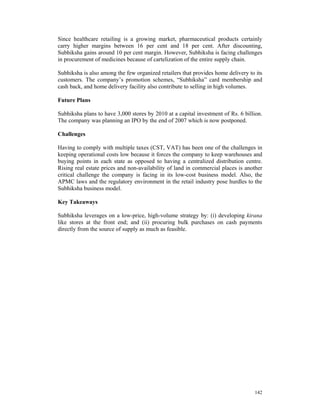
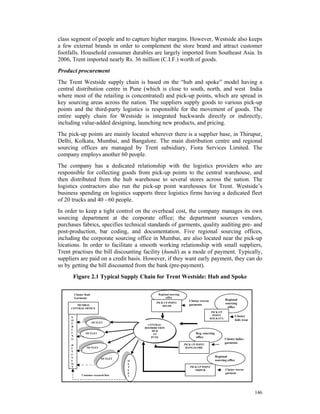
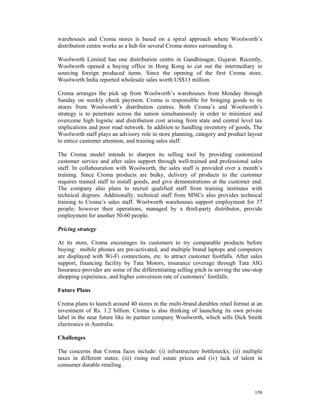
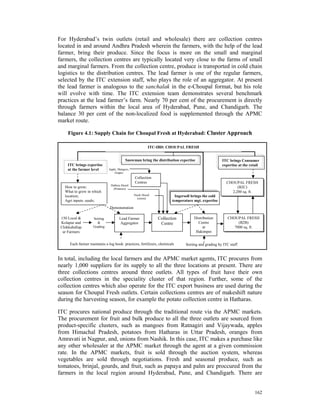
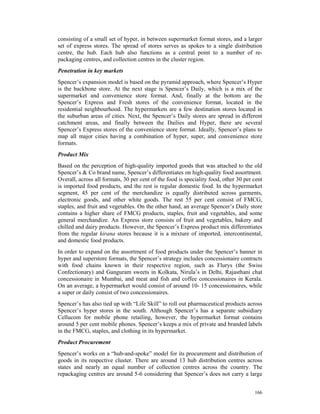
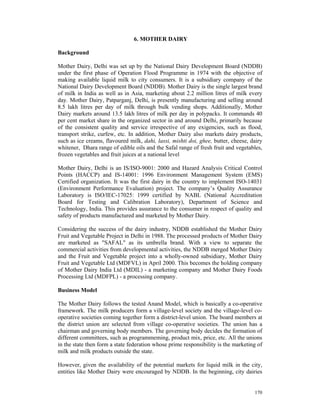
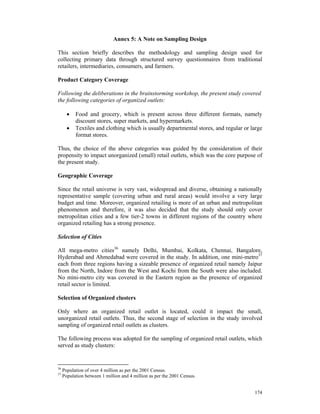
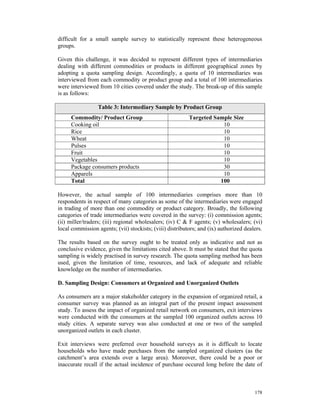
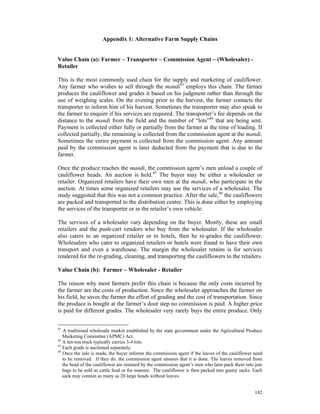
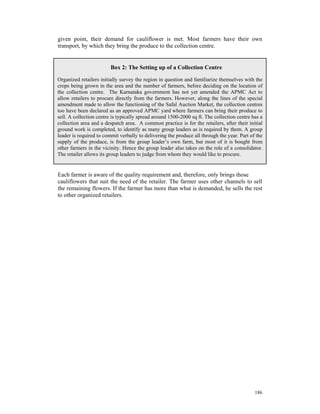
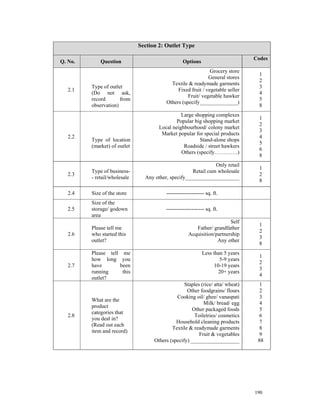
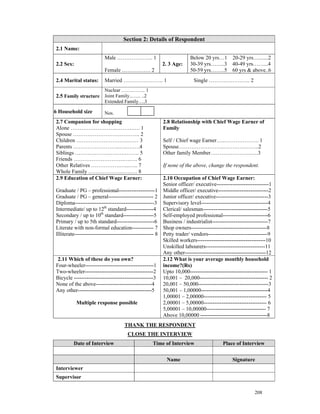
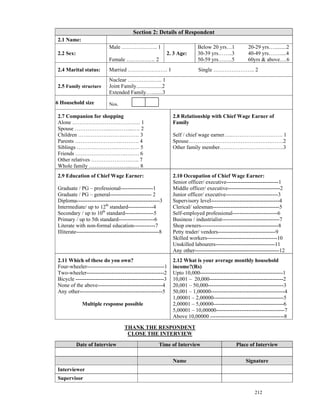
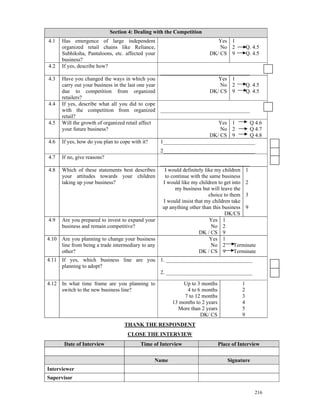
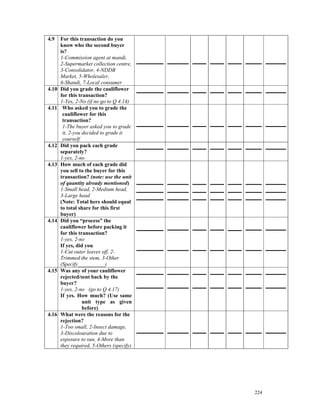
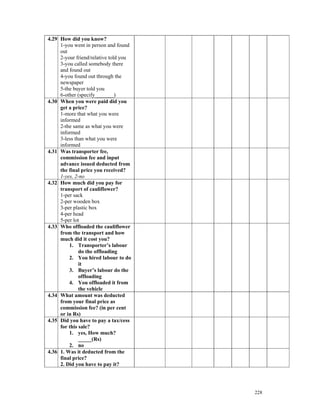
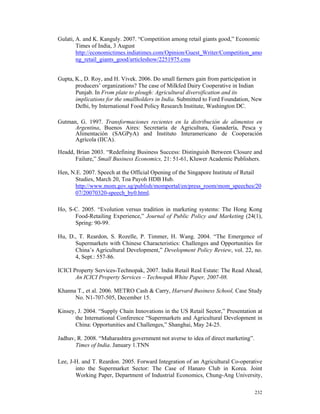
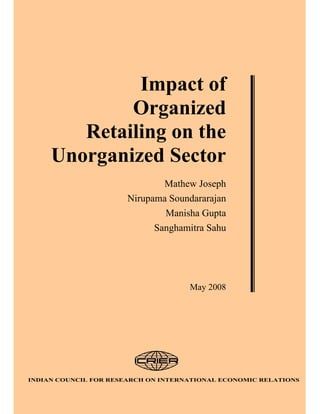
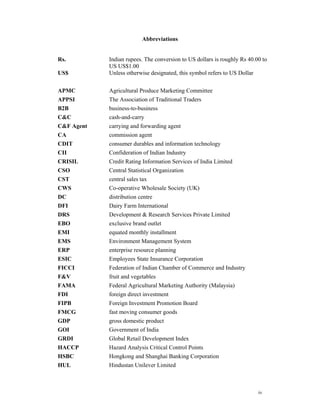
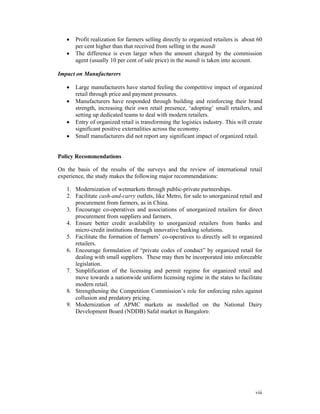
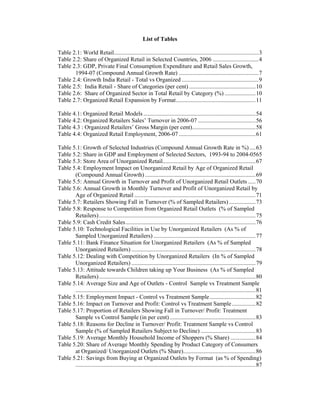
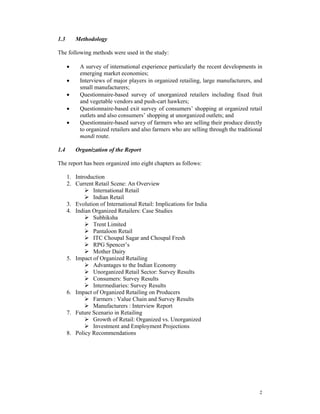
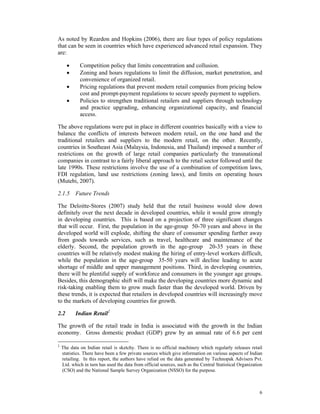
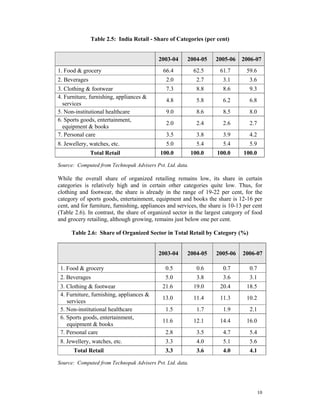
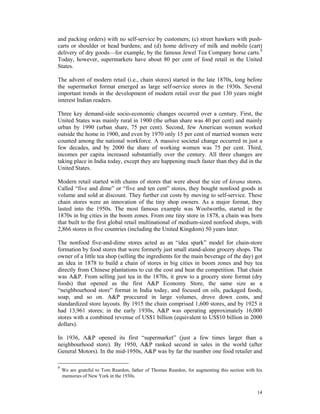
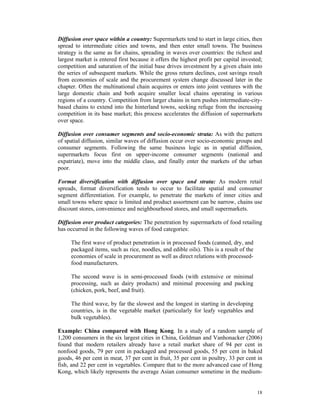
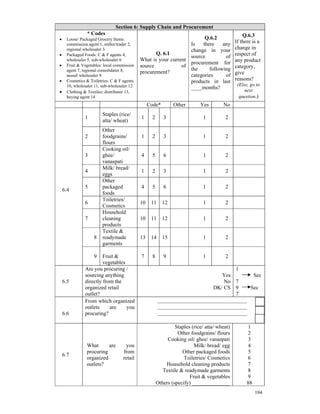
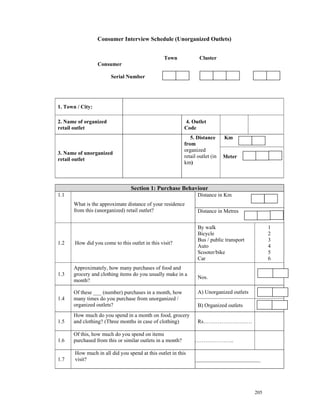
![Section 5: Sales Composition
Do you deal Sales Trend
in this
PRODUCT In the last ___months, has the
product sale of this product category
CATEGORY If decreased,
category? increased/ decreased/
reasons for the
remained same?
same.
Increased -1, Decreased---2
Food Items Yes No Remained the same—3
(Use codes)
Staples (rice/ atta/
A 1 2
wheat)
Other foodgrains /
flours / food items
[maida/ rava/ suji/
B 1 2
pulses/ dals/ spices/
masalas/ sugar/ salt/
eggs / bread/ milk]
Cooking oil/ ghee/
C 1 2
vanaspati
D Other packaged foods 1 2
Toiletries
[soap/ shampoo/ talcum
powder/ hair oil/
E 1 2
toothpaste/ shaving
products/ sanitary
napkins]
Cosmetics
F [creams/ lotions/ skin 1 2
care products]
Household cleaning
products
[washing
G 1 2
soap/detergents/ toilet
cleaners/ utensil
cleaners]
Fruit & Vegetables
H Fruit 1 2
I Vegetables 1 2
Textile &
Readymade
Garments
J Readymade 1 2
K Fabric 1 2
Hosiery
L 1 2
(undergarments)
* 1. Competition from organized (large) retailers 2. Competition from small (unorganized) retailers
3. Seasonality factors
4. Reduced household incomes 5 .High prices 6. Any other
(Specify)______________________________________
193](https://image.slidesharecdn.com/unorganizedretailinindia-120106025607-phpapp01/85/Unorganized-retail-in-india-208-320.jpg)
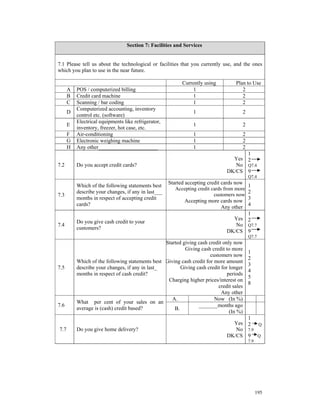
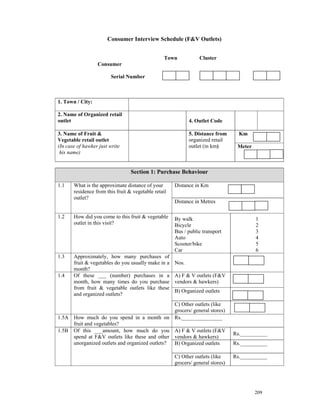
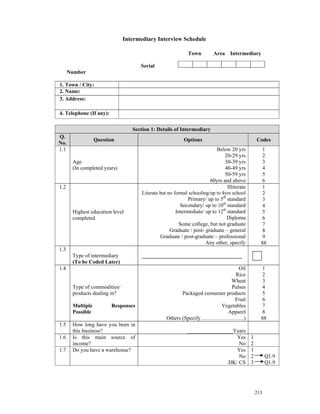
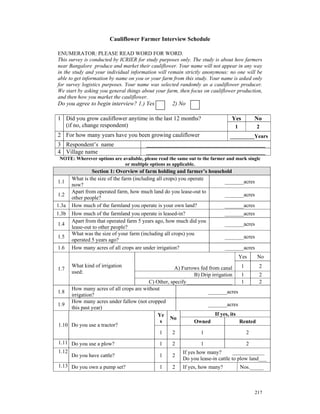
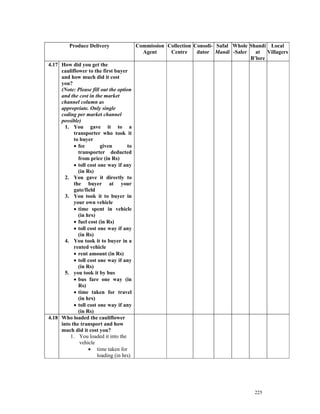
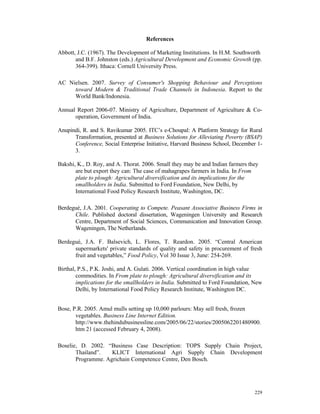
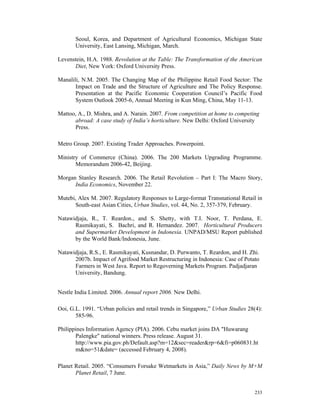
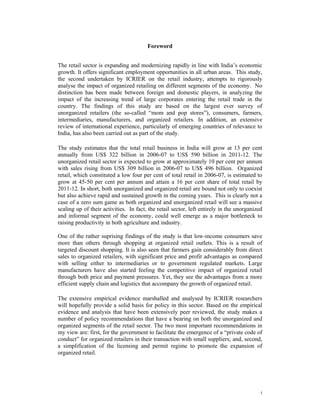
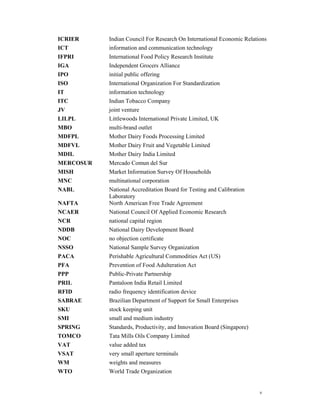
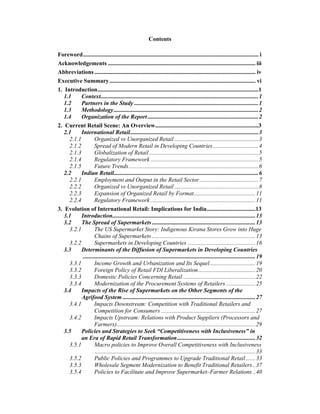
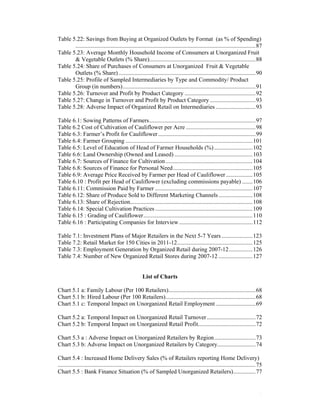
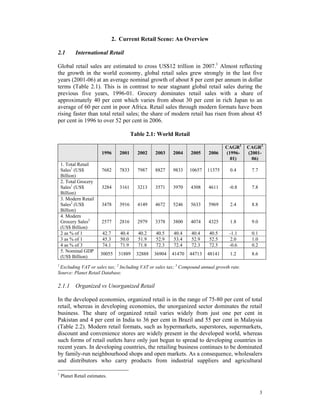
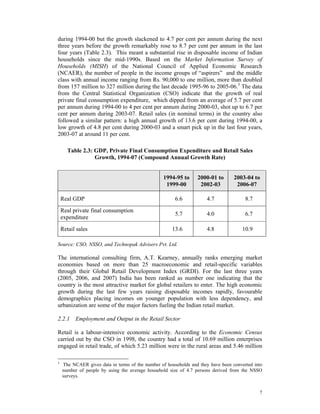
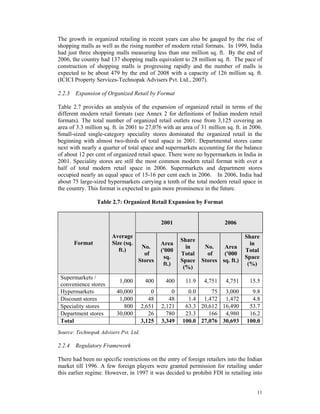
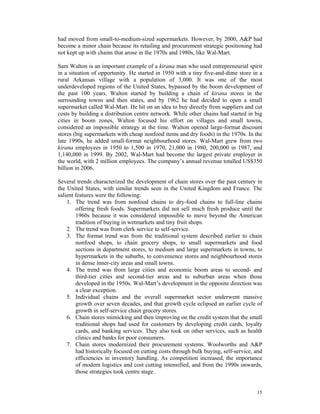
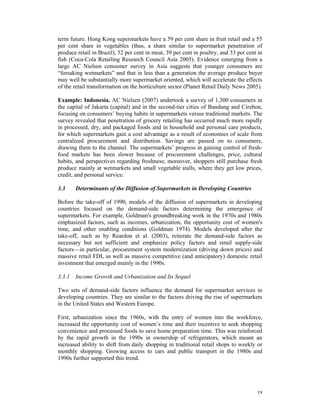
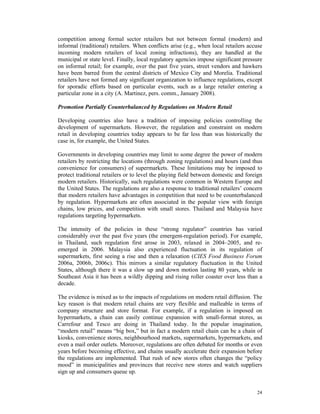
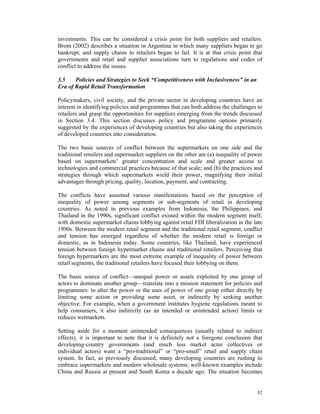
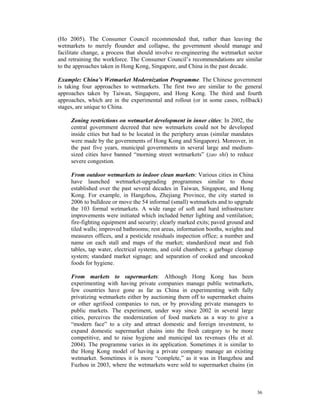
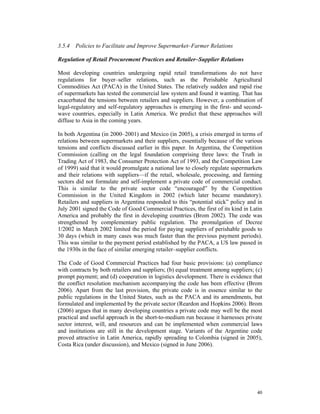
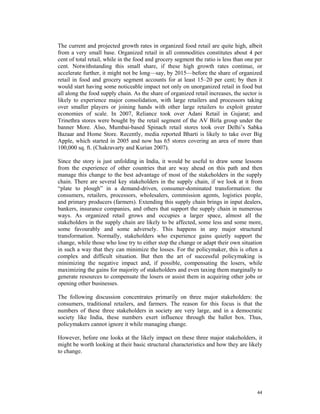
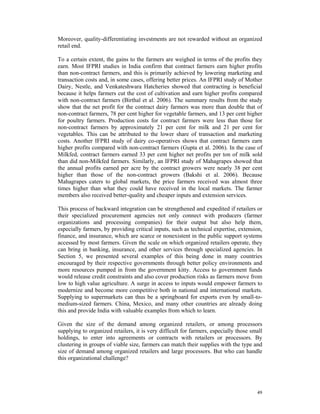
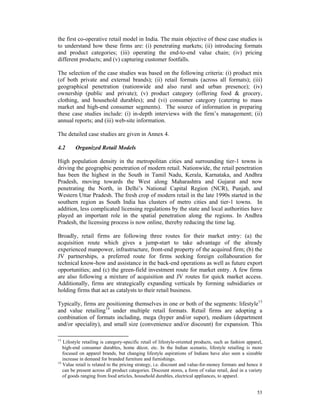
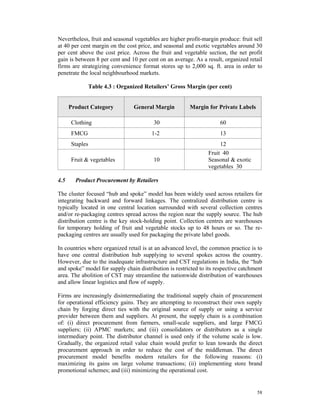
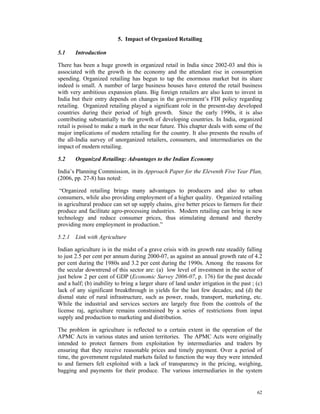
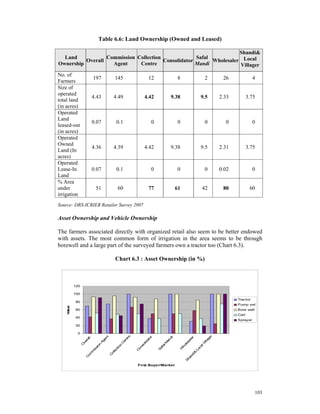
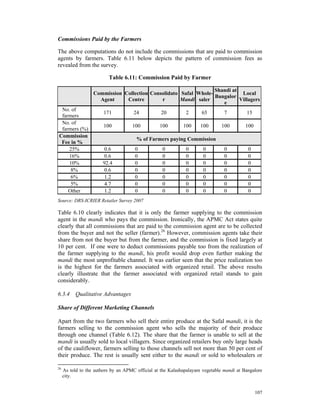
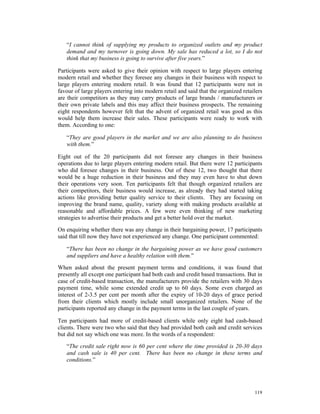
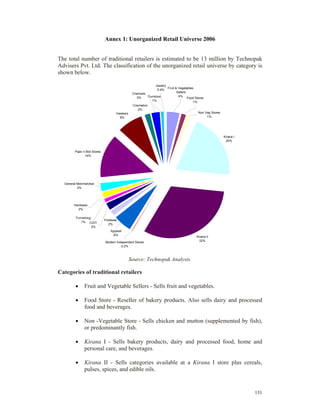
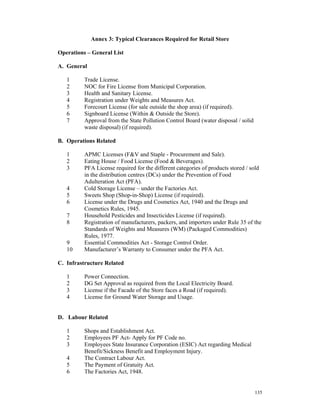
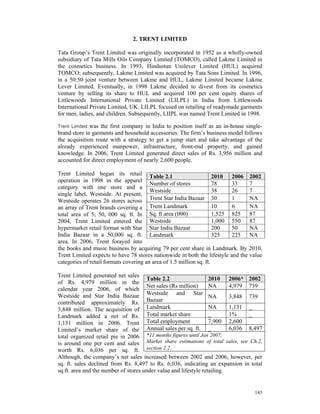
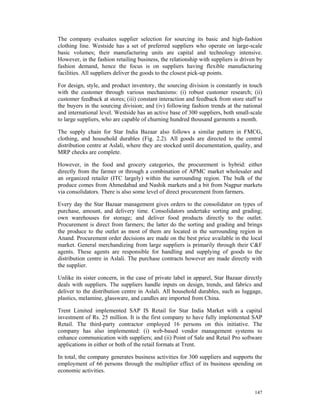
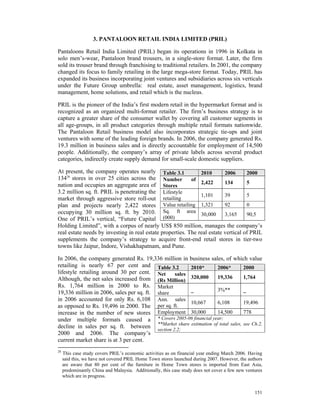
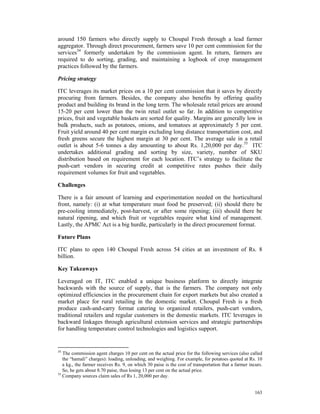
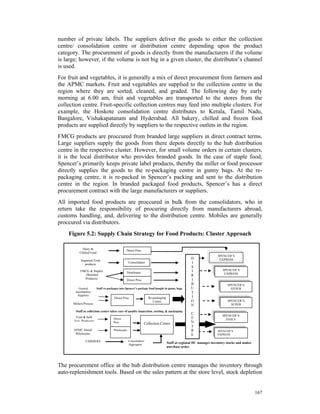
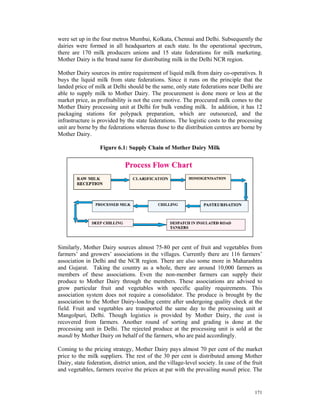
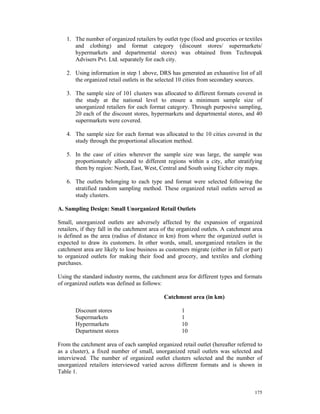
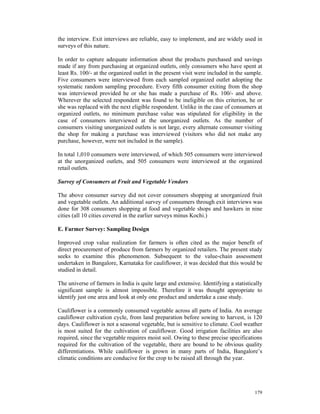
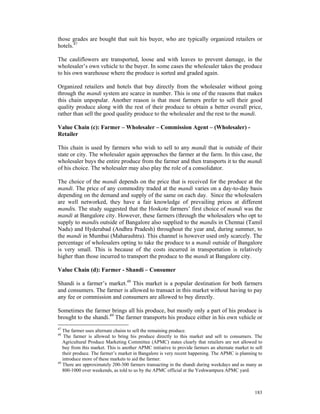
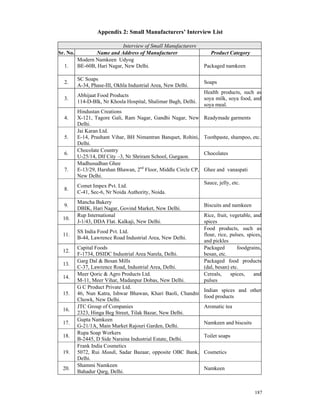
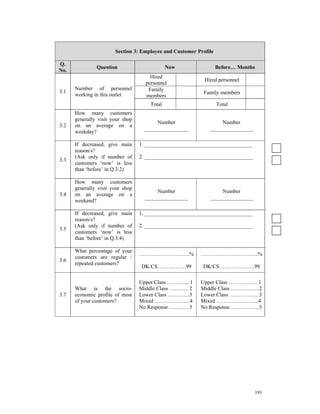
![Please tell me what all did you buy in this visit?
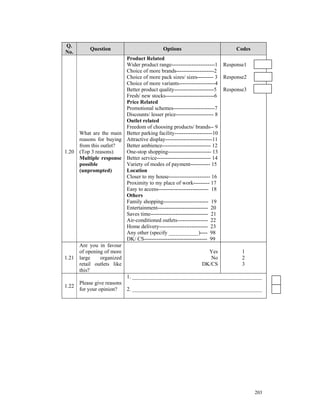
Q1.17 Q1.19
Q1.16 How much If yes, of the
What is on an Q1.18 total amount
Q1.15 the value average do Do you also spent on this
Which of of you spend buy this category in a
the purchase on this product month, how
following of this product category much do you
categories product category in a from spend at
PRODUCT
did you category month? unorganized unorganized
CATEGORY
buy in in this Three outlets / outlets?
this visit? visit? months in hawkers? (in rupees)
(in case of (3 months in
rupees) garments case of
(in rupees) clothing)
Food & Grocery Yes No Yes No
A Staples wheat).
(rice/ atta/
1 2 1 2
Other foodgrains/
flours / items
B [maida/ rava/ suji/ pulses/ 1 2 1 2
dals/ spices/ masalas/
sugar/ salt/ eggs / bread/
milk].
Cooking oil/ ghee/
C 1 2 1 2
vanaspati.
Other packaged
D 1 2 1 2
foods.
Toiletries
[soap/ shampoo/ talcum
E powder/ hair oil/ tooth 1 2
paste/ shaving products/ 1 2
sanitary napkins].
Cosmetics
F [creams/ lotions/ skin 1 2
care products].
Household cleaning
products
G [washing 1 2 1 2
soap/detergents/ toilet
cleaners/ utensil
cleaners].
Fruit and
Yes No Yes No
Vegetables
H Fruit 1 2 1 2
I Vegetables 1 2 1 2
Clothing, Textile &
Fashion Yes No Yes No
Accessories
J Readymade 1 2
K Fabric 1 2
1 2
Hosiery
L 1 2
(undergarments)
202](https://image.slidesharecdn.com/unorganizedretailinindia-120106025607-phpapp01/85/Unorganized-retail-in-india-217-320.jpg)
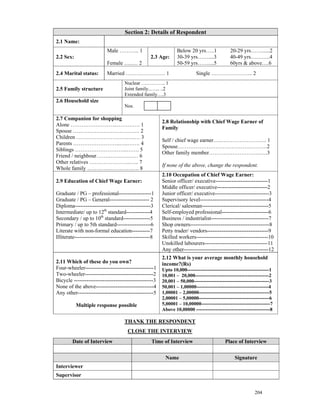
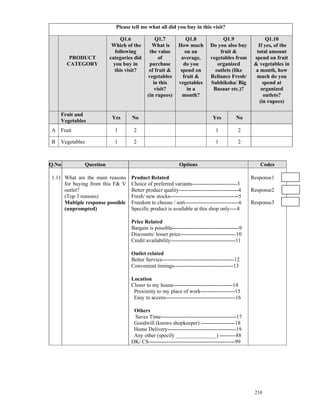
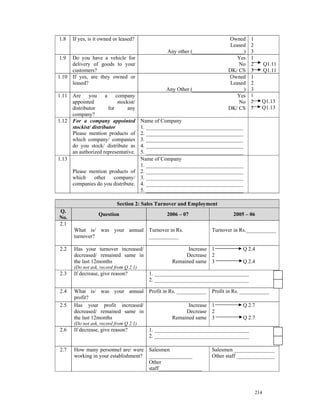
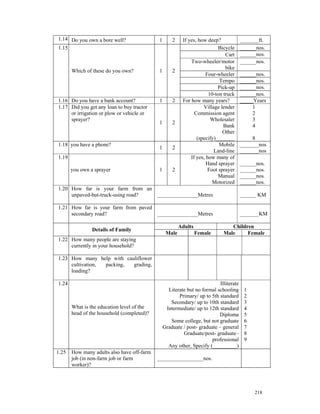
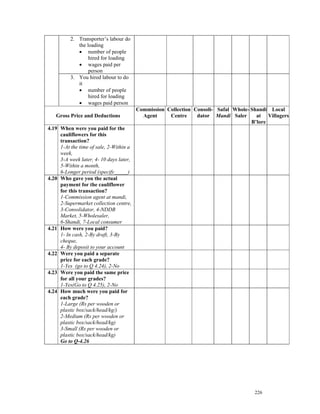
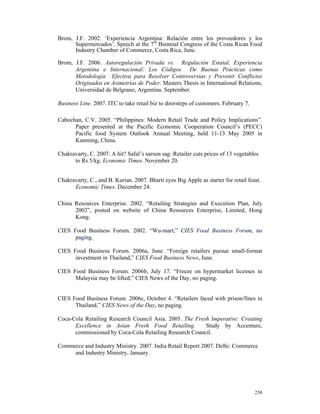
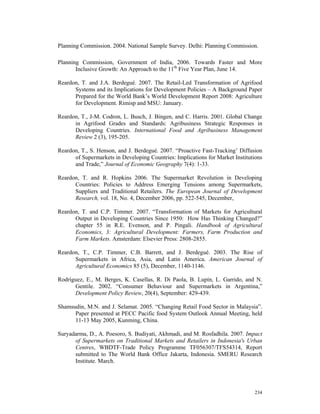
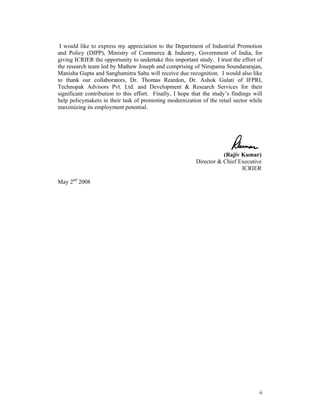
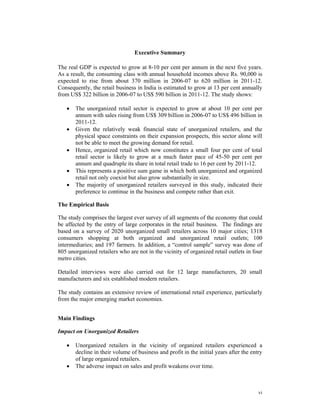
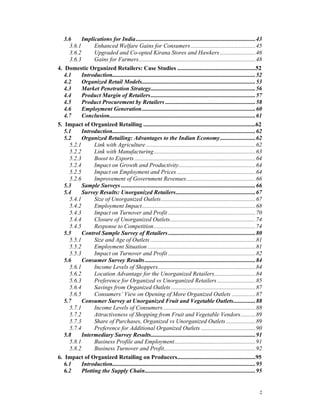
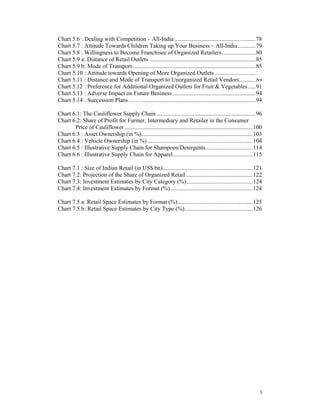
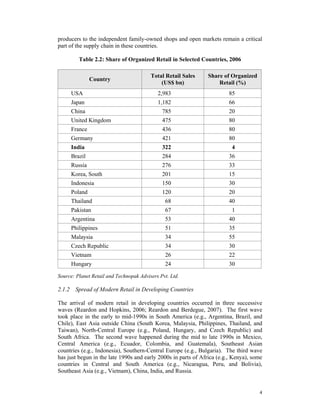
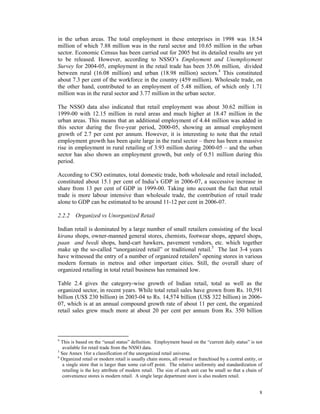
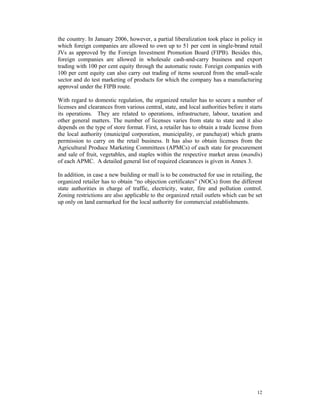
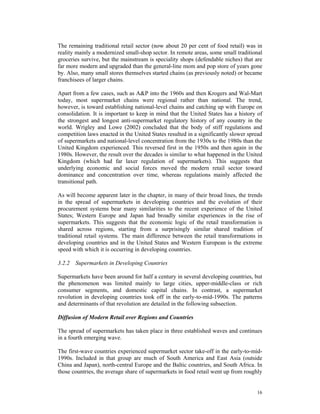
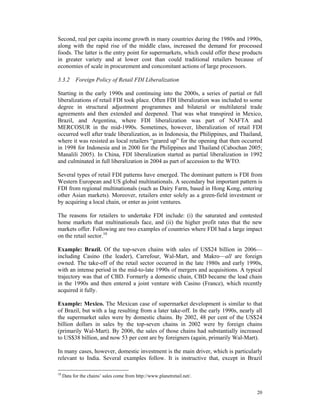
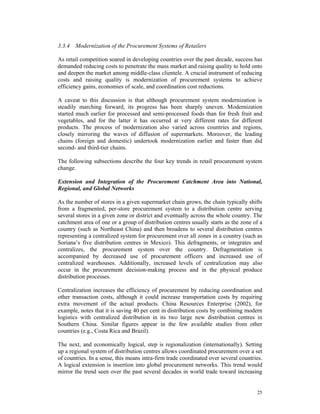
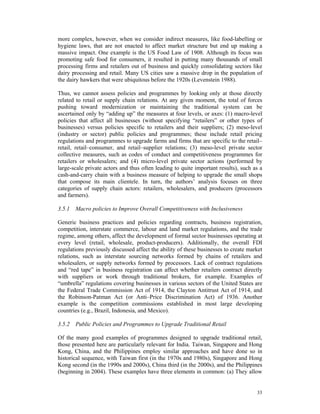
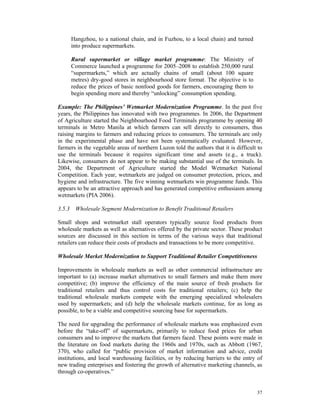
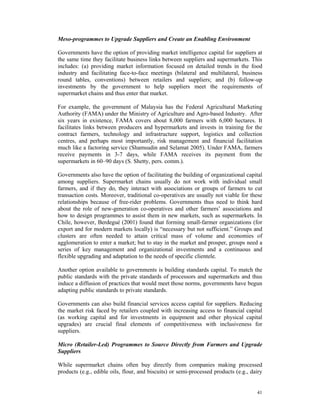
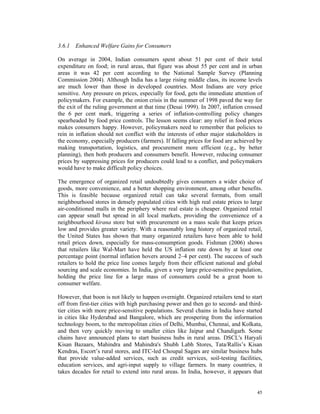
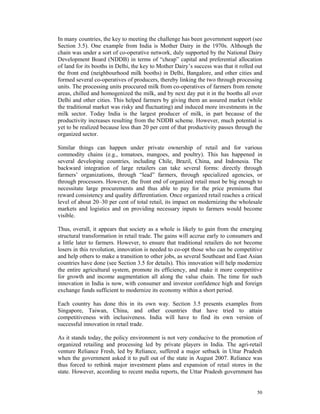
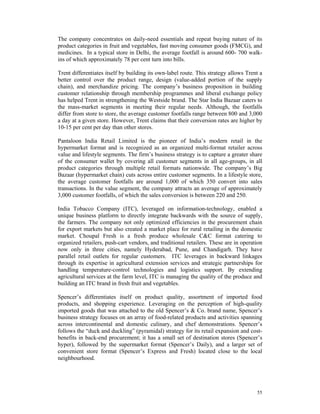
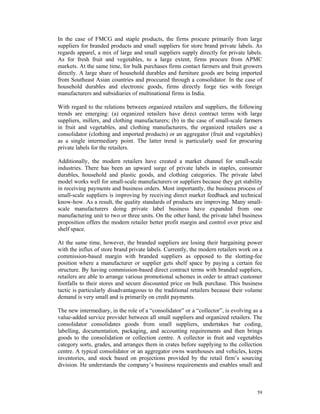
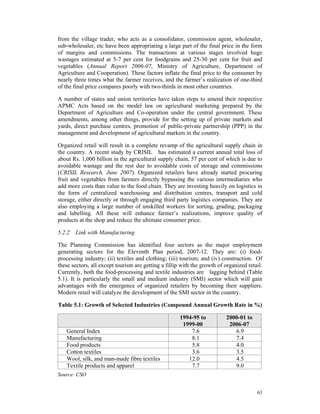
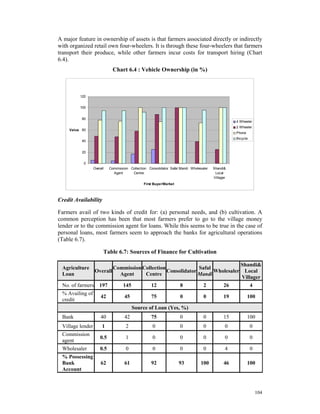
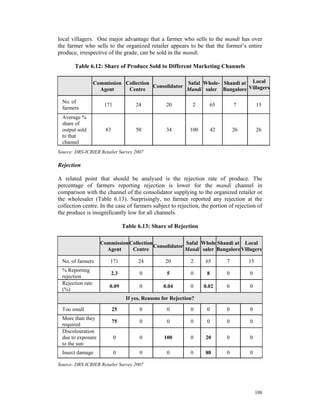
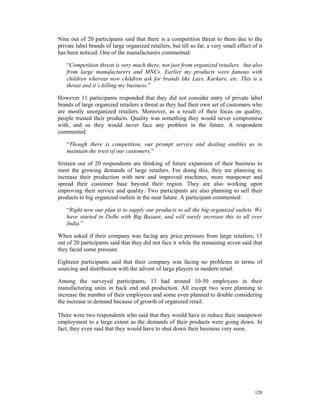
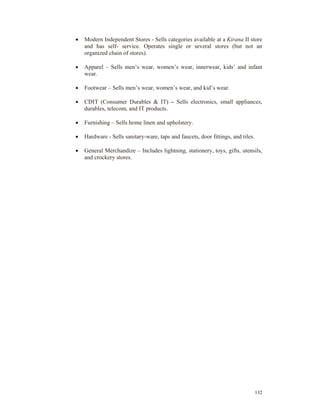
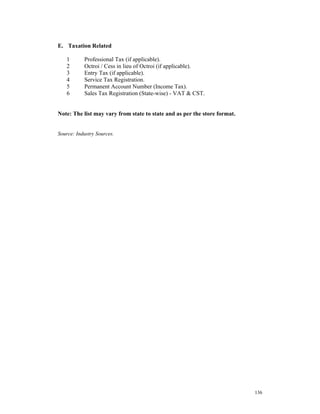
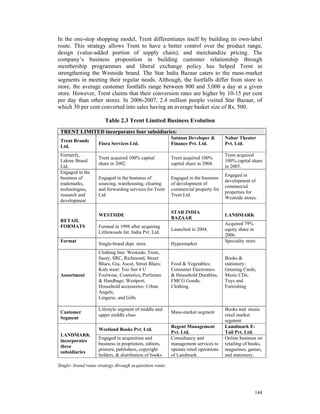
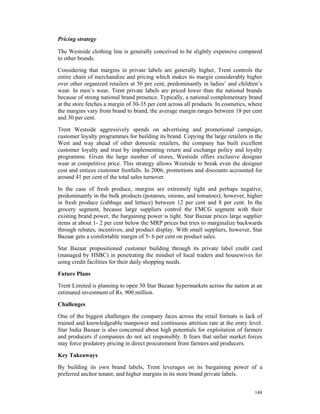
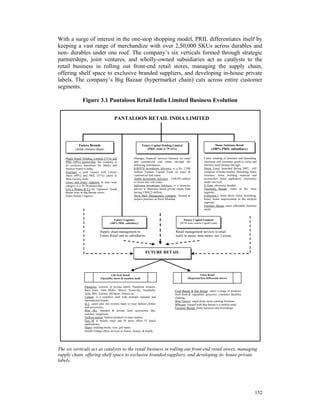
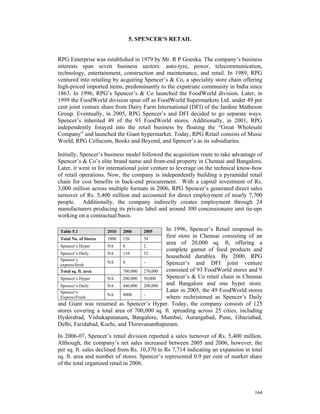
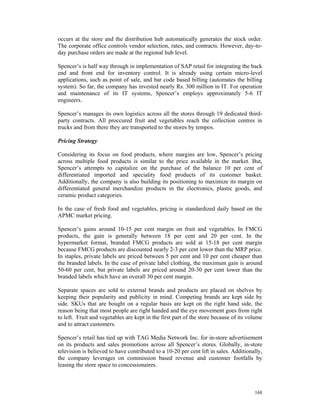
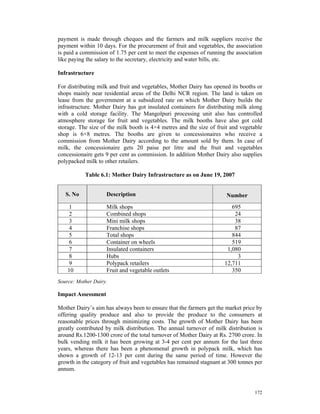
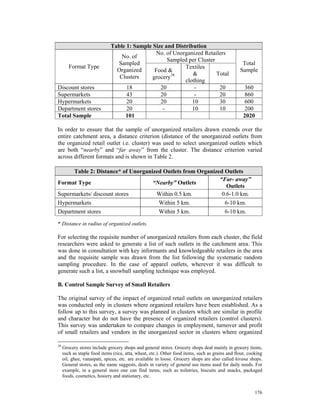
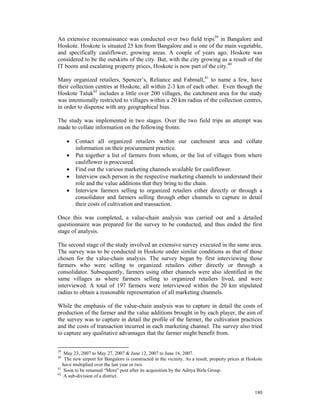
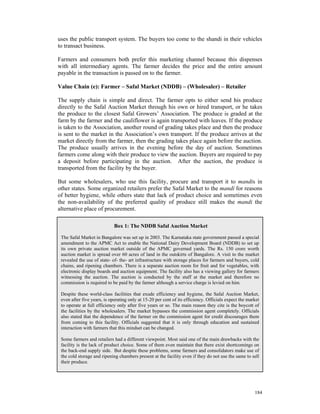
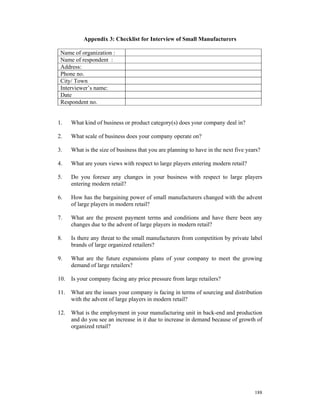
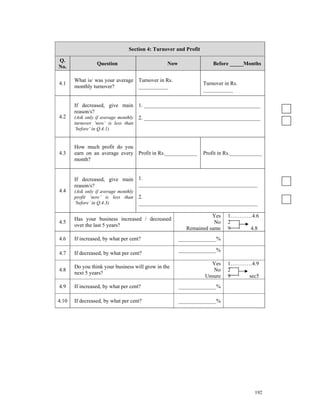
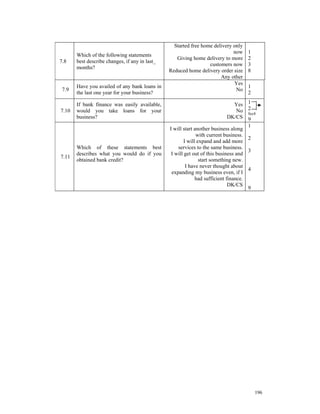
![Please tell me what all did you buy in this visit?
Q1.12
Q1.9
Q1.10 If yes, of
What
How much the total
is the
on an Q1.11 amount
value
average, Do you spend on
Q1.8 of
do you also buy this
Which of purcha
spend on this category in
the se of
this product a month,
following this
product category how much
categories produc
PRODUCT category in from do you
did you t
CATEGORY a month? organized spend at
buy in this categor
Three outlets / organized
visit? y in
months in hawkers? outlets?
this
case of (in rupees)
visit?
garments (3 Months in
(in
(in rupees) case of
rupees)
clothing)
Food & Grocery Yes No Yes No
A Staples 1 2 1 2
(Rice/ Atta/ Wheat)
Other food grains /
flours / items
B [maida/ rava/ suji/ pulses/ 1 2 1 2
dals/ spices/ masalas/ sugar/
salt/ eggs / bread/ milk]
Cooking oil/ ghee/
C 1 2 1 2
vanaspati
D Other packaged foods 1 2 1 2
Toiletries
[soap/ shampoo/ talcum
E powder/ hair oil/ tooth paste/ 1 2
shaving products/ sanitary 1 2
napkins]
Cosmetics
F [creams/ lotions/ skin care 1 2
products]
Household cleaning
products
G [washing soap/detergents/ 1 2 1 2
toilet cleaners/ utensil
cleaners]
Fruit and Vegetables Yes No Yes No
H Fruit 1 2 1 2
I Vegetables 1 2 1 2
Clothing, Textile &
Yes No Yes No
Fashion Accessories
J Readymade 1 2
K Fabric 1 2 1 2
Hosiery
L 1 2
(undergarments)
206](https://image.slidesharecdn.com/unorganizedretailinindia-120106025607-phpapp01/85/Unorganized-retail-in-india-221-320.jpg)