SlideShare a Scribd company logo
Supporting Early Warning Systems
Using data to keep students on track to success.
To find out more, visit www.DataQualityCampaign.org/PolicyIssues.
Why This Matters
 Keeping students on track is vital to graduating all students college and career ready.
> Failing to keep students on track toward completing high school has perilous consequences for students, communities, and
the economy.
 Predictive analyses are important to ensuring students are on track.
> Students in danger of straying off the course to success can be identified as early as elementary and middle school with the
aid of predictive analyses. This type of early warning data (such as the ABCs: attendance, behavior, and course success) can
be used to redirect students onto the path toward completing their degrees.
> Early warning systems provide the student-level information necessary to develop interventions that will help guide
students back on track, while aggregated data can provide insights for improvement at the school and district levels.
 Early warning systems are important tools for states in support of their policy goals.1
> States can utilize early warning data to work toward broader policy goals, such as school improvement efforts and alignment
with the Common Core State Standards.
Just the Facts
Q: How are states supporting districts and schools with early warning systems?
A: In 2012, 28 states reported producing early warning reports; 19 of these states reported additional information about their early
warning systems to provide a richer picture of how states are approaching this work:
Q: Who are states providing early warning data to in order to make important decisions for
students?
A: States reported providing early warning data to stakeholders through a variety of mechanisms, including web-based portals and
emails with lists of students who are off track. Of the 19 states that reported additional information on their early warning systems,
13 states detailed who has access to this information:
1
In 2013 the Data Quality Campaign will release a publication that further examines this issue.
15
3
1
State Approaches in Developing Early Warning Systems
The state education agency (SEA) collects, stores,
and analyzes the student-level data and provides
information back to schools and districts
The SEA provides an analytical tool that allows
districts and schools to upload their own local
data
The SEA collects data on behalf of local education
agencies (LEAs) and provides it to other partners
who conduct the analysis that is provided to
schools and districts
Supporting Early Warning Systems
The Data Quality Campaign’s Data for Action is a series of analyses that highlight state progress and key priorities to promote
the effective use of data to improve student achievement. For more information, and to view Data for Action 2012: DQC’s
State Analysis, please visit www.DataQualityCampaign.org. Scan the QR code for supplementary materials.
 District leaders: 13 states provide early warning data to district leaders to better drive systemic improvement decisions.
 Principals or school leadership: 13 states provide early warning data to principals or school leadership to help develop and
implement schoolwide reforms.
 Teachers: 9 states provide early warning data to teachers to help inform classroom practice.
 Counselors: 10 states provide early warning data to counselors to enable more timely interventions.
 Parents or students: 3 states provide early warning data to parents or students to guide their decisionmaking and help put
students back on track to success.
Q: How often do states provide stakeholders with information that will help students get back on
track?
A: In 2012 few states reported providing this information to stakeholders on a consistent basis. 7 states gave teachers, counselors,
principals, or district staff the ability to access information whenever they need to. Other states reported providing this information
on an annual basis (2 states), quarterly basis (1 state), weekly basis (1 state), or daily basis (2 states).
States to Watch
 Massachusetts has recently launched its Early Warning Indicator System, which covers the spectrum of K–12 and includes a
variety of indicators, including income level and disability status.
 In 2012 Oklahoma launched its Early Warning Indicator System (EWIS), which follows students throughout the state as they
move from school to school and includes a variety of indicators, including mobility, assessment performance levels, and
demographic information.
 Virginia provides a tool that permits districts to upload their own data and receive automatic analyses.
Related and Cited Resources
 Data Quality Campaign, Data for Action 2012: DQC's State Analysis (2012).
 Civic Enterprises and Everyone Graduates Center, Building a Grad Nation: Progress and Challenge in Ending the High School Dropout Epidemic
(2012).
 Civic Enterprises and Everyone Graduates Center, On Track for Success: The Use of Early Warning Indicator and Intervention Systems to Build a
GradNation (2011).
 Everyone Graduates Center, Using Data to Keep All Students on Track to Graduation (2012).
2
In 2013 the Data Quality Campaign will release a publication that further examines this issue.
LOOKING AHEAD
 As more states utilize predictive analyses to reach their goals, new questions about the role of the state will emerge. More work is
necessary to better understand current state data practices around early warning system implementation.
2
 More work is needed to understand how predictive analyses can be linked to college and career readiness efforts. In the coming
years, it will become increasingly important to ensure that students not only stay on track to graduating from high school but also
enter and succeed in postsecondary education and beyond.
 States must take steps to ensure that stakeholders have the support to utilize early warning data. Trainings on using early warning
systems and interpreting data are critical to implementing interventions based on early warning data.

More Related Content

What's hot

A Comparison of the Health Insurance Coverage Estimates from Four National Su...
A Comparison of the Health Insurance Coverage Estimates from Four National Su...A Comparison of the Health Insurance Coverage Estimates from Four National Su...
A Comparison of the Health Insurance Coverage Estimates from Four National Su...
soder145
 
Linking Administrative and Survey Data for Health Policy Research in the US: ...
Linking Administrative and Survey Data for Health Policy Research in the US: ...Linking Administrative and Survey Data for Health Policy Research in the US: ...
Linking Administrative and Survey Data for Health Policy Research in the US: ...
soder145
 
Pres mnhsr2011 mar1_turner
Pres mnhsr2011 mar1_turnerPres mnhsr2011 mar1_turner
Pres mnhsr2011 mar1_turner
soder145
 
Applying Utaut and Innovation Diffusion Theory to Understand the Rapid Adopti...
Applying Utaut and Innovation Diffusion Theory to Understand the Rapid Adopti...Applying Utaut and Innovation Diffusion Theory to Understand the Rapid Adopti...
Applying Utaut and Innovation Diffusion Theory to Understand the Rapid Adopti...
Editor IJCATR
 
Early Impacts of the ACA on Health Insurance Coverage in Minnesota
Early Impacts of the ACA on Health Insurance Coverage in MinnesotaEarly Impacts of the ACA on Health Insurance Coverage in Minnesota
Early Impacts of the ACA on Health Insurance Coverage in Minnesota
soder145
 
Sample Frame Assessment for a Large Metropolitan County's Health Survey
Sample Frame Assessment for a Large Metropolitan County's Health SurveySample Frame Assessment for a Large Metropolitan County's Health Survey
Sample Frame Assessment for a Large Metropolitan County's Health Survey
soder145
 
Blewett Academy Health Jun2009
Blewett Academy Health Jun2009Blewett Academy Health Jun2009
Blewett Academy Health Jun2009
soder145
 
Endless dreams foundation academic dreams program final2
Endless dreams foundation academic dreams program final2Endless dreams foundation academic dreams program final2
Endless dreams foundation academic dreams program final2
Brittany Yates
 
2019 FEBC Chunk #1 Financial Education Impact and Advocacy
2019 FEBC Chunk #1 Financial Education Impact and Advocacy2019 FEBC Chunk #1 Financial Education Impact and Advocacy
2019 FEBC Chunk #1 Financial Education Impact and Advocacy
Barbara O'Neill
 
mLearning Tibotec project presented at eLearning Africa in Dakar Senegal
mLearning Tibotec project presented at eLearning Africa in Dakar SenegalmLearning Tibotec project presented at eLearning Africa in Dakar Senegal
mLearning Tibotec project presented at eLearning Africa in Dakar Senegal
Inge de Waard
 
Unstable Ground? Comparing Income, Poverty & Health Insurance Estimates from ...
Unstable Ground? Comparing Income, Poverty & Health Insurance Estimates from ...Unstable Ground? Comparing Income, Poverty & Health Insurance Estimates from ...
Unstable Ground? Comparing Income, Poverty & Health Insurance Estimates from ...
soder145
 
Pres mnhsr2011 mar1_sonier
Pres mnhsr2011 mar1_sonierPres mnhsr2011 mar1_sonier
Pres mnhsr2011 mar1_sonier
soder145
 
Revisiting the SCHIP Funding Formula
Revisiting the SCHIP Funding FormulaRevisiting the SCHIP Funding Formula
Revisiting the SCHIP Funding Formula
soder145
 
Higher Education Student Retention and Achievement Infographic
Higher Education Student Retention and Achievement InfographicHigher Education Student Retention and Achievement Infographic
Higher Education Student Retention and Achievement Infographic
Chief Optimist
 
FLA DOCS Presentation
FLA DOCS PresentationFLA DOCS Presentation
FLA DOCS Presentation
Brenda Linares
 
AcademyHealth2010 kenney
AcademyHealth2010 kenneyAcademyHealth2010 kenney
AcademyHealth2010 kenney
soder145
 
Monitoring State-level Uninsurance, 1996-2006
Monitoring State-level Uninsurance, 1996-2006Monitoring State-level Uninsurance, 1996-2006
Monitoring State-level Uninsurance, 1996-2006
soder145
 
How Surveys Differ in the Quality of Reported Medicaid Enrollment: State Surv...
How Surveys Differ in the Quality of Reported Medicaid Enrollment: State Surv...How Surveys Differ in the Quality of Reported Medicaid Enrollment: State Surv...
How Surveys Differ in the Quality of Reported Medicaid Enrollment: State Surv...
soder145
 
National Health Care Reform: The Proposals and the Politics
National Health Care Reform: The Proposals and the PoliticsNational Health Care Reform: The Proposals and the Politics
National Health Care Reform: The Proposals and the Politics
soder145
 
Pres arm2010 june27_kenney2
Pres arm2010 june27_kenney2Pres arm2010 june27_kenney2
Pres arm2010 june27_kenney2
soder145
 

What's hot (20)

A Comparison of the Health Insurance Coverage Estimates from Four National Su...
A Comparison of the Health Insurance Coverage Estimates from Four National Su...A Comparison of the Health Insurance Coverage Estimates from Four National Su...
A Comparison of the Health Insurance Coverage Estimates from Four National Su...
 
Linking Administrative and Survey Data for Health Policy Research in the US: ...
Linking Administrative and Survey Data for Health Policy Research in the US: ...Linking Administrative and Survey Data for Health Policy Research in the US: ...
Linking Administrative and Survey Data for Health Policy Research in the US: ...
 
Pres mnhsr2011 mar1_turner
Pres mnhsr2011 mar1_turnerPres mnhsr2011 mar1_turner
Pres mnhsr2011 mar1_turner
 
Applying Utaut and Innovation Diffusion Theory to Understand the Rapid Adopti...
Applying Utaut and Innovation Diffusion Theory to Understand the Rapid Adopti...Applying Utaut and Innovation Diffusion Theory to Understand the Rapid Adopti...
Applying Utaut and Innovation Diffusion Theory to Understand the Rapid Adopti...
 
Early Impacts of the ACA on Health Insurance Coverage in Minnesota
Early Impacts of the ACA on Health Insurance Coverage in MinnesotaEarly Impacts of the ACA on Health Insurance Coverage in Minnesota
Early Impacts of the ACA on Health Insurance Coverage in Minnesota
 
Sample Frame Assessment for a Large Metropolitan County's Health Survey
Sample Frame Assessment for a Large Metropolitan County's Health SurveySample Frame Assessment for a Large Metropolitan County's Health Survey
Sample Frame Assessment for a Large Metropolitan County's Health Survey
 
Blewett Academy Health Jun2009
Blewett Academy Health Jun2009Blewett Academy Health Jun2009
Blewett Academy Health Jun2009
 
Endless dreams foundation academic dreams program final2
Endless dreams foundation academic dreams program final2Endless dreams foundation academic dreams program final2
Endless dreams foundation academic dreams program final2
 
2019 FEBC Chunk #1 Financial Education Impact and Advocacy
2019 FEBC Chunk #1 Financial Education Impact and Advocacy2019 FEBC Chunk #1 Financial Education Impact and Advocacy
2019 FEBC Chunk #1 Financial Education Impact and Advocacy
 
mLearning Tibotec project presented at eLearning Africa in Dakar Senegal
mLearning Tibotec project presented at eLearning Africa in Dakar SenegalmLearning Tibotec project presented at eLearning Africa in Dakar Senegal
mLearning Tibotec project presented at eLearning Africa in Dakar Senegal
 
Unstable Ground? Comparing Income, Poverty & Health Insurance Estimates from ...
Unstable Ground? Comparing Income, Poverty & Health Insurance Estimates from ...Unstable Ground? Comparing Income, Poverty & Health Insurance Estimates from ...
Unstable Ground? Comparing Income, Poverty & Health Insurance Estimates from ...
 
Pres mnhsr2011 mar1_sonier
Pres mnhsr2011 mar1_sonierPres mnhsr2011 mar1_sonier
Pres mnhsr2011 mar1_sonier
 
Revisiting the SCHIP Funding Formula
Revisiting the SCHIP Funding FormulaRevisiting the SCHIP Funding Formula
Revisiting the SCHIP Funding Formula
 
Higher Education Student Retention and Achievement Infographic
Higher Education Student Retention and Achievement InfographicHigher Education Student Retention and Achievement Infographic
Higher Education Student Retention and Achievement Infographic
 
FLA DOCS Presentation
FLA DOCS PresentationFLA DOCS Presentation
FLA DOCS Presentation
 
AcademyHealth2010 kenney
AcademyHealth2010 kenneyAcademyHealth2010 kenney
AcademyHealth2010 kenney
 
Monitoring State-level Uninsurance, 1996-2006
Monitoring State-level Uninsurance, 1996-2006Monitoring State-level Uninsurance, 1996-2006
Monitoring State-level Uninsurance, 1996-2006
 
How Surveys Differ in the Quality of Reported Medicaid Enrollment: State Surv...
How Surveys Differ in the Quality of Reported Medicaid Enrollment: State Surv...How Surveys Differ in the Quality of Reported Medicaid Enrollment: State Surv...
How Surveys Differ in the Quality of Reported Medicaid Enrollment: State Surv...
 
National Health Care Reform: The Proposals and the Politics
National Health Care Reform: The Proposals and the PoliticsNational Health Care Reform: The Proposals and the Politics
National Health Care Reform: The Proposals and the Politics
 
Pres arm2010 june27_kenney2
Pres arm2010 june27_kenney2Pres arm2010 june27_kenney2
Pres arm2010 june27_kenney2
 

Viewers also liked

Finalaya daily wrap_05feb2013
Finalaya daily wrap_05feb2013Finalaya daily wrap_05feb2013
Finalaya daily wrap_05feb2013
Investors Empowered
 
3
33
Calendario atp 2012
Calendario atp 2012Calendario atp 2012
Calendario atp 2012
guerrillero20
 
Windmill
WindmillWindmill
Windmillfotoaik
 
Bitácora 1
Bitácora 1Bitácora 1
Bitácora 1
Sara Borja
 
Actividades del pat pnl
Actividades del pat pnlActividades del pat pnl
Actividades del pat pnl
veryto102
 
Julie roehm
Julie roehmJulie roehm
Julie roehm
julieroehm1
 

Viewers also liked (8)

Finalaya daily wrap_05feb2013
Finalaya daily wrap_05feb2013Finalaya daily wrap_05feb2013
Finalaya daily wrap_05feb2013
 
3
33
3
 
Calendario atp 2012
Calendario atp 2012Calendario atp 2012
Calendario atp 2012
 
Windmill
WindmillWindmill
Windmill
 
Bitácora 1
Bitácora 1Bitácora 1
Bitácora 1
 
Actividades del pat pnl
Actividades del pat pnlActividades del pat pnl
Actividades del pat pnl
 
Spaltung und vielfalt
Spaltung und vielfaltSpaltung und vielfalt
Spaltung und vielfalt
 
Julie roehm
Julie roehmJulie roehm
Julie roehm
 

Similar to 1659_Early Warning

1663_HSFB
1663_HSFB1663_HSFB
1663_HSFB
Amilcar Guzman
 
F353848
F353848F353848
ELCC powerpoint long
ELCC powerpoint    longELCC powerpoint    long
ELCC powerpoint long
elccollaboration
 
ED543109
ED543109ED543109
ED543109
Amilcar Guzman
 
Educational Measurement Issues and PracticeFall 2020, Vol. .docx
Educational Measurement Issues and PracticeFall 2020, Vol. .docxEducational Measurement Issues and PracticeFall 2020, Vol. .docx
Educational Measurement Issues and PracticeFall 2020, Vol. .docx
greg1eden90113
 
Who uses-student-data-infographic (Data Quality Campaign)
Who uses-student-data-infographic (Data Quality Campaign)Who uses-student-data-infographic (Data Quality Campaign)
Who uses-student-data-infographic (Data Quality Campaign)
JenniferMarano2
 
A Guide for School Districts: Exploring Alternative Measures of Student Learn...
A Guide for School Districts: Exploring Alternative Measures of Student Learn...A Guide for School Districts: Exploring Alternative Measures of Student Learn...
A Guide for School Districts: Exploring Alternative Measures of Student Learn...
Tanya Paperny
 
Using Data to Improve Minority-Serving Institution Success
Using Data to Improve Minority-Serving Institution SuccessUsing Data to Improve Minority-Serving Institution Success
Using Data to Improve Minority-Serving Institution Success
Dawn Follin
 
Partners_Winter2015_Final
Partners_Winter2015_FinalPartners_Winter2015_Final
Partners_Winter2015_Final
Maryland State Department of Education
 
Early Learning in the USA and the Economic Crisis
Early Learning in the USA and the Economic Crisis Early Learning in the USA and the Economic Crisis
Early Learning in the USA and the Economic Crisis
EduSkills OECD
 
Week One - Why Data?
Week One - Why Data?Week One - Why Data?
Week One - Why Data?
Rich Parker
 
SXSWedu 2015 NCAN Panel Deck
SXSWedu 2015 NCAN Panel DeckSXSWedu 2015 NCAN Panel Deck
SXSWedu 2015 NCAN Panel Deck
debaunb
 
Condition National 2015
Condition National 2015Condition National 2015
Condition National 2015
Will Valet
 
Road map for_education_results(ccer)_april
Road map for_education_results(ccer)_aprilRoad map for_education_results(ccer)_april
Road map for_education_results(ccer)_april
sremala
 
Data Collection
Data CollectionData Collection
Data Collection
Davidson Syne
 
Data Driven School : MIS case study on Schools of USA
Data Driven School : MIS case study on Schools of USAData Driven School : MIS case study on Schools of USA
Data Driven School : MIS case study on Schools of USA
Moshiur Rahman Moshi
 
DHHS_NCREACHEdProgramFosterYouth_Review_2012
DHHS_NCREACHEdProgramFosterYouth_Review_2012DHHS_NCREACHEdProgramFosterYouth_Review_2012
DHHS_NCREACHEdProgramFosterYouth_Review_2012
Donnie Charleston
 
Rd aupdate 8 27 12 (3)
Rd aupdate 8 27 12 (3)Rd aupdate 8 27 12 (3)
Rd aupdate 8 27 12 (3)
roverdust
 
Instruments for measuring public satisfaction with the education
Instruments for measuring public satisfaction with the educationInstruments for measuring public satisfaction with the education
Instruments for measuring public satisfaction with the education
Emad Mohammed Sindi
 
MSF Paper Final Draft_MIrvin_Oct14
MSF Paper Final Draft_MIrvin_Oct14MSF Paper Final Draft_MIrvin_Oct14
MSF Paper Final Draft_MIrvin_Oct14
Melissa Irvin, Ed.D.
 

Similar to 1659_Early Warning (20)

1663_HSFB
1663_HSFB1663_HSFB
1663_HSFB
 
F353848
F353848F353848
F353848
 
ELCC powerpoint long
ELCC powerpoint    longELCC powerpoint    long
ELCC powerpoint long
 
ED543109
ED543109ED543109
ED543109
 
Educational Measurement Issues and PracticeFall 2020, Vol. .docx
Educational Measurement Issues and PracticeFall 2020, Vol. .docxEducational Measurement Issues and PracticeFall 2020, Vol. .docx
Educational Measurement Issues and PracticeFall 2020, Vol. .docx
 
Who uses-student-data-infographic (Data Quality Campaign)
Who uses-student-data-infographic (Data Quality Campaign)Who uses-student-data-infographic (Data Quality Campaign)
Who uses-student-data-infographic (Data Quality Campaign)
 
A Guide for School Districts: Exploring Alternative Measures of Student Learn...
A Guide for School Districts: Exploring Alternative Measures of Student Learn...A Guide for School Districts: Exploring Alternative Measures of Student Learn...
A Guide for School Districts: Exploring Alternative Measures of Student Learn...
 
Using Data to Improve Minority-Serving Institution Success
Using Data to Improve Minority-Serving Institution SuccessUsing Data to Improve Minority-Serving Institution Success
Using Data to Improve Minority-Serving Institution Success
 
Partners_Winter2015_Final
Partners_Winter2015_FinalPartners_Winter2015_Final
Partners_Winter2015_Final
 
Early Learning in the USA and the Economic Crisis
Early Learning in the USA and the Economic Crisis Early Learning in the USA and the Economic Crisis
Early Learning in the USA and the Economic Crisis
 
Week One - Why Data?
Week One - Why Data?Week One - Why Data?
Week One - Why Data?
 
SXSWedu 2015 NCAN Panel Deck
SXSWedu 2015 NCAN Panel DeckSXSWedu 2015 NCAN Panel Deck
SXSWedu 2015 NCAN Panel Deck
 
Condition National 2015
Condition National 2015Condition National 2015
Condition National 2015
 
Road map for_education_results(ccer)_april
Road map for_education_results(ccer)_aprilRoad map for_education_results(ccer)_april
Road map for_education_results(ccer)_april
 
Data Collection
Data CollectionData Collection
Data Collection
 
Data Driven School : MIS case study on Schools of USA
Data Driven School : MIS case study on Schools of USAData Driven School : MIS case study on Schools of USA
Data Driven School : MIS case study on Schools of USA
 
DHHS_NCREACHEdProgramFosterYouth_Review_2012
DHHS_NCREACHEdProgramFosterYouth_Review_2012DHHS_NCREACHEdProgramFosterYouth_Review_2012
DHHS_NCREACHEdProgramFosterYouth_Review_2012
 
Rd aupdate 8 27 12 (3)
Rd aupdate 8 27 12 (3)Rd aupdate 8 27 12 (3)
Rd aupdate 8 27 12 (3)
 
Instruments for measuring public satisfaction with the education
Instruments for measuring public satisfaction with the educationInstruments for measuring public satisfaction with the education
Instruments for measuring public satisfaction with the education
 
MSF Paper Final Draft_MIrvin_Oct14
MSF Paper Final Draft_MIrvin_Oct14MSF Paper Final Draft_MIrvin_Oct14
MSF Paper Final Draft_MIrvin_Oct14
 

1659_Early Warning

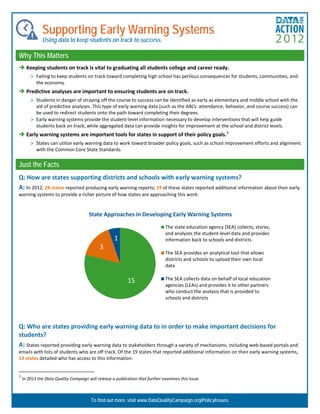
  • 1. Supporting Early Warning Systems Using data to keep students on track to success. To find out more, visit www.DataQualityCampaign.org/PolicyIssues. Why This Matters  Keeping students on track is vital to graduating all students college and career ready. > Failing to keep students on track toward completing high school has perilous consequences for students, communities, and the economy.  Predictive analyses are important to ensuring students are on track. > Students in danger of straying off the course to success can be identified as early as elementary and middle school with the aid of predictive analyses. This type of early warning data (such as the ABCs: attendance, behavior, and course success) can be used to redirect students onto the path toward completing their degrees. > Early warning systems provide the student-level information necessary to develop interventions that will help guide students back on track, while aggregated data can provide insights for improvement at the school and district levels.  Early warning systems are important tools for states in support of their policy goals.1 > States can utilize early warning data to work toward broader policy goals, such as school improvement efforts and alignment with the Common Core State Standards. Just the Facts Q: How are states supporting districts and schools with early warning systems? A: In 2012, 28 states reported producing early warning reports; 19 of these states reported additional information about their early warning systems to provide a richer picture of how states are approaching this work: Q: Who are states providing early warning data to in order to make important decisions for students? A: States reported providing early warning data to stakeholders through a variety of mechanisms, including web-based portals and emails with lists of students who are off track. Of the 19 states that reported additional information on their early warning systems, 13 states detailed who has access to this information: 1 In 2013 the Data Quality Campaign will release a publication that further examines this issue. 15 3 1 State Approaches in Developing Early Warning Systems The state education agency (SEA) collects, stores, and analyzes the student-level data and provides information back to schools and districts The SEA provides an analytical tool that allows districts and schools to upload their own local data The SEA collects data on behalf of local education agencies (LEAs) and provides it to other partners who conduct the analysis that is provided to schools and districts
  • 2. Supporting Early Warning Systems The Data Quality Campaign’s Data for Action is a series of analyses that highlight state progress and key priorities to promote the effective use of data to improve student achievement. For more information, and to view Data for Action 2012: DQC’s State Analysis, please visit www.DataQualityCampaign.org. Scan the QR code for supplementary materials.  District leaders: 13 states provide early warning data to district leaders to better drive systemic improvement decisions.  Principals or school leadership: 13 states provide early warning data to principals or school leadership to help develop and implement schoolwide reforms.  Teachers: 9 states provide early warning data to teachers to help inform classroom practice.  Counselors: 10 states provide early warning data to counselors to enable more timely interventions.  Parents or students: 3 states provide early warning data to parents or students to guide their decisionmaking and help put students back on track to success. Q: How often do states provide stakeholders with information that will help students get back on track? A: In 2012 few states reported providing this information to stakeholders on a consistent basis. 7 states gave teachers, counselors, principals, or district staff the ability to access information whenever they need to. Other states reported providing this information on an annual basis (2 states), quarterly basis (1 state), weekly basis (1 state), or daily basis (2 states). States to Watch  Massachusetts has recently launched its Early Warning Indicator System, which covers the spectrum of K–12 and includes a variety of indicators, including income level and disability status.  In 2012 Oklahoma launched its Early Warning Indicator System (EWIS), which follows students throughout the state as they move from school to school and includes a variety of indicators, including mobility, assessment performance levels, and demographic information.  Virginia provides a tool that permits districts to upload their own data and receive automatic analyses. Related and Cited Resources  Data Quality Campaign, Data for Action 2012: DQC's State Analysis (2012).  Civic Enterprises and Everyone Graduates Center, Building a Grad Nation: Progress and Challenge in Ending the High School Dropout Epidemic (2012).  Civic Enterprises and Everyone Graduates Center, On Track for Success: The Use of Early Warning Indicator and Intervention Systems to Build a GradNation (2011).  Everyone Graduates Center, Using Data to Keep All Students on Track to Graduation (2012). 2 In 2013 the Data Quality Campaign will release a publication that further examines this issue. LOOKING AHEAD  As more states utilize predictive analyses to reach their goals, new questions about the role of the state will emerge. More work is necessary to better understand current state data practices around early warning system implementation. 2  More work is needed to understand how predictive analyses can be linked to college and career readiness efforts. In the coming years, it will become increasingly important to ensure that students not only stay on track to graduating from high school but also enter and succeed in postsecondary education and beyond.  States must take steps to ensure that stakeholders have the support to utilize early warning data. Trainings on using early warning systems and interpreting data are critical to implementing interventions based on early warning data.