
Recommended
Recommended
More Related Content
Similar to Educational Measurement Issues and PracticeFall 2020, Vol. .docx
Similar to Educational Measurement Issues and PracticeFall 2020, Vol. .docx (20)
More from greg1eden90113
More from greg1eden90113 (20)
Recently uploaded
Recently uploaded (20)
Educational Measurement Issues and PracticeFall 2020, Vol. .docx
- 1. Educational Measurement: Issues and Practice Fall 2020, Vol. 39, No. 3, pp. 65–69 How Can Released State Test Items Support Interim Assessment Purposes in an Educational Crisis? Emma M. Klugman and Andrew D. Ho , Harvard Graduate School of Education State testing programs regularly release previously administered test items to the public. We provide an open-source recipe for state, district, and school assessment coordinators to combine these items flexibly to produce scores linked to established state score scales. These would enable estimation of student score distributions and achievement levels. We discuss how educators can use resulting scores to estimate achievement distributions at the classroom and school level. We emphasize that any use of such tests should be tertiary, with no stakes for students, educators, and schools, particularly in the context of a crisis like the COVID-19 pandemic. These tests and their results should also be lower in priority than assessments of physical, mental, and social–emotional health, and lower in priority than classroom and district assessments that may already be in place. We encourage state testing programs to release all the ingredients for this recipe to support low-stakes, aggregate-level assessments. This is particularly urgent during a crisis where scores may be declining and gaps increasing at unknown rates.
- 2. Keywords: achievement levels, COVID-19, interim assessment, item maps, item response theory, psychometrics, state testing State testing programs regularly release examples of test items to the public. These releases serve multiple purposes. They provide educators and students an opportunity to famil- iarize themselves with item formats. They demystify the test- ing experience for the public. And they can improve under- standing of test scores by illustrating the kinds of tasks that students at particular achievement levels can accomplish successfully. As exemplars, these items are typically screened carefully, with demonstrated alignment to state content stan- dards. They are generally evaluated at great expense in op- erational administrations and field tests. They have known quality and technical characteristics. However, states gener- ally release the items themselves, not their technical charac- teristics. This prevents any use of released items to estimate scores on state scales. This is generally wise. Released items have unknown ex- posure and unknown familiarity, and uncontrolled conditions in any readministration would risk standard inferences about proficiency. State testing programs are rightfully hesitant to sanction any uses of released items to protect against coach- ing that would inflate scores on a typical administration. However, at this writing in August of 2020, there are serious threats to any notion of a typical administration, and there is a dearth of high-quality assessment options. In this current pandemic, we argue that states should make technical pa- rameters of released items public to support low-stakes uses of standards-based test score reports. The cost is negligible, and all assessment options should be available to educators for educational monitoring purposes. In this article, we pro- vide a recipe for construction of tests using released items
- 3. and provide guardrails to ensure appropriate use in an edu- cational crisis. Assessment in the COVID-19 Crisis In the spring of 2020, COVID-19 caused U.S. school districts to cease in-person instruction months earlier than usual. The first states closed schools on March 16, and all states had recommended school closure by March 24 (Education Week, 2020). Remote instruction has differed substantially between and within states in implementation and uptake (Harris et al., 2020). As schools open in-person and online in the fall of 2020, unusual numbers of students may not have learned nor had the opportunity to learn previous grade ma- terial. Although projections exist for the magnitude of declines and possible increases in disparities (Kuhfeld et al., 2020), assessments can provide a more direct estimate this school year. Results of such interim assessments can inform strate- gies to support teachers and students, including funding, cur- riculum redesign, and instruction (Perie, Marion, & Gong, 2009). COVID-19 is an international health disaster, and standard- ized measures of proficiency in reading, writing, mathemat- ics, and other subjects should be tertiary to other assessment targets and assessment purposes (Lake & Olson, 2020; Mar- ion, Gong, Lorié, & Kockler, 2020; Olson, 2020). There is a hierarchy of assessment needs in a crisis, and measures of academic levels should rightfully be tertiary. Higher priori- ties and assessment approaches should include: • Teacher- or parent-reported surveys of students’ spring attendance, participation, and content coverage. In many schools with remote instruction, teachers and par- ents can report their impressions of attendance, partic-
- 4. ipation, and proficiency compared to prior years. © 2020 by the National Council on Measurement in Education 65 https://orcid.org/0000-0003-2016-6350 https://orcid.org/0000-0003-1287-9844 Table 1. Online Public Availability of Items and Parameter Estimates for the Construction of Open Tests Selected large-scale national and international testing programs and programs from the 15 largest states as of August, 2020. This table will be updated online at https://emmaklugman.github.io/files/open-tests.html Testing Program (1) Are Operational (or Field Tested) Items Available? (2) Are Item Parameter Estimates Available? (3) Is a Key Enabling a Merge of (1) and (2) Available? NAEP Yes Yes Yes PISA Yes Yes Yes TIMSS Yes Yes Yes Smarter balanced Yes No No New Meridian (PARCC) CC) Yes No No
- 5. California Yes No No Texas Yes No No Florida Yes No No New York Yes 3–8 & Regents Yes 3–8 & Regents No 3–8; yes Regents Pennsylvania Yes Yes No Illinois Yes No No Ohio Yes Yes Haphazardly Georgia Yes No No North Carolina Yes No No Michigan Yes No No New Jersey Yes No No Virginia Yes No No Washington Yes No No Arizona Yes Yes No Massachusetts Yes Yes No • Existing classroom and district assessments. Districts already have access to classroom assessments that can assess prior-grade material. Some district-level assess- ments have fall tests that can report scores linked to state proficiency standards. • Assessments of physical, mental, and social–emotional health, sufficient levels of which are necessary condi- tions for learning. As an optional supplement to these approaches, school and district educational personnel may also find aggregate sum- maries of student proficiency in terms of state performance standards useful. For example, a school or district may rec- ognize due to other assessments listed above that substantial units or students had no access to material taught at the end of the year, motivating some weeks of review of prior-grade content. A test comprised of previously released, prior-grade items would enable estimation of proficiency distributions
- 6. on prior-grade score scales, including proficiency in terms of achievement level cut scores. Although some districts have access to assessments that report on state test score scales, usually through statistical projections, such assessments are costly and not universal. Tests comprised of released items are free and interpretable directly in terms of state achievement levels. We also show how item maps comprised of released items can provide ed- ucators with examples of performance tasks that students in each achievement level can do. We provide an explicit recipe for such tests,; then we conclude with clear guardrails for ap- propriate use. In particular, we caution that any current use (or implied future use) of these scores for judgments about student tracking, educator effectiveness, or school effective- ness would invite severe bias and inflation that would render scores unusable for those high-stakes purposes. Availability of Released Items and Parameter Estimates Interest in the reuse of calibrated items surged in the 1990s as the National Assessment of Educational Progress (NAEP) be- gan reporting state results. The term “market-basket report- ing” (National Research Council, 2000) was considered and discarded, and authors demonstrated how “domain scores” using ItemResponse Theory could support reuse of calibrated items (Bock, Thissen, & Zimowski, 1997; Pommerich, 2006). More recently, there has been international interest in cre- ating tests for administration across different countries and conditions (Das & Zajonc, 2020; Muralidharan, Singh, & Ga- nimian, 2019). We could not find a straightforward recipe for creating such tests nor an article that discussed application and caveats in a crisis. Unfortunately, in our search of publicly available manuals, we found few examples of state technicalmanuals that enable users to merge published items to published estimates. This
- 7. does not appear to be an intentional omission. Rather, state testing program personnel may reason that released items have an audience that is not interested in technical specifi- cations, and item parameter estimates have an audience that is not interested in item content. We hope that it becomes standard practice to either publish item parameter estimates with released items or include a key that enables merging of released items with parameter estimates in technical manu- als. Table 1 shows whether the key ingredients for reuse of items are available across large testing programs and states. The ingredients are available for large national and inter- national programs like NAEP, PISA, and TIMSS. We also conducted a search of state websites for the 15 largest states, for items, parameter estimates, and a key linking the two. We find that these state testing programs always make 66 © 2020 by the National Council on Measurement in Education Educational Measurement: Issues and Practice https://emmaklugman.github.io/files/open-tests.html operational items available, in the case of some states, through the assessment consortia known as Smarter Bal- anced and New Meridian (which was related to the Partner- ship for Assessment of Readiness for College and Careers, PARCC). We found item parameter estimates in a few states. A key that enables a merge of the two key ingredients was only available for the New York Regents (a longstanding high school testing program) and in Ohio, where the necessary in- formation was largely available but seemed unintentional and based on item order rather than item IDs. Ingredients for Test Construction Using Released State
- 8. Test Items For this example, we consider a possible use of Grade 4 items to estimate Grade 4 proficiency for Grade 5 students in a COVID-19-disrupted year. This illustrative example is avail- able in our Online Appendix, complete with code in R. We use the National Assessment of Educational Progress (NAEP) for publicly available ingredients. In practice, ingredients from state tests will be preferable given the relative curricular and political relevance of state standards and state score scales. The recipe for standards-linked test scores requires five es- sential ingredients: 1. Test items 2. Item parameter estimates 3. A list or key enabling association of items and their cor- responding estimates 4. Linking functions from underlying θ scales to scale scoes 5. Achievement level cut scores Starting with the first ingredient, designers should ensure selection of items that suits their desired content coverage. Although the restrictive assumptions of Item Response The- ory suggest that the selection of items has no effect on score estimation (Yen&Fitzpatrick, 2006), it is reasonable to select items in similar proportion to test blueprints, or some subset of items from a content area in which educators have partic- ular interest. As we note in our section about caveats, state tests are typically administered at the end of a sequence of re- lated instruction. If tests are not given in a similar sequence and conditions, standard inferences may not apply. Thus, a presentation or review of Grade 4 material that mimics the standard instructional onramp to Grade 4 testing would help to ensure appropriate inferences from scores. The second ingredient is item parameter estimates. These
- 9. are an occasional feature of technical manuals for state tests. Turning to the third ingredient, as we mention above, a link is rarely available with the exception of large-scale programs like NAEP, TIMSS, and PISA, and one-off examples like the New York Regents Exams and Ohio. The fourth ingredient is a linking function, usually a sim- ple linear equation for each score scale that maps from item parameter estimates on the underlying θ scale to the scale scores for reporting. Fifth and finally, achievement level re- porting, in categories like Basic, Proficient, and Advanced, re- quires cut scores delineating these levels. Both linking func- tions and achievement level cut scores are reported regularly in state technical manuals and documentation. Recipe for Test Construction Using Released State Test Items The recipe for generating standards-based score reports from the ingredients above requires straightforward application of Item Response Theory. The recipe is available online at https://emmaklugman.github.io/files/open-tests.html and as- sumes expertise at the level of a first-year survey course in educational measurement. Reviews of IRT include those by Yen and Fitzpatrick (2006) and Thissen and Wainer (2001). Many state technical manuals also review state-specific scor- ing procedures and technical details. We use a common and straightforward procedure known as Test Characteristic Curve (TCC) scoring method that results in a 1-to-1 table of summed scores to θ estimates and scale scores. Kolen and Tong (2010) compare this approach with other alternatives. They note that the TCC approach is both transparent and avoids the dependence of scores on priors, which may offset the tradeoffs of the slight increase in impre-
- 10. cision. Users may substitute alternative scoring approaches into this recipe. Given the ingredients listed in the previous section, the recipe follows: 1. Arrange released test items into an online or paper booklet. 2. Generate a table mapping summed scores to scale scores. 3. Administer the test and collect responses. 4. Sum correct responses to summed scores and locate cor- responding scale scores 5. Report scale scores, including achievement levels and item map locations as desired. Test items should be arranged to support a natural flow of content and difficulty. For items where item locations are known, test constructors may try to preserve relative item or- der. For more on principles of test design, see Downing and Haladyna (2006). To create a table mapping summed scores to scale scores, we reproduce a standard recipe to sum item characteristic curve function to a test characteristic curve, invert it, and then transform the result linearly to estimate scale scores. For simplicity, consider a dichotomously scored 3-parameter- logistic model: Pi (θ ) ≡ Pi ( Xi = 1|θ ) = ci + 1 − ci 1 + exp (−Dai (θ − bi))
- 11. . Here, each examinee’s dichotomous response X to item i depends upon examinee proficiency θ and item parameters a, b, and c, indicating information (discrimination), loca- tion (difficulty), and a lower asymptote (pseudo-guessing), respectively.Manymodels include an arbitrary scaling param- eter, D = 1.7, which should simply be included or excluded for consistency. The sum of these item characteristic curves yields the test characteristic curve: T (θ ) = ∑ i Pi (θ ) . : This sum of probabilities is the expected sum score given known examinee proficiency θ . Inverting the test characteristic curve using numerical interpolation methods yields the TCC estimate of θ for any summed score. θ̂TCC = T−1 (∑ i Xi ) . Fall 2020 © 2020 by the National Council on Measurement in Education 67 https://emmaklugman.github.io/files/open-tests.html
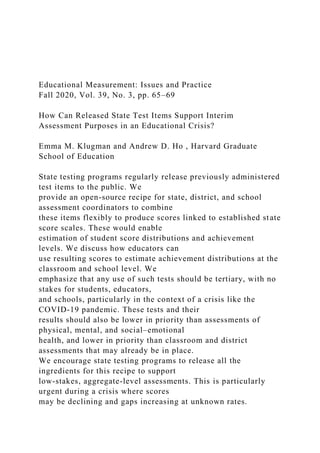
- 12. Table 2. Sum Scores, Estimated θ Scores, Scale Scores, Achievement Levels, and Item Maps, with Content Areas Shown Ingredients are from the National Assessment of Educational Progress and the National Center for Education Statistics. The recipe is available at https://emmaklugman.github.io/files/open-tests.html Sum Score Theta Scale Score Achievement Level Subscale Item 8 -2.48 162 Below Basic Geometry Identify a figure that is not… 9 -2.01 177 Below Basic Geometry Divide a square into various… 10 -1.65 188 Below Basic Measurement Identify appropriate… 11 -1.36 198 Below Basic Measurement Identify a reasonable amount… 12 -1.10 206 Below Basic Operations Identify the place value of a… 13 -0.88 213 Below Basic Operations Recognize the result of… 14 -0.68 219 Basic Operations Compose numbers using place… 15 -0.49 225 Basic Operations Represent the same whole… 16 -0.32 231 Basic Operations Subtract three-digit number from… 17 -0.15 236 Basic Algebra Solve a one-variable linear… 18 0.01 241 Basic Algebra Determine the missing shapes in… 19 0.17 246 Basic Algebra Mark locations on a grid… 20 0.33 251 Proficient Geometry Use an interactive tool to create… 21 0.49 256 Proficient Measurement Determine perimeter of a… 22 0.65 262 Proficient Algebra Determine and apply a rule… 23 0.82 267 Proficient Operations Represent fractions using a… 24 1.00 273 Proficient Measurement Identify given measurements on…
- 13. 25 1.19 279 Proficient Analysis Determine number of ways… 26 1.40 286 Advanced Algebra Determine and apply a rule… 27 1.64 293 Advanced Operations Solve a story problem involving… 28 1.93 303 Advanced Algebra Relate input to output from a… 29 2.32 315 Advanced Operations Compose numbers using place… 30 2.95 335 Advanced Geometry Divide a square into various… Transformations to scale scores s are typically linear, and constants for the slope and intercept (M and K, respectively) are often available in technical manuals: ŝ = Mθ̂ + K. States also publish achievement level cut scores denoting minimum threshold scores for categories. For NAEP, these achievement level labels are Basic, Proficient, and Advanced and delineated by cut scores in each subject and grade: cB, cP, and cA. A scale score s is assigned an achievement level category L in straightforward fashion: L (s) ⎧ ⎪ ⎨ ⎪ ⎩ Advanced if s ≤ cA Proficient if cp ≤ s < cA Basic if cB ≤ s < cP Below Basic if s < cB Finally, item maps can illustrate items and tasks that ex- aminees at each score are likely to be able to answer correctly. Each item is anchored to the θ scale assuming a given proba- bility of a correct response, known as the response probability,
- 14. pR. This can be set to various levels like .67 (Huynh, 2006) or, in our example here and online, .73. The item response func- tion is then inverted and transformed to the score scale to ob- tain each item’s mapped location, si. Under the assumptions of IRT, any item from the domain can be mapped, even if it was not administered to students. si = M ( 1 Dai log ( pR − ci 1 − pR ) + bi ) + K. This recipe results in Table 2, using real data from NAEP. Each summed score aligns with a single under- lying proficiency estimate θ̂ , scale score ŝ, achievement level, and nearby mapped item. This recipe is online and available at https://emmaklugman.github.io/files/open-tests. html, complete with open-source code in R. Although we rec- ommend scores for aggregate-level inferences, we also in- clude estimates of standard errors for each individual-level scale score using Item Response Theory. Discussion: Cautions and Caveats
- 15. We close with a series of caveats. One set of caveats relates to the interpretation and use of individual scores. A second set of caveats builds upon the first, with additional threats to the comparability of aggregate scores to past years. Users of these tests in a crisismay try to answer two important descrip- tive questions: (1) How much have scores declined? (2) How much have score disparities grown? Answers to these ques- tions must attend to these sets of caveats. First, in a crisis, many physical and psychological fac- tors may threaten a typical administration and introduce construct-irrelevant variance. We cannot emphasize enough the appropriately tertiary and supplemental role of the tests that we propose here. Physical health and safety must come first in a crisis, followed by assessments of social and emo- tional well-being. Students must be safe and feel safe before they can learn or demonstrate what they have learned. Second, when many students are working from home, on- line test-taking in different administration conditions are a threat to comparability. Complicating factors in home admin- istrations include online connectivity, parental involvement, and other in-home interference or distractions. Such factors can inflate scores if, for example, parents assist students, or students use additional online resources. They can deflate 68 © 2020 by the National Council on Measurement in Education Educational Measurement: Issues and Practice https://emmaklugman.github.io/files/open-tests.html https://emmaklugman.github.io/files/open-tests.html https://emmaklugman.github.io/files/open-tests.html scores if there are atypical distractions or poor internet con- nectivity.
- 16. Third, these tests typically follow standardized instruc- tional on-ramps at the end of a year of instruction. Irregular or inconsistent exposure to instruction prior to administra- tionwill threaten standard interpretations of scale scores. For example, consider a fall administration that follows a fall in- structional unit where teachers emphasize algebra over other domains like geometry ormeasurement. Resulting scoresmay lead users to underestimate algebra proficiency, when in fact the scores reflect relatively low proficiency in other domains. Additional threats to inferences arise at the aggregate level, to the extent that the population in school in a cri- sis may not be the same as in years past. Students who are not in school in a crisis are not missing at random. Stan- dard interpretations of trends and gap trends will be threat- ened to the extent that the population of students in school does not match the population of students who would have been in school absent the crisis. Matching based on scores from past years and other covariates may help to address some of this bias, but such a procedure risks precision and transparency. The use of existing classroom and interim assessments will also require similar caveats above. The one important excep- tion is the third caveat, where classroom and district assess- ments may have more flexible and appropriate instructional onramps. However, high-quality district assessments are not available to all districts, and these are not always directly in- terpretable in terms of state content and performance stan- dards. Thus, in spite of these necessary caveats, we emphasize that state testing programs already make high-quality ingre- dients for useful tests available to the public, andwe provide a recipe as well as guardrails for appropriate use.We encourage
- 17. states to release the currently missing ingredient, a key for merging items with parameter estimates. The cost would be negligible. All low-stakes assessment options should be avail- able to schools and districts in a crisis. References Bock, R. D., Thissen, D., & Zimowski, M. F. (1997). IRT estimation of domain scores. Journal of Educational Measurement, 34(3), 197– 211. https://doi.org/10.1111/j.1745-3984.1997.tb00515.x Das, J., & Zajonc, T. (2010). India shining and Bharat drowning: Com- paring two Indian states to the worldwide distribution in mathemat- ics achievement. Journal of Development Economics, 92(2), 175– 187. https://doi.org/10.1016/j.jdeveco.2009.03.004 Downing, S. M., & Haladyna, T. M. (Eds.). (2006). Handbook of test de- velopment. Mahwah, New Jersey: Lawrence Erlbaum. Education Week. (2020). Map: Coronavirus and school closures. Edu- cation Week. https://www.edweek.org/ew/section/multimedia/map- coronavirus-and-school-closures.html Harris, D. N., Liu, L., Oliver, D., Balfe, C., Slaughter, S., & Mattei, N. (2020). How America’s schools responded to the COVID crisis (p. 59) [Technical Report]. National Center for Research on
- 18. Education Access and Choice. https://www.reachcentered.org/ uploads/technicalreport/20200713-Technical-Report-Harris-et- al- How-Americas-Schools-Responded-to-the-COVID-Crisis.pdf Huynh, H. (2006). A clarification on the response probability criterion RP67 for standard settings based on bookmark and item mapping. Educational Measurement: Issues and Practice, 25(2), 19–20. https: //doi.org/10.1111/j.1745-3992.2006.00053.x Kolen, M. J., & Tong, Y. (2010). Psychometric properties of IRT profi- ciency estimates. Educational Measurement: Issues and Practice, 29(3), 8–14. https://doi.org/10.1111/j.1745-3992.2010.00179.x Kuhfeld, M., Soland, J., Tarasawa, B., Johnson, A., Ruzek, E., & Liu, J. (2020). Projecting the potential impacts of COVID-19 school closures on academic achievement (No. 20–226; Working Papers). Annen- berg Institute at Brown University. https://www.edworkingpapers. com/ai20-226 Lake, R., & Olson, L. (2020). Learning as we go: Principles for effective assessment during the COVID-19 pandemic (The Evi- dence Project at CRPE). https://www.crpe.org/sites/default/files/ final_diagnostics_brief_2020.pdf Marion, S., Gong, B., Lorié, W., & Kockler, R. (2020). Restart
- 19. & re- covery: Assessment considerations for Fall 2020. Council of Chief State School Officers. https://ccsso.org/sites/default/files/2020- 07/ Assessment%20Considerations%20for%20Fall%202020.pdf Muralidharan, K., Singh, A., & Ganimian, A. J. (2019). Disrupting ed- ucation? Experimental evidence on technology-aided instruction in India. American Economic Review, 109(4), 1426–1460. https://doi. org/10.1257/aer.20171112 National Research Council. (2000). Designing a market basket for NAEP: Summary of a workshop. P. J. DeVito & J. A. Koenig (Eds.), Washington, DC: The National Academies Press. https://doi.org/10. 17226/9891 Olson, L. (2020). Blueprint for testing: How schools should assess students during the Covid crisis (Future Ed). Georgetown Univer- sity. https://www.future-ed.org/blueprint-for-testing-how- schools- should-assess-students-during-the-covid-crisis/ Perie, M., Marion, S., & Gong, B. (2009). Moving toward a comprehen- sive assessment system: A framework for considering interim assess- ments. Educational Measurement: Issues and Practice, 28(3), 5–
- 20. 13. https://doi.org/10.1111/j.1745-3992.2009.00149.x Pommerich, M. (2006). Validation of group domain score estimates us- ing a test of domain. Journal of Educational Measurement, 43(2), 97–111. https://doi.org/10.1111/j.1745-3984.2006.00007.x Thissen, D., & Wainer, H. (Eds.). (2001). Test scoring. Lawrence Erl- baum Associates Publishers. Yen, W. M., & Fitzpatrick, A. R. (2006). Item Response Theory. In R. Brennan (Ed.), Educational measurement (4th ed., pp. 111–154). Westport, CT: American Council on Education, Praeger Publishers. Fall 2020 © 2020 by the National Council on Measurement in Education 69 https://doi.org/10.1111/j.1745-3984.1997.tb00515.x https://doi.org/10.1016/j.jdeveco.2009.03.004 https://www.edweek.org/ew/section/multimedia/map- coronavirus-and-school-closures.html https://www.edweek.org/ew/section/multimedia/map- coronavirus-and-school-closures.html https://www.reachcentered.org/uploads/technicalreport/2020071 3-Technical-Report-Harris-et-al-How-Americas-Schools- Responded-to-the-COVID-Crisis.pdf https://www.reachcentered.org/uploads/technicalreport/2020071 3-Technical-Report-Harris-et-al-How-Americas-Schools- Responded-to-the-COVID-Crisis.pdf https://www.reachcentered.org/uploads/technicalreport/2020071 3-Technical-Report-Harris-et-al-How-Americas-Schools-
- 21. Responded-to-the-COVID-Crisis.pdf https://doi.org/10.1111/j.1745-3992.2006.00053.x https://doi.org/10.1111/j.1745-3992.2006.00053.x https://doi.org/10.1111/j.1745-3992.2010.00179.x https://www.edworkingpapers.com/ai20-226 https://www.edworkingpapers.com/ai20-226 https://www.crpe.org/sites/default/files/final_diagnostics_brief_ 2020.pdf https://www.crpe.org/sites/default/files/final_diagnostics_brief_ 2020.pdf https://ccsso.org/sites/default/files/2020- 07/Assessment%20Considerations%20for%20Fall%202020.pdf https://ccsso.org/sites/default/files/2020- 07/Assessment%20Considerations%20for%20Fall%202020.pdf https://doi.org/10.1257/aer.20171112 https://doi.org/10.1257/aer.20171112 https://doi.org/10.17226/9891 https://doi.org/10.17226/9891 https://www.future-ed.org/blueprint-for-testing-how-schools- should-assess-students-during-the-covid-crisis/ https://www.future-ed.org/blueprint-for-testing-how-schools- should-assess-students-during-the-covid-crisis/ https://doi.org/10.1111/j.1745-3992.2009.00149.x https://doi.org/10.1111/j.1745-3984.2006.00007.x Copyright of Educational Measurement: Issues & Practice is the property of Wiley-Blackwell and its content may not be copied or emailed to multiple sites or posted to a listserv without the copyright holder's express written permission. However, users may print, download, or email articles for individual use.