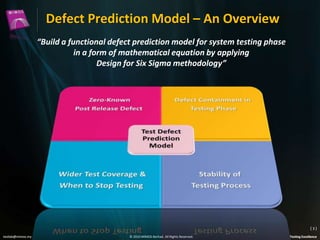
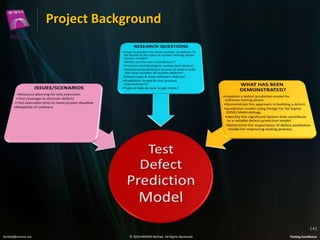
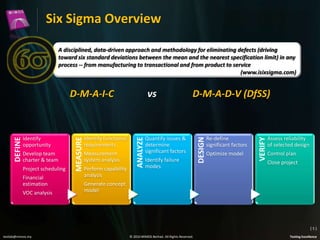
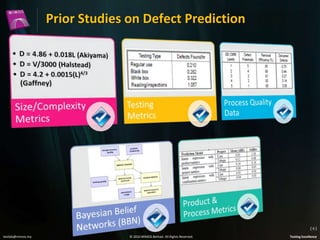
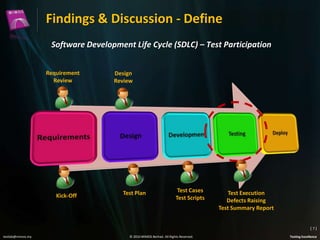
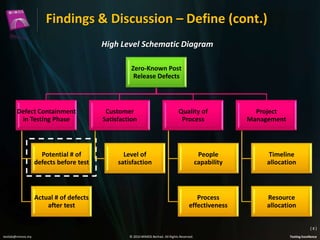
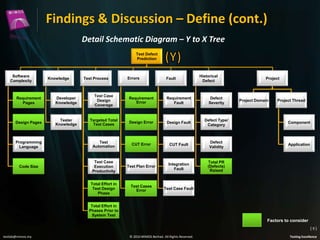
Establishing A Defect Prediction
Model Using A Combination of
Product Metrics As Predictors Via
Six Sigma Methodology

Muhammad Dhiauddin Mohamed Suffian
(M.Sc., B.Tech., Six Sigma Green Belt , CTAL-TM, CTFL)
Senior Engineer, MIMOS Test Lab
21 November 2013

testlab@mimos.my

© 2010 MIMOS Berhad. All Rights Reserved.

Testing Excellence
Agenda
• Defect Prediction Model – An Overview
• Project Background
• Six Sigma Overview
• Prior Studies on Defect Prediction
• Findings & Discussion – Define
• Findings & Discussion – Measure
• Findings & Discussion – Analyze
• Findings & Discussion – Design
• Findings & Discussion – Verify
• Conclusion & Recommendation

(2)
testlab@mimos.my

© 2010 MIMOS Berhad. All Rights Reserved.

Testing Excellence
Defect Prediction Model – An Overview
“Build a functional defect prediction model for system testing phase
in a form of mathematical equation by applying
Design for Six Sigma methodology”

(3)
testlab@mimos.my

© 2010 MIMOS Berhad. All Rights Reserved.

Testing Excellence
Project Background

(4)
testlab@mimos.my

© 2010 MIMOS Berhad. All Rights Reserved.

Testing Excellence
Six Sigma Overview
A disciplined, data-driven approach and methodology for eliminating defects (driving
toward six standard deviations between the mean and the nearest specification limit) in any
process -- from manufacturing to transactional and from product to service
(www.isixsigma.com)

Project scheduling
Financial
estimation
VOC analysis

Perform capability
analysis

Quantify issues &
determine
significant factors
Identify failure
modes

Re-define
significant factors
Optimize model

VERIFY

Measurement
system analysis

D-M-A-D-V (DfSS)

DESIGN

Develop team
charter & team

Identify functional
requirements

vs

ANALYZE

Identify
opportunity

MEASURE

DEFINE

D-M-A-I-C

Assess reliability
of selected design
Control plan
Close project

Generate concept
model

(5)
testlab@mimos.my

© 2010 MIMOS Berhad. All Rights Reserved.

Testing Excellence
Prior Studies on Defect Prediction

(6)
testlab@mimos.my

© 2010 MIMOS Berhad. All Rights Reserved.

Testing Excellence
Findings & Discussion - Define
Software Development Life Cycle (SDLC) – Test Participation
Requirement
Review

Kick-Off

Design
Review

Test Plan

Test Cases
Test Scripts

Test Execution
Defects Raising
Test Summary Report
(7)

testlab@mimos.my

© 2010 MIMOS Berhad. All Rights Reserved.

Testing Excellence
Findings & Discussion – Define (cont.)
High Level Schematic Diagram
Zero-Known Post
Release Defects

Defect Containment
in Testing Phase

Potential # of
defects before test

Actual # of defects
after test

Customer
Satisfaction

Quality of
Process

Level of
satisfaction

Project
Management

People
capability

Timeline
allocation

Process
effectiveness

Resource
allocation
(8)

testlab@mimos.my

© 2010 MIMOS Berhad. All Rights Reserved.

Testing Excellence
Findings & Discussion – Define (cont.)
Detail Schematic Diagram – Y to X Tree
Test Defect
Prediction

Software
Complexity

Knowledge

Test Process

Errors

Fault

Historical
Defect

Project

Requirement
Pages

Developer
Knowledge

Test Case
Design
Coverage

Requirement
Error

Requirement
Fault

Defect
Severity

Design Pages

Tester
Knowledge

Targeted Total
Test Cases

Design Error

Design Fault

Defect Type/
Category

Component

Programming
Language

Test
Automation

CUT Error

CUT Fault

Defect
Validity

Application

Code Size

Test Case
Execution
Productivity

Test Plan Error

Integration
Fault

Total PR
(Defects)
Raised

Total Effort in
Test Design
Phase

Test Cases
Error

Test Case Fault

Project Domain

Project Thread

Total Effort in
Phases Prior to
System Test

Factors to consider
(9)
testlab@mimos.my

© 2010 MIMOS Berhad. All Rights Reserved.

Testing Excellence
Findings & Discussion – Measure
Data for Attribute Agreement Analysis
TC

TC ID

Actual TC
Result

Tester 1

Tester 2

Tester 3

1

2

3

1

2

3

1

2

3

1

TC1

PASS

PASS

PASS

PASS

PASS

PASS

PASS

PASS PASS

PASS

2

TC2

FAIL

FAIL

FAIL

FAIL

FAIL

FAIL

FAIL

PASS PASS

PASS

3

TC3

FAIL

FAIL

FAIL

FAIL

FAIL

FAIL

FAIL

PASS PASS

PASS

4

TC4

PASS

FAIL

FAIL

FAIL

FAIL

FAIL

FAIL

PASS PASS

PASS

5

TC5

PASS

PASS

PASS

PASS

PASS

PASS

PASS

PASS PASS

PASS

6

TC6

PASS

PASS

PASS

PASS

PASS

PASS

PASS

PASS PASS

PASS

7

TC7

PASS

PASS

PASS

PASS

PASS

PASS

PASS

PASS PASS

PASS

8

TC8

FAIL

FAIL

FAIL

FAIL

FAIL

FAIL

FAIL

FAIL

FAIL

FAIL

9

TC9

PASS

PASS

PASS

PASS

PASS

PASS

PASS

PASS PASS

PASS

10

TC10

PASS

PASS

PASS

PASS

PASS

PASS

PASS

PASS PASS

PASS
( 10 )

testlab@mimos.my

© 2010 MIMOS Berhad. All Rights Reserved.

Testing Excellence
Findings & Discussion – Measure (cont.)
Result of Attribute Agreement Analysis
• Overall Result for MSA is PASS since Kappa value is greater than
0.7 or 70%

• 3 Persons (Vivek, Sandeep and Kamala) PASS the MSA based on Kappa value of 0.7
or 70%
• For the All Testers, the result is acceptable for accuracy of assessment against
standard as the Kappa value is greater than 0.7 or 70%

• Result is PASS for MSA Within Appraisers as the result shows 100%
assessment agreement
• Kappa = 1, which shows perfect agreement exist It demonstrates strong Repeatability of TestResult
within tester himself/herself
( 11 )
testlab@mimos.my

© 2010 MIMOS Berhad. All Rights Reserved.

Testing Excellence
Findings & Discussion – Analyze
Data for Regression Analysis
KLOC

Total
Test
Cases

Test
Plan
Error

Test
Case
Error

Automation
%

Test
Effort

12

28.8

224

0

34

0

6.38

45.80

19

0

1

6.8

17

0

6

0

9.36

17.00

1

9

10

14

5.4

24

4

6

0

29.16

5.83

4

PROJECT D

7

12

2

1.1

25

4

9

0

13.17

7.00

0

PROJECT E

11

29

3

1.2

28

4

12

0

14.26

3.40

3

PROJECT F

0

2

7

6.8

66

1

7

0

32.64

31.00

16

PROJECT G

3

25

11

4.0

149

5

0

0

7.15

74.50

3

PROJECT H

4

9

2

0.2

24

4

0

0

18.78

7.67

0

PROJECT I

7

0

1

1.8

16

1

3

0

9.29

2.68

1

PROJECT J

1

7

2

2.1

20

1

4

0

6.73

1.95

0

PROJECT K

17

0

3

1.4

13

1

4

0

8.44

6.50

1

PROJECT L

3

0

0

1.3

20

1

7

0

14.18

9.75

1

PROJECT M

2

3

16

2.5

7

1

6

0

8.44

1.75

0

Project
Name

Req.
Error

Design
Error

CUT
error

PROJECT A

5

22

PROJECT B

0

PROJECT C

Test
Functional
Execution
Defects
Productivity

( 12 )
testlab@mimos.my

© 2010 MIMOS Berhad. All Rights Reserved.

Testing Excellence
Findings & Discussion – Analyze (cont.)
Best Multiple Regression Result

• P-value for selected individual predictors shows significant relationship with
the Y (defects) which has value of less than 0.05
• R-sq and R-sq shows strong value which is more than 90%

( 13 )
testlab@mimos.my

© 2010 MIMOS Berhad. All Rights Reserved.

Testing Excellence
Findings & Discussion – Design
•

Revise the predictors to generate prediction model that is logical and makes sense from the viewpoint of software practitioner

•

Filter the metrics to contain only valid data in order to generate the model

•

Reduced the model to have only coefficients that have logical correlation to the response (Defect)

•

Revisit the model to identify suitable response of the regression equation: Functional Defects or All Defects

Revised Data for Regression Analysis
TOTAL TEST
REQ. DESIGN
TOTAL TEST DESIGN
TEST CASES
PAGE PAGE
EFFORT
EFFORT
CASES ERROR

REQ .
ERROR

DESIGN
ERROR

CUT
ERROR

KLOC

FUNCTIONAL
DEFECTS

ALL
DEFECTS

PROJECT A

5

22

12

28.8

81

121

224

34

16.79

15.20

19

19

PROJECT B

0

0

1

6.8

171

14

17

6

45.69

40.91

1

1

PROJECT C

9

10

14

5.4

23

42

24

6

13.44

13.44

4

4

PROJECT D

7

12

2

1.1

23

42

25

9

4.90

4.90

0

0

PROJECT E

11

29

3

1.2

23

54

28

12

4.72

4.59

3

3

PROJECT F

0

2

7

6.8

20

70

66

7

32.69

16.00

16

27

PROJECT G

3

25

11

4.0

38

131

149

0

64.00

53.50

3

3

PROJECT H

4

9

2

0.2

26

26

24

0

5.63

5.63

0

0

PROJECT I

17

0

3

1.4

15

28

13

4

9.13

7.88

1

1

PROJECT J

61

34

24

36

57

156

306

16

89.42

76.16

25

28

PROJECT K

32

16

19

12.3

162

384

142

0

7.00

7.00

12

12

PROJECT L

0

2

3

3.8

35

33

40

3

8.86

8.86

6

6

PROJECT M

15

18

10

26.1

88

211

151

22

30.99

28.61

39

57

PROJECT N

0

4

0

24.2

102

11

157

0

41.13

28.13

20

33

PROJECT

( 14 )
testlab@mimos.my

© 2010 MIMOS Berhad. All Rights Reserved.

Testing Excellence
Findings & Discussion – Design (cont.)

Y
Functional Defects

Y
All Defects

Xs
Requirement Error,
CUT Error, KLOC,
Requirement Pages,
Design Pages,
Targeted Total Test
Cases, Total Effort
Days

Xs
Requirement Error,
CUT Error, KLOC,
Requirement Pages,
Design Pages,
Targeted Total Test
Cases, Total Effort
Days

Y
Functional Defects

Y
All Defects

Xs
Requirement Error,
CUT Error, KLOC,
Requirement Pages,
Design Pages,
Targeted Total Test
Cases, Total Effort
Days in Test Design

Xs
Requirement Error,
CUT Error, KLOC,
Requirement Pages,
Design Pages,
Targeted Total Test
Cases, Total Effort
Days in Test Design
( 15 )

testlab@mimos.my

© 2010 MIMOS Berhad. All Rights Reserved.

Testing Excellence
Findings & Discussion – Verify
•
•
•

Verification was done by applying the selected model on new/fresh project that have yet to go for System Test
The actual defects found after System Test completed are compared against the predicted defects
Verify that actual defects fall between 95% prediction interval of the model

Revised Data for Regression Analysis
Y

Functional
Defect

All Defect

Functional
Defect

All Defect

Effort
Predictors
All Tester
Effort Prior to
System Test
All Tester
Effort Prior to
System Test
All Tester
Effort in Test
Design Prior to
System Test
All Tester
Effort in Test
Design Prior to
System Test

Project

Predicted
Defects

Actual Defects

95% CI
(min, max)

95% PI
(min, max)

Agrimall Beta Release

182

187

(155, 210)

(155, 210)

Grid Workflow

6

1

(0, 12)

(0, 14)

TTS-English

1

1

(0, 3)

(0, 6)

Agrimall Beta Release

298

230

(242, 355)

(241, 356)

Grid Workflow

9

9

(0, 21)

(0, 24)

TTS-English

2

1

(0, 6)

(0, 12)

Agrimall Beta Release

183

187

(202, 390)

(201, 392)

Grid Workflow

8

1

(0, 17)

(0, 19)

TTS-English

2

1

(0, 5)

(0, 9)

Agrimall Beta Release

296

230

(142, 224)

(142, 225)

Grid Workflow

11

9

(0, 32)

(0, 37)

TTS-English

3

1

(0, 10)

(0, 19)
( 16 )

testlab@mimos.my

© 2010 MIMOS Berhad. All Rights Reserved.

Testing Excellence
Findings & Discussion – Verify (cont.)
PROPOSED MODEL
Functional Defects (Y) = 4.00 - 0.204 Req. Error - 0.631 CUT Error + 1.90 KLOC 0.140 Req. Page + 0.125 Design Page - 0.169 Total Test Cases + 0.221 Effort Days
Verify against new project:
No

Req. Error

CUT Error

KLOC

Req. Page

Des. Page

Total TC

Effort Days

1.

12

6

84.03

75

293

102

69.75

2.

49

15

8.69

64

38

65

91.9

3.

0

1

0.4

10

10

18

1.13

Prediction result *:
No

Predicted Functional Defects

Actual Functional
Defects

95% CI (min, max)

95% PI (min, max)

1.

182

187

(155, 209)

(154, 209)

2.

6

1

(0, 12)

(0, 14)

3.

1

1

(0, 3)

(0, 6)

* The actual functional defects were raised after both functional and ad-hoc testing completed
( 17 )
testlab@mimos.my

© 2010 MIMOS Berhad. All Rights Reserved.

Testing Excellence
Findings & Discussion – Verify (cont.)

( 18 )
testlab@mimos.my

© 2010 MIMOS Berhad. All Rights Reserved.

Testing Excellence
Conclusion & Recommendation
CONCLUSION
• Defect prediction model for testing phase can be constructed
using identified factors via multiple regression
• Significant factors contributed to defects found in testing
phase have been discovered
• Six Sigma can be used to develop test defect prediction model
• Test defect prediction model does contribute to zero-known
post release defects and test process improvement

RECOMMENDATION
• To consider other factors that contribute in predicting
defects
• To improve model by being able to predict defect
based on different severity
• To predict defects to be found against time
• To predict defects based on different type of software

( 19 )
testlab@mimos.my

© 2010 MIMOS Berhad. All Rights Reserved.

Testing Excellence
Experience our Testing Excellence in
“End-to-End Testing Strategies” Workshop
See you again on 17th June 2010, 2.00 pm, Room 301

THANK YOU
testlab@mimos.my

testlab@mimos.my

© 2010 MIMOS Berhad. All Rights Reserved.

Testing Excellence

Establishing A Defect Prediction Model Using A Combination of Product Metrics As Predictors Via Six Sigma Methodology

  • 1.
    Establishing A DefectPrediction Model Using A Combination of Product Metrics As Predictors Via Six Sigma Methodology Muhammad Dhiauddin Mohamed Suffian (M.Sc., B.Tech., Six Sigma Green Belt , CTAL-TM, CTFL) Senior Engineer, MIMOS Test Lab 21 November 2013 testlab@mimos.my © 2010 MIMOS Berhad. All Rights Reserved. Testing Excellence
  • 2.
    Agenda • Defect PredictionModel – An Overview • Project Background • Six Sigma Overview • Prior Studies on Defect Prediction • Findings & Discussion – Define • Findings & Discussion – Measure • Findings & Discussion – Analyze • Findings & Discussion – Design • Findings & Discussion – Verify • Conclusion & Recommendation (2) testlab@mimos.my © 2010 MIMOS Berhad. All Rights Reserved. Testing Excellence
  • 3.
    Defect Prediction Model– An Overview “Build a functional defect prediction model for system testing phase in a form of mathematical equation by applying Design for Six Sigma methodology” (3) testlab@mimos.my © 2010 MIMOS Berhad. All Rights Reserved. Testing Excellence
  • 4.
    Project Background (4) testlab@mimos.my © 2010MIMOS Berhad. All Rights Reserved. Testing Excellence
  • 5.
    Six Sigma Overview Adisciplined, data-driven approach and methodology for eliminating defects (driving toward six standard deviations between the mean and the nearest specification limit) in any process -- from manufacturing to transactional and from product to service (www.isixsigma.com) Project scheduling Financial estimation VOC analysis Perform capability analysis Quantify issues & determine significant factors Identify failure modes Re-define significant factors Optimize model VERIFY Measurement system analysis D-M-A-D-V (DfSS) DESIGN Develop team charter & team Identify functional requirements vs ANALYZE Identify opportunity MEASURE DEFINE D-M-A-I-C Assess reliability of selected design Control plan Close project Generate concept model (5) testlab@mimos.my © 2010 MIMOS Berhad. All Rights Reserved. Testing Excellence
  • 6.
    Prior Studies onDefect Prediction (6) testlab@mimos.my © 2010 MIMOS Berhad. All Rights Reserved. Testing Excellence
  • 7.
    Findings & Discussion- Define Software Development Life Cycle (SDLC) – Test Participation Requirement Review Kick-Off Design Review Test Plan Test Cases Test Scripts Test Execution Defects Raising Test Summary Report (7) testlab@mimos.my © 2010 MIMOS Berhad. All Rights Reserved. Testing Excellence
  • 8.
    Findings & Discussion– Define (cont.) High Level Schematic Diagram Zero-Known Post Release Defects Defect Containment in Testing Phase Potential # of defects before test Actual # of defects after test Customer Satisfaction Quality of Process Level of satisfaction Project Management People capability Timeline allocation Process effectiveness Resource allocation (8) testlab@mimos.my © 2010 MIMOS Berhad. All Rights Reserved. Testing Excellence
  • 9.
    Findings & Discussion– Define (cont.) Detail Schematic Diagram – Y to X Tree Test Defect Prediction Software Complexity Knowledge Test Process Errors Fault Historical Defect Project Requirement Pages Developer Knowledge Test Case Design Coverage Requirement Error Requirement Fault Defect Severity Design Pages Tester Knowledge Targeted Total Test Cases Design Error Design Fault Defect Type/ Category Component Programming Language Test Automation CUT Error CUT Fault Defect Validity Application Code Size Test Case Execution Productivity Test Plan Error Integration Fault Total PR (Defects) Raised Total Effort in Test Design Phase Test Cases Error Test Case Fault Project Domain Project Thread Total Effort in Phases Prior to System Test Factors to consider (9) testlab@mimos.my © 2010 MIMOS Berhad. All Rights Reserved. Testing Excellence
  • 10.
    Findings & Discussion– Measure Data for Attribute Agreement Analysis TC TC ID Actual TC Result Tester 1 Tester 2 Tester 3 1 2 3 1 2 3 1 2 3 1 TC1 PASS PASS PASS PASS PASS PASS PASS PASS PASS PASS 2 TC2 FAIL FAIL FAIL FAIL FAIL FAIL FAIL PASS PASS PASS 3 TC3 FAIL FAIL FAIL FAIL FAIL FAIL FAIL PASS PASS PASS 4 TC4 PASS FAIL FAIL FAIL FAIL FAIL FAIL PASS PASS PASS 5 TC5 PASS PASS PASS PASS PASS PASS PASS PASS PASS PASS 6 TC6 PASS PASS PASS PASS PASS PASS PASS PASS PASS PASS 7 TC7 PASS PASS PASS PASS PASS PASS PASS PASS PASS PASS 8 TC8 FAIL FAIL FAIL FAIL FAIL FAIL FAIL FAIL FAIL FAIL 9 TC9 PASS PASS PASS PASS PASS PASS PASS PASS PASS PASS 10 TC10 PASS PASS PASS PASS PASS PASS PASS PASS PASS PASS ( 10 ) testlab@mimos.my © 2010 MIMOS Berhad. All Rights Reserved. Testing Excellence
  • 11.
    Findings & Discussion– Measure (cont.) Result of Attribute Agreement Analysis • Overall Result for MSA is PASS since Kappa value is greater than 0.7 or 70% • 3 Persons (Vivek, Sandeep and Kamala) PASS the MSA based on Kappa value of 0.7 or 70% • For the All Testers, the result is acceptable for accuracy of assessment against standard as the Kappa value is greater than 0.7 or 70% • Result is PASS for MSA Within Appraisers as the result shows 100% assessment agreement • Kappa = 1, which shows perfect agreement exist It demonstrates strong Repeatability of TestResult within tester himself/herself ( 11 ) testlab@mimos.my © 2010 MIMOS Berhad. All Rights Reserved. Testing Excellence
  • 12.
    Findings & Discussion– Analyze Data for Regression Analysis KLOC Total Test Cases Test Plan Error Test Case Error Automation % Test Effort 12 28.8 224 0 34 0 6.38 45.80 19 0 1 6.8 17 0 6 0 9.36 17.00 1 9 10 14 5.4 24 4 6 0 29.16 5.83 4 PROJECT D 7 12 2 1.1 25 4 9 0 13.17 7.00 0 PROJECT E 11 29 3 1.2 28 4 12 0 14.26 3.40 3 PROJECT F 0 2 7 6.8 66 1 7 0 32.64 31.00 16 PROJECT G 3 25 11 4.0 149 5 0 0 7.15 74.50 3 PROJECT H 4 9 2 0.2 24 4 0 0 18.78 7.67 0 PROJECT I 7 0 1 1.8 16 1 3 0 9.29 2.68 1 PROJECT J 1 7 2 2.1 20 1 4 0 6.73 1.95 0 PROJECT K 17 0 3 1.4 13 1 4 0 8.44 6.50 1 PROJECT L 3 0 0 1.3 20 1 7 0 14.18 9.75 1 PROJECT M 2 3 16 2.5 7 1 6 0 8.44 1.75 0 Project Name Req. Error Design Error CUT error PROJECT A 5 22 PROJECT B 0 PROJECT C Test Functional Execution Defects Productivity ( 12 ) testlab@mimos.my © 2010 MIMOS Berhad. All Rights Reserved. Testing Excellence
  • 13.
    Findings & Discussion– Analyze (cont.) Best Multiple Regression Result • P-value for selected individual predictors shows significant relationship with the Y (defects) which has value of less than 0.05 • R-sq and R-sq shows strong value which is more than 90% ( 13 ) testlab@mimos.my © 2010 MIMOS Berhad. All Rights Reserved. Testing Excellence
  • 14.
    Findings & Discussion– Design • Revise the predictors to generate prediction model that is logical and makes sense from the viewpoint of software practitioner • Filter the metrics to contain only valid data in order to generate the model • Reduced the model to have only coefficients that have logical correlation to the response (Defect) • Revisit the model to identify suitable response of the regression equation: Functional Defects or All Defects Revised Data for Regression Analysis TOTAL TEST REQ. DESIGN TOTAL TEST DESIGN TEST CASES PAGE PAGE EFFORT EFFORT CASES ERROR REQ . ERROR DESIGN ERROR CUT ERROR KLOC FUNCTIONAL DEFECTS ALL DEFECTS PROJECT A 5 22 12 28.8 81 121 224 34 16.79 15.20 19 19 PROJECT B 0 0 1 6.8 171 14 17 6 45.69 40.91 1 1 PROJECT C 9 10 14 5.4 23 42 24 6 13.44 13.44 4 4 PROJECT D 7 12 2 1.1 23 42 25 9 4.90 4.90 0 0 PROJECT E 11 29 3 1.2 23 54 28 12 4.72 4.59 3 3 PROJECT F 0 2 7 6.8 20 70 66 7 32.69 16.00 16 27 PROJECT G 3 25 11 4.0 38 131 149 0 64.00 53.50 3 3 PROJECT H 4 9 2 0.2 26 26 24 0 5.63 5.63 0 0 PROJECT I 17 0 3 1.4 15 28 13 4 9.13 7.88 1 1 PROJECT J 61 34 24 36 57 156 306 16 89.42 76.16 25 28 PROJECT K 32 16 19 12.3 162 384 142 0 7.00 7.00 12 12 PROJECT L 0 2 3 3.8 35 33 40 3 8.86 8.86 6 6 PROJECT M 15 18 10 26.1 88 211 151 22 30.99 28.61 39 57 PROJECT N 0 4 0 24.2 102 11 157 0 41.13 28.13 20 33 PROJECT ( 14 ) testlab@mimos.my © 2010 MIMOS Berhad. All Rights Reserved. Testing Excellence
  • 15.
    Findings & Discussion– Design (cont.) Y Functional Defects Y All Defects Xs Requirement Error, CUT Error, KLOC, Requirement Pages, Design Pages, Targeted Total Test Cases, Total Effort Days Xs Requirement Error, CUT Error, KLOC, Requirement Pages, Design Pages, Targeted Total Test Cases, Total Effort Days Y Functional Defects Y All Defects Xs Requirement Error, CUT Error, KLOC, Requirement Pages, Design Pages, Targeted Total Test Cases, Total Effort Days in Test Design Xs Requirement Error, CUT Error, KLOC, Requirement Pages, Design Pages, Targeted Total Test Cases, Total Effort Days in Test Design ( 15 ) testlab@mimos.my © 2010 MIMOS Berhad. All Rights Reserved. Testing Excellence
  • 16.
    Findings & Discussion– Verify • • • Verification was done by applying the selected model on new/fresh project that have yet to go for System Test The actual defects found after System Test completed are compared against the predicted defects Verify that actual defects fall between 95% prediction interval of the model Revised Data for Regression Analysis Y Functional Defect All Defect Functional Defect All Defect Effort Predictors All Tester Effort Prior to System Test All Tester Effort Prior to System Test All Tester Effort in Test Design Prior to System Test All Tester Effort in Test Design Prior to System Test Project Predicted Defects Actual Defects 95% CI (min, max) 95% PI (min, max) Agrimall Beta Release 182 187 (155, 210) (155, 210) Grid Workflow 6 1 (0, 12) (0, 14) TTS-English 1 1 (0, 3) (0, 6) Agrimall Beta Release 298 230 (242, 355) (241, 356) Grid Workflow 9 9 (0, 21) (0, 24) TTS-English 2 1 (0, 6) (0, 12) Agrimall Beta Release 183 187 (202, 390) (201, 392) Grid Workflow 8 1 (0, 17) (0, 19) TTS-English 2 1 (0, 5) (0, 9) Agrimall Beta Release 296 230 (142, 224) (142, 225) Grid Workflow 11 9 (0, 32) (0, 37) TTS-English 3 1 (0, 10) (0, 19) ( 16 ) testlab@mimos.my © 2010 MIMOS Berhad. All Rights Reserved. Testing Excellence
  • 17.
    Findings & Discussion– Verify (cont.) PROPOSED MODEL Functional Defects (Y) = 4.00 - 0.204 Req. Error - 0.631 CUT Error + 1.90 KLOC 0.140 Req. Page + 0.125 Design Page - 0.169 Total Test Cases + 0.221 Effort Days Verify against new project: No Req. Error CUT Error KLOC Req. Page Des. Page Total TC Effort Days 1. 12 6 84.03 75 293 102 69.75 2. 49 15 8.69 64 38 65 91.9 3. 0 1 0.4 10 10 18 1.13 Prediction result *: No Predicted Functional Defects Actual Functional Defects 95% CI (min, max) 95% PI (min, max) 1. 182 187 (155, 209) (154, 209) 2. 6 1 (0, 12) (0, 14) 3. 1 1 (0, 3) (0, 6) * The actual functional defects were raised after both functional and ad-hoc testing completed ( 17 ) testlab@mimos.my © 2010 MIMOS Berhad. All Rights Reserved. Testing Excellence
  • 18.
    Findings & Discussion– Verify (cont.) ( 18 ) testlab@mimos.my © 2010 MIMOS Berhad. All Rights Reserved. Testing Excellence
  • 19.
    Conclusion & Recommendation CONCLUSION •Defect prediction model for testing phase can be constructed using identified factors via multiple regression • Significant factors contributed to defects found in testing phase have been discovered • Six Sigma can be used to develop test defect prediction model • Test defect prediction model does contribute to zero-known post release defects and test process improvement RECOMMENDATION • To consider other factors that contribute in predicting defects • To improve model by being able to predict defect based on different severity • To predict defects to be found against time • To predict defects based on different type of software ( 19 ) testlab@mimos.my © 2010 MIMOS Berhad. All Rights Reserved. Testing Excellence
  • 20.
    Experience our TestingExcellence in “End-to-End Testing Strategies” Workshop See you again on 17th June 2010, 2.00 pm, Room 301 THANK YOU testlab@mimos.my testlab@mimos.my © 2010 MIMOS Berhad. All Rights Reserved. Testing Excellence

Editor's Notes

  • #6 Applications of Six Sigma that focus on the design or redesign of products and services and their enabling processes so that from the beginning customer needs and expectations are fulfilled