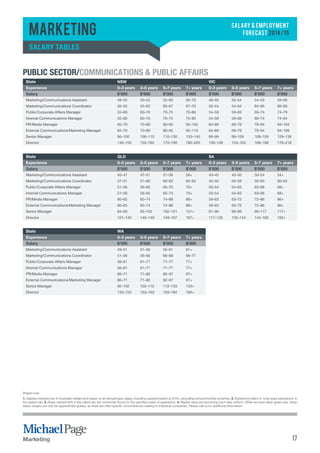
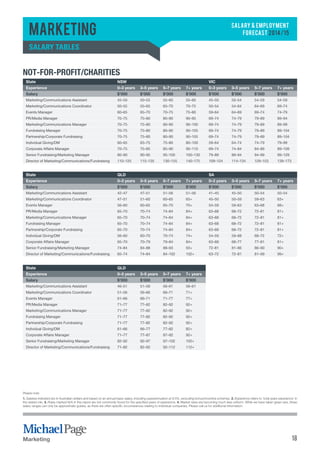
MARKETING 
E N C YCO N S T R U C T I O N D I G I T A L E N G I N E E R I N G F I N A N C E F I N A N C I A L S E R V I C E S H O S P I T A L I T Y & L E I S U M A N R E S O U R C E S L E G A L M A N U FAC T U R I N G M A R K E T I N G M I N I N G & R E S O U R C E S O I L & G A S P R O C U R E T P R O P E R T Y R E T A I L S A L E S S U P P LYC H A I N & LO G I S T I C S T E C H N O LOGYM A R K E T I N GAG E N C YCO N S T R I O N D I G I T A L E N G I N E E R I N G F I N A N C E F I N A N C I A L S E R V I C E S H O S P I T A L I T Y & L E I S U R E H U M A N R E S O U R L E G A L M A N U FAC T U R I N G M A R K E T I N G M I N I N G & R E S O U R C E S O I L & G A S P R O C U R E M E N T P R O P E R T Y R I L S A L E S S U P P LYC H A I N & LO G I S T I C S T E C H N O LOGYAG E N C YCO N S T R U C T I O N D I G I T A L E N G I N E E R I N G A N C E F I N A N C I A L S E R V I C E S H O S P I T A L I T Y & L E I S U R E H U M A N R E S O U R C E S L E G A L M A N U FAC T U R I N G M N G & R E S O U R C E S O I L & G A S P R O C U R E M E N T P R O P E R T Y R E T A I L S A L E S S U P P LYC H A I N & LO G I S T I C S T E C LOGYAG E N C YCO N S T R U C T I O N D I G I T A L E N G I N E E R I N G F I N A N C E F I N A N C I A L S E R V I C E S H O S P I T A L I T E I S U R E H U M A N R E S O U R C E S L E G A L M A N U FAC T U R I N G M A R K E T I N G M I N I N G & R E S O U R C E S O I L & G A S C U R E M E N T P R O P E R T Y R E T A I L S A L E S S U P P LYC H A I N & LO G I S T I C S T E C H N O LOGYAG E N C YCO N S T R U N D I G I T A L E N G I N E E R I N G F I N A N C E F I N A N C I A L S E R V I C E S H O S P I T A L I T Y & L E I S U R E H U M A N R E S O U R C E A L M A N U FAC T U R I N G M A R K E T I N G M I N I N G & R E S O U R C E S O I L & G A S P R O C U R E M E N T P R O P E R T Y R E T A A L E S S U P P LYC H A I N & LO G I S T I C S T E C H N O LOGYAG E N C YCO N S T R U C T I O N M A R K E T I N G D I G I T A L E N G R I N G F I N A N C E F I N A N C I A L S E R V I C E S H O S P I T A L I T Y & L E I S U R E H U M A N R E S O U R C E S L E G A L M A N U FAC N G M I N I N G & R E S O U R C E S O I L & G A S P R O C U R E M E N T P R O P E R T Y R E T A I L S A L E S S U P P LYC H A I N & LO G I S T E C H N O LOGYAG E N C YCO N S T R U C T I O N D I G I T A L E N G I N E E R I N G F I N A N C E F I N A N C I A L S E R V I C E S H O S L I T Y & L E I S U R E H U M A N R E S O U R C E S L E G A L M A N U FAC T U R I N G M A R K E T I N G M I N I N G & R E S O U R C E S O A S P R O C U R E M E N T P R O P E R T Y R E T A I L S A L E S S U P P LYC H A I N & LO G I S T I C S T E C H N O LOGYAG E N C YCON 
R U C T I O N D I G I T A L E N G I N E E R I N G F I N A N C E F I N A N C I A L S E R V I C E S H O S P I T A L I T Y & L E I S U R E H U M A N R E R C E S L E G A L M A N U FAC T U R I N G M A R K E T I N G M I N I N G & R E S O U R C E S O I L & G A S P R O C U R E M E N T P R O P R E T A I L S A L E S S U P P LYC H A I N & LO G I S T I C S T E C H N O LOGYAG E N C YCO N S T R U C T I O N D I G I T A L E N G I N E G F I N A N C E F I N A N C I A L S E R V I C E S H O S P I T A L I T Y & L E I S U R E H U M A N R E S O U R C E S L E G A L M A N U FAC T U R M A R K E T I N G M I N I N G & R E S O U R C E S O I L & G A S P R O C U R E M E N T P R O P E R T Y R E T A I L S A L E S S U P P LYC H A I LO G I S T I C S T E C H N O LOGYAG E N C YCO N S T R U C T I O N D I G I T A L E N G I N E E R I N G F I N A N C E F I N A N C I A L S E R S H O S P I T A L I T Y & L E I S U R E H U M A N R E S O U R C E S L E G A L M A N U FAC T U R I N G M A R K E T I N G M I N I N G & R E S C E S O I L & G A S P R O C U R E M E N T P R O P E R T Y R E T A I L S A L E S S U P P LYC H A I N & LO G I S T I C S T E C H N O LOGYAG 
C YCO N S T R U C T I O N D I G I T A L E N G I N E E R I N G F I N A N C E F I N A N C I A L S E R V I C E S H O S P I T A L I T Y & L E I S U R E H A N R E S O U R C E S L E G A L M A N U FAC T U R I N G M A R K E T I N G M I N I N G & R E S O U R C E S O I L & G A S P R O C U R E M E R O P E R T Y R E T A I L S A L E S S U P P LYC H A I N & LO G I S T I C S T E C H N O LOGYAG E N C YCO N S T R U C T I O N 1 
D I G I T A G I N E E R I N G F I N A N C E F I N A N C I A L S E R V I C E S H O S P I T A L I T Y & L E I S U R E H U M A N R E S O U R C E S L E G A L M A N FAC T U R I N G M A R K E T I N G M I N I N G & R E S O U R C E S O I L & G A S P R O C U R E M E N T P R O P E R T Y R E T A I L S A L E S S U Marketing 
SALARY & EMPLOYMENT 
FORECAST 2014/15 Marketing 
SALARY & EMPLOYMENT 
FORECAST 
Marketing
2 
Marketing 
SALARY & EMPLOYMENT 
FORECAST 2014/15 recruitment activity 
Marketing 
YES 
29% 
NO 
61% 
UNSURE 
10% 
Strength of current hiring activity compared to the 
last 12 months 
Expecting to increase headcount 
Stronger (8%) 
Slightly stronger (19%) 
Steady (53%) 
Slightly weaker (12%) 
Weaker (8%) 
Market observations: 
• Hiring for marketing talent is currently strong, despite a drop in 
permanent headcount for this skill set over the last 12 months. This 
is expected to stabilise in the coming year, as businesses remain 
conservative on increasing headcount. 
• The majority of jobs available for marketing professionals are 
replacement roles rather than newly created positions. Companies are 
looking to consolidate teams and backfill roles that have been vacant 
as a result of recent hiring freezes. There is minimal growth in the 
industry. 
• Hiring of marketing professionals is strongest in the service industry 
(including finance, banking and IT&T), consumer and FMCG as well 
as government and non-profit. These areas have been conservative 
for some time, and employers are taking advantage of a more stable 
economic market to rebuild their teams. 
• Government departments are currently investing more heavily in their 
communications team, in preparation for upcoming general State 
elections and post-budget activity. 
• Non-profit organisations are investing in fundraising professionals to 
diversify income streams. Charities are becoming more commercially 
focused and are looking for talent outside of the charity sector, 
diversifying their candidate search. 
• The competitive marketplace has led to many organisations placing 
more value on marketing activity and brand positioning. Professionals 
with analytics skills are in high demand, as these roles assist 
companies to better understand and target customers – a major focus 
within marketing over the past 12 months. 
• There is still a heavy focus on marketing teams proving return on 
investment to justify headcount, which has seen the industry become 
more data-driven over the past few years. 
• Customer acquisition and retention is a major priority in an uncertain 
economic market and this has led to increasing requirement for 
specialist professionals in those fields. Likewise, marketing and brand 
management skills are in high demand by employers. 
• There is currently also a strong requirement for professionals with 
experience in communications, as companies seek to refine both 
internal and external brand messages. Internal communications 
continue to play a vital role in staff engagement in the wake of hiring 
freezes and restructures. 
• In the past 12 months, the number of marketing professionals 
returning from overseas has increased by 10–20%. However, this is 
being measured from a relatively low base, as the past few years have 
seen fewer professionals returning. 
Note: All infographics in this report are based on the views of survey participants. The accompanying market commentary is based on the experience and observations of the Michael Page team.
3 
Marketing 
SALARY & EMPLOYMENT 
FORECAST 2014/15 Experience level expected to be in highest demand 
Skills shortage placing upwards pressure on salaries 
Marketing 
Expectation of a professional skills shortage in the next 
12 months 
Yes 
Impact of skills shortage on businesses in Australia over 
the next 12 months 
Entry level 
Mid level 
Management 
6% 
76% 
18% 
12% 
RECRUITMENT ACTIVITY 
24% 
Unsure 
No 
10% 
66% 
Yes, it will cause salaries to rise 
above the inflation rate (50%) 
Yes, salaries will increase but 
only at the rate of inflation (43%) 
No, the skills shortage will not 
impact salary levels (7%) 
21% 
It will be 
difficult to 
maintain 
headcount 
Need to 
develop more 
targeted 
attraction 
strategies 
29% 
14% 
Source 
talent from 
overseas 
36% 
Stronger 
focus on 
retaining 
staff
4 
Marketing 
SALARY & EMPLOYMENT 
FORECAST 2014/15 RECRUITMENT ACTIVITY 
Regions companies operate in* How Australian business is faring in comparison with 
21% 
22% 
6% 
Marketing 
Asia operations 
Australia only 
Asia Pacific 
US 
Europe 
75% 
45% 
32% 
28% 
17% Other 
Much stronger (28%) 
Marginally stronger (15%) 
About the same (12%) 
Marginally weaker (15%) 
Much weaker (15%) 
Unsure (15%) 
Salary and remuneration 
Salary increases over the next 12 months Average percentage salary increase over the next 12 months 
All my employees will receive the same percentage increase 
51% 
All my employees will receive an increase, but it will vary according to performance 
Only my best-performing employees will receive an increase 
No one in my team will receive an increase 
0% - 2% 
2% - 3% 
3% - 4% 
4% - 6% 
3% 
48% 
26% 
20% 
6% - 8% 3% 
Market observations: 
• Salary and remuneration rates have remained consistent over the past 
12 months, and there is no discernible difference between states. 
• Professionals with both digital and marketing experience will be 
able to command above-average salary increases over the next 
12 months. Companies are willing to invest in these skills to 
strengthen their digital proposition. 
* More than one option could be selected.
5 
Marketing 
SALARY & EMPLOYMENT 
FORECAST 2014/15 Factor most likely to impact salary levels in the next 
12 months 
40% Individual, team or company performance 
22% 
11% 
9% 
8% 
5% 
3% 
2% 
Marketing 
Domestic economic conditions 
Inflation 
Competition with other companies 
Global economic conditions 
Not sure 
Other* 
Don’t expect any factors to impact salaries 
*Government funding, etc. 
Flexible salary packaging or fringe benefits offered 
to employees 
Companies providing bonuses as part of the 
remuneration package 
YES 
57% 
NO 
43% 
Salary and remuneration 
57% 
43% 
Basis for bonuses over the next 12 months 
Team performance Other** 
5% 5% 
Individual performance 
Combination of all 
Company performance 
24% 
19% 
47% 
**combination of individual and team performance, etc.
5% 3% 
Overseas 
opportu-nities 
6 
Marketing 
SALARY & EMPLOYMENT 
FORECAST 2014/15 Salary and remuneration 
Average percentage bonus of gross salary 
1% - 5% 
6% - 10% 
11% - 15% 
16% - 20% 
YES 
Marketing 
19% 
24% 
14% 
29% 
21% - 30% 14% 
Attraction and retention 
Employer expectations for staff turnover in the next 
12 months 
65% 
NO 
23% 
UNSURE 
12% 
Key reasons employees are likely to leave 
$ 
29% 26% 
Other* Improve 
salary 
Better 
training and 
support 
29% 
Broaden 
experience/ 
opportunity 
to learn 
5% 
Achieve 
better 
work/life 
balance 
3% 
Gain more 
seniority 
*contracts will not be renewed, pressure to perform, poor performance, etc. 
Most popular tools for attraction and retention 
Market observation: 
• A sign-on bonus is a popular attraction strategy to secure talented 
professionals. Retention strategies include offering a loyalty bonus 
based on length of employment and accelerated career progression 
opportunities. 
Strong company culture 
Work/life balance initiatives 
Recognition and rewards 
Structured career progression 
Global career opportunities 
48% 
17% 
14% 
10% 
5% 
Training and mentoring partnerships 3% 
Other*** 3% 
***challenging and rewarding roles, etc.
7 
Marketing 
SALARY & EMPLOYMENT 
FORECAST 2014/15 Attraction and retention 
Most popular options offered to support employees’ 
work/life balance* 
Sabbaticals 
Marketing 
Alternative leave options 
(e.g. volunteering) 
Team building/offsite activities 
Other** 
Increased maternity/paternity leave 
**health and wellbing opportunities, purchased leave, etc. 
Flexible working 
arrangements 
7% 
41% 
19% 
78% 
42% 
15% 
* More than one option could be selected. 
Combination of benefits offered to employees* 
83% Mobile phone 
46% 
39% 
27% 
24% 
19% 
14% 
14% 
8% 
Parking 
Personal laptop 
Company car 
Higher superannuation contribution 
Other*** 
Healthcare/health insurance 
Income protection insurance 
Travel pass 
***education/tuition fee packaging, wellness program/gym, salary sacrifice, etc. 
working hours 
Average weekly working hours 
Less than 37.5 hours 37.5-40 hours 40-45 hours 45-50 hours 
7% 45% 25% 18% 
50 hours or more 
5%
SALARY & EMPLOYMENT 
FORECAST 2014/15 
Marketing 
Salary tables 
Consumer Goods 
State NSW VIC 
Experience 0–3 years 3–5 years 5–7 years 7+ years 0–3 years 3–5 years 5–7 years 7+ years 
Salary $’000 $’000 $’000 $’000 $’000 $’000 $’000 $’000 
Marketing Assistant 52–68 55–68 60–70 70–80 51–67 54–67 59–69 69–79 
Assistant Brand Manager 65–78 68–80 70–82 75–85 64–77 67–79 69–81 74–84 
Brand Manager 85–135 115–140 115–145 115–145 84–134 114–139 114–144 114–144 
Senior Brand Manager 105–162 128–165 128–168 130–170 104–160 127–163 127–166 129–168 
Market Research/Insights Manager 112–157 145–165 145–170 150–170 111–155 144–163 144–168 149–168 
Innovation Manager 123–163 152–165 155–170 160–170 122–161 150–163 153–168 158–168 
Senior Marketing Manager 142–162 148–168 155–175 155–180 141–160 147–166 153–173 153–178 
Marketing Director 185–255 225–255 255–275 260–285 183–252 223–252 252–272 257–282 
State QLD SA 
Experience 0–3 years 3–5 years 5–7 years 7+ years 0–3 years 3–5 years 5–7 years 7+ years 
Salary $’000 $’000 $’000 $’000 $’000 $’000 $’000 $’000 
Marketing Assistant 48–63 51–63 56–65 65–74 47–61 50–61 5–63 63–72 
Assistant Brand Manager 60–73 63–74 65–76 70–79 59–70 61–72 63–74 68–77 
Brand Manager 79–126 107–130 107–135 107–135 77–122 104–126 104–131 104–131 
Senior Brand Manager 98–151 119–153 119–156 121–158 95–146 115–149 115–151 117–153 
Market Research/Insights Manager 104–146 135–153 135–158 140–158 101–141 131–149 131–153 135–153 
Innovation Manager 114–152 141–153 144–158 149–158 111–147 137–149 140–153 144–153 
Senior Marketing Manager 132–151 138–156 144–163 144–167 128–146 133–151 140–158 140–162 
Marketing Director 172–237 209–237 237–256 242–265 167–230 203–230 230–248 234–257 
State WA 
Experience 0–3 years 3–5 years 5–7 years 7+ years 
Salary $’000 $’000 $’000 $’000 
Marketing Assistant 53–69 56–69 61–71 71–82 
Assistant Brand Manager 66–80 69–82 71–84 77–87 
Brand Manager 87–138 117–143 117–148 117–148 
Senior Brand Manager 107–165 131–168 131–171 133–173 
Market Research/Insights Manager 114–160 148–168 148–173 153–173 
Innovation Manager 125–166 155–168 158–173 163–173 
Senior Marketing Manager 145–165 151–171 158–179 158–184 
Marketing Director 189–260 230–260 260–281 265–291 
Please note: 
1. Salaries indicated are in Australian dollars and based on an annual basic salary, including superannuation at 9.5%, excluding bonus/incentive schemes. 2. Experience refers to ‘total years experience’ in 
the stated role. 3. Roles marked N/A in this report are not commonly found for the specified years of experience. 4. Market rates are becoming much less uniform. While we have taken great care, these 
salary ranges can only be approximate guides, as there are often specific circumstances relating to individual companies. Please call us for additional information. 
Marketing 8
SALARY & EMPLOYMENT 
FORECAST 2014/15 
Marketing 
Salary tables 
Financial Services 
State NSW VIC 
Experience 0–3 years 3–5 years 5–7 years 7+ years 0–3 years 3–5 years 5–7 years 7+ years 
Salary $’000 $’000 $’000 $’000 $’000 $’000 $’000 $’000 
Market Analyst 58–68 70–90 100–110 110–125 57–67 69–89 99–109 109–124 
Marketing Assistant 52–67 63–73 70–85 75–90 51–66 62–72 69–84 74–89 
Marketing Executive 60–70 65–80 75–85 70–95 59–69 64–79 74–84 69–94 
Campaign Manager 70–90 90–110 95–120 105–120 69–89 89–109 94–119 104–119 
Assistant Product Manager 75–85 80–90 85–100 90–110 74–84 79–89 84–99 89–109 
Senior Market Analyst 85–95 90–110 95–125 124–145 84–94 89–109 94–124 123–144 
Marketing Manager 95–115 100–120 110–130 130–155 94–114 99–119 109–129 129–153 
Direct Marketing Manager 95–115 100–120 110–130 130–145 94–114 99–119 109–129 129–144 
Communications Manager 95–115 100–120 110–130 130–145 94–114 99–119 109–129 129–144 
Research Manager 95–110 110–125 125–135 130–140 94–109 109–124 124–134 129–139 
Product Manager 95–120 100–120 110–140 130–160 94–119 99–119 109–139 129–158 
Senior Product Manager 125–140 125–150 140–165 160–180 124–139 124–149 139–163 158–178 
Senior Marketing Manager 125–145 140–155 145–170 150–185 124–144 139–153 144–168 149–183 
Head of Marketing 150–170 160–180 170–190 180–210 149–168 158–178 168–188 178–208 
State QLD SA 
Experience 0–3 years 3–5 years 5–7 years 7+ years 0–3 years 3–5 years 5–7 years 7+ years 
Salary $’000 $’000 $’000 $’000 $’000 $’000 $’000 $’000 
Market Analyst 54–63 65–84 93–102 116+ 52–61 63–81 90–99 113+ 
Marketing Assistant 48–62 59–68 65–79 70–84 47–60 57–66 63–77 68–81 
Marketing Executive 56–65 60–74 70–79 65–88 54–63 59–72 68–77 63–86 
Campaign Manager 65–84 84–102 88–112 98–112 63–81 81–99 86–108 95–108 
Assistant Product Manager 70–79 74–84 79–93 84–102 68–77 72–81 77–90 81–99 
Senior Market Analyst 79–88 84–102 88–116 116+ 77–86 81–99 86–113 113+ 
Marketing Manager 88–107 93–112 102–121 121+ 86–104 90–108 99–117 117+ 
Direct Marketing Manager 88–107 93–112 102–121 121+ 86–104 90–108 99–117 117+ 
Communications Manager 88–107 93–112 102–121 121+ 86–104 90–108 99–117 117+ 
Research Manager 88–102 102–116 116–126 121+ 86–99 99–113 113–122 117+ 
Product Manager 88–112 93–112 102–130 121+ 86–108 90–108 99–126 117+ 
Senior Product Manager 116–130 116–140 140–149 149+ 113–126 113–135 135–144 144+ 
Senior Marketing Manager 116–135 130–144 135–153 140+ 113–131 126–140 131–149 135+ 
Head of Marketing 140–158 149–167 158–172 167+ 135–153 144–162 153–167 162+ 
Please note: 
1. Salaries indicated are in Australian dollars and based on an annual basic salary, including superannuation at 9.5%, excluding bonus/incentive schemes. 2. Experience refers to ‘total years experience’ in 
the stated role. 3. Roles marked N/A in this report are not commonly found for the specified years of experience. 4. Market rates are becoming much less uniform. While we have taken great care, these 
salary ranges can only be approximate guides, as there are often specific circumstances relating to individual companies. Please call us for additional information. 
Marketing 9
SALARY & EMPLOYMENT 
FORECAST 2014/15 
Marketing 
Salary tables 
Financial Services (continued) 
State WA 
Experience 0–3 years 3–5 years 5–7 years 7+ years 
Salary $’000 $’000 $’000 $’000 
Market Analyst 59–69 71–92 102–112 128+ 
Marketing Assistant 53–68 64–74 71–87 77–92 
Marketing Executive 61–71 66–82 77–87 71–97 
Campaign Manager 71–92 92–112 97–122 107–122 
Assistant Product Manager 77–87 82–92 87–102 92–112 
Senior Market Analyst 87–97 92–112 97–128 128+ 
Marketing Manager 97–117 102–122 112–133 133+ 
Direct Marketing Manager 97–117 102–122 112–133 133+ 
Communications Manager 97–117 102–122 112–133 133+ 
Research Manager 97–112 112–128 128–138 133+ 
Product Manager 97–122 102–122 112–143 133+ 
Senior Product Manager 128–143 128–153 153–163 163+ 
Senior Marketing Manager 128–148 143–158 148–168 153+ 
Head of Marketing 153–173 163–184 173–189 184+ 
Media & Entertainment 
State NSW VIC 
Experience 0–3 years 3–5 years 5–7 years 7+ years 0–3 years 3–5 years 5–7 years 7+ years 
Salary $’000 $’000 $’000 $’000 $’000 $’000 $’000 $’000 
Marketing Assistant 45–60 55–65 55–65 55–65 45–59 54–64 54–64 54–64 
Marketing Executive 50–65 60–70 60–70 60–70 50–64 59–69 59–69 59–69 
Assistant Product Manager 55–65 60–70 60–70 60–70 54–64 59–69 59–69 59–69 
PR Manager 70–90 70–100 80–110 100–120 69–89 69–99 79–109 99–119 
Sponsorship Manager 65–90 70–100 75–110 100–120 64–89 69–99 74–109 99–119 
Product Manager 75–95 80–100 90–105 90–110 74–94 79–99 89–104 89–109 
Web/Internet Manager 80–95 85–110 90–125 105–130 79–94 84–109 89–124 104–129 
Communications Manager 85–100 85–110 90–120 110–140 84–99 84–109 89–119 109–139 
Marketing Director 145–160 155–180 165–190 205–245 144–158 153–178 163–188 203–243 
State QLD SA 
Experience 0–3 years 3–5 years 5–7 years 7+ years 0–3 years 3–5 years 5–7 years 7+ years 
Salary $’000 $’000 $’000 $’000 $’000 $’000 $’000 $’000 
Marketing Assistant 42–56 51–60 51–60 51–60 41–54 50–59 50–59 50–59 
Marketing Executive 47–60 56–65 56–65 56–65 45–59 54–63 54–63 54–63 
Assistant Product Manager 51–60 56–65 56–65 56–65 50–59 54–63 54–63 54–63 
PR Manager 65–84 65–93 74–102 93–112 63–81 63–90 72–99 90–108 
Sponsorship Manager 60–84 65–93 70–102 93–112 59–81 63–90 68–99 90–108 
Product Manager 70–88 74–93 84–98 84–98 68–86 72–90 81–95 81–95 
Web/Internet Manager 74–88 79–102 84–112 93–112 72–86 77–99 81–108 90–108 
Communications Manager 79–93 79–102 84–112 102–130 77–90 77–99 81–108 99–126 
Marketing Director 135–149 144–167 153–177 149–186 131–144 140–162 149–171 144–180 
Please note: 
1. Salaries indicated are in Australian dollars and based on an annual basic salary, including superannuation at 9.5%, excluding bonus/incentive schemes. 2. Experience refers to ‘total years experience’ in 
the stated role. 3. Roles marked N/A in this report are not commonly found for the specified years of experience. 4. Market rates are becoming much less uniform. While we have taken great care, these 
salary ranges can only be approximate guides, as there are often specific circumstances relating to individual companies. Please call us for additional information. 
Marketing 10
SALARY & EMPLOYMENT 
FORECAST 2014/15 
Marketing 
Salary tables 
Media & Entertainment (continued) 
State WA 
Experience 0–3 years 3–5 years 5–7 years 7+ years 
Salary $’000 $’000 $’000 $’000 
Marketing Assistant 46–61 56–66 56–66 56–66 
Marketing Executive 51–66 61–71 61–71 61–71 
Assistant Product Manager 56–66 61–71 61–71 61–71 
PR Manager 71–92 71–102 82–112 102–122 
Sponsorship Manager 66–92 71–102 77–112 102–122 
Product Manager 77–97 82–102 92–107 92–107 
Web/Internet Manager 82–97 87–112 92–122 102–122 
Communications Manager 87–102 87–112 92–122 112–143 
Marketing Director 148–163 158–184 168–194 163–204 
IT&T 
State NSW VIC 
Experience 0–3 years 3–5 years 5–7 years 7+ years 0–3 years 3–5 years 5–7 years 7+ years 
Salary $’000 $’000 $’000 $’000 $’000 $’000 $’000 $’000 
Marketing Assistant 45–60 55–65 55–65 55–65 45–59 54–64 54–64 54–64 
Marketing Executive 55–65 65–75 70–90 70–90 54–64 64–74 69–89 69–89 
Marketing Communications Specialist 55–65 65–75 70–90 70–90 54–64 64–74 69–89 69–89 
Marketing Analyst 65–75 70–90 80–100 85–110 64–74 69–89 79–99 84–109 
CRM Analyst 65–75 70–90 80–105 85–120 64–74 69–89 79–104 84–119 
Channel Marketing Manager 90–110 95–120 105–135 110–140 89–109 94–119 104–134 109–139 
Direct Marketing Manager 90–110 95–120 105–135 110–140 89–109 94–119 104–134 109–139 
Communications Manager 90–110 95–120 105–135 110–145 89–109 94–119 104–134 109–144 
Assistant Product Manager 70–85 80–95 85–95 90–105 69–84 79–94 84–94 89–104 
Product Manager 90–100 95–120 110–140 115–145 89–99 94–119 109–139 114–144 
Senior Product Manager 110–130 120–140 130–160 135–165 109–129 119–139 129–158 134–163 
Research Manager 100–110 110–120 115–125 120–135 99–109 109–119 114–124 119–134 
Senior Marketing Manager 115–130 125–140 130–160 145–175 114–129 124–139 129–158 144–173 
Marketing Director 140–155 150–170 175–195 200–255 139–153 149–168 173–193 198–252 
State QLD SA 
Experience 0–3 years 3–5 years 5–7 years 7+ years 0–3 years 3–5 years 5–7 years 7+ years 
Salary $’000 $’000 $’000 $’000 $’000 $’000 $’000 $’000 
Marketing Assistant 42–56 51–60 51–60 51–60 41–54 50–59 50–59 50–59 
Marketing Executive 51–60 60–70 65–84 65–84 50–59 59–68 63–81 63–81 
Marketing Communications Specialist 51–60 60–70 65–84 65–84 50–59 59–68 63–81 63–81 
Marketing Analyst 60–70 65–84 74–93 79–102 59–68 63–81 72–90 77–99 
CRM Analyst 60–70 65–84 74–93 79–102 59–68 63–81 72–90 77–99 
Channel Marketing Manager 84–102 88–112 98–126 102–130 81–99 86–108 95–122 99–126 
Direct Marketing Manager 84–102 88–112 98–126 102–130 81–99 86–108 95–122 99–126 
Communications Manager 84–102 88–112 98–126 102–135 81–99 86–108 95–122 99–131 
Assistant Product Manager 65–79 74–88 79–88 84–98 63–77 72–86 77–86 81–95 
Product Manager 84–93 88–112 102–130 107–135 81–90 86–108 99–126 104–131 
Senior Product Manager 102–121 112–130 121–149 126–153 99–117 108–126 117–144 122–149 
Research Manager 93–102 102–112 107–116 112–126 90–99 99–108 104–113 108–122 
Senior Marketing Manager 107–121 116–130 121–149 135–163 104–117 113–126 117–144 131–158 
Marketing Director 130–144 140–158 149–158 158+ 126–140 135–153 144–153 153+ 
Please note: 
1. Salaries indicated are in Australian dollars and based on an annual basic salary, including superannuation at 9.5%, excluding bonus/incentive schemes. 2. Experience refers to ‘total years experience’ in 
the stated role. 3. Roles marked N/A in this report are not commonly found for the specified years of experience. 4. Market rates are becoming much less uniform. While we have taken great care, these 
salary ranges can only be approximate guides, as there are often specific circumstances relating to individual companies. Please call us for additional information. 
Marketing 11
SALARY & EMPLOYMENT 
FORECAST 2014/15 
Marketing 
Salary tables 
IT&T (continued) 
State WA 
Experience 0–3 years 3–5 years 5–7 years 7+ years 
Salary $’000 $’000 $’000 $’000 
Marketing Assistant 46–61 56–66 56–66 56–66 
Marketing Executive 56–66 66–77 71–92 71–92 
Marketing Communications Specialist 56–66 66–77 71–92 71–92 
Marketing Analyst 66–77 71–92 82–102 87–112 
CRM Analyst 66–77 71–92 82–102 87–112 
Channel Marketing Manager 92–112 97–122 107–138 112–143 
Direct Marketing Manager 92–112 97–122 107–138 112–143 
Communications Manager 92–112 97–122 107–138 112–148 
Assistant Product Manager 71–87 82–97 87–97 92–107 
Product Manager 92–102 97–122 112–143 117–148 
Senior Product Manager 112–133 122–143 133–163 138–168 
Research Manager 102–112 112–122 117–128 122–138 
Senior Marketing Manager 117–133 128–143 133–163 148–179 
Marketing Director 143–158 153–173 163–173 173+ 
Professional Services 
State NSW VIC 
Experience 0–3 years 3–5 years 5–7 years 7+ years 0–3 years 3–5 years 5–7 years 7+ years 
Salary $’000 $’000 $’000 $’000 $’000 $’000 $’000 $’000 
Business Development Coordinator 45–55 55–70 70–80 70–80 45–54 54–69 69–79 69–79 
Marketing Assistant 45–55 55–65 55–65 55–65 45–54 54–64 54–64 54–64 
Events Coordinator 50–60 60–80 65–80 70–85 50–59 59–79 64–79 69–84 
Bids & Tenders Executive 55–65 65–80 65–80 70–85 54–64 64–79 64–79 69–84 
Marketing Executive 60–75 65–80 65–80 70–85 59–74 64–79 64–79 69–84 
Bids & Tenders Manager 75–95 80–100 100–120 120–130 74–94 79–99 99–119 119–129 
Web/Internet Manager 75–90 75–95 90–120 120–140 74–89 74–94 89–119 119–139 
PR/Media Manager 75–90 80–100 100–130 130–140 74–89 79–99 99–129 129–139 
Communications Manager 80–100 85–105 105–135 130–145 79–99 84–104 104–134 129–144 
Business Development Manager 75–90 75–95 95–130 130–150 74–89 74–94 94–129 129–149 
Marketing Director 140–165 155–175 160–180 175–210 139–163 153–173 158–178 173–208 
Business Development Director 110–130 130–150 150–160 160–190 109–129 129–149 149–158 158–188 
State QLD SA 
Experience 0–3 years 3–5 years 5–7 years 7+ years 0–3 years 3–5 years 5–7 years 7+ years 
Salary $’000 $’000 $’000 $’000 $’000 $’000 $’000 $’000 
Business Development Coordinator 42–51 51–65 65–74 65–74 41–50 50–63 63–72 63–72 
Marketing Assistant 42–51 51–60 51–60 51–60 41–50 50–59 50–59 50–59 
Events Coordinator 47–56 56–74 60–74 65–79 45–54 54–72 59–72 63–77 
Bids & Tenders Executive 51–60 60–74 60–74 65–79 50–59 59–72 59–72 63–77 
Marketing Executive 56–70 60–74 60–74 65–79 54–68 59–72 59–72 63–77 
Bids & Tenders Manager 70–88 74–93 93–112 112+ 68–86 72–90 90–108 108+ 
Web/Internet Manager 70–84 70–88 84–112 112+ 68–81 68–86 81–108 108+ 
PR/Media Manager 70–84 74–93 93–121 121+ 68–81 72–90 90–117 117+ 
Communications Manager 74–93 79–98 98–126 121+ 72–90 77–95 95–122 117+ 
Business Development Manager 70–84 70–88 88–121 121+ 68–81 68–86 86–117 117+ 
Marketing Director 102–126 126–144 144–158 149+ 99–122 122–140 140–153 144+ 
Business Development Director 93–121 121–140 140–149 149+ 90–117 117–135 135–144 144+ 
Please note: 
1. Salaries indicated are in Australian dollars and based on an annual basic salary, including superannuation at 9.5%, excluding bonus/incentive schemes. 2. Experience refers to ‘total years experience’ in 
the stated role. 3. Roles marked N/A in this report are not commonly found for the specified years of experience. 4. Market rates are becoming much less uniform. While we have taken great care, these 
salary ranges can only be approximate guides, as there are often specific circumstances relating to individual companies. Please call us for additional information. 
Marketing 12
SALARY & EMPLOYMENT 
FORECAST 2014/15 
Marketing 
Salary tables 
Professional Services (continued) 
State WA 
Experience 0–3 years 3–5 years 5–7 years 7+ years 
Salary $’000 $’000 $’000 $’000 
Business Development Coordinator 46–56 56–71 71–82 71–82 
Marketing Assistant 46–56 56–66 56–66 56–66 
Events Coordinator 51–61 61–82 66–82 71–87 
Bids & Tenders Executive 56–66 66–82 66–82 71–87 
Marketing Executive 61–77 66–82 66–82 71–87 
Bids & Tenders Manager 77–97 82–102 102–122 122+ 
Web/Internet Manager 77–92 77–97 92–122 122+ 
PR/Media Manager 77–92 82–102 102–133 133+ 
Communications Manager 82–102 87–107 107–138 133+ 
Business Development Manager 77–92 77–97 97–133 133+ 
Marketing Director 112–138 138–158 158–173 163+ 
Business Development Director 102–133 133–153 153–163 163+ 
B2B, Industrial & Technical 
State NSW VIC 
Experience 0–3 years 3–5 years 5–7 years 7+ years 0–3 years 3–5 years 5–7 years 7+ years 
Salary $’000 $’000 $’000 $’000 $’000 $’000 $’000 $’000 
Marketing Coordinator 55–60 60–65 65–70 65–75 54–59 59–64 64–69 64–74 
Product Manager 75–80 80–85 85–90 90–105 74–79 79–84 84–89 89–104 
Brand Manager 75–80 80–85 85–90 90–110 74–79 79–84 84–89 89–109 
Marketing Communications Manager 80–90 90–100 100–110 110–120 79–89 89–99 99–109 109–119 
Marketing Manager 90–115 110–130 140–155 150–165 89–114 109–129 139–153 149–163 
Marketing Director 140–160 145–170 155–180 165–210 139–158 144–168 153–178 163–208 
State QLD SA 
Experience 0–3 years 3–5 years 5–7 years 7+ years 0–3 years 3–5 years 5–7 years 7+ years 
Salary $’000 $’000 $’000 $’000 $’000 $’000 $’000 $’000 
Marketing Coordinator 51–56 56–60 60–65 60–70 50–54 54–59 59–63 59–68 
Product Manager 70–74 74–79 79–84 84+ 68–72 72–77 77–81 81+ 
Brand Manager 70–74 74–79 79–84 84+ 68–72 72–77 77–81 81+ 
Marketing Communications Manager 74–84 84–93 93–102 102+ 72–81 81–90 90–99 99+ 
Marketing Manager 84–107 102–121 130–144 140+ 81–104 99–117 126–140 135+ 
Marketing Director 112–130 130–144 130–153 N/A 108–126 126–140 126–149 N/A 
State WA 
Experience 0–3 years 3–5 years 5–7 years 7+ years 
Salary $’000 $’000 $’000 $’000 
Marketing Coordinator 56–61 61–66 66–71 66–77 
Product Manager 77–82 82–87 87–92 92+ 
Brand Manager 77–82 82–87 87–92 92+ 
Marketing Communications Manager 82–92 92–102 102–112 112+ 
Marketing Manager 92–117 112–133 143–158 153+ 
Marketing Director 122–143 143–158 143–168 N/A 
Please note: 
1. Salaries indicated are in Australian dollars and based on an annual basic salary, including superannuation at 9.5%, excluding bonus/incentive schemes. 2. Experience refers to ‘total years experience’ in 
the stated role. 3. Roles marked N/A in this report are not commonly found for the specified years of experience. 4. Market rates are becoming much less uniform. While we have taken great care, these 
salary ranges can only be approximate guides, as there are often specific circumstances relating to individual companies. Please call us for additional information. 
Marketing 13
SALARY & EMPLOYMENT 
FORECAST 2014/15 
Marketing 
Salary tables 
Healthcare 
State NSW VIC 
Experience 0–3 years 3–5 years 5–7 years 7+ years 0–3 years 3–5 years 5–7 years 7+ years 
Salary $’000 $’000 $’000 $’000 $’000 $’000 $’000 $’000 
Marketing Assistant 60–65 65–70 65–70 65–70 59–64 64–69 64–69 64–69 
Assistant Product Manager 65–70 70–75 75–80 75–80 64–69 69–74 74–79 74–79 
Product Manager 75–85 80–85 85–95 90–100 74–84 79–84 84–94 89–99 
Senior Product Manager/Group Product Manager 90–100 110–120 125–155 150–190 89–99 109–119 124–153 149–188 
Business Unit Manager/Marketing Manager 120–130 135–155 155–180 180–210 119–129 134–153 153–178 178–208 
State QLD SA 
Experience 0–3 years 3–5 years 5–7 years 7+ years 0–3 years 3–5 years 5–7 years 7+ years 
Salary $’000 $’000 $’000 $’000 $’000 $’000 $’000 $’000 
Marketing Assistant 56–60 60–65 60–65 60–65 54–59 59–63 59–63 59–63 
Assistant Product Manager 60–65 65–70 70–74 70–74 59–63 63–68 68–72 68–72 
Product Manager 70–79 74–79 79–88 84–93 68–77 72–77 77–86 81–90 
Senior Product Manager/Group Product Manager 84–93 102–112 116–144 140–177 81–90 99–108 113–140 135–171 
Business Unit Manager/Marketing Manager 112–121 126–144 144–167 167–195 108–117 122–140 140–162 162–189 
State WA 
Experience 0–3 years 3–5 years 5–7 years 7+ years 
Salary $’000 $’000 $’000 $’000 
Marketing Assistant 61–66 66–71 66–71 66–71 
Assistant Product Manager 66–71 71–77 77–82 77–82 
Product Manager 77–87 82–87 87–97 92–102 
Senior Product Manager/Group Product Manager 92–102 112–122 128–158 153–194 
Business Unit Manager/Marketing Manager 122–133 138–158 158–184 184–214 
Please note: 
1. Salaries indicated are in Australian dollars and based on an annual basic salary, including superannuation at 9.5%, excluding bonus/incentive schemes. 2. Experience refers to ‘total years experience’ in 
the stated role. 3. Roles marked N/A in this report are not commonly found for the specified years of experience. 4. Market rates are becoming much less uniform. While we have taken great care, these 
salary ranges can only be approximate guides, as there are often specific circumstances relating to individual companies. Please call us for additional information. 
Marketing 14
SALARY & EMPLOYMENT 
FORECAST 2014/15 
Marketing 
Salary tables 
Retail 
State NSW VIC 
Experience 0–3 years 3–5 years 5–7 years 7+ years 0–3 years 3–5 years 5–7 years 7+ years 
Salary $’000 $’000 $’000 $’000 $’000 $’000 $’000 $’000 
Marketing Assistant/Coordinator 50–60 50–60 55–65 55–65 50–59 50–59 54–64 54–64 
Marketing Executive 55–75 55–75 55–80 55–80 54–74 54–74 54–79 54–79 
LAM Executive 60–65 65–75 75–90 90–110 59–64 64–74 74–89 89–109 
Advertising Manager 65–75 75–90 90–105 105–150 64–74 74–89 89–104 104–149 
Marketing Manager 90–125 100–125 120–150 140–165 89–124 99–124 119–149 139–163 
Head of Marketing/Marketing Director 140–200 160–210 200–235 220–250 139–198 158–208 198–233 218–248 
PR Manager 60–70 70–80 80–100 100–120 59–69 69–79 79–99 99–119 
Corporate Affairs Manager 70–80 80–100 100–120 120–180 69–79 79–99 99–119 119–178 
Loyalty/CRM Manager 70–80 80–100 100–110 110–130 69–79 79–99 99–109 109–129 
Graphic Designer 50–65 65–70 70–85 85–110 50–64 64–69 69–84 84–109 
Online Content Manager 80–90 90–105 105–115 115–125 79–89 89–104 104–114 114–124 
eCommerce Manager 95–125 115–135 140–160 160–190 94–124 114–134 139–158 158–188 
State QLD SA 
Experience 0–3 years 3–5 years 5–7 years 7+ years 0–3 years 3–5 years 5–7 years 7+ years 
Salary $’000 $’000 $’000 $’000 $’000 $’000 $’000 $’000 
Marketing Assistant/Coordinator 47–56 47–56 51–60 51–60 45–54 45–54 50–59 50–59 
Marketing Executive 51–70 51–70 51–74 51–74 50–68 50–68 50–72 50–72 
LAM Executive 56–60 60–70 70–84 84+ 54–59 59–68 68–81 81+ 
Advertising Manager 60–70 70–84 84–98 98–140 59–68 68–81 81–95 95–135 
Marketing Manager 84–116 93–116 112–140 130–153 81–113 90–113 108–135 126–149 
Head of Marketing/Marketing Director 130–186 149–195 186–219 205–233 126–180 144–189 180–212 198–225 
PR Manager 56–65 65–74 74–93 93–112 54–63 63–72 72–90 90–108 
Corporate Affairs Manager 65–74 74–93 93–112 112–167 63–72 72–90 90–108 108–162 
Loyalty/CRM Manager 65–74 74–93 93–102 102–121 63–72 72–90 90–99 99–117 
Graphic Designer 47–60 60–65 65–79 79+ 45–59 59–63 63–77 77+ 
Online Content Manager 74–84 84–98 98–107 107–116 72–81 81–95 95–104 104–113 
eCommerce Manager 88–116 107–126 130–149 149–177 86–113 104–122 126–144 144–171 
State WA 
Experience 0–3 years 3–5 years 5–7 years 7+ years 
Salary $’000 $’000 $’000 $’000 
Marketing Assistant/Coordinator 51–61 51–61 56–66 56–66 
Marketing Executive 56–77 56–77 56–82 56–82 
LAM Executive 61–66 66–77 77–92 92+ 
Advertising Manager 66–77 77–92 92–107 107–153 
Marketing Manager 92–128 102–128 122–153 143–168 
Head of Marketing/Marketing Director 143–204 163–214 204–240 224–255 
PR Manager 61–71 71–82 82–102 102–122 
Corporate Affairs Manager 71–82 82–102 102–122 122–184 
Loyalty/CRM Manager 71–82 82–102 102–112 112–133 
Graphic Designer 51–66 66–71 71–87 87+ 
Online Content Manager 82–92 92–107 107–117 117–128 
eCommerce Manager 97–128 117–138 143–163 163–194 
Please note: 
1. Salaries indicated are in Australian dollars and based on an annual basic salary, including superannuation at 9.5%, excluding bonus/incentive schemes. 2. Experience refers to ‘total years experience’ in 
the stated role. 3. Roles marked N/A in this report are not commonly found for the specified years of experience. 4. Market rates are becoming much less uniform. While we have taken great care, these 
salary ranges can only be approximate guides, as there are often specific circumstances relating to individual companies. Please call us for additional information. 
Marketing 15
SALARY & EMPLOYMENT 
FORECAST 2014/15 
Marketing 
Salary tables 
Public Sector 
State NSW VIC 
Experience 0–3 years 3–5 years 5–7 years 7+ years 0–3 years 3–5 years 5–7 years 7+ years 
Salary $’000 $’000 $’000 $’000 $’000 $’000 $’000 $’000 
Marketing Assistant 45–53 50–60 55–65 55–65 45–52 50–59 54–64 54–64 
Marketing Coordinator 50–65 60–70 60–70 60–70 50–64 59–69 59–69 59–69 
Events Manager 66–80 75–100 80–110 90–120 65–79 74–99 79–109 89–119 
Copywriter 60–75 65–90 75–95 100–110 59–74 64–89 74–94 99–109 
Database Manager 68–80 80–100 100–115 115–135 67–79 79–99 99–114 114–134 
Public/Corporate Affairs Manager 80–95 95–125 120–130 130–140 79–94 94–124 119–129 129–139 
Sponsorship/Fundraising Manager 85–95 90–120 115–130 130–145 84–94 89–119 114–129 129–144 
Marketing Communications Manager 90–105 110–115 120–130 135–155 89–104 109–114 119–129 134–153 
Senior Marketing Manager 100–115 110–125 125–145 130–155 99–114 109–124 124–144 129–153 
Marketing Director 110–130 120–150 140–160 140–165 109–129 119–149 139–158 139–163 
State QLD SA 
Experience 0–3 years 3–5 years 5–7 years 7+ years 0–3 years 3–5 years 5–7 years 7+ years 
Salary $’000 $’000 $’000 $’000 $’000 $’000 $’000 $’000 
Marketing Assistant 42–49 47–56 51–60 51–60 41–48 45–54 50–59 50–59 
Marketing Coordinator 47–60 56–65 56–65 56–65 45–59 54–63 54–63 54–63 
Events Manager 61–74 70–93 74–102 84–112 59–72 68–90 72–99 81–108 
Copywriter 56–70 60–84 74–93 93+ 54–68 59–81 72–90 90+ 
Database Manager 63–74 74–93 93–107 107–126 61–72 72–90 90–104 104–122 
Public/Corporate Affairs Manager 74–88 88–116 116–121 121+ 72–86 86–113 113–117 117+ 
Sponsorship/Fundraising Manager 79–88 84–112 107–121 121+ 77–86 81–108 104–117 117+ 
Marketing Communications Manager 84–98 102–107 112–121 107–126 81–95 99–104 108–117 104–122 
Senior Marketing Manager 93–107 102–116 116–135 121–144 90–104 99–113 113–131 117–140 
Marketing Director 102–121 112–140 130–149 130–153 99–117 108–135 126–144 126–149 
State WA 
Experience 0–3 years 3–5 years 5–7 years 7+ years 
Salary $’000 $’000 $’000 $’000 
Marketing Assistant 46–54 51–61 56–66 56–66 
Marketing Coordinator 51–66 61–71 61–71 61–71 
Events Manager 67–82 77–102 82–112 92–122 
Copywriter 61–77 66–92 82–102 102+ 
Database Manager 69–82 82–102 102–117 117–138 
Public/Corporate Affairs Manager 82–97 97–128 128–133 133+ 
Sponsorship/Fundraising Manager 87–97 92–122 117–133 133+ 
Marketing Communications Manager 92–107 112–117 122–133 117–138 
Senior Marketing Manager 102–117 112–128 128–148 133–158 
Marketing Director 112–133 122–153 143–163 143–168 
Please note: 
1. Salaries indicated are in Australian dollars and based on an annual basic salary, including superannuation at 9.5%, excluding bonus/incentive schemes. 2. Experience refers to ‘total years experience’ in 
the stated role. 3. Roles marked N/A in this report are not commonly found for the specified years of experience. 4. Market rates are becoming much less uniform. While we have taken great care, these 
salary ranges can only be approximate guides, as there are often specific circumstances relating to individual companies. Please call us for additional information. 
Marketing 16
SALARY & EMPLOYMENT 
FORECAST 2014/15 
Marketing 
Salary tables 
Public Sector/Communications & Public Affairs 
State NSW VIC 
Experience 0–3 years 3–5 years 5–7 years 7+ years 0–3 years 3–5 years 5–7 years 7+ years 
Salary $’000 $’000 $’000 $’000 $’000 $’000 $’000 $’000 
Marketing/Communications Assistant 48–50 50–55 55–60 60–70 48–50 50–54 54–59 59–69 
Marketing/Communications Coordinator 50–55 55–65 65–67 67–70 50–54 54–64 64–66 66–69 
Public/Corporate Affairs Manager 55–60 60–70 70–75 75–80 54–59 59–69 69–74 74–79 
Internal Communications Manager 55–60 60–70 70–75 75–85 54–59 59–69 69–74 74–84 
PR/Media Manager 65–70 70–80 80–95 95–105 64–69 69–79 79–94 94–104 
External Communications/Marketing Manager 65–70 70–80 80–95 95–110 64–69 69–79 79–94 94–109 
Senior Manager 90–100 100–110 110–130 130–140 89–99 99–109 109–129 129–139 
Director 140–150 155–165 170–190 180–220 139–149 153–163 168–188 178–218 
State QLD SA 
Experience 0–3 years 3–5 years 5–7 years 7+ years 0–3 years 3–5 years 5–7 years 7+ years 
Salary $’000 $’000 $’000 $’000 $’000 $’000 $’000 $’000 
Marketing/Communications Assistant 45–47 47–51 51–56 56+ 43–45 45–50 50–54 54+ 
Marketing/Communications Coordinator 47–51 51–60 60–62 62–65 45–50 50–59 59–60 60–63 
Public/Corporate Affairs Manager 51–56 56–65 65–70 70+ 50–54 54–63 63–68 68+ 
Internal Communications Manager 51–56 56–65 65–70 70+ 50–54 54–63 63–68 68+ 
PR/Media Manager 60–65 65–74 74–88 88+ 59–63 63–72 72–86 86+ 
External Communications/Marketing Manager 60–65 65–74 74–88 88+ 59–63 63–72 72–86 86+ 
Senior Manager 84–93 93–102 102–121 121+ 81–90 90–99 99–117 117+ 
Director 121–140 140–149 149–167 167+ 117–135 135–144 144–162 162+ 
State WA 
Experience 0–3 years 3–5 years 5–7 years 7+ years 
Salary $’000 $’000 $’000 $’000 
Marketing/Communications Assistant 49–51 51–56 56–61 61+ 
Marketing/Communications Coordinator 51–56 56–66 66–68 68–71 
Public/Corporate Affairs Manager 56–61 61–71 71–77 77+ 
Internal Communications Manager 56–61 61–71 71–77 77+ 
PR/Media Manager 66–71 71–82 82–97 97+ 
External Communications/Marketing Manager 66–71 71–82 82–97 97+ 
Senior Manager 92–102 102–112 112–133 133+ 
Director 133–153 153–163 163–184 184+ 
Please note: 
1. Salaries indicated are in Australian dollars and based on an annual basic salary, including superannuation at 9.5%, excluding bonus/incentive schemes. 2. Experience refers to ‘total years experience’ in 
the stated role. 3. Roles marked N/A in this report are not commonly found for the specified years of experience. 4. Market rates are becoming much less uniform. While we have taken great care, these 
salary ranges can only be approximate guides, as there are often specific circumstances relating to individual companies. Please call us for additional information. 
Marketing 17
SALARY & EMPLOYMENT 
FORECAST 2014/15 
Marketing 
Salary tables 
NOT-FOR-PROFIT/Charities 
State NSW VIC 
Experience 0–3 years 3–5 years 5–7 years 7+ years 0–3 years 3–5 years 5–7 years 7+ years 
Salary $’000 $’000 $’000 $’000 $’000 $’000 $’000 $’000 
Marketing/Communications Assistant 45–50 50–55 55–60 55–60 45–50 50–54 54–59 54–59 
Marketing/Communications Coordinator 50–55 55–65 65–70 70–75 50–54 54–64 64–69 69–74 
Events Manager 60–65 65–70 70–75 75–80 59–64 64–69 69–74 74–79 
PR/Media Manager 70–75 75–80 80–90 90–95 69–74 74–79 79–89 89–94 
Marketing/Communications Manager 70–75 75–80 80–90 90–100 69–74 74–79 79–89 89–99 
Fundraising Manager 70–75 75–80 80–90 90–105 69–74 74–79 79–89 89–104 
Partnership/Corporate Fundraising 70–75 75–80 80–90 90–105 69–74 74–79 79–89 89–104 
Individual Giving/DM 60–65 65–75 75–80 80–100 59–64 64–74 74–79 79–99 
Corporate Affairs Manager 70–75 75–85 85–90 90–110 69–74 74–84 84–89 89–109 
Senior Fundraising/Marketing Manager 80–90 90–95 95–100 100–130 79–89 89–94 94–99 99–129 
Director of Marketing/Communications/Fundraising 110–125 115–135 130–155 140–175 109–124 114–134 129–153 139–173 
State QLD SA 
Experience 0–3 years 3–5 years 5–7 years 7+ years 0–3 years 3–5 years 5–7 years 7+ years 
Salary $’000 $’000 $’000 $’000 $’000 $’000 $’000 $’000 
Marketing/Communications Assistant 42–47 47–51 51–56 51–56 41–45 45–50 50–54 50–54 
Marketing/Communications Coordinator 47–51 51–60 60–65 65+ 45–50 50–59 59–63 63+ 
Events Manager 56–60 60–65 65–70 70+ 54–59 59–63 63–68 68+ 
PR/Media Manager 65–70 70–74 74–84 84+ 63–68 68–72 72–81 81+ 
Marketing/Communications Manager 65–70 70–74 74–84 84+ 63–68 68–72 72–81 81+ 
Fundraising Manager 65–70 70–74 74–84 84+ 63–68 68–72 72–81 81+ 
Partnership/Corporate Fundraising 65–70 70–74 74–84 84+ 63–68 68–72 72–81 81+ 
Individual Giving/DM 56–60 60–70 70–74 74+ 54–59 59–68 68–72 72+ 
Corporate Affairs Manager 65–70 70–79 79–84 84+ 63–68 68–77 77–81 81+ 
Senior Fundraising/Marketing Manager 74–84 84–88 88–93 93+ 72–81 81–86 86–90 90+ 
Director of Marketing/Communications/Fundraising 65–74 74–84 84–102 102+ 63–72 72–81 81–99 99+ 
State QLD 
Experience 0–3 years 3–5 years 5–7 years 7+ years 
Salary $’000 $’000 $’000 $’000 
Marketing/Communications Assistant 46–51 51–56 56–61 56–61 
Marketing/Communications Coordinator 51–56 56–66 66–71 71+ 
Events Manager 61–66 66–71 71–77 77+ 
PR/Media Manager 71–77 77–82 82–92 92+ 
Marketing/Communications Manager 71–77 77–82 82–92 92+ 
Fundraising Manager 71–77 77–82 82–92 92+ 
Partnership/Corporate Fundraising 71–77 77–82 82–92 92+ 
Individual Giving/DM 61–66 66–77 77–82 82+ 
Corporate Affairs Manager 71–77 77–87 87–92 92+ 
Senior Fundraising/Marketing Manager 82–92 92–97 97–102 102+ 
Director of Marketing/Communications/Fundraising 71–82 82–92 92–112 112+ 
Please note: 
1. Salaries indicated are in Australian dollars and based on an annual basic salary, including superannuation at 9.5%, excluding bonus/incentive schemes. 2. Experience refers to ‘total years experience’ in 
the stated role. 3. Roles marked N/A in this report are not commonly found for the specified years of experience. 4. Market rates are becoming much less uniform. While we have taken great care, these 
salary ranges can only be approximate guides, as there are often specific circumstances relating to individual companies. Please call us for additional information. 
Marketing 18
CONTACT US 
Sydney - CBD 
Level 32, Grosvenor Place 
225 George Street 
Sydney NSW 2000 
Tel + 61 2 8292 2000 
Fax + 61 2 8292 2001 
enquiries@michaelpage.com.au 
Sydney - North Shore 
Level 6, Tower B, Zenith Centre 
821 Pacifi c Highway 
Chatswood NSW 2067 
Tel + 61 2 8292 2500 
Fax + 61 2 8292 2501 
enquiries@michaelpage.com.au 
Sydney - West 
Level 4 
110 George Street 
Parramatta NSW 2150 
Tel + 61 2 8836 0700 
Fax + 61 2 8836 0701 
enquiries@michaelpage.com.au 
Melbourne - CBD 
Level 19 
600 Bourke Street 
Melbourne VIC 3000 
Tel + 61 3 9607 5600 
Fax + 61 3 9607 5666 
enquiries@michaelpage.com.au 
Melbourne - South East 
Suite 10, Level 2 
622 Ferntree Gully Road 
Wheelers Hill VIC 3150 
Tel + 61 3 8562 5400 
Fax + 61 3 8562 5499 
enquiries@michaelpage.com.au 
Brisbane 
Level 5 
100 Creek Street 
Brisbane QLD 4000 
Tel + 61 7 3414 6100 
Fax + 61 7 3414 6101 
enquiries@michaelpage.com.au 
Perth 
Level 6, Westralia Plaza 
167 St Georges Terrace 
Perth WA 6000 
Tel + 61 8 9215 9500 
Fax + 61 8 9215 9599 
enquiries@michaelpage.com.au 
www.michaelpage.com.au

What are you worth? Salary information and more for Marketing professionals.

  • 1.
    MARKETING E NC YCO N S T R U C T I O N D I G I T A L E N G I N E E R I N G F I N A N C E F I N A N C I A L S E R V I C E S H O S P I T A L I T Y & L E I S U M A N R E S O U R C E S L E G A L M A N U FAC T U R I N G M A R K E T I N G M I N I N G & R E S O U R C E S O I L & G A S P R O C U R E T P R O P E R T Y R E T A I L S A L E S S U P P LYC H A I N & LO G I S T I C S T E C H N O LOGYM A R K E T I N GAG E N C YCO N S T R I O N D I G I T A L E N G I N E E R I N G F I N A N C E F I N A N C I A L S E R V I C E S H O S P I T A L I T Y & L E I S U R E H U M A N R E S O U R L E G A L M A N U FAC T U R I N G M A R K E T I N G M I N I N G & R E S O U R C E S O I L & G A S P R O C U R E M E N T P R O P E R T Y R I L S A L E S S U P P LYC H A I N & LO G I S T I C S T E C H N O LOGYAG E N C YCO N S T R U C T I O N D I G I T A L E N G I N E E R I N G A N C E F I N A N C I A L S E R V I C E S H O S P I T A L I T Y & L E I S U R E H U M A N R E S O U R C E S L E G A L M A N U FAC T U R I N G M N G & R E S O U R C E S O I L & G A S P R O C U R E M E N T P R O P E R T Y R E T A I L S A L E S S U P P LYC H A I N & LO G I S T I C S T E C LOGYAG E N C YCO N S T R U C T I O N D I G I T A L E N G I N E E R I N G F I N A N C E F I N A N C I A L S E R V I C E S H O S P I T A L I T E I S U R E H U M A N R E S O U R C E S L E G A L M A N U FAC T U R I N G M A R K E T I N G M I N I N G & R E S O U R C E S O I L & G A S C U R E M E N T P R O P E R T Y R E T A I L S A L E S S U P P LYC H A I N & LO G I S T I C S T E C H N O LOGYAG E N C YCO N S T R U N D I G I T A L E N G I N E E R I N G F I N A N C E F I N A N C I A L S E R V I C E S H O S P I T A L I T Y & L E I S U R E H U M A N R E S O U R C E A L M A N U FAC T U R I N G M A R K E T I N G M I N I N G & R E S O U R C E S O I L & G A S P R O C U R E M E N T P R O P E R T Y R E T A A L E S S U P P LYC H A I N & LO G I S T I C S T E C H N O LOGYAG E N C YCO N S T R U C T I O N M A R K E T I N G D I G I T A L E N G R I N G F I N A N C E F I N A N C I A L S E R V I C E S H O S P I T A L I T Y & L E I S U R E H U M A N R E S O U R C E S L E G A L M A N U FAC N G M I N I N G & R E S O U R C E S O I L & G A S P R O C U R E M E N T P R O P E R T Y R E T A I L S A L E S S U P P LYC H A I N & LO G I S T E C H N O LOGYAG E N C YCO N S T R U C T I O N D I G I T A L E N G I N E E R I N G F I N A N C E F I N A N C I A L S E R V I C E S H O S L I T Y & L E I S U R E H U M A N R E S O U R C E S L E G A L M A N U FAC T U R I N G M A R K E T I N G M I N I N G & R E S O U R C E S O A S P R O C U R E M E N T P R O P E R T Y R E T A I L S A L E S S U P P LYC H A I N & LO G I S T I C S T E C H N O LOGYAG E N C YCON R U C T I O N D I G I T A L E N G I N E E R I N G F I N A N C E F I N A N C I A L S E R V I C E S H O S P I T A L I T Y & L E I S U R E H U M A N R E R C E S L E G A L M A N U FAC T U R I N G M A R K E T I N G M I N I N G & R E S O U R C E S O I L & G A S P R O C U R E M E N T P R O P R E T A I L S A L E S S U P P LYC H A I N & LO G I S T I C S T E C H N O LOGYAG E N C YCO N S T R U C T I O N D I G I T A L E N G I N E G F I N A N C E F I N A N C I A L S E R V I C E S H O S P I T A L I T Y & L E I S U R E H U M A N R E S O U R C E S L E G A L M A N U FAC T U R M A R K E T I N G M I N I N G & R E S O U R C E S O I L & G A S P R O C U R E M E N T P R O P E R T Y R E T A I L S A L E S S U P P LYC H A I LO G I S T I C S T E C H N O LOGYAG E N C YCO N S T R U C T I O N D I G I T A L E N G I N E E R I N G F I N A N C E F I N A N C I A L S E R S H O S P I T A L I T Y & L E I S U R E H U M A N R E S O U R C E S L E G A L M A N U FAC T U R I N G M A R K E T I N G M I N I N G & R E S C E S O I L & G A S P R O C U R E M E N T P R O P E R T Y R E T A I L S A L E S S U P P LYC H A I N & LO G I S T I C S T E C H N O LOGYAG C YCO N S T R U C T I O N D I G I T A L E N G I N E E R I N G F I N A N C E F I N A N C I A L S E R V I C E S H O S P I T A L I T Y & L E I S U R E H A N R E S O U R C E S L E G A L M A N U FAC T U R I N G M A R K E T I N G M I N I N G & R E S O U R C E S O I L & G A S P R O C U R E M E R O P E R T Y R E T A I L S A L E S S U P P LYC H A I N & LO G I S T I C S T E C H N O LOGYAG E N C YCO N S T R U C T I O N 1 D I G I T A G I N E E R I N G F I N A N C E F I N A N C I A L S E R V I C E S H O S P I T A L I T Y & L E I S U R E H U M A N R E S O U R C E S L E G A L M A N FAC T U R I N G M A R K E T I N G M I N I N G & R E S O U R C E S O I L & G A S P R O C U R E M E N T P R O P E R T Y R E T A I L S A L E S S U Marketing SALARY & EMPLOYMENT FORECAST 2014/15 Marketing SALARY & EMPLOYMENT FORECAST Marketing
  • 2.
    2 Marketing SALARY& EMPLOYMENT FORECAST 2014/15 recruitment activity Marketing YES 29% NO 61% UNSURE 10% Strength of current hiring activity compared to the last 12 months Expecting to increase headcount Stronger (8%) Slightly stronger (19%) Steady (53%) Slightly weaker (12%) Weaker (8%) Market observations: • Hiring for marketing talent is currently strong, despite a drop in permanent headcount for this skill set over the last 12 months. This is expected to stabilise in the coming year, as businesses remain conservative on increasing headcount. • The majority of jobs available for marketing professionals are replacement roles rather than newly created positions. Companies are looking to consolidate teams and backfill roles that have been vacant as a result of recent hiring freezes. There is minimal growth in the industry. • Hiring of marketing professionals is strongest in the service industry (including finance, banking and IT&T), consumer and FMCG as well as government and non-profit. These areas have been conservative for some time, and employers are taking advantage of a more stable economic market to rebuild their teams. • Government departments are currently investing more heavily in their communications team, in preparation for upcoming general State elections and post-budget activity. • Non-profit organisations are investing in fundraising professionals to diversify income streams. Charities are becoming more commercially focused and are looking for talent outside of the charity sector, diversifying their candidate search. • The competitive marketplace has led to many organisations placing more value on marketing activity and brand positioning. Professionals with analytics skills are in high demand, as these roles assist companies to better understand and target customers – a major focus within marketing over the past 12 months. • There is still a heavy focus on marketing teams proving return on investment to justify headcount, which has seen the industry become more data-driven over the past few years. • Customer acquisition and retention is a major priority in an uncertain economic market and this has led to increasing requirement for specialist professionals in those fields. Likewise, marketing and brand management skills are in high demand by employers. • There is currently also a strong requirement for professionals with experience in communications, as companies seek to refine both internal and external brand messages. Internal communications continue to play a vital role in staff engagement in the wake of hiring freezes and restructures. • In the past 12 months, the number of marketing professionals returning from overseas has increased by 10–20%. However, this is being measured from a relatively low base, as the past few years have seen fewer professionals returning. Note: All infographics in this report are based on the views of survey participants. The accompanying market commentary is based on the experience and observations of the Michael Page team.
  • 3.
    3 Marketing SALARY& EMPLOYMENT FORECAST 2014/15 Experience level expected to be in highest demand Skills shortage placing upwards pressure on salaries Marketing Expectation of a professional skills shortage in the next 12 months Yes Impact of skills shortage on businesses in Australia over the next 12 months Entry level Mid level Management 6% 76% 18% 12% RECRUITMENT ACTIVITY 24% Unsure No 10% 66% Yes, it will cause salaries to rise above the inflation rate (50%) Yes, salaries will increase but only at the rate of inflation (43%) No, the skills shortage will not impact salary levels (7%) 21% It will be difficult to maintain headcount Need to develop more targeted attraction strategies 29% 14% Source talent from overseas 36% Stronger focus on retaining staff
  • 4.
    4 Marketing SALARY& EMPLOYMENT FORECAST 2014/15 RECRUITMENT ACTIVITY Regions companies operate in* How Australian business is faring in comparison with 21% 22% 6% Marketing Asia operations Australia only Asia Pacific US Europe 75% 45% 32% 28% 17% Other Much stronger (28%) Marginally stronger (15%) About the same (12%) Marginally weaker (15%) Much weaker (15%) Unsure (15%) Salary and remuneration Salary increases over the next 12 months Average percentage salary increase over the next 12 months All my employees will receive the same percentage increase 51% All my employees will receive an increase, but it will vary according to performance Only my best-performing employees will receive an increase No one in my team will receive an increase 0% - 2% 2% - 3% 3% - 4% 4% - 6% 3% 48% 26% 20% 6% - 8% 3% Market observations: • Salary and remuneration rates have remained consistent over the past 12 months, and there is no discernible difference between states. • Professionals with both digital and marketing experience will be able to command above-average salary increases over the next 12 months. Companies are willing to invest in these skills to strengthen their digital proposition. * More than one option could be selected.
  • 5.
    5 Marketing SALARY& EMPLOYMENT FORECAST 2014/15 Factor most likely to impact salary levels in the next 12 months 40% Individual, team or company performance 22% 11% 9% 8% 5% 3% 2% Marketing Domestic economic conditions Inflation Competition with other companies Global economic conditions Not sure Other* Don’t expect any factors to impact salaries *Government funding, etc. Flexible salary packaging or fringe benefits offered to employees Companies providing bonuses as part of the remuneration package YES 57% NO 43% Salary and remuneration 57% 43% Basis for bonuses over the next 12 months Team performance Other** 5% 5% Individual performance Combination of all Company performance 24% 19% 47% **combination of individual and team performance, etc.
  • 6.
    5% 3% Overseas opportu-nities 6 Marketing SALARY & EMPLOYMENT FORECAST 2014/15 Salary and remuneration Average percentage bonus of gross salary 1% - 5% 6% - 10% 11% - 15% 16% - 20% YES Marketing 19% 24% 14% 29% 21% - 30% 14% Attraction and retention Employer expectations for staff turnover in the next 12 months 65% NO 23% UNSURE 12% Key reasons employees are likely to leave $ 29% 26% Other* Improve salary Better training and support 29% Broaden experience/ opportunity to learn 5% Achieve better work/life balance 3% Gain more seniority *contracts will not be renewed, pressure to perform, poor performance, etc. Most popular tools for attraction and retention Market observation: • A sign-on bonus is a popular attraction strategy to secure talented professionals. Retention strategies include offering a loyalty bonus based on length of employment and accelerated career progression opportunities. Strong company culture Work/life balance initiatives Recognition and rewards Structured career progression Global career opportunities 48% 17% 14% 10% 5% Training and mentoring partnerships 3% Other*** 3% ***challenging and rewarding roles, etc.
  • 7.
    7 Marketing SALARY& EMPLOYMENT FORECAST 2014/15 Attraction and retention Most popular options offered to support employees’ work/life balance* Sabbaticals Marketing Alternative leave options (e.g. volunteering) Team building/offsite activities Other** Increased maternity/paternity leave **health and wellbing opportunities, purchased leave, etc. Flexible working arrangements 7% 41% 19% 78% 42% 15% * More than one option could be selected. Combination of benefits offered to employees* 83% Mobile phone 46% 39% 27% 24% 19% 14% 14% 8% Parking Personal laptop Company car Higher superannuation contribution Other*** Healthcare/health insurance Income protection insurance Travel pass ***education/tuition fee packaging, wellness program/gym, salary sacrifice, etc. working hours Average weekly working hours Less than 37.5 hours 37.5-40 hours 40-45 hours 45-50 hours 7% 45% 25% 18% 50 hours or more 5%
  • 8.
    SALARY & EMPLOYMENT FORECAST 2014/15 Marketing Salary tables Consumer Goods State NSW VIC Experience 0–3 years 3–5 years 5–7 years 7+ years 0–3 years 3–5 years 5–7 years 7+ years Salary $’000 $’000 $’000 $’000 $’000 $’000 $’000 $’000 Marketing Assistant 52–68 55–68 60–70 70–80 51–67 54–67 59–69 69–79 Assistant Brand Manager 65–78 68–80 70–82 75–85 64–77 67–79 69–81 74–84 Brand Manager 85–135 115–140 115–145 115–145 84–134 114–139 114–144 114–144 Senior Brand Manager 105–162 128–165 128–168 130–170 104–160 127–163 127–166 129–168 Market Research/Insights Manager 112–157 145–165 145–170 150–170 111–155 144–163 144–168 149–168 Innovation Manager 123–163 152–165 155–170 160–170 122–161 150–163 153–168 158–168 Senior Marketing Manager 142–162 148–168 155–175 155–180 141–160 147–166 153–173 153–178 Marketing Director 185–255 225–255 255–275 260–285 183–252 223–252 252–272 257–282 State QLD SA Experience 0–3 years 3–5 years 5–7 years 7+ years 0–3 years 3–5 years 5–7 years 7+ years Salary $’000 $’000 $’000 $’000 $’000 $’000 $’000 $’000 Marketing Assistant 48–63 51–63 56–65 65–74 47–61 50–61 5–63 63–72 Assistant Brand Manager 60–73 63–74 65–76 70–79 59–70 61–72 63–74 68–77 Brand Manager 79–126 107–130 107–135 107–135 77–122 104–126 104–131 104–131 Senior Brand Manager 98–151 119–153 119–156 121–158 95–146 115–149 115–151 117–153 Market Research/Insights Manager 104–146 135–153 135–158 140–158 101–141 131–149 131–153 135–153 Innovation Manager 114–152 141–153 144–158 149–158 111–147 137–149 140–153 144–153 Senior Marketing Manager 132–151 138–156 144–163 144–167 128–146 133–151 140–158 140–162 Marketing Director 172–237 209–237 237–256 242–265 167–230 203–230 230–248 234–257 State WA Experience 0–3 years 3–5 years 5–7 years 7+ years Salary $’000 $’000 $’000 $’000 Marketing Assistant 53–69 56–69 61–71 71–82 Assistant Brand Manager 66–80 69–82 71–84 77–87 Brand Manager 87–138 117–143 117–148 117–148 Senior Brand Manager 107–165 131–168 131–171 133–173 Market Research/Insights Manager 114–160 148–168 148–173 153–173 Innovation Manager 125–166 155–168 158–173 163–173 Senior Marketing Manager 145–165 151–171 158–179 158–184 Marketing Director 189–260 230–260 260–281 265–291 Please note: 1. Salaries indicated are in Australian dollars and based on an annual basic salary, including superannuation at 9.5%, excluding bonus/incentive schemes. 2. Experience refers to ‘total years experience’ in the stated role. 3. Roles marked N/A in this report are not commonly found for the specified years of experience. 4. Market rates are becoming much less uniform. While we have taken great care, these salary ranges can only be approximate guides, as there are often specific circumstances relating to individual companies. Please call us for additional information. Marketing 8
  • 9.
    SALARY & EMPLOYMENT FORECAST 2014/15 Marketing Salary tables Financial Services State NSW VIC Experience 0–3 years 3–5 years 5–7 years 7+ years 0–3 years 3–5 years 5–7 years 7+ years Salary $’000 $’000 $’000 $’000 $’000 $’000 $’000 $’000 Market Analyst 58–68 70–90 100–110 110–125 57–67 69–89 99–109 109–124 Marketing Assistant 52–67 63–73 70–85 75–90 51–66 62–72 69–84 74–89 Marketing Executive 60–70 65–80 75–85 70–95 59–69 64–79 74–84 69–94 Campaign Manager 70–90 90–110 95–120 105–120 69–89 89–109 94–119 104–119 Assistant Product Manager 75–85 80–90 85–100 90–110 74–84 79–89 84–99 89–109 Senior Market Analyst 85–95 90–110 95–125 124–145 84–94 89–109 94–124 123–144 Marketing Manager 95–115 100–120 110–130 130–155 94–114 99–119 109–129 129–153 Direct Marketing Manager 95–115 100–120 110–130 130–145 94–114 99–119 109–129 129–144 Communications Manager 95–115 100–120 110–130 130–145 94–114 99–119 109–129 129–144 Research Manager 95–110 110–125 125–135 130–140 94–109 109–124 124–134 129–139 Product Manager 95–120 100–120 110–140 130–160 94–119 99–119 109–139 129–158 Senior Product Manager 125–140 125–150 140–165 160–180 124–139 124–149 139–163 158–178 Senior Marketing Manager 125–145 140–155 145–170 150–185 124–144 139–153 144–168 149–183 Head of Marketing 150–170 160–180 170–190 180–210 149–168 158–178 168–188 178–208 State QLD SA Experience 0–3 years 3–5 years 5–7 years 7+ years 0–3 years 3–5 years 5–7 years 7+ years Salary $’000 $’000 $’000 $’000 $’000 $’000 $’000 $’000 Market Analyst 54–63 65–84 93–102 116+ 52–61 63–81 90–99 113+ Marketing Assistant 48–62 59–68 65–79 70–84 47–60 57–66 63–77 68–81 Marketing Executive 56–65 60–74 70–79 65–88 54–63 59–72 68–77 63–86 Campaign Manager 65–84 84–102 88–112 98–112 63–81 81–99 86–108 95–108 Assistant Product Manager 70–79 74–84 79–93 84–102 68–77 72–81 77–90 81–99 Senior Market Analyst 79–88 84–102 88–116 116+ 77–86 81–99 86–113 113+ Marketing Manager 88–107 93–112 102–121 121+ 86–104 90–108 99–117 117+ Direct Marketing Manager 88–107 93–112 102–121 121+ 86–104 90–108 99–117 117+ Communications Manager 88–107 93–112 102–121 121+ 86–104 90–108 99–117 117+ Research Manager 88–102 102–116 116–126 121+ 86–99 99–113 113–122 117+ Product Manager 88–112 93–112 102–130 121+ 86–108 90–108 99–126 117+ Senior Product Manager 116–130 116–140 140–149 149+ 113–126 113–135 135–144 144+ Senior Marketing Manager 116–135 130–144 135–153 140+ 113–131 126–140 131–149 135+ Head of Marketing 140–158 149–167 158–172 167+ 135–153 144–162 153–167 162+ Please note: 1. Salaries indicated are in Australian dollars and based on an annual basic salary, including superannuation at 9.5%, excluding bonus/incentive schemes. 2. Experience refers to ‘total years experience’ in the stated role. 3. Roles marked N/A in this report are not commonly found for the specified years of experience. 4. Market rates are becoming much less uniform. While we have taken great care, these salary ranges can only be approximate guides, as there are often specific circumstances relating to individual companies. Please call us for additional information. Marketing 9
  • 10.
    SALARY & EMPLOYMENT FORECAST 2014/15 Marketing Salary tables Financial Services (continued) State WA Experience 0–3 years 3–5 years 5–7 years 7+ years Salary $’000 $’000 $’000 $’000 Market Analyst 59–69 71–92 102–112 128+ Marketing Assistant 53–68 64–74 71–87 77–92 Marketing Executive 61–71 66–82 77–87 71–97 Campaign Manager 71–92 92–112 97–122 107–122 Assistant Product Manager 77–87 82–92 87–102 92–112 Senior Market Analyst 87–97 92–112 97–128 128+ Marketing Manager 97–117 102–122 112–133 133+ Direct Marketing Manager 97–117 102–122 112–133 133+ Communications Manager 97–117 102–122 112–133 133+ Research Manager 97–112 112–128 128–138 133+ Product Manager 97–122 102–122 112–143 133+ Senior Product Manager 128–143 128–153 153–163 163+ Senior Marketing Manager 128–148 143–158 148–168 153+ Head of Marketing 153–173 163–184 173–189 184+ Media & Entertainment State NSW VIC Experience 0–3 years 3–5 years 5–7 years 7+ years 0–3 years 3–5 years 5–7 years 7+ years Salary $’000 $’000 $’000 $’000 $’000 $’000 $’000 $’000 Marketing Assistant 45–60 55–65 55–65 55–65 45–59 54–64 54–64 54–64 Marketing Executive 50–65 60–70 60–70 60–70 50–64 59–69 59–69 59–69 Assistant Product Manager 55–65 60–70 60–70 60–70 54–64 59–69 59–69 59–69 PR Manager 70–90 70–100 80–110 100–120 69–89 69–99 79–109 99–119 Sponsorship Manager 65–90 70–100 75–110 100–120 64–89 69–99 74–109 99–119 Product Manager 75–95 80–100 90–105 90–110 74–94 79–99 89–104 89–109 Web/Internet Manager 80–95 85–110 90–125 105–130 79–94 84–109 89–124 104–129 Communications Manager 85–100 85–110 90–120 110–140 84–99 84–109 89–119 109–139 Marketing Director 145–160 155–180 165–190 205–245 144–158 153–178 163–188 203–243 State QLD SA Experience 0–3 years 3–5 years 5–7 years 7+ years 0–3 years 3–5 years 5–7 years 7+ years Salary $’000 $’000 $’000 $’000 $’000 $’000 $’000 $’000 Marketing Assistant 42–56 51–60 51–60 51–60 41–54 50–59 50–59 50–59 Marketing Executive 47–60 56–65 56–65 56–65 45–59 54–63 54–63 54–63 Assistant Product Manager 51–60 56–65 56–65 56–65 50–59 54–63 54–63 54–63 PR Manager 65–84 65–93 74–102 93–112 63–81 63–90 72–99 90–108 Sponsorship Manager 60–84 65–93 70–102 93–112 59–81 63–90 68–99 90–108 Product Manager 70–88 74–93 84–98 84–98 68–86 72–90 81–95 81–95 Web/Internet Manager 74–88 79–102 84–112 93–112 72–86 77–99 81–108 90–108 Communications Manager 79–93 79–102 84–112 102–130 77–90 77–99 81–108 99–126 Marketing Director 135–149 144–167 153–177 149–186 131–144 140–162 149–171 144–180 Please note: 1. Salaries indicated are in Australian dollars and based on an annual basic salary, including superannuation at 9.5%, excluding bonus/incentive schemes. 2. Experience refers to ‘total years experience’ in the stated role. 3. Roles marked N/A in this report are not commonly found for the specified years of experience. 4. Market rates are becoming much less uniform. While we have taken great care, these salary ranges can only be approximate guides, as there are often specific circumstances relating to individual companies. Please call us for additional information. Marketing 10
  • 11.
    SALARY & EMPLOYMENT FORECAST 2014/15 Marketing Salary tables Media & Entertainment (continued) State WA Experience 0–3 years 3–5 years 5–7 years 7+ years Salary $’000 $’000 $’000 $’000 Marketing Assistant 46–61 56–66 56–66 56–66 Marketing Executive 51–66 61–71 61–71 61–71 Assistant Product Manager 56–66 61–71 61–71 61–71 PR Manager 71–92 71–102 82–112 102–122 Sponsorship Manager 66–92 71–102 77–112 102–122 Product Manager 77–97 82–102 92–107 92–107 Web/Internet Manager 82–97 87–112 92–122 102–122 Communications Manager 87–102 87–112 92–122 112–143 Marketing Director 148–163 158–184 168–194 163–204 IT&T State NSW VIC Experience 0–3 years 3–5 years 5–7 years 7+ years 0–3 years 3–5 years 5–7 years 7+ years Salary $’000 $’000 $’000 $’000 $’000 $’000 $’000 $’000 Marketing Assistant 45–60 55–65 55–65 55–65 45–59 54–64 54–64 54–64 Marketing Executive 55–65 65–75 70–90 70–90 54–64 64–74 69–89 69–89 Marketing Communications Specialist 55–65 65–75 70–90 70–90 54–64 64–74 69–89 69–89 Marketing Analyst 65–75 70–90 80–100 85–110 64–74 69–89 79–99 84–109 CRM Analyst 65–75 70–90 80–105 85–120 64–74 69–89 79–104 84–119 Channel Marketing Manager 90–110 95–120 105–135 110–140 89–109 94–119 104–134 109–139 Direct Marketing Manager 90–110 95–120 105–135 110–140 89–109 94–119 104–134 109–139 Communications Manager 90–110 95–120 105–135 110–145 89–109 94–119 104–134 109–144 Assistant Product Manager 70–85 80–95 85–95 90–105 69–84 79–94 84–94 89–104 Product Manager 90–100 95–120 110–140 115–145 89–99 94–119 109–139 114–144 Senior Product Manager 110–130 120–140 130–160 135–165 109–129 119–139 129–158 134–163 Research Manager 100–110 110–120 115–125 120–135 99–109 109–119 114–124 119–134 Senior Marketing Manager 115–130 125–140 130–160 145–175 114–129 124–139 129–158 144–173 Marketing Director 140–155 150–170 175–195 200–255 139–153 149–168 173–193 198–252 State QLD SA Experience 0–3 years 3–5 years 5–7 years 7+ years 0–3 years 3–5 years 5–7 years 7+ years Salary $’000 $’000 $’000 $’000 $’000 $’000 $’000 $’000 Marketing Assistant 42–56 51–60 51–60 51–60 41–54 50–59 50–59 50–59 Marketing Executive 51–60 60–70 65–84 65–84 50–59 59–68 63–81 63–81 Marketing Communications Specialist 51–60 60–70 65–84 65–84 50–59 59–68 63–81 63–81 Marketing Analyst 60–70 65–84 74–93 79–102 59–68 63–81 72–90 77–99 CRM Analyst 60–70 65–84 74–93 79–102 59–68 63–81 72–90 77–99 Channel Marketing Manager 84–102 88–112 98–126 102–130 81–99 86–108 95–122 99–126 Direct Marketing Manager 84–102 88–112 98–126 102–130 81–99 86–108 95–122 99–126 Communications Manager 84–102 88–112 98–126 102–135 81–99 86–108 95–122 99–131 Assistant Product Manager 65–79 74–88 79–88 84–98 63–77 72–86 77–86 81–95 Product Manager 84–93 88–112 102–130 107–135 81–90 86–108 99–126 104–131 Senior Product Manager 102–121 112–130 121–149 126–153 99–117 108–126 117–144 122–149 Research Manager 93–102 102–112 107–116 112–126 90–99 99–108 104–113 108–122 Senior Marketing Manager 107–121 116–130 121–149 135–163 104–117 113–126 117–144 131–158 Marketing Director 130–144 140–158 149–158 158+ 126–140 135–153 144–153 153+ Please note: 1. Salaries indicated are in Australian dollars and based on an annual basic salary, including superannuation at 9.5%, excluding bonus/incentive schemes. 2. Experience refers to ‘total years experience’ in the stated role. 3. Roles marked N/A in this report are not commonly found for the specified years of experience. 4. Market rates are becoming much less uniform. While we have taken great care, these salary ranges can only be approximate guides, as there are often specific circumstances relating to individual companies. Please call us for additional information. Marketing 11
  • 12.
    SALARY & EMPLOYMENT FORECAST 2014/15 Marketing Salary tables IT&T (continued) State WA Experience 0–3 years 3–5 years 5–7 years 7+ years Salary $’000 $’000 $’000 $’000 Marketing Assistant 46–61 56–66 56–66 56–66 Marketing Executive 56–66 66–77 71–92 71–92 Marketing Communications Specialist 56–66 66–77 71–92 71–92 Marketing Analyst 66–77 71–92 82–102 87–112 CRM Analyst 66–77 71–92 82–102 87–112 Channel Marketing Manager 92–112 97–122 107–138 112–143 Direct Marketing Manager 92–112 97–122 107–138 112–143 Communications Manager 92–112 97–122 107–138 112–148 Assistant Product Manager 71–87 82–97 87–97 92–107 Product Manager 92–102 97–122 112–143 117–148 Senior Product Manager 112–133 122–143 133–163 138–168 Research Manager 102–112 112–122 117–128 122–138 Senior Marketing Manager 117–133 128–143 133–163 148–179 Marketing Director 143–158 153–173 163–173 173+ Professional Services State NSW VIC Experience 0–3 years 3–5 years 5–7 years 7+ years 0–3 years 3–5 years 5–7 years 7+ years Salary $’000 $’000 $’000 $’000 $’000 $’000 $’000 $’000 Business Development Coordinator 45–55 55–70 70–80 70–80 45–54 54–69 69–79 69–79 Marketing Assistant 45–55 55–65 55–65 55–65 45–54 54–64 54–64 54–64 Events Coordinator 50–60 60–80 65–80 70–85 50–59 59–79 64–79 69–84 Bids & Tenders Executive 55–65 65–80 65–80 70–85 54–64 64–79 64–79 69–84 Marketing Executive 60–75 65–80 65–80 70–85 59–74 64–79 64–79 69–84 Bids & Tenders Manager 75–95 80–100 100–120 120–130 74–94 79–99 99–119 119–129 Web/Internet Manager 75–90 75–95 90–120 120–140 74–89 74–94 89–119 119–139 PR/Media Manager 75–90 80–100 100–130 130–140 74–89 79–99 99–129 129–139 Communications Manager 80–100 85–105 105–135 130–145 79–99 84–104 104–134 129–144 Business Development Manager 75–90 75–95 95–130 130–150 74–89 74–94 94–129 129–149 Marketing Director 140–165 155–175 160–180 175–210 139–163 153–173 158–178 173–208 Business Development Director 110–130 130–150 150–160 160–190 109–129 129–149 149–158 158–188 State QLD SA Experience 0–3 years 3–5 years 5–7 years 7+ years 0–3 years 3–5 years 5–7 years 7+ years Salary $’000 $’000 $’000 $’000 $’000 $’000 $’000 $’000 Business Development Coordinator 42–51 51–65 65–74 65–74 41–50 50–63 63–72 63–72 Marketing Assistant 42–51 51–60 51–60 51–60 41–50 50–59 50–59 50–59 Events Coordinator 47–56 56–74 60–74 65–79 45–54 54–72 59–72 63–77 Bids & Tenders Executive 51–60 60–74 60–74 65–79 50–59 59–72 59–72 63–77 Marketing Executive 56–70 60–74 60–74 65–79 54–68 59–72 59–72 63–77 Bids & Tenders Manager 70–88 74–93 93–112 112+ 68–86 72–90 90–108 108+ Web/Internet Manager 70–84 70–88 84–112 112+ 68–81 68–86 81–108 108+ PR/Media Manager 70–84 74–93 93–121 121+ 68–81 72–90 90–117 117+ Communications Manager 74–93 79–98 98–126 121+ 72–90 77–95 95–122 117+ Business Development Manager 70–84 70–88 88–121 121+ 68–81 68–86 86–117 117+ Marketing Director 102–126 126–144 144–158 149+ 99–122 122–140 140–153 144+ Business Development Director 93–121 121–140 140–149 149+ 90–117 117–135 135–144 144+ Please note: 1. Salaries indicated are in Australian dollars and based on an annual basic salary, including superannuation at 9.5%, excluding bonus/incentive schemes. 2. Experience refers to ‘total years experience’ in the stated role. 3. Roles marked N/A in this report are not commonly found for the specified years of experience. 4. Market rates are becoming much less uniform. While we have taken great care, these salary ranges can only be approximate guides, as there are often specific circumstances relating to individual companies. Please call us for additional information. Marketing 12
  • 13.
    SALARY & EMPLOYMENT FORECAST 2014/15 Marketing Salary tables Professional Services (continued) State WA Experience 0–3 years 3–5 years 5–7 years 7+ years Salary $’000 $’000 $’000 $’000 Business Development Coordinator 46–56 56–71 71–82 71–82 Marketing Assistant 46–56 56–66 56–66 56–66 Events Coordinator 51–61 61–82 66–82 71–87 Bids & Tenders Executive 56–66 66–82 66–82 71–87 Marketing Executive 61–77 66–82 66–82 71–87 Bids & Tenders Manager 77–97 82–102 102–122 122+ Web/Internet Manager 77–92 77–97 92–122 122+ PR/Media Manager 77–92 82–102 102–133 133+ Communications Manager 82–102 87–107 107–138 133+ Business Development Manager 77–92 77–97 97–133 133+ Marketing Director 112–138 138–158 158–173 163+ Business Development Director 102–133 133–153 153–163 163+ B2B, Industrial & Technical State NSW VIC Experience 0–3 years 3–5 years 5–7 years 7+ years 0–3 years 3–5 years 5–7 years 7+ years Salary $’000 $’000 $’000 $’000 $’000 $’000 $’000 $’000 Marketing Coordinator 55–60 60–65 65–70 65–75 54–59 59–64 64–69 64–74 Product Manager 75–80 80–85 85–90 90–105 74–79 79–84 84–89 89–104 Brand Manager 75–80 80–85 85–90 90–110 74–79 79–84 84–89 89–109 Marketing Communications Manager 80–90 90–100 100–110 110–120 79–89 89–99 99–109 109–119 Marketing Manager 90–115 110–130 140–155 150–165 89–114 109–129 139–153 149–163 Marketing Director 140–160 145–170 155–180 165–210 139–158 144–168 153–178 163–208 State QLD SA Experience 0–3 years 3–5 years 5–7 years 7+ years 0–3 years 3–5 years 5–7 years 7+ years Salary $’000 $’000 $’000 $’000 $’000 $’000 $’000 $’000 Marketing Coordinator 51–56 56–60 60–65 60–70 50–54 54–59 59–63 59–68 Product Manager 70–74 74–79 79–84 84+ 68–72 72–77 77–81 81+ Brand Manager 70–74 74–79 79–84 84+ 68–72 72–77 77–81 81+ Marketing Communications Manager 74–84 84–93 93–102 102+ 72–81 81–90 90–99 99+ Marketing Manager 84–107 102–121 130–144 140+ 81–104 99–117 126–140 135+ Marketing Director 112–130 130–144 130–153 N/A 108–126 126–140 126–149 N/A State WA Experience 0–3 years 3–5 years 5–7 years 7+ years Salary $’000 $’000 $’000 $’000 Marketing Coordinator 56–61 61–66 66–71 66–77 Product Manager 77–82 82–87 87–92 92+ Brand Manager 77–82 82–87 87–92 92+ Marketing Communications Manager 82–92 92–102 102–112 112+ Marketing Manager 92–117 112–133 143–158 153+ Marketing Director 122–143 143–158 143–168 N/A Please note: 1. Salaries indicated are in Australian dollars and based on an annual basic salary, including superannuation at 9.5%, excluding bonus/incentive schemes. 2. Experience refers to ‘total years experience’ in the stated role. 3. Roles marked N/A in this report are not commonly found for the specified years of experience. 4. Market rates are becoming much less uniform. While we have taken great care, these salary ranges can only be approximate guides, as there are often specific circumstances relating to individual companies. Please call us for additional information. Marketing 13
  • 14.
    SALARY & EMPLOYMENT FORECAST 2014/15 Marketing Salary tables Healthcare State NSW VIC Experience 0–3 years 3–5 years 5–7 years 7+ years 0–3 years 3–5 years 5–7 years 7+ years Salary $’000 $’000 $’000 $’000 $’000 $’000 $’000 $’000 Marketing Assistant 60–65 65–70 65–70 65–70 59–64 64–69 64–69 64–69 Assistant Product Manager 65–70 70–75 75–80 75–80 64–69 69–74 74–79 74–79 Product Manager 75–85 80–85 85–95 90–100 74–84 79–84 84–94 89–99 Senior Product Manager/Group Product Manager 90–100 110–120 125–155 150–190 89–99 109–119 124–153 149–188 Business Unit Manager/Marketing Manager 120–130 135–155 155–180 180–210 119–129 134–153 153–178 178–208 State QLD SA Experience 0–3 years 3–5 years 5–7 years 7+ years 0–3 years 3–5 years 5–7 years 7+ years Salary $’000 $’000 $’000 $’000 $’000 $’000 $’000 $’000 Marketing Assistant 56–60 60–65 60–65 60–65 54–59 59–63 59–63 59–63 Assistant Product Manager 60–65 65–70 70–74 70–74 59–63 63–68 68–72 68–72 Product Manager 70–79 74–79 79–88 84–93 68–77 72–77 77–86 81–90 Senior Product Manager/Group Product Manager 84–93 102–112 116–144 140–177 81–90 99–108 113–140 135–171 Business Unit Manager/Marketing Manager 112–121 126–144 144–167 167–195 108–117 122–140 140–162 162–189 State WA Experience 0–3 years 3–5 years 5–7 years 7+ years Salary $’000 $’000 $’000 $’000 Marketing Assistant 61–66 66–71 66–71 66–71 Assistant Product Manager 66–71 71–77 77–82 77–82 Product Manager 77–87 82–87 87–97 92–102 Senior Product Manager/Group Product Manager 92–102 112–122 128–158 153–194 Business Unit Manager/Marketing Manager 122–133 138–158 158–184 184–214 Please note: 1. Salaries indicated are in Australian dollars and based on an annual basic salary, including superannuation at 9.5%, excluding bonus/incentive schemes. 2. Experience refers to ‘total years experience’ in the stated role. 3. Roles marked N/A in this report are not commonly found for the specified years of experience. 4. Market rates are becoming much less uniform. While we have taken great care, these salary ranges can only be approximate guides, as there are often specific circumstances relating to individual companies. Please call us for additional information. Marketing 14
  • 15.
    SALARY & EMPLOYMENT FORECAST 2014/15 Marketing Salary tables Retail State NSW VIC Experience 0–3 years 3–5 years 5–7 years 7+ years 0–3 years 3–5 years 5–7 years 7+ years Salary $’000 $’000 $’000 $’000 $’000 $’000 $’000 $’000 Marketing Assistant/Coordinator 50–60 50–60 55–65 55–65 50–59 50–59 54–64 54–64 Marketing Executive 55–75 55–75 55–80 55–80 54–74 54–74 54–79 54–79 LAM Executive 60–65 65–75 75–90 90–110 59–64 64–74 74–89 89–109 Advertising Manager 65–75 75–90 90–105 105–150 64–74 74–89 89–104 104–149 Marketing Manager 90–125 100–125 120–150 140–165 89–124 99–124 119–149 139–163 Head of Marketing/Marketing Director 140–200 160–210 200–235 220–250 139–198 158–208 198–233 218–248 PR Manager 60–70 70–80 80–100 100–120 59–69 69–79 79–99 99–119 Corporate Affairs Manager 70–80 80–100 100–120 120–180 69–79 79–99 99–119 119–178 Loyalty/CRM Manager 70–80 80–100 100–110 110–130 69–79 79–99 99–109 109–129 Graphic Designer 50–65 65–70 70–85 85–110 50–64 64–69 69–84 84–109 Online Content Manager 80–90 90–105 105–115 115–125 79–89 89–104 104–114 114–124 eCommerce Manager 95–125 115–135 140–160 160–190 94–124 114–134 139–158 158–188 State QLD SA Experience 0–3 years 3–5 years 5–7 years 7+ years 0–3 years 3–5 years 5–7 years 7+ years Salary $’000 $’000 $’000 $’000 $’000 $’000 $’000 $’000 Marketing Assistant/Coordinator 47–56 47–56 51–60 51–60 45–54 45–54 50–59 50–59 Marketing Executive 51–70 51–70 51–74 51–74 50–68 50–68 50–72 50–72 LAM Executive 56–60 60–70 70–84 84+ 54–59 59–68 68–81 81+ Advertising Manager 60–70 70–84 84–98 98–140 59–68 68–81 81–95 95–135 Marketing Manager 84–116 93–116 112–140 130–153 81–113 90–113 108–135 126–149 Head of Marketing/Marketing Director 130–186 149–195 186–219 205–233 126–180 144–189 180–212 198–225 PR Manager 56–65 65–74 74–93 93–112 54–63 63–72 72–90 90–108 Corporate Affairs Manager 65–74 74–93 93–112 112–167 63–72 72–90 90–108 108–162 Loyalty/CRM Manager 65–74 74–93 93–102 102–121 63–72 72–90 90–99 99–117 Graphic Designer 47–60 60–65 65–79 79+ 45–59 59–63 63–77 77+ Online Content Manager 74–84 84–98 98–107 107–116 72–81 81–95 95–104 104–113 eCommerce Manager 88–116 107–126 130–149 149–177 86–113 104–122 126–144 144–171 State WA Experience 0–3 years 3–5 years 5–7 years 7+ years Salary $’000 $’000 $’000 $’000 Marketing Assistant/Coordinator 51–61 51–61 56–66 56–66 Marketing Executive 56–77 56–77 56–82 56–82 LAM Executive 61–66 66–77 77–92 92+ Advertising Manager 66–77 77–92 92–107 107–153 Marketing Manager 92–128 102–128 122–153 143–168 Head of Marketing/Marketing Director 143–204 163–214 204–240 224–255 PR Manager 61–71 71–82 82–102 102–122 Corporate Affairs Manager 71–82 82–102 102–122 122–184 Loyalty/CRM Manager 71–82 82–102 102–112 112–133 Graphic Designer 51–66 66–71 71–87 87+ Online Content Manager 82–92 92–107 107–117 117–128 eCommerce Manager 97–128 117–138 143–163 163–194 Please note: 1. Salaries indicated are in Australian dollars and based on an annual basic salary, including superannuation at 9.5%, excluding bonus/incentive schemes. 2. Experience refers to ‘total years experience’ in the stated role. 3. Roles marked N/A in this report are not commonly found for the specified years of experience. 4. Market rates are becoming much less uniform. While we have taken great care, these salary ranges can only be approximate guides, as there are often specific circumstances relating to individual companies. Please call us for additional information. Marketing 15
  • 16.
    SALARY & EMPLOYMENT FORECAST 2014/15 Marketing Salary tables Public Sector State NSW VIC Experience 0–3 years 3–5 years 5–7 years 7+ years 0–3 years 3–5 years 5–7 years 7+ years Salary $’000 $’000 $’000 $’000 $’000 $’000 $’000 $’000 Marketing Assistant 45–53 50–60 55–65 55–65 45–52 50–59 54–64 54–64 Marketing Coordinator 50–65 60–70 60–70 60–70 50–64 59–69 59–69 59–69 Events Manager 66–80 75–100 80–110 90–120 65–79 74–99 79–109 89–119 Copywriter 60–75 65–90 75–95 100–110 59–74 64–89 74–94 99–109 Database Manager 68–80 80–100 100–115 115–135 67–79 79–99 99–114 114–134 Public/Corporate Affairs Manager 80–95 95–125 120–130 130–140 79–94 94–124 119–129 129–139 Sponsorship/Fundraising Manager 85–95 90–120 115–130 130–145 84–94 89–119 114–129 129–144 Marketing Communications Manager 90–105 110–115 120–130 135–155 89–104 109–114 119–129 134–153 Senior Marketing Manager 100–115 110–125 125–145 130–155 99–114 109–124 124–144 129–153 Marketing Director 110–130 120–150 140–160 140–165 109–129 119–149 139–158 139–163 State QLD SA Experience 0–3 years 3–5 years 5–7 years 7+ years 0–3 years 3–5 years 5–7 years 7+ years Salary $’000 $’000 $’000 $’000 $’000 $’000 $’000 $’000 Marketing Assistant 42–49 47–56 51–60 51–60 41–48 45–54 50–59 50–59 Marketing Coordinator 47–60 56–65 56–65 56–65 45–59 54–63 54–63 54–63 Events Manager 61–74 70–93 74–102 84–112 59–72 68–90 72–99 81–108 Copywriter 56–70 60–84 74–93 93+ 54–68 59–81 72–90 90+ Database Manager 63–74 74–93 93–107 107–126 61–72 72–90 90–104 104–122 Public/Corporate Affairs Manager 74–88 88–116 116–121 121+ 72–86 86–113 113–117 117+ Sponsorship/Fundraising Manager 79–88 84–112 107–121 121+ 77–86 81–108 104–117 117+ Marketing Communications Manager 84–98 102–107 112–121 107–126 81–95 99–104 108–117 104–122 Senior Marketing Manager 93–107 102–116 116–135 121–144 90–104 99–113 113–131 117–140 Marketing Director 102–121 112–140 130–149 130–153 99–117 108–135 126–144 126–149 State WA Experience 0–3 years 3–5 years 5–7 years 7+ years Salary $’000 $’000 $’000 $’000 Marketing Assistant 46–54 51–61 56–66 56–66 Marketing Coordinator 51–66 61–71 61–71 61–71 Events Manager 67–82 77–102 82–112 92–122 Copywriter 61–77 66–92 82–102 102+ Database Manager 69–82 82–102 102–117 117–138 Public/Corporate Affairs Manager 82–97 97–128 128–133 133+ Sponsorship/Fundraising Manager 87–97 92–122 117–133 133+ Marketing Communications Manager 92–107 112–117 122–133 117–138 Senior Marketing Manager 102–117 112–128 128–148 133–158 Marketing Director 112–133 122–153 143–163 143–168 Please note: 1. Salaries indicated are in Australian dollars and based on an annual basic salary, including superannuation at 9.5%, excluding bonus/incentive schemes. 2. Experience refers to ‘total years experience’ in the stated role. 3. Roles marked N/A in this report are not commonly found for the specified years of experience. 4. Market rates are becoming much less uniform. While we have taken great care, these salary ranges can only be approximate guides, as there are often specific circumstances relating to individual companies. Please call us for additional information. Marketing 16
  • 17.
    SALARY & EMPLOYMENT FORECAST 2014/15 Marketing Salary tables Public Sector/Communications & Public Affairs State NSW VIC Experience 0–3 years 3–5 years 5–7 years 7+ years 0–3 years 3–5 years 5–7 years 7+ years Salary $’000 $’000 $’000 $’000 $’000 $’000 $’000 $’000 Marketing/Communications Assistant 48–50 50–55 55–60 60–70 48–50 50–54 54–59 59–69 Marketing/Communications Coordinator 50–55 55–65 65–67 67–70 50–54 54–64 64–66 66–69 Public/Corporate Affairs Manager 55–60 60–70 70–75 75–80 54–59 59–69 69–74 74–79 Internal Communications Manager 55–60 60–70 70–75 75–85 54–59 59–69 69–74 74–84 PR/Media Manager 65–70 70–80 80–95 95–105 64–69 69–79 79–94 94–104 External Communications/Marketing Manager 65–70 70–80 80–95 95–110 64–69 69–79 79–94 94–109 Senior Manager 90–100 100–110 110–130 130–140 89–99 99–109 109–129 129–139 Director 140–150 155–165 170–190 180–220 139–149 153–163 168–188 178–218 State QLD SA Experience 0–3 years 3–5 years 5–7 years 7+ years 0–3 years 3–5 years 5–7 years 7+ years Salary $’000 $’000 $’000 $’000 $’000 $’000 $’000 $’000 Marketing/Communications Assistant 45–47 47–51 51–56 56+ 43–45 45–50 50–54 54+ Marketing/Communications Coordinator 47–51 51–60 60–62 62–65 45–50 50–59 59–60 60–63 Public/Corporate Affairs Manager 51–56 56–65 65–70 70+ 50–54 54–63 63–68 68+ Internal Communications Manager 51–56 56–65 65–70 70+ 50–54 54–63 63–68 68+ PR/Media Manager 60–65 65–74 74–88 88+ 59–63 63–72 72–86 86+ External Communications/Marketing Manager 60–65 65–74 74–88 88+ 59–63 63–72 72–86 86+ Senior Manager 84–93 93–102 102–121 121+ 81–90 90–99 99–117 117+ Director 121–140 140–149 149–167 167+ 117–135 135–144 144–162 162+ State WA Experience 0–3 years 3–5 years 5–7 years 7+ years Salary $’000 $’000 $’000 $’000 Marketing/Communications Assistant 49–51 51–56 56–61 61+ Marketing/Communications Coordinator 51–56 56–66 66–68 68–71 Public/Corporate Affairs Manager 56–61 61–71 71–77 77+ Internal Communications Manager 56–61 61–71 71–77 77+ PR/Media Manager 66–71 71–82 82–97 97+ External Communications/Marketing Manager 66–71 71–82 82–97 97+ Senior Manager 92–102 102–112 112–133 133+ Director 133–153 153–163 163–184 184+ Please note: 1. Salaries indicated are in Australian dollars and based on an annual basic salary, including superannuation at 9.5%, excluding bonus/incentive schemes. 2. Experience refers to ‘total years experience’ in the stated role. 3. Roles marked N/A in this report are not commonly found for the specified years of experience. 4. Market rates are becoming much less uniform. While we have taken great care, these salary ranges can only be approximate guides, as there are often specific circumstances relating to individual companies. Please call us for additional information. Marketing 17
  • 18.
    SALARY & EMPLOYMENT FORECAST 2014/15 Marketing Salary tables NOT-FOR-PROFIT/Charities State NSW VIC Experience 0–3 years 3–5 years 5–7 years 7+ years 0–3 years 3–5 years 5–7 years 7+ years Salary $’000 $’000 $’000 $’000 $’000 $’000 $’000 $’000 Marketing/Communications Assistant 45–50 50–55 55–60 55–60 45–50 50–54 54–59 54–59 Marketing/Communications Coordinator 50–55 55–65 65–70 70–75 50–54 54–64 64–69 69–74 Events Manager 60–65 65–70 70–75 75–80 59–64 64–69 69–74 74–79 PR/Media Manager 70–75 75–80 80–90 90–95 69–74 74–79 79–89 89–94 Marketing/Communications Manager 70–75 75–80 80–90 90–100 69–74 74–79 79–89 89–99 Fundraising Manager 70–75 75–80 80–90 90–105 69–74 74–79 79–89 89–104 Partnership/Corporate Fundraising 70–75 75–80 80–90 90–105 69–74 74–79 79–89 89–104 Individual Giving/DM 60–65 65–75 75–80 80–100 59–64 64–74 74–79 79–99 Corporate Affairs Manager 70–75 75–85 85–90 90–110 69–74 74–84 84–89 89–109 Senior Fundraising/Marketing Manager 80–90 90–95 95–100 100–130 79–89 89–94 94–99 99–129 Director of Marketing/Communications/Fundraising 110–125 115–135 130–155 140–175 109–124 114–134 129–153 139–173 State QLD SA Experience 0–3 years 3–5 years 5–7 years 7+ years 0–3 years 3–5 years 5–7 years 7+ years Salary $’000 $’000 $’000 $’000 $’000 $’000 $’000 $’000 Marketing/Communications Assistant 42–47 47–51 51–56 51–56 41–45 45–50 50–54 50–54 Marketing/Communications Coordinator 47–51 51–60 60–65 65+ 45–50 50–59 59–63 63+ Events Manager 56–60 60–65 65–70 70+ 54–59 59–63 63–68 68+ PR/Media Manager 65–70 70–74 74–84 84+ 63–68 68–72 72–81 81+ Marketing/Communications Manager 65–70 70–74 74–84 84+ 63–68 68–72 72–81 81+ Fundraising Manager 65–70 70–74 74–84 84+ 63–68 68–72 72–81 81+ Partnership/Corporate Fundraising 65–70 70–74 74–84 84+ 63–68 68–72 72–81 81+ Individual Giving/DM 56–60 60–70 70–74 74+ 54–59 59–68 68–72 72+ Corporate Affairs Manager 65–70 70–79 79–84 84+ 63–68 68–77 77–81 81+ Senior Fundraising/Marketing Manager 74–84 84–88 88–93 93+ 72–81 81–86 86–90 90+ Director of Marketing/Communications/Fundraising 65–74 74–84 84–102 102+ 63–72 72–81 81–99 99+ State QLD Experience 0–3 years 3–5 years 5–7 years 7+ years Salary $’000 $’000 $’000 $’000 Marketing/Communications Assistant 46–51 51–56 56–61 56–61 Marketing/Communications Coordinator 51–56 56–66 66–71 71+ Events Manager 61–66 66–71 71–77 77+ PR/Media Manager 71–77 77–82 82–92 92+ Marketing/Communications Manager 71–77 77–82 82–92 92+ Fundraising Manager 71–77 77–82 82–92 92+ Partnership/Corporate Fundraising 71–77 77–82 82–92 92+ Individual Giving/DM 61–66 66–77 77–82 82+ Corporate Affairs Manager 71–77 77–87 87–92 92+ Senior Fundraising/Marketing Manager 82–92 92–97 97–102 102+ Director of Marketing/Communications/Fundraising 71–82 82–92 92–112 112+ Please note: 1. Salaries indicated are in Australian dollars and based on an annual basic salary, including superannuation at 9.5%, excluding bonus/incentive schemes. 2. Experience refers to ‘total years experience’ in the stated role. 3. Roles marked N/A in this report are not commonly found for the specified years of experience. 4. Market rates are becoming much less uniform. While we have taken great care, these salary ranges can only be approximate guides, as there are often specific circumstances relating to individual companies. Please call us for additional information. Marketing 18
  • 19.
    CONTACT US Sydney- CBD Level 32, Grosvenor Place 225 George Street Sydney NSW 2000 Tel + 61 2 8292 2000 Fax + 61 2 8292 2001 enquiries@michaelpage.com.au Sydney - North Shore Level 6, Tower B, Zenith Centre 821 Pacifi c Highway Chatswood NSW 2067 Tel + 61 2 8292 2500 Fax + 61 2 8292 2501 enquiries@michaelpage.com.au Sydney - West Level 4 110 George Street Parramatta NSW 2150 Tel + 61 2 8836 0700 Fax + 61 2 8836 0701 enquiries@michaelpage.com.au Melbourne - CBD Level 19 600 Bourke Street Melbourne VIC 3000 Tel + 61 3 9607 5600 Fax + 61 3 9607 5666 enquiries@michaelpage.com.au Melbourne - South East Suite 10, Level 2 622 Ferntree Gully Road Wheelers Hill VIC 3150 Tel + 61 3 8562 5400 Fax + 61 3 8562 5499 enquiries@michaelpage.com.au Brisbane Level 5 100 Creek Street Brisbane QLD 4000 Tel + 61 7 3414 6100 Fax + 61 7 3414 6101 enquiries@michaelpage.com.au Perth Level 6, Westralia Plaza 167 St Georges Terrace Perth WA 6000 Tel + 61 8 9215 9500 Fax + 61 8 9215 9599 enquiries@michaelpage.com.au www.michaelpage.com.au