School Aid by District (New York State)
•
0 likes•327 views

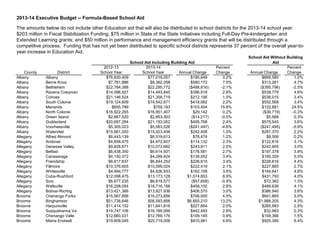
The document provides information on formula-based school aid funding for the 2013-14 school year for school districts in New York. It notes that the amounts listed do not include additional education aid totaling $328 million that will also be distributed. The funding not yet allocated to districts represents 37% of the overall year-to-year increase in education aid. The document then lists, by county and district, the amounts of school aid including and excluding building aid for the 2012-13 and 2013-14 school years and the annual and percentage changes.

More Related Content
What's hot
What's hot (20)
Viewers also liked
Viewers also liked (20)
Similar to School Aid by District (New York State)
Similar to School Aid by District (New York State) (20)
More from Luis Taveras EMBA, MS
More from Luis Taveras EMBA, MS (20)
Recently uploaded
Recently uploaded (20)
School Aid by District (New York State)
- 1. Find Your District 2013-14 Executive Budget -- Formula-Based School Aid The amounts below do not include other Education aid that will also be distributed to school districts for the 2013-14 school year: $203 million in Fiscal Stabilization Funding; $75 million in State of the State Initiatives including Full-Day Pre-kindergarten and Extended Learning grants; and $50 million in performance and management efficiency grants that will be distributed through a competitive process. Funding that has not yet been distributed to specific school districts represents 37 percent of the overall year-to- year increase in Education Aid. School Aid Without Building School Aid Including Building Aid Aid 2012-13 2013-14 Percent Percent County District School Year School Year Annual Change Change Annual Change Change Albany Albany $76,830,409 $77,016,057 $185,648 0.2% $666,580 1.0% Albany Berne Knox $7,781,886 $8,362,058 $580,172 7.5% $313,261 4.7% Albany Bethlehem $22,784,388 $22,295,772 ($488,616) -2.1% ($395,796) -2.5% Albany Ravena Coeyman $14,096,927 $14,493,845 $396,918 2.8% $538,779 4.6% Albany Cohoes $21,146,524 $21,358,719 $212,195 1.0% $538,015 3.4% Albany South Colonie $19,124,609 $19,542,671 $418,062 2.2% $552,568 3.4% Albany Menands $655,789 $759,193 $103,404 15.8% $122,881 24.5% Albany North Colonie $16,922,265 $16,951,407 $29,142 0.2% ($36,719) -0.3% Albany Green Island $2,867,520 $2,853,303 ($14,217) -0.5% $5,568 0.3% Albany Guilderland $20,697,284 $21,193,052 $495,768 2.4% $575,545 3.6% Albany Voorheesville $5,305,023 $5,063,526 ($241,497) -4.6% ($241,495) -5.9% Albany Watervliet $15,681,050 $15,923,458 $242,408 1.5% $287,370 2.2% Allegany Alfred Almond $6,443,139 $6,519,613 $76,474 1.2% $8,506 0.2% Allegany Andover $4,858,475 $4,972,607 $114,132 2.3% $122,816 3.1% Allegany Genesee Valley $9,828,871 $10,072,682 $243,811 2.5% $242,905 3.0% Allegany Belfast $6,438,350 $6,614,931 $176,581 2.7% $197,378 3.9% Allegany Canaseraga $4,150,372 $4,289,424 $139,052 3.4% $185,329 5.5% Allegany Friendship $6,617,637 $6,844,252 $226,615 3.4% $226,616 4.4% Allegany Fillmore $10,376,605 $10,599,024 $222,419 2.1% $227,865 2.7% Allegany Whitesville $4,464,777 $4,626,933 $162,156 3.6% $164,641 4.8% Allegany Cuba-Rushford $12,098,475 $13,173,128 $1,074,653 8.9% $431,793 4.0% Allegany Scio $6,677,235 $6,619,577 ($57,658) -0.9% $72,362 1.3% Allegany Wellsville $16,258,054 $16,716,156 $458,102 2.8% $489,636 4.1% Allegany Bolivar-Richbg $13,421,366 $13,827,936 $406,570 3.0% $386,940 3.6% Broome Chenango Forks $15,567,856 $16,273,856 $706,000 4.5% $641,865 5.0% Broome Binghamton $51,738,646 $58,593,856 $6,855,210 13.2% $1,988,205 4.3% Broome Harpursville $11,414,152 $11,641,816 $227,664 2.0% $265,993 2.5% Broome Susquehanna Va $15,747,106 $16,189,599 $442,493 2.8% $32,983 0.3% Broome Chenango Valle $12,660,031 $12,769,176 $109,145 0.9% $158,366 1.5% Broome Maine Endwell $19,808,045 $20,719,006 $910,961 4.6% $925,390 6.4%
- 2. 2013-14 Executive Budget -- Formula-Based School Aid The amounts below do not include other Education aid that will also be distributed to school districts for the 2013-14 school year: $203 million in Fiscal Stabilization Funding; $75 million in State of the State Initiatives including Full-Day Pre-kindergarten and Extended Learning grants; and $50 million in performance and management efficiency grants that will be distributed through a competitive process. Funding that has not yet been distributed to specific school districts represents 37 percent of the overall year-to- year increase in Education Aid. School Aid Without Building School Aid Including Building Aid Aid 2012-13 2013-14 Percent Percent County District School Year School Year Annual Change Change Annual Change Change Broome Deposit $5,718,064 $5,922,591 $204,527 3.6% $90,760 1.8% Broome Whitney Point $21,001,098 $22,671,666 $1,670,568 8.0% $1,233,328 7.1% Broome Union-Endicott $28,828,046 $30,427,525 $1,599,479 5.5% $1,287,589 5.5% Broome Johnson City $20,814,475 $21,349,683 $535,208 2.6% $592,710 3.5% Broome Vestal $20,906,231 $20,775,292 ($130,939) -0.6% $282,569 1.8% Broome Windsor $17,522,770 $17,671,958 $149,188 0.9% $170,168 1.2% Cattaraugus West Valley $4,345,696 $4,459,856 $114,160 2.6% $131,849 3.7% Cattaraugus Allegany-Limes $12,584,002 $12,877,274 $293,272 2.3% $293,273 2.9% Cattaraugus Ellicottville $3,333,804 $3,414,191 $80,387 2.4% $80,387 2.8% Cattaraugus Franklinville $12,979,988 $13,126,942 $146,954 1.1% $183,772 1.8% Cattaraugus Hinsdale $6,241,130 $6,278,869 $37,739 0.6% $139,430 2.6% Cattaraugus Cattaraugus-Li $15,684,530 $16,437,550 $753,020 4.8% $771,151 6.5% Cattaraugus Olean $21,406,905 $22,178,923 $772,018 3.6% $785,712 4.4% Cattaraugus Gowanda $16,163,986 $17,359,870 $1,195,884 7.4% $466,315 3.4% Cattaraugus Portville $10,100,796 $9,982,967 ($117,829) -1.2% $182,331 2.2% Cattaraugus Randolph $11,632,377 $12,401,681 $769,304 6.6% $743,884 7.7% Cattaraugus Salamanca $18,039,894 $18,395,424 $355,530 2.0% $407,844 2.8% Cattaraugus Yorkshre-Pione $31,117,555 $31,952,388 $834,833 2.7% $921,597 3.3% Cayuga Auburn $33,072,712 $34,408,648 $1,335,936 4.0% $952,110 3.4% Cayuga Weedsport $7,854,860 $8,372,651 $517,791 6.6% $450,475 7.8% Cayuga Cato Meridian $11,706,543 $12,192,574 $486,031 4.2% $452,709 4.6% Cayuga Southern Cayug $7,512,378 $8,034,256 $521,878 6.9% $239,736 3.8% Cayuga Port Byron $11,280,052 $12,212,010 $931,958 8.3% $197,663 2.0% Cayuga Moravia $10,579,306 $10,607,291 $27,985 0.3% $159,671 1.8% Cayuga Union Springs $7,739,489 $7,914,893 $175,404 2.3% $175,406 2.8% Chautauqua Southwestern $10,784,298 $11,086,809 $302,511 2.8% $322,504 4.3% Chautauqua Frewsburg $8,999,961 $9,081,323 $81,362 0.9% $91,433 1.2% Chautauqua Cassadaga Vall $13,829,226 $14,201,106 $371,880 2.7% $395,457 3.2% Chautauqua Chautauqua $6,956,264 $6,772,225 ($184,039) -2.6% ($17,101) -0.4% Chautauqua Pine Valley $9,914,113 $10,264,594 $350,481 3.5% $374,977 4.6%
- 3. 2013-14 Executive Budget -- Formula-Based School Aid The amounts below do not include other Education aid that will also be distributed to school districts for the 2013-14 school year: $203 million in Fiscal Stabilization Funding; $75 million in State of the State Initiatives including Full-Day Pre-kindergarten and Extended Learning grants; and $50 million in performance and management efficiency grants that will be distributed through a competitive process. Funding that has not yet been distributed to specific school districts represents 37 percent of the overall year-to- year increase in Education Aid. School Aid Without Building School Aid Including Building Aid Aid 2012-13 2013-14 Percent Percent County District School Year School Year Annual Change Change Annual Change Change Chautauqua Clymer $4,974,411 $5,104,236 $129,825 2.6% $129,828 3.6% Chautauqua Dunkirk $24,335,616 $24,294,895 ($40,721) -0.2% $532,167 2.7% Chautauqua Bemus Point $4,171,320 $4,194,343 $23,023 0.6% $56,164 1.7% Chautauqua Falconer $11,144,915 $11,551,304 $406,389 3.6% $343,187 3.7% Chautauqua Silver Creek $11,804,468 $11,954,217 $149,749 1.3% $208,665 2.0% Chautauqua Forestville $6,462,981 $6,628,981 $166,000 2.6% $187,362 3.6% Chautauqua Panama $7,562,522 $7,765,652 $203,130 2.7% $202,709 3.5% Chautauqua Jamestown $56,224,411 $53,527,024 ($2,697,387) -4.8% $1,766,640 3.9% Chautauqua Fredonia $11,317,721 $11,678,803 $361,082 3.2% $393,837 4.5% Chautauqua Brocton $9,549,716 $11,149,415 $1,599,699 16.8% $439,599 5.6% Chautauqua Ripley $5,655,161 $6,073,344 $418,183 7.4% $418,974 8.9% Chautauqua Sherman $6,073,736 $6,287,006 $213,270 3.5% $229,669 4.4% Chautauqua Westfield $7,401,651 $7,705,535 $303,884 4.1% $315,059 4.6% Chemung Elmira $77,227,749 $79,870,407 $2,642,658 3.4% $2,737,339 4.3% Chemung Horseheads $26,724,730 $27,131,033 $406,303 1.5% $553,027 2.4% Chemung Elmira Heights $10,250,978 $10,286,581 $35,603 0.3% $35,813 0.5% Chenango Afton $10,047,441 $10,608,408 $560,967 5.6% $639,875 8.1% Chenango Bainbridge Gui $9,825,279 $10,037,203 $211,924 2.2% $211,927 2.5% Chenango Greene $15,910,955 $16,490,114 $579,159 3.6% $451,006 3.6% Chenango Unadilla $14,339,572 $14,693,276 $353,704 2.5% $263,604 2.3% Chenango Norwich $23,684,420 $24,298,866 $614,446 2.6% $643,599 3.3% Chenango Grgetwn-So Ots $5,403,020 $5,417,855 $14,835 0.3% $14,837 0.3% Chenango Oxford $11,614,256 $12,120,800 $506,544 4.4% $377,414 3.9% Chenango Sherburne Earl $21,236,668 $21,417,117 $180,449 0.8% $180,450 1.0% Clinton Ausable Valley $15,566,931 $15,993,806 $426,875 2.7% $430,174 4.0% Clinton Beekmantown $15,434,761 $15,912,930 $478,169 3.1% $472,024 3.7% Clinton Northeastern $14,204,471 $14,028,410 ($176,061) -1.2% $111,845 0.9% Clinton Chazy $4,117,383 $4,180,785 $63,402 1.5% $76,197 2.5% Clinton Northrn Adiron $13,759,118 $14,827,771 $1,068,653 7.8% $308,561 2.7% Clinton Peru $19,857,828 $20,717,023 $859,195 4.3% $859,197 5.3%
- 4. 2013-14 Executive Budget -- Formula-Based School Aid The amounts below do not include other Education aid that will also be distributed to school districts for the 2013-14 school year: $203 million in Fiscal Stabilization Funding; $75 million in State of the State Initiatives including Full-Day Pre-kindergarten and Extended Learning grants; and $50 million in performance and management efficiency grants that will be distributed through a competitive process. Funding that has not yet been distributed to specific school districts represents 37 percent of the overall year-to- year increase in Education Aid. School Aid Without Building School Aid Including Building Aid Aid 2012-13 2013-14 Percent Percent County District School Year School Year Annual Change Change Annual Change Change Clinton Plattsburgh $15,382,689 $15,485,864 $103,175 0.7% $127,341 1.0% Clinton Saranac $15,320,604 $15,385,235 $64,631 0.4% $515,042 3.6% Columbia Copake-Taconic $10,035,906 $10,144,150 $108,244 1.1% $196,811 2.6% Columbia Germantown $4,258,931 $4,322,422 $63,491 1.5% $63,494 1.8% Columbia Chatham $6,158,994 $6,330,181 $171,187 2.8% $171,191 3.5% Columbia Hudson $19,004,518 $19,575,613 $571,095 3.0% $540,043 3.7% Columbia Kinderhook $11,041,682 $11,249,371 $207,689 1.9% $217,278 2.2% Columbia New Lebanon $3,158,193 $3,090,477 ($67,716) -2.1% ($62,071) -2.5% Cortland Cincinnatus $9,383,918 $9,736,640 $352,722 3.8% $278,334 3.5% Cortland Cortland $24,953,807 $24,869,976 ($83,831) -0.3% $776,090 3.7% Cortland Mcgraw $7,023,218 $7,892,263 $869,045 12.4% $395,657 6.9% Cortland Homer $18,998,164 $19,411,958 $413,794 2.2% $413,796 2.7% Cortland Marathon $10,952,184 $10,869,705 ($82,479) -0.8% $106,159 1.1% Delaware Andes $686,170 $665,419 ($20,751) -3.0% ($25,741) -3.8% Delaware Downsville $1,546,617 $1,388,225 ($158,392) -10.2% ($115,618) -9.6% Delaware Charlotte Vall $5,014,233 $5,231,525 $217,292 4.3% $217,297 5.3% Delaware Delhi $8,241,407 $8,290,587 $49,180 0.6% $49,184 0.9% Delaware Franklin $3,073,141 $3,187,667 $114,526 3.7% $114,527 4.0% Delaware Hancock $4,896,408 $5,006,781 $110,373 2.3% $110,373 2.4% Delaware Margaretville $2,754,667 $2,808,926 $54,259 2.0% $44,889 2.2% Delaware Roxbury $3,007,660 $3,110,603 $102,943 3.4% $102,820 3.9% Delaware Sidney $15,104,796 $15,216,751 $111,955 0.7% ($58,509) -0.5% Delaware Stamford $4,749,010 $4,892,790 $143,780 3.0% $143,783 3.5% Delaware S. Kortright $3,696,788 $3,844,539 $147,751 4.0% $147,754 4.7% Delaware Walton $11,788,213 $11,897,312 $109,099 0.9% $79,626 0.8% Dutchess Beacon $23,206,280 $23,037,351 ($168,929) -0.7% $596,205 3.3% Dutchess Dover $10,128,476 $10,189,465 $60,989 0.6% $60,879 0.7% Dutchess Hyde Park $22,495,396 $23,376,555 $881,159 3.9% $968,915 4.8% Dutchess Northeast $4,986,195 $5,210,663 $224,468 4.5% $224,469 5.7% Dutchess Pawling $5,231,872 $5,205,950 ($25,922) -0.5% ($49,262) -1.0%
- 5. 2013-14 Executive Budget -- Formula-Based School Aid The amounts below do not include other Education aid that will also be distributed to school districts for the 2013-14 school year: $203 million in Fiscal Stabilization Funding; $75 million in State of the State Initiatives including Full-Day Pre-kindergarten and Extended Learning grants; and $50 million in performance and management efficiency grants that will be distributed through a competitive process. Funding that has not yet been distributed to specific school districts represents 37 percent of the overall year-to- year increase in Education Aid. School Aid Without Building School Aid Including Building Aid Aid 2012-13 2013-14 Percent Percent County District School Year School Year Annual Change Change Annual Change Change Dutchess Pine Plains $5,683,926 $5,651,633 ($32,293) -0.6% $4,362 0.1% Dutchess Poughkeepsie $53,630,185 $55,507,318 $1,877,133 3.5% $736,542 1.4% Dutchess Arlington $47,657,270 $51,439,345 $3,782,075 7.9% $3,740,523 9.3% Dutchess Spackenkill $6,869,469 $6,513,993 ($355,476) -5.2% ($370,055) -6.4% Dutchess Red Hook $14,148,801 $14,515,671 $366,870 2.6% $401,008 3.6% Dutchess Rhinebeck $2,883,267 $2,951,793 $68,526 2.4% $61,045 3.1% Dutchess Wappingers $46,158,077 $43,233,933 ($2,924,144) -6.3% ($2,867,916) -6.4% Dutchess Millbrook $2,650,252 $2,628,883 ($21,369) -0.8% ($24,276) -1.0% Erie Alden $12,862,296 $13,133,610 $271,314 2.1% $222,641 2.2% Erie Amherst $10,893,470 $10,749,757 ($143,713) -1.3% $74,496 0.9% Erie Williamsville $33,664,062 $34,491,396 $827,334 2.5% $40,220 0.1% Erie Sweet Home $20,391,344 $19,830,241 ($561,103) -2.8% $152,832 1.0% Erie East Aurora $7,603,899 $7,303,294 ($300,605) -4.0% ($240,605) -4.4% Erie Buffalo $633,606,117 $639,067,570 $5,461,453 0.9% $11,064,509 2.2% Erie Cheektowaga $11,744,497 $12,068,182 $323,685 2.8% $357,143 3.9% Erie Maryvale $13,532,526 $13,879,230 $346,704 2.6% $387,686 3.7% Erie Cleveland Hill $12,435,283 $12,553,535 $118,252 1.0% $40,465 0.4% Erie Depew $15,559,939 $16,177,452 $617,513 4.0% $741,938 5.8% Erie Sloan $13,003,037 $13,898,873 $895,836 6.9% $921,756 8.7% Erie Clarence $21,616,450 $21,069,470 ($546,980) -2.5% $257,752 1.6% Erie Springville-Gr $15,713,726 $15,846,148 $132,422 0.8% $154,938 1.1% Erie Eden $9,749,900 $9,869,148 $119,248 1.2% $63,069 0.8% Erie Iroquois $12,136,249 $11,670,996 ($465,253) -3.8% $584,708 6.0% Erie Evans-Brant $25,875,958 $25,800,596 ($75,362) -0.3% $547,529 2.6% Erie Grand Island $14,587,152 $14,820,781 $233,629 1.6% $241,321 1.9% Erie Hamburg $19,777,834 $22,043,469 $2,265,635 11.5% $642,013 3.7% Erie Frontier $26,712,212 $27,830,776 $1,118,564 4.2% $571,787 2.3% Erie Holland $8,561,031 $8,589,663 $28,632 0.3% $74,237 1.1% Erie Lackawanna $28,050,778 $28,861,797 $811,019 2.9% $557,027 2.1% Erie Lancaster $28,115,202 $29,246,886 $1,131,684 4.0% $1,199,614 4.9%
- 6. 2013-14 Executive Budget -- Formula-Based School Aid The amounts below do not include other Education aid that will also be distributed to school districts for the 2013-14 school year: $203 million in Fiscal Stabilization Funding; $75 million in State of the State Initiatives including Full-Day Pre-kindergarten and Extended Learning grants; and $50 million in performance and management efficiency grants that will be distributed through a competitive process. Funding that has not yet been distributed to specific school districts represents 37 percent of the overall year-to- year increase in Education Aid. School Aid Without Building School Aid Including Building Aid Aid 2012-13 2013-14 Percent Percent County District School Year School Year Annual Change Change Annual Change Change Erie Akron $13,936,259 $13,948,731 $12,472 0.1% $103,337 1.0% Erie North Collins $6,578,574 $6,765,989 $187,415 2.8% $202,176 4.0% Erie Orchard Park $20,794,340 $21,141,987 $347,647 1.7% $372,386 2.1% Erie Tonawanda $15,305,928 $15,514,432 $208,504 1.4% $167,846 1.3% Erie Kenmore $46,738,898 $47,760,104 $1,021,206 2.2% $169,672 0.4% Erie West Seneca $39,189,056 $40,070,621 $881,565 2.2% $1,157,643 3.4% Essex Crown Point $3,943,947 $4,161,340 $217,393 5.5% $227,723 6.3% Essex Elizabethtown $3,226,615 $3,233,309 $6,694 0.2% $6,695 0.2% Essex Keene $624,273 $541,002 ($83,271) -13.3% ($83,270) -15.7% Essex Minerva $1,070,700 $1,018,478 ($52,222) -4.9% ($52,222) -5.2% Essex Moriah $10,456,256 $10,701,715 $245,459 2.3% $255,543 3.1% Essex Newcomb $423,584 $404,890 ($18,694) -4.4% ($18,692) -5.2% Essex Lake Placid $2,309,659 $2,280,888 ($28,771) -1.2% ($26,823) -1.4% Essex Schroon Lake $810,275 $749,271 ($61,004) -7.5% ($61,004) -8.0% Essex Ticonderoga $6,398,877 $6,508,160 $109,283 1.7% $109,286 2.1% Essex Westport $1,888,657 $1,895,427 $6,770 0.4% $6,757 0.4% Essex Willsboro $2,143,239 $2,123,390 ($19,849) -0.9% ($19,847) -1.1% Franklin Tupper Lake $7,563,803 $7,646,376 $82,573 1.1% $82,577 1.3% Franklin Chateaugay $7,024,640 $7,181,023 $156,383 2.2% $174,531 3.1% Franklin Salmon River $22,044,386 $23,062,565 $1,018,179 4.6% $918,363 4.9% Franklin Saranac Lake $7,141,849 $7,058,983 ($82,866) -1.2% ($21,687) -0.3% Franklin Malone $29,423,979 $30,856,890 $1,432,911 4.9% $1,197,563 4.8% Franklin Brushton Moira $12,537,675 $12,925,799 $388,124 3.1% $443,603 4.3% Franklin St Regis Falls $4,421,987 $4,686,711 $264,724 6.0% $280,797 7.3% Fulton Wheelerville $1,381,853 $1,376,065 ($5,788) -0.4% ($5,785) -0.5% Fulton Gloversville $37,713,508 $38,501,091 $787,583 2.1% $443,020 1.5% Fulton Johnstown $16,956,606 $17,607,076 $650,470 3.8% $678,295 4.3% Fulton Mayfield $8,495,254 $8,485,063 ($10,191) -0.1% ($10,188) -0.1% Fulton Northville $3,319,028 $3,498,464 $179,436 5.4% $177,102 6.2% Fulton Oppenheim Ephr $5,372,096 $5,418,406 $46,310 0.9% $56,859 1.3%
- 7. 2013-14 Executive Budget -- Formula-Based School Aid The amounts below do not include other Education aid that will also be distributed to school districts for the 2013-14 school year: $203 million in Fiscal Stabilization Funding; $75 million in State of the State Initiatives including Full-Day Pre-kindergarten and Extended Learning grants; and $50 million in performance and management efficiency grants that will be distributed through a competitive process. Funding that has not yet been distributed to specific school districts represents 37 percent of the overall year-to- year increase in Education Aid. School Aid Without Building School Aid Including Building Aid Aid 2012-13 2013-14 Percent Percent County District School Year School Year Annual Change Change Annual Change Change Fulton Broadalbin-Per $14,936,564 $14,533,223 ($403,341) -2.7% $146,969 1.3% Genesee Alexander $9,683,166 $10,091,201 $408,035 4.2% $453,840 5.8% Genesee Batavia $23,398,929 $23,676,044 $277,115 1.2% $337,187 1.8% Genesee Byron Bergen $10,917,880 $11,174,634 $256,754 2.4% $282,036 3.4% Genesee Elba $5,841,067 $5,892,730 $51,663 0.9% $95,848 2.1% Genesee Le Roy $10,620,881 $10,950,942 $330,061 3.1% $82,942 0.9% Genesee Oakfield Alaba $10,755,445 $10,764,335 $8,890 0.1% $365,598 3.8% Genesee Pavilion $9,703,847 $9,862,531 $158,684 1.6% $162,865 2.1% Genesee Pembroke $10,444,891 $10,631,420 $186,529 1.8% $233,029 2.7% Greene Cairo-Durham $12,230,047 $12,486,387 $256,340 2.1% $198,504 2.0% Greene Catskill $14,547,568 $15,061,518 $513,950 3.5% $505,181 4.9% Greene Coxsackie Athe $7,690,802 $8,515,506 $824,704 10.7% $174,348 2.7% Greene Greenville $9,686,569 $10,165,081 $478,512 4.9% $478,515 5.5% Greene Hunter Tanners $1,970,947 $1,907,964 ($62,983) -3.2% $27,686 1.6% Greene Windham Ashlan $1,179,500 $1,165,051 ($14,449) -1.2% ($14,449) -1.3% Hamilton Indian Lake $618,468 $551,082 ($67,386) -10.9% ($98,577) -16.2% Hamilton Lake Pleasant $534,366 $396,966 ($137,400) -25.7% ($132,980) -28.1% Hamilton Long Lake $404,431 $297,111 ($107,320) -26.5% ($107,320) -27.5% Hamilton Wells $956,643 $949,268 ($7,375) -0.8% ($7,373) -0.8% Herkimer West Canada Va $9,179,127 $9,487,158 $308,031 3.4% $380,304 4.7% Herkimer Frankfort-Schu $9,370,587 $9,645,213 $274,626 2.9% $280,332 3.7% Herkimer Ilion $18,866,794 $19,603,479 $736,685 3.9% $736,687 5.0% Herkimer Mohawk $9,756,705 $10,045,787 $289,082 3.0% $302,374 3.8% Herkimer Herkimer $10,890,111 $11,733,387 $843,276 7.7% $702,723 8.5% Herkimer Little Falls $12,371,998 $11,865,595 ($506,403) -4.1% $434,360 4.7% Herkimer Dolgeville $10,779,722 $11,055,397 $275,675 2.6% $275,678 2.9% Herkimer Poland $5,518,716 $5,688,377 $169,661 3.1% $167,246 3.3% Herkimer Van Hornsville $3,450,343 $3,538,341 $87,998 2.6% $112,379 4.5% Herkimer Town Of Webb $823,037 $704,700 ($118,337) -14.4% ($118,973) -15.9% Herkimer Mt Markham Csd $15,837,309 $16,867,364 $1,030,055 6.5% $523,833 4.0%
- 8. 2013-14 Executive Budget -- Formula-Based School Aid The amounts below do not include other Education aid that will also be distributed to school districts for the 2013-14 school year: $203 million in Fiscal Stabilization Funding; $75 million in State of the State Initiatives including Full-Day Pre-kindergarten and Extended Learning grants; and $50 million in performance and management efficiency grants that will be distributed through a competitive process. Funding that has not yet been distributed to specific school districts represents 37 percent of the overall year-to- year increase in Education Aid. School Aid Without Building School Aid Including Building Aid Aid 2012-13 2013-14 Percent Percent County District School Year School Year Annual Change Change Annual Change Change Jefferson S. Jefferson $19,906,654 $20,523,533 $616,879 3.1% $616,881 3.7% Jefferson Alexandria $4,032,896 $4,213,692 $180,796 4.5% $171,805 5.0% Jefferson Indian River $43,885,623 $46,750,623 $2,865,000 6.5% $2,865,005 7.7% Jefferson General Brown $11,843,618 $12,392,634 $549,016 4.6% $538,909 5.5% Jefferson Thousand Islan $7,337,075 $7,634,948 $297,873 4.1% $228,974 3.9% Jefferson Belleville-Hen $4,035,212 $4,157,345 $122,133 3.0% $122,135 3.7% Jefferson Sackets Harbor $3,195,627 $3,286,228 $90,601 2.8% $90,603 3.6% Jefferson Lyme $2,888,181 $3,012,584 $124,403 4.3% $124,406 5.3% Jefferson La Fargeville $5,338,936 $5,483,591 $144,655 2.7% $133,638 3.2% Jefferson Watertown $37,284,124 $38,297,763 $1,013,639 2.7% $988,223 3.0% Jefferson Carthage $32,628,069 $34,193,814 $1,565,745 4.8% $1,568,927 5.7% Lewis Copenhagen $7,462,924 $7,270,210 ($192,714) -2.6% $181,313 3.2% Lewis Harrisville $4,907,414 $5,192,840 $285,426 5.8% $244,481 6.1% Lewis Lowville $17,156,019 $17,550,960 $394,941 2.3% $455,888 3.6% Lewis South Lewis $15,040,933 $15,080,292 $39,359 0.3% $309,733 2.7% Lewis Beaver River $8,501,717 $8,983,644 $481,927 5.7% $411,273 6.0% Livingston Avon $7,475,632 $7,655,562 $179,930 2.4% $178,824 3.3% Livingston Caledonia Mumf $8,208,125 $8,469,802 $261,677 3.2% $276,032 4.3% Livingston Geneseo $5,790,205 $5,861,178 $70,973 1.2% $98,625 2.0% Livingston Livonia $13,357,295 $13,853,568 $496,273 3.7% $275,104 2.6% Livingston Mount Morris $7,832,553 $8,209,434 $376,881 4.8% $387,221 7.0% Livingston Dansville $18,949,244 $19,528,754 $579,510 3.1% $601,340 4.0% Livingston Dalton-Nunda $12,824,565 $13,069,573 $245,008 1.9% $286,918 2.9% Livingston York $8,252,077 $8,490,158 $238,081 2.9% $249,747 3.6% Madison Brookfield $3,905,275 $3,888,145 ($17,130) -0.4% $8,384 0.3% Madison Cazenovia $7,723,217 $7,934,156 $210,939 2.7% $284,749 4.6% Madison De Ruyter $5,193,859 $5,457,687 $263,828 5.1% $258,295 5.7% Madison Morrisville Ea $9,747,365 $9,985,595 $238,230 2.4% $256,246 3.3% Madison Hamilton $4,067,339 $4,119,836 $52,497 1.3% $52,499 1.6% Madison Canastota $11,696,937 $11,960,736 $263,799 2.3% $346,280 3.3%
- 9. 2013-14 Executive Budget -- Formula-Based School Aid The amounts below do not include other Education aid that will also be distributed to school districts for the 2013-14 school year: $203 million in Fiscal Stabilization Funding; $75 million in State of the State Initiatives including Full-Day Pre-kindergarten and Extended Learning grants; and $50 million in performance and management efficiency grants that will be distributed through a competitive process. Funding that has not yet been distributed to specific school districts represents 37 percent of the overall year-to- year increase in Education Aid. School Aid Without Building School Aid Including Building Aid Aid 2012-13 2013-14 Percent Percent County District School Year School Year Annual Change Change Annual Change Change Madison Madison $5,046,497 $5,239,954 $193,457 3.8% $195,958 4.6% Madison Oneida City $20,132,181 $20,703,188 $571,007 2.8% $571,002 3.4% Madison Stockbridge Va $6,958,540 $7,246,074 $287,534 4.1% $287,075 5.1% Madison Chittenango $16,444,089 $16,993,878 $549,789 3.3% $484,887 3.6% Monroe Brighton $11,084,186 $11,739,522 $655,336 5.9% $686,146 8.3% Monroe Gates Chili $32,043,741 $30,888,609 ($1,155,132) -3.6% ($1,338,649) -4.8% Monroe Greece $74,671,091 $75,289,356 $618,265 0.8% $673,787 1.1% Monroe E. Irondequoit $24,147,622 $25,527,596 $1,379,974 5.7% $1,403,131 8.3% Monroe W. Irondequoit $21,060,632 $21,640,777 $580,145 2.8% $747,084 4.8% Monroe Honeoye Falls $13,963,770 $13,947,473 ($16,297) -0.1% $204,159 2.2% Monroe Spencerport $27,933,740 $29,096,260 $1,162,520 4.2% $1,232,204 5.7% Monroe Hilton $30,167,323 $31,294,017 $1,126,694 3.7% $1,230,343 5.1% Monroe Penfield $22,936,890 $21,758,761 ($1,178,129) -5.1% ($681,260) -4.0% Monroe Fairport $29,678,441 $30,574,157 $895,716 3.0% $1,068,313 4.2% Monroe East Rochester $9,312,769 $10,067,860 $755,091 8.1% $416,626 6.0% Monroe Pittsford $17,120,071 $16,755,370 ($364,701) -2.1% ($171,667) -1.4% Monroe Churchville Ch $35,212,493 $33,529,579 ($1,682,914) -4.8% $663,040 2.6% Monroe Rochester $457,469,958 $481,160,846 $23,690,888 5.2% $14,337,538 3.3% Monroe Rush Henrietta $25,745,961 $27,006,259 $1,260,298 4.9% $771,553 3.3% Monroe Brockport $33,209,894 $34,327,656 $1,117,762 3.4% $995,940 3.5% Monroe Webster $37,799,737 $42,199,061 $4,399,324 11.6% $4,456,172 14.2% Monroe Wheatland Chil $5,408,021 $5,600,935 $192,914 3.6% $220,456 5.0% Montgomery Amsterdam $33,274,382 $38,099,657 $4,825,275 14.5% $1,209,406 4.3% Montgomery Canajoharie $11,172,431 $11,751,402 $578,971 5.2% $604,377 6.8% Montgomery Fonda Fultonvi $13,065,263 $13,677,600 $612,337 4.7% $585,798 5.3% Montgomery Fort Plain $11,815,216 $12,481,633 $666,417 5.6% $686,231 7.1% Montgomery St Johnsville $5,799,377 $5,798,522 ($855) 0.0% $132,264 2.8% Nassau Glen Cove $7,295,388 $8,147,038 $851,650 11.7% $831,660 11.9% Nassau Hempstead $92,142,241 $94,725,696 $2,583,455 2.8% $2,418,875 2.7% Nassau Uniondale $32,530,970 $33,100,018 $569,048 1.7% $528,120 1.7%
- 10. 2013-14 Executive Budget -- Formula-Based School Aid The amounts below do not include other Education aid that will also be distributed to school districts for the 2013-14 school year: $203 million in Fiscal Stabilization Funding; $75 million in State of the State Initiatives including Full-Day Pre-kindergarten and Extended Learning grants; and $50 million in performance and management efficiency grants that will be distributed through a competitive process. Funding that has not yet been distributed to specific school districts represents 37 percent of the overall year-to- year increase in Education Aid. School Aid Without Building School Aid Including Building Aid Aid 2012-13 2013-14 Percent Percent County District School Year School Year Annual Change Change Annual Change Change Nassau East Meadow $36,164,608 $35,587,258 ($577,350) -1.6% ($237,896) -0.7% Nassau North Bellmore $11,070,114 $11,138,430 $68,316 0.6% ($188,952) -1.8% Nassau Levittown $47,945,164 $52,468,502 $4,523,338 9.4% $1,233,087 2.8% Nassau Seaford $10,609,684 $9,880,118 ($729,566) -6.9% $379,951 4.6% Nassau Bellmore $3,932,331 $3,880,854 ($51,477) -1.3% ($51,475) -1.5% Nassau Roosevelt $51,372,177 $51,680,622 $308,445 0.6% $2,425,641 6.6% Nassau Freeport $52,650,570 $55,155,737 $2,505,167 4.8% $2,400,557 4.9% Nassau Baldwin $24,089,424 $24,223,492 $134,068 0.6% ($81,281) -0.4% Nassau Oceanside $17,135,370 $16,465,806 ($669,564) -3.9% ($768,934) -4.8% Nassau Malverne $8,009,214 $8,564,938 $555,724 6.9% ($21,626) -0.3% Nassau V Str Thirteen $8,706,726 $9,099,310 $392,584 4.5% $363,933 4.2% Nassau Hewlett Woodme $6,804,351 $7,315,799 $511,448 7.5% $203,395 3.5% Nassau Lawrence $7,779,534 $8,275,586 $496,052 6.4% $572,935 7.6% Nassau Elmont $19,220,352 $20,843,786 $1,623,434 8.4% $1,515,152 8.4% Nassau Franklin Squar $6,339,129 $6,395,264 $56,135 0.9% $34,006 0.6% Nassau Garden City $4,697,661 $4,722,136 $24,475 0.5% $25,075 0.6% Nassau East Rockaway $5,776,165 $5,522,225 ($253,940) -4.4% ($260,713) -5.7% Nassau Lynbrook $7,244,932 $7,426,738 $181,806 2.5% $119,856 1.8% Nassau Rockville Cent $7,588,050 $7,801,786 $213,736 2.8% $315,635 4.6% Nassau Floral Park $3,194,450 $3,267,882 $73,432 2.3% $81,807 2.7% Nassau Wantagh $13,668,236 $14,213,549 $545,313 4.0% $590,297 4.8% Nassau V Str Twenty-F $4,780,099 $5,408,446 $628,347 13.1% $260,557 5.6% Nassau Merrick $4,914,473 $5,035,272 $120,799 2.5% $86,667 2.0% Nassau Island Trees $13,540,316 $14,041,566 $501,250 3.7% $406,578 3.3% Nassau West Hempstead $7,756,175 $7,451,726 ($304,449) -3.9% ($311,288) -4.0% Nassau North Merrick $5,510,419 $5,407,986 ($102,433) -1.9% ($117,381) -2.2% Nassau Valley Str Uf $5,310,799 $5,421,094 $110,295 2.1% $46,964 1.0% Nassau Island Park $1,937,377 $1,823,036 ($114,341) -5.9% ($127,196) -7.0% Nassau Valley Str Chs $16,481,173 $17,315,261 $834,088 5.1% $567,071 3.9% Nassau Sewanhaka $25,513,421 $27,167,918 $1,654,497 6.5% $1,474,702 6.0%
- 11. 2013-14 Executive Budget -- Formula-Based School Aid The amounts below do not include other Education aid that will also be distributed to school districts for the 2013-14 school year: $203 million in Fiscal Stabilization Funding; $75 million in State of the State Initiatives including Full-Day Pre-kindergarten and Extended Learning grants; and $50 million in performance and management efficiency grants that will be distributed through a competitive process. Funding that has not yet been distributed to specific school districts represents 37 percent of the overall year-to- year increase in Education Aid. School Aid Without Building School Aid Including Building Aid Aid 2012-13 2013-14 Percent Percent County District School Year School Year Annual Change Change Annual Change Change Nassau Bellmore-Merri $16,926,746 $17,903,056 $976,310 5.8% $925,373 5.8% Nassau Long Beach $19,183,006 $18,944,671 ($238,335) -1.2% $259,062 1.7% Nassau Westbury $32,393,970 $35,097,676 $2,703,706 8.3% $2,354,434 7.7% Nassau East Williston $2,422,038 $2,481,213 $59,175 2.4% $39,948 1.8% Nassau Roslyn $3,914,856 $4,070,117 $155,261 4.0% $56,389 1.6% Nassau Port Washingto $6,828,124 $6,842,833 $14,709 0.2% ($630) 0.0% Nassau New Hyde Park $4,330,362 $4,279,697 ($50,665) -1.2% ($134,887) -3.6% Nassau Manhasset $3,466,009 $3,358,516 ($107,493) -3.1% ($140,816) -4.3% Nassau Great Neck $7,037,504 $6,968,839 ($68,665) -1.0% ($225,699) -3.2% Nassau Herricks $8,314,639 $8,611,643 $297,004 3.6% $229,608 3.2% Nassau Mineola $5,058,615 $5,115,793 $57,178 1.1% $26,253 0.6% Nassau Carle Place $3,465,321 $3,536,663 $71,342 2.1% $52,833 1.7% Nassau North Shore $3,571,927 $3,630,648 $58,721 1.6% $16,047 0.5% Nassau Syosset $9,923,158 $9,627,404 ($295,754) -3.0% ($304,518) -3.4% Nassau Locust Valley $3,017,500 $3,180,731 $163,231 5.4% $125,283 4.4% Nassau Plainview $14,294,832 $13,974,610 ($320,222) -2.2% ($379,112) -2.9% Nassau Oyster Bay $2,213,948 $2,156,315 ($57,633) -2.6% ($73,116) -3.5% Nassau Jericho $3,993,660 $3,856,192 ($137,468) -3.4% ($122,890) -3.3% Nassau Hicksville $13,099,409 $12,887,546 ($211,863) -1.6% ($214,619) -1.8% Nassau Plainedge $16,790,510 $17,088,062 $297,552 1.8% $161,668 1.1% Nassau Bethpage $10,461,731 $10,282,157 ($179,574) -1.7% ($234,055) -2.7% Nassau Farmingdale $26,358,432 $25,824,825 ($533,607) -2.0% ($543,824) -2.2% Nassau Massapequa $25,747,747 $26,117,517 $369,770 1.4% ($46,209) -0.2% New York City New York City $7,896,916,684 $8,120,905,960 $223,989,276 2.8% $175,983,384 2.5% Niagara Lewiston Porte $13,235,929 $12,595,152 ($640,777) -4.8% ($468,101) -4.5% Niagara Lockport $38,624,046 $38,643,635 $19,589 0.1% $650,694 1.9% Niagara Newfane $16,750,399 $17,273,223 $522,824 3.1% $528,621 3.9% Niagara Niagara Wheatf $27,979,148 $28,635,178 $656,030 2.3% $330,066 1.5% Niagara Niagara Falls $89,430,177 $91,933,042 $2,502,865 2.8% $2,448,874 3.0% Niagara N. Tonawanda $31,036,363 $32,246,923 $1,210,560 3.9% $1,265,232 4.9%
- 12. 2013-14 Executive Budget -- Formula-Based School Aid The amounts below do not include other Education aid that will also be distributed to school districts for the 2013-14 school year: $203 million in Fiscal Stabilization Funding; $75 million in State of the State Initiatives including Full-Day Pre-kindergarten and Extended Learning grants; and $50 million in performance and management efficiency grants that will be distributed through a competitive process. Funding that has not yet been distributed to specific school districts represents 37 percent of the overall year-to- year increase in Education Aid. School Aid Without Building School Aid Including Building Aid Aid 2012-13 2013-14 Percent Percent County District School Year School Year Annual Change Change Annual Change Change Niagara Starpoint $18,029,380 $18,358,949 $329,569 1.8% $366,966 2.9% Niagara Royalton Hartl $11,245,533 $10,917,005 ($328,528) -2.9% $396,041 4.1% Niagara Barker $6,640,447 $6,698,704 $58,257 0.9% $87,514 1.7% Niagara Wilson $11,296,075 $11,472,096 $176,021 1.6% ($231,651) -2.5% Oneida Adirondack $14,740,038 $14,965,001 $224,963 1.5% $219,854 1.8% Oneida Camden $30,805,375 $32,900,776 $2,095,401 6.8% $1,136,132 4.5% Oneida Clinton $8,776,139 $8,855,741 $79,602 0.9% $157,488 2.3% Oneida New Hartford $11,998,474 $12,013,013 $14,539 0.1% $231,522 2.6% Oneida New York Mills $3,516,044 $3,784,367 $268,323 7.6% $268,036 9.1% Oneida Sauquoit Valle $10,529,083 $10,652,107 $123,024 1.2% $68,190 0.8% Oneida Remsen $5,171,987 $5,312,575 $140,588 2.7% $141,020 3.0% Oneida Rome $62,892,384 $63,428,823 $536,439 0.9% $522,367 1.0% Oneida Waterville $10,256,991 $10,400,589 $143,598 1.4% $178,667 2.1% Oneida Sherrill $16,090,963 $16,116,094 $25,131 0.2% $168,090 1.2% Oneida Holland Patent $13,821,932 $14,189,257 $367,325 2.7% $429,608 3.7% Oneida Utica $101,308,520 $103,942,023 $2,633,503 2.6% $4,272,610 4.8% Oneida Westmoreland $8,856,125 $9,038,359 $182,234 2.1% $219,747 2.8% Oneida Oriskany $6,377,790 $6,611,435 $233,645 3.7% $270,195 5.0% Oneida Whitesboro $23,132,680 $23,900,742 $768,062 3.3% $1,111,441 5.9% Onondaga West Genesee $25,506,765 $27,689,962 $2,183,197 8.6% $1,977,011 9.1% Onondaga North Syracuse $57,111,747 $57,662,323 $550,576 1.0% $1,637,084 3.4% Onondaga E Syracuse-Min $21,795,433 $21,748,807 ($46,626) -0.2% ($66,303) -0.4% Onondaga Jamesville-Dew $10,532,997 $10,871,121 $338,124 3.2% $417,729 5.3% Onondaga Jordan Elbridg $14,173,506 $13,389,346 ($784,160) -5.5% $170,736 1.6% Onondaga Fabius-Pompey $7,724,013 $7,569,932 ($154,081) -2.0% $317,791 5.5% Onondaga Westhill $12,734,109 $12,323,057 ($411,052) -3.2% ($364,865) -3.9% Onondaga Solvay $11,789,105 $12,186,761 $397,656 3.4% $400,426 4.5% Onondaga La Fayette $7,715,639 $7,932,642 $217,003 2.8% $237,988 3.6% Onondaga Baldwinsville $34,308,365 $35,354,961 $1,046,596 3.1% $1,133,371 3.9% Onondaga Fayetteville $16,565,246 $17,376,749 $811,503 4.9% $494,563 3.9%
- 13. 2013-14 Executive Budget -- Formula-Based School Aid The amounts below do not include other Education aid that will also be distributed to school districts for the 2013-14 school year: $203 million in Fiscal Stabilization Funding; $75 million in State of the State Initiatives including Full-Day Pre-kindergarten and Extended Learning grants; and $50 million in performance and management efficiency grants that will be distributed through a competitive process. Funding that has not yet been distributed to specific school districts represents 37 percent of the overall year-to- year increase in Education Aid. School Aid Without Building School Aid Including Building Aid Aid 2012-13 2013-14 Percent Percent County District School Year School Year Annual Change Change Annual Change Change Onondaga Marcellus $12,066,366 $11,591,731 ($474,635) -3.9% ($340,044) -3.5% Onondaga Onondaga $8,424,459 $8,482,957 $58,498 0.7% $117,526 1.8% Onondaga Liverpool $49,132,379 $50,556,462 $1,424,083 2.9% $1,061,128 2.5% Onondaga Lyncourt $2,952,557 $2,948,123 ($4,434) -0.2% $8,145 0.4% Onondaga Skaneateles $6,215,170 $6,185,295 ($29,875) -0.5% $110,455 2.8% Onondaga Syracuse $271,660,828 $279,212,747 $7,551,919 2.8% $7,321,605 2.9% Onondaga Tully $7,572,009 $7,779,343 $207,334 2.7% $213,245 3.5% Ontario Canandaigua $21,693,607 $22,124,997 $431,390 2.0% $417,972 2.4% Ontario East Bloomfiel $8,809,540 $8,995,305 $185,765 2.1% $116,020 1.8% Ontario Geneva $24,976,336 $26,175,013 $1,198,677 4.8% $1,028,681 5.1% Ontario Gorham-Middles $13,550,578 $13,562,386 $11,808 0.1% $11,984 0.1% Ontario Manchstr-Shrts $6,798,049 $6,747,936 ($50,113) -0.7% ($42,892) -0.8% Ontario Naples $5,976,251 $6,103,641 $127,390 2.1% ($81,435) -1.5% Ontario Phelps-Clifton $18,842,358 $17,307,558 ($1,534,800) -8.1% $159,362 1.2% Ontario Honeoye $6,548,144 $6,532,994 ($15,150) -0.2% ($8,427) -0.1% Ontario Victor $17,082,619 $18,717,947 $1,635,328 9.6% $320,421 2.5% Orange Washingtonvill $26,633,659 $27,051,517 $417,858 1.6% $523,878 2.2% Orange Chester $6,084,528 $6,113,990 $29,462 0.5% $29,463 0.6% Orange Cornwall $15,503,698 $15,576,961 $73,263 0.5% $41,024 0.3% Orange Pine Bush $45,465,580 $45,323,847 ($141,733) -0.3% $172,726 0.4% Orange Goshen $12,113,436 $12,429,960 $316,524 2.6% $315,354 2.9% Orange Highland Falls $8,196,340 $8,038,398 ($157,942) -1.9% ($135,199) -2.0% Orange Middletown $67,115,929 $69,148,361 $2,032,432 3.0% $418,816 0.7% Orange Minisink Valle $37,778,186 $37,330,950 ($447,236) -1.2% ($479,308) -1.6% Orange Monroe Woodbur $43,018,946 $43,193,789 $174,843 0.4% $18,994 0.0% Orange Kiryas Joel $5,237,062 $5,564,410 $327,348 6.3% $324,791 6.3% Orange Valley-Montgmr $29,973,416 $30,011,160 $37,744 0.1% ($233) 0.0% Orange Newburgh $122,734,540 $123,690,047 $955,507 0.8% $3,368,600 3.1% Orange Port Jervis $29,988,312 $31,226,028 $1,237,716 4.1% $1,039,040 3.8% Orange Tuxedo $847,229 $815,741 ($31,488) -3.7% ($39,137) -5.1%
- 14. 2013-14 Executive Budget -- Formula-Based School Aid The amounts below do not include other Education aid that will also be distributed to school districts for the 2013-14 school year: $203 million in Fiscal Stabilization Funding; $75 million in State of the State Initiatives including Full-Day Pre-kindergarten and Extended Learning grants; and $50 million in performance and management efficiency grants that will be distributed through a competitive process. Funding that has not yet been distributed to specific school districts represents 37 percent of the overall year-to- year increase in Education Aid. School Aid Without Building School Aid Including Building Aid Aid 2012-13 2013-14 Percent Percent County District School Year School Year Annual Change Change Annual Change Change Orange Warwick Valley $21,266,064 $21,629,899 $363,835 1.7% $347,097 1.9% Orange Greenwood Lake $5,933,141 $5,881,116 ($52,025) -0.9% ($61,479) -1.1% Orange Florida $5,062,465 $5,146,644 $84,179 1.7% $109,986 2.6% Orleans Albion $23,200,422 $23,593,747 $393,325 1.7% $523,825 2.6% Orleans Kendall $9,282,203 $9,152,948 ($129,255) -1.4% $339,877 4.1% Orleans Holley $11,792,137 $14,966,435 $3,174,298 26.9% $427,218 3.9% Orleans Medina $21,932,091 $22,463,495 $531,404 2.4% $531,409 3.0% Orleans Lyndonville $7,662,890 $7,683,845 $20,955 0.3% $127,894 2.1% Oswego Altmar Parish $21,893,386 $22,099,969 $206,583 0.9% $229,603 1.3% Oswego Fulton $39,397,203 $40,943,234 $1,546,031 3.9% $1,117,231 3.1% Oswego Hannibal $20,146,332 $20,514,111 $367,779 1.8% $367,783 2.3% Oswego Central Square $38,505,868 $39,322,874 $817,006 2.1% $796,973 2.3% Oswego Mexico $23,810,187 $25,627,311 $1,817,124 7.6% $878,921 4.1% Oswego Oswego $19,466,788 $19,266,312 ($200,476) -1.0% $83,414 0.5% Oswego Pulaski $13,586,488 $13,771,340 $184,852 1.4% $243,989 2.3% Oswego Sandy Creek $13,952,764 $14,441,170 $488,406 3.5% $489,810 4.3% Oswego Phoenix $23,562,559 $23,748,781 $186,222 0.8% $232,631 1.2% Otsego Glbtsvlle-Mt U $5,642,861 $5,746,841 $103,980 1.8% $14,890 0.3% Otsego Edmeston $6,528,569 $6,874,282 $345,713 5.3% $345,716 6.4% Otsego Laurens $5,486,686 $5,693,347 $206,661 3.8% $161,871 3.7% Otsego Schenevus $3,843,904 $4,246,282 $402,378 10.5% $340,399 9.7% Otsego Milford $4,664,728 $5,056,486 $391,758 8.4% $265,293 6.2% Otsego Morris $5,500,157 $5,985,378 $485,221 8.8% $485,731 10.2% Otsego Oneonta $12,466,909 $12,393,513 ($73,396) -0.6% $63,897 0.6% Otsego Otego-Unadilla $12,533,987 $12,909,069 $375,082 3.0% $379,606 3.8% Otsego Cooperstown $4,798,075 $4,818,156 $20,081 0.4% $90,472 2.3% Otsego Richfield Spri $6,488,424 $6,628,307 $139,883 2.2% $139,884 2.8% Otsego Cherry Vly-Spr $6,877,345 $6,983,693 $106,348 1.5% $101,066 1.9% Otsego Worcester $6,255,281 $6,568,971 $313,690 5.0% $277,561 6.4% Putnam Mahopac $26,707,217 $28,979,974 $2,272,757 8.5% $2,174,866 8.8%
- 15. 2013-14 Executive Budget -- Formula-Based School Aid The amounts below do not include other Education aid that will also be distributed to school districts for the 2013-14 school year: $203 million in Fiscal Stabilization Funding; $75 million in State of the State Initiatives including Full-Day Pre-kindergarten and Extended Learning grants; and $50 million in performance and management efficiency grants that will be distributed through a competitive process. Funding that has not yet been distributed to specific school districts represents 37 percent of the overall year-to- year increase in Education Aid. School Aid Without Building School Aid Including Building Aid Aid 2012-13 2013-14 Percent Percent County District School Year School Year Annual Change Change Annual Change Change Putnam Carmel $21,386,919 $22,120,399 $733,480 3.4% $380,110 1.9% Putnam Haldane $2,186,895 $2,183,963 ($2,932) -0.1% ($3,644) -0.2% Putnam Garrison $696,431 $640,217 ($56,214) -8.1% ($55,612) -9.4% Putnam Putnam Valley $8,805,320 $8,832,894 $27,574 0.3% $113,556 1.5% Putnam Brewster $14,608,955 $13,819,462 ($789,493) -5.4% ($570,015) -4.8% Rensselaer Berlin $7,732,792 $7,879,563 $146,771 1.9% $136,167 1.8% Rensselaer Brunswick Cent $7,697,845 $8,114,775 $416,930 5.4% $416,933 7.1% Rensselaer East Greenbush $23,147,682 $23,414,649 $266,967 1.2% $390,144 2.2% Rensselaer Hoosick Falls $9,738,750 $10,057,666 $318,916 3.3% $322,631 3.7% Rensselaer Lansingburgh $22,749,907 $23,796,236 $1,046,329 4.6% $1,048,804 5.3% Rensselaer Wynantskill $2,404,260 $2,444,831 $40,571 1.7% $62,168 3.5% Rensselaer Rensselaer $10,129,154 $10,364,265 $235,111 2.3% $265,408 3.2% Rensselaer Averill Park $22,820,900 $22,600,226 ($220,674) -1.0% $325,763 2.0% Rensselaer Hoosic Valley $9,478,283 $9,392,610 ($85,673) -0.9% $324,242 4.2% Rensselaer Schodack $6,828,283 $6,744,181 ($84,102) -1.2% $2,076 0.0% Rensselaer Troy $48,930,290 $48,973,928 $43,638 0.1% $1,090,471 2.5% Rockland Clarkstown $25,000,519 $25,788,741 $788,222 3.2% $679,363 3.1% Rockland Nanuet $5,548,702 $5,604,888 $56,186 1.0% $38,098 0.7% Rockland Haverstraw-St $43,243,602 $49,396,009 $6,152,407 14.2% $5,764,561 14.3% Rockland S. Orangetown $9,609,384 $9,843,450 $234,066 2.4% $139,032 1.7% Rockland Nyack $8,015,020 $8,127,614 $112,594 1.4% $188,834 2.6% Rockland Pearl River $8,032,377 $7,960,983 ($71,394) -0.9% ($90,366) -1.3% Rockland Ramapo $16,826,100 $17,417,248 $591,148 3.5% $583,825 4.5% Rockland East Ramapo $52,818,910 $53,942,961 $1,124,051 2.1% $806,788 1.6% St. Lawrence Brasher Falls $12,803,434 $13,705,914 $902,480 7.0% $902,480 8.2% St. Lawrence Canton $12,997,335 $14,277,567 $1,280,232 9.8% $874,378 7.4% St. Lawrence Clifton Fine $4,534,424 $4,474,814 ($59,610) -1.3% ($59,608) -1.6% St. Lawrence Colton Pierrep $2,394,950 $2,310,469 ($84,481) -3.5% ($24,180) -1.3% St. Lawrence Gouverneur $22,547,174 $23,064,463 $517,289 2.3% $530,516 2.6% St. Lawrence Hammond $3,072,548 $3,196,428 $123,880 4.0% $131,872 4.7%
- 16. 2013-14 Executive Budget -- Formula-Based School Aid The amounts below do not include other Education aid that will also be distributed to school districts for the 2013-14 school year: $203 million in Fiscal Stabilization Funding; $75 million in State of the State Initiatives including Full-Day Pre-kindergarten and Extended Learning grants; and $50 million in performance and management efficiency grants that will be distributed through a competitive process. Funding that has not yet been distributed to specific school districts represents 37 percent of the overall year-to- year increase in Education Aid. School Aid Without Building School Aid Including Building Aid Aid 2012-13 2013-14 Percent Percent County District School Year School Year Annual Change Change Annual Change Change St. Lawrence Hermon Dekalb $5,870,790 $6,026,252 $155,462 2.6% $163,443 3.2% St. Lawrence Lisbon $7,019,621 $7,149,441 $129,820 1.8% $135,133 2.2% St. Lawrence Madrid Wadding $8,160,889 $8,387,579 $226,690 2.8% $236,131 3.3% St. Lawrence Massena $25,934,669 $26,852,071 $917,402 3.5% $1,005,060 4.9% St. Lawrence Morristown $4,667,422 $4,678,230 $10,808 0.2% $10,809 0.3% St. Lawrence Norwood Norfol $12,728,687 $13,109,311 $380,624 3.0% $385,227 3.6% St. Lawrence Ogdensburg $21,140,027 $23,444,824 $2,304,797 10.9% $225,996 1.2% St. Lawrence Heuvelton $7,629,245 $8,129,573 $500,328 6.6% $339,795 5.2% St. Lawrence Parishville $5,659,234 $5,970,359 $311,125 5.5% $305,966 6.2% St. Lawrence Potsdam $13,139,893 $13,170,045 $30,152 0.2% $298,084 2.9% St. Lawrence Edwards-Knox $9,513,044 $9,749,587 $236,543 2.5% $236,544 2.8% Saratoga Burnt Hills $18,098,742 $18,859,629 $760,887 4.2% $760,890 5.2% Saratoga Shenendehowa $38,079,323 $37,842,427 ($236,896) -0.6% $528,125 1.7% Saratoga Corinth $9,201,771 $9,439,021 $237,250 2.6% $288,192 3.4% Saratoga Edinburg $657,964 $562,607 ($95,357) -14.5% ($95,356) -14.7% Saratoga Galway $6,814,509 $6,963,858 $149,349 2.2% $149,353 2.5% Saratoga Mechanicville $8,247,182 $8,563,068 $315,886 3.8% $304,286 4.5% Saratoga Ballston Spa $23,360,559 $24,336,805 $976,246 4.2% $248,207 1.3% Saratoga S. Glens Falls $22,269,783 $22,366,698 $96,915 0.4% $280,976 1.5% Saratoga Schuylerville $13,622,678 $13,961,750 $339,072 2.5% $174,819 1.5% Saratoga Saratoga Sprin $28,125,073 $27,865,730 ($259,343) -0.9% ($25,140) -0.1% Saratoga Stillwater $9,372,607 $9,756,607 $384,000 4.1% $293,416 4.4% Saratoga Waterford $5,967,309 $6,109,578 $142,269 2.4% $175,458 3.9% Schenectady Duanesburg $5,883,702 $5,941,336 $57,634 1.0% $62,150 1.2% Schenectady Scotia Glenvil $16,027,548 $16,161,819 $134,271 0.8% $128,813 1.0% Schenectady Niskayuna $18,839,279 $18,320,024 ($519,255) -2.8% ($172,679) -1.5% Schenectady Schalmont $11,253,800 $11,744,498 $490,698 4.4% $490,702 5.7% Schenectady Mohonasen $17,475,532 $18,069,834 $594,302 3.4% $591,154 4.4% Schenectady Schenectady $94,311,869 $98,201,754 $3,889,885 4.1% $4,056,979 4.7% Schoharie Gilboa Conesvi $2,871,832 $2,993,785 $121,953 4.2% $90,132 3.3%
- 17. 2013-14 Executive Budget -- Formula-Based School Aid The amounts below do not include other Education aid that will also be distributed to school districts for the 2013-14 school year: $203 million in Fiscal Stabilization Funding; $75 million in State of the State Initiatives including Full-Day Pre-kindergarten and Extended Learning grants; and $50 million in performance and management efficiency grants that will be distributed through a competitive process. Funding that has not yet been distributed to specific school districts represents 37 percent of the overall year-to- year increase in Education Aid. School Aid Without Building School Aid Including Building Aid Aid 2012-13 2013-14 Percent Percent County District School Year School Year Annual Change Change Annual Change Change Schoharie Jefferson $3,077,516 $3,184,891 $107,375 3.5% $167,285 6.7% Schoharie Middleburgh $9,425,862 $10,302,291 $876,429 9.3% $67,786 0.9% Schoharie Cobleskl-Richm $17,874,790 $18,511,672 $636,882 3.6% $690,911 5.0% Schoharie Schoharie $8,756,611 $8,949,184 $192,573 2.2% $160,287 2.2% Schoharie Sharon Springs $4,626,013 $4,851,474 $225,461 4.9% $234,950 6.4% Schuyler Odessa Montour $9,308,950 $9,440,171 $131,221 1.4% $307,641 3.9% Schuyler Watkins Glen $12,544,647 $12,414,256 ($130,391) -1.0% ($130,389) -1.4% Seneca South Seneca $12,483,129 $12,966,850 $483,721 3.9% $402,223 4.6% Seneca Romulus $4,879,265 $5,021,721 $142,456 2.9% $151,861 3.7% Seneca Seneca Falls $10,836,878 $11,894,338 $1,057,460 9.8% ($48,170) -0.5% Seneca Waterloo Cent $21,955,323 $22,168,644 $213,321 1.0% $229,852 1.4% Steuben Addison $17,349,607 $17,874,742 $525,135 3.0% $429,835 2.9% Steuben Avoca $8,957,159 $8,992,471 $35,312 0.4% $59,647 0.9% Steuben Bath $21,507,882 $21,961,558 $453,676 2.1% $451,517 2.7% Steuben Bradford $5,227,796 $5,480,241 $252,445 4.8% $252,449 6.2% Steuben Campbell-Savon $14,159,530 $14,587,504 $427,974 3.0% $624,139 5.5% Steuben Corning $33,171,339 $37,967,685 $4,796,346 14.5% $994,960 3.3% Steuben Canisteo-Green $15,466,296 $15,688,705 $222,409 1.4% $222,413 1.7% Steuben Hornell $24,394,714 $25,046,995 $652,281 2.7% $860,393 4.6% Steuben Arkport $5,695,021 $5,930,895 $235,874 4.1% $110,966 2.3% Steuben Prattsburg $5,913,888 $6,291,037 $377,149 6.4% $52,680 1.1% Steuben Jasper-Trpsbrg $7,560,081 $7,998,534 $438,453 5.8% $263,544 4.1% Steuben Hammondsport $3,720,074 $3,627,736 ($92,338) -2.5% ($92,337) -2.8% Steuben Wayland-Cohoct $19,173,519 $19,599,466 $425,947 2.2% $425,947 2.6% Suffolk Babylon $7,140,703 $6,905,676 ($235,027) -3.3% ($99,813) -1.5% Suffolk West Babylon $25,809,080 $26,691,749 $882,669 3.4% $851,635 3.6% Suffolk North Babylon $38,537,405 $40,275,063 $1,737,658 4.5% $1,411,854 4.3% Suffolk Lindenhurst $44,390,450 $46,574,738 $2,184,288 4.9% $1,647,542 4.0% Suffolk Copiague $41,464,382 $43,264,509 $1,800,127 4.3% $1,734,016 4.3% Suffolk Amityville $18,693,967 $19,857,687 $1,163,720 6.2% $1,067,935 6.1%
- 18. 2013-14 Executive Budget -- Formula-Based School Aid The amounts below do not include other Education aid that will also be distributed to school districts for the 2013-14 school year: $203 million in Fiscal Stabilization Funding; $75 million in State of the State Initiatives including Full-Day Pre-kindergarten and Extended Learning grants; and $50 million in performance and management efficiency grants that will be distributed through a competitive process. Funding that has not yet been distributed to specific school districts represents 37 percent of the overall year-to- year increase in Education Aid. School Aid Without Building School Aid Including Building Aid Aid 2012-13 2013-14 Percent Percent County District School Year School Year Annual Change Change Annual Change Change Suffolk Deer Park $23,185,239 $24,834,452 $1,649,213 7.1% $376,405 1.7% Suffolk Wyandanch $33,791,848 $35,318,196 $1,526,348 4.5% $1,673,793 5.1% Suffolk Three Village $34,490,700 $35,323,225 $832,525 2.4% $728,652 2.9% Suffolk Comsewogue $24,445,715 $25,262,601 $816,886 3.3% $639,922 2.8% Suffolk Sachem $107,385,914 $105,380,122 ($2,005,792) -1.9% $9,938 0.0% Suffolk Port Jefferson $3,086,494 $3,042,147 ($44,347) -1.4% ($44,345) -1.6% Suffolk Mount Sinai $14,516,575 $14,884,300 $367,725 2.5% $70,451 0.5% Suffolk Miller Place $17,836,905 $18,066,818 $229,913 1.3% $229,915 1.5% Suffolk Rocky Point $22,844,391 $24,515,045 $1,670,654 7.3% $1,666,088 8.2% Suffolk Middle Country $73,354,042 $76,020,488 $2,666,446 3.6% $2,579,407 3.8% Suffolk Longwood $76,285,520 $77,054,806 $769,286 1.0% $468,441 0.7% Suffolk Patchogue-Medf $56,995,459 $58,190,504 $1,195,045 2.1% $1,295,275 2.7% Suffolk William Floyd $106,972,516 $107,210,733 $238,217 0.2% $1,646,213 1.8% Suffolk Center Moriche $10,030,913 $10,159,690 $128,777 1.3% $105,419 1.3% Suffolk East Moriches $5,388,649 $5,615,113 $226,464 4.2% $235,177 5.1% Suffolk South Country $48,360,591 $48,919,175 $558,584 1.2% $535,729 1.4% Suffolk East Hampton $2,513,800 $2,436,031 ($77,769) -3.1% ($73,097) -3.4% Suffolk Amagansett $306,103 $274,699 ($31,404) -10.3% ($31,402) -11.4% Suffolk Springs $1,056,265 $1,246,087 $189,822 18.0% $188,963 18.2% Suffolk Sag Harbor $1,440,778 $1,308,882 ($131,896) -9.2% ($133,994) -10.3% Suffolk Montauk $720,165 $655,174 ($64,991) -9.0% ($64,991) -9.0% Suffolk Elwood $11,428,554 $11,656,216 $227,662 2.0% $152,751 1.6% Suffolk Cold Spring Ha $2,877,442 $2,953,081 $75,639 2.6% $51,470 2.3% Suffolk Huntington $11,874,803 $12,222,979 $348,176 2.9% $629,614 5.7% Suffolk Northport $11,693,541 $11,191,615 ($501,926) -4.3% ($253,346) -2.4% Suffolk Half Hollow Hi $25,909,242 $25,872,038 ($37,204) -0.1% ($153,179) -0.7% Suffolk Harborfields $13,285,754 $13,284,531 ($1,223) 0.0% ($211,484) -2.0% Suffolk Commack $34,860,611 $33,626,940 ($1,233,671) -3.5% ($985,998) -3.4% Suffolk S. Huntington $26,378,913 $26,458,894 $79,981 0.3% $22,863 0.1% Suffolk Bay Shore $35,805,995 $38,145,233 $2,339,238 6.5% $2,066,584 6.5%
- 19. 2013-14 Executive Budget -- Formula-Based School Aid The amounts below do not include other Education aid that will also be distributed to school districts for the 2013-14 school year: $203 million in Fiscal Stabilization Funding; $75 million in State of the State Initiatives including Full-Day Pre-kindergarten and Extended Learning grants; and $50 million in performance and management efficiency grants that will be distributed through a competitive process. Funding that has not yet been distributed to specific school districts represents 37 percent of the overall year-to- year increase in Education Aid. School Aid Without Building School Aid Including Building Aid Aid 2012-13 2013-14 Percent Percent County District School Year School Year Annual Change Change Annual Change Change Suffolk Islip $17,566,864 $18,474,146 $907,282 5.2% $880,040 5.8% Suffolk East Islip $32,612,968 $33,291,331 $678,363 2.1% $678,365 2.4% Suffolk Sayville $22,699,292 $22,885,572 $186,280 0.8% $145,987 0.8% Suffolk Bayport Blue P $15,226,663 $15,417,987 $191,324 1.3% $201,225 1.7% Suffolk Hauppauge $11,297,748 $11,222,114 ($75,634) -0.7% $213,020 2.4% Suffolk Connetquot $44,006,890 $45,167,385 $1,160,495 2.6% $665,483 1.9% Suffolk West Islip $29,799,102 $30,544,198 $745,096 2.5% $693,089 2.9% Suffolk Brentwood $204,776,290 $216,802,554 $12,026,264 5.9% $8,891,849 4.6% Suffolk Central Islip $81,277,723 $89,914,350 $8,636,627 10.6% $8,775,171 11.6% Suffolk Fire Island $284,343 $252,777 ($31,566) -11.1% ($31,566) -11.6% Suffolk Shoreham-Wadin $8,279,070 $8,735,106 $456,036 5.5% $332,722 4.2% Suffolk Riverhead $17,629,075 $18,751,826 $1,122,751 6.4% $788,154 4.7% Suffolk Shelter Island $489,646 $405,473 ($84,173) -17.2% ($83,397) -18.7% Suffolk Smithtown $38,322,630 $37,692,116 ($630,514) -1.6% ($727,576) -2.4% Suffolk Kings Park $13,386,565 $13,744,482 $357,917 2.7% $311,193 2.6% Suffolk Remsenburg $466,280 $369,018 ($97,262) -20.9% ($97,262) -20.9% Suffolk Westhampton Be $1,642,326 $1,526,637 ($115,689) -7.0% ($117,512) -7.2% Suffolk Quogue $246,887 $218,911 ($27,976) -11.3% ($27,975) -11.7% Suffolk Hampton Bays $4,109,116 $4,169,253 $60,137 1.5% $60,138 1.5% Suffolk Southampton $2,301,522 $2,259,125 ($42,397) -1.8% ($47,123) -2.4% Suffolk Bridgehampton $564,101 $517,572 ($46,529) -8.2% ($50,813) -9.3% Suffolk Eastport-South $28,998,984 $32,310,068 $3,311,084 11.4% $1,801,558 9.9% Suffolk Tuckahoe Commo $823,124 $740,845 ($82,279) -10.0% ($65,047) -8.4% Suffolk East Quogue $896,064 $897,543 $1,479 0.2% ($38,521) -4.3% Suffolk Oysterponds $306,753 $245,085 ($61,668) -20.1% ($61,668) -20.2% Suffolk Fishers Island $213,734 $157,366 ($56,368) -26.4% ($56,368) -26.9% Suffolk Southold $1,588,378 $1,397,952 ($190,426) -12.0% ($192,264) -12.2% Suffolk Greenport $1,133,155 $1,123,353 ($9,802) -0.9% ($15,227) -1.4% Suffolk Mattituck-Cutc $2,464,552 $2,216,902 ($247,650) -10.0% ($262,337) -12.2% Sullivan Fallsburgh $14,876,784 $15,613,829 $737,045 5.0% $494,538 3.5%