More Related Content
Similar to 10 year gains — median household income
Similar to 10 year gains — median household income (20)
More from Honolulu Civil Beat
More from Honolulu Civil Beat (20)
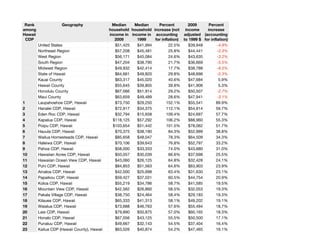
10 year gains — median household income
- 1. Rank Geography Median Median Percent 2009 Percent
among household household increase (not income increase
Hawaii income in income in accounting adjusted (accounting
CDP 2009 1999 for inflation) to 1999 $ for inflation)
United States $51,425 $41,994 22.5% $39,948 -4.9%
Northeast Region $57,208 $45,481 25.8% $44,441 -2.3%
West Region $56,171 $45,084 24.6% $43,635 -3.2%
South Region $47,204 $38,790 21.7% $36,669 -5.5%
Midwest Region $49,932 $42,414 17.7% $38,788 -8.5%
State of Hawaii $64,661 $49,820 29.8% $48,696 -2.3%
Kauai County $63,317 $45,020 40.6% $47,684 5.9%
Hawaii County $55,645 $39,805 39.8% $41,906 5.3%
Honolulu County $67,066 $51,914 29.2% $50,507 -2.7%
Maui County $63,659 $49,489 28.6% $47,941 -3.1%
1 Laupahoehoe CDP, Hawaii $73,750 $29,250 152.1% $55,541 89.9%
2 Hanalei CDP, Hawaii $72,917 $34,375 112.1% $54,914 59.7%
3 Eden Roc CDP, Hawaii $32,794 $15,658 109.4% $24,697 57.7%
4 Kapalua CDP, Hawaii $118,125 $57,292 106.2% $88,960 55.3%
5 Poipu CDP, Hawaii $103,654 $51,442 101.5% $78,062 51.7%
6 Hauula CDP, Hawaii $70,375 $38,190 84.3% $52,999 38.8%
7 Wailua Homesteads CDP, Hawaii $85,658 $48,047 78.3% $64,509 34.3%
8 Haleiwa CDP, Hawaii $70,106 $39,643 76.8% $52,797 33.2%
9 Pahoa CDP, Hawaii $58,000 $33,333 74.0% $43,680 31.0%
10 Hawaiian Acres CDP, Hawaii $50,057 $30,039 66.6% $37,698 25.5%
11 Hawaiian Ocean View CDP, Hawaii $43,060 $26,125 64.8% $32,428 24.1%
12 Puhi CDP, Hawaii $84,853 $51,563 64.6% $63,903 23.9%
13 Ainaloa CDP, Hawaii $42,000 $25,698 63.4% $31,630 23.1%
14 Papaikou CDP, Hawaii $59,427 $37,031 60.5% $44,754 20.9%
15 Koloa CDP, Hawaii $55,219 $34,786 58.7% $41,585 19.5%
16 Mountain View CDP, Hawaii $42,562 $26,860 58.5% $32,053 19.3%
17 Pakala Village CDP, Hawaii $38,750 $24,464 58.4% $29,183 19.3%
18 Kilauea CDP, Hawaii $65,333 $41,313 58.1% $49,202 19.1%
19 Waialua CDP, Hawaii $73,688 $46,763 57.6% $55,494 18.7%
20 Laie CDP, Hawaii $79,890 $50,875 57.0% $60,165 18.3%
21 Honalo CDP, Hawaii $67,056 $43,125 55.5% $50,500 17.1%
22 Punaluu CDP, Hawaii $49,667 $32,143 54.5% $37,404 16.4%
23 Kailua CDP (Hawaii County), Hawaii $63,026 $40,874 54.2% $47,465 16.1%
- 2. Rank Geography Median Median Percent 2009 Percent
among household household increase (not income increase
Hawaii income in income in accounting adjusted (accounting
CDP 2009 1999 for inflation) to 1999 $ for inflation)
24 Ahuimanu CDP, Hawaii $110,070 $71,732 53.4% $82,893 15.6%
25 Naalehu CDP, Hawaii $48,700 $31,750 53.4% $36,676 15.5%
26 Kealakekua CDP, Hawaii $57,875 $38,026 52.2% $43,585 14.6%
27 Makawao CDP, Hawaii $70,740 $46,681 51.5% $53,274 14.1%
28 Kalihiwai CDP, Hawaii $63,611 $42,083 51.2% $47,905 13.8%
29 Kawela Bay CDP, Hawaii $74,250 $49,167 51.0% $55,917 13.7%
30 Whitmore Village CDP, Hawaii $78,867 $52,308 50.8% $59,395 13.5%
31 Kapaa CDP, Hawaii $59,399 $39,448 50.6% $44,733 13.4%
32 Kahuku CDP, Hawaii $58,875 $39,135 50.4% $44,339 13.3%
33 Waimea CDP (Hawaii County), Hawaii $76,722 $51,150 50.0% $57,779 13.0%
34 Wheeler AFB CDP, Hawaii $48,659 $32,485 49.8% $36,645 12.8%
35 Fern Acres CDP, Hawaii $46,625 $31,250 49.2% $35,113 12.4%
36 Kukuihaele CDP, Hawaii $57,813 $38,750 49.2% $43,539 12.4%
37 Eleele CDP, Hawaii $69,345 $46,705 48.5% $52,224 11.8%
38 Barbers Point Housing CDP, Hawaii $97,083 $65,625 47.9% $73,113 11.4%
39 Honomu CDP, Hawaii $44,063 $30,179 46.0% $33,184 10.0%
40 Kaunakakai CDP, Hawaii $50,360 $34,492 46.0% $37,926 10.0%
41 Waikoloa Village CDP, Hawaii $72,750 $50,040 45.4% $54,788 9.5%
42 Kaaawa CDP, Hawaii $79,167 $54,500 45.3% $59,620 9.4%
43 Iroquois Point CDP, Hawaii $64,181 $44,200 45.2% $48,335 9.4%
44 Wainaku CDP, Hawaii $61,250 $42,292 44.8% $46,127 9.1%
45 Honaunau-Napoopoo CDP, Hawaii $60,590 $41,912 44.6% $45,630 8.9%
46 Hanapepe CDP, Hawaii $63,158 $44,112 43.2% $47,564 7.8%
47 Kaneohe Station CDP, Hawaii $49,673 $34,757 42.9% $37,409 7.6%
48 Lihue CDP, Hawaii $63,967 $44,906 42.4% $48,173 7.3%
49 Puako CDP, Hawaii $85,682 $60,250 42.2% $64,527 7.1%
50 Waimea CDP (Kauai County), Hawaii $63,125 $44,398 42.2% $47,539 7.1%
51 Waikane CDP, Hawaii $78,333 $55,179 42.0% $58,992 6.9%
52 Orchidlands Estates CDP, Hawaii $38,073 $27,083 40.6% $28,673 5.9%
53 Makaha Valley CDP, Hawaii $38,583 $27,446 40.6% $29,057 5.9%
54 Wailuku CDP, Hawaii $63,740 $45,587 39.8% $48,002 5.3%
55 Kaanapali CDP, Hawaii $110,714 $79,288 39.6% $83,378 5.2%
56 Hickam Housing CDP, Hawaii $58,865 $42,298 39.2% $44,331 4.8%
- 3. Rank Geography Median Median Percent 2009 Percent
among household household increase (not income increase
Hawaii income in income in accounting adjusted (accounting
CDP 2009 1999 for inflation) to 1999 $ for inflation)
57 Pahala CDP, Hawaii $41,956 $30,243 38.7% $31,597 4.5%
58 Waipio Acres CDP, Hawaii $68,700 $49,594 38.5% $51,738 4.3%
59 Honokaa CDP, Hawaii $58,036 $41,964 38.3% $43,707 4.2%
60 Kekaha CDP, Hawaii $56,729 $41,103 38.0% $42,722 3.9%
61 Hilo CDP, Hawaii $54,015 $39,139 38.0% $40,679 3.9%
62 Heeia CDP, Hawaii $120,444 $87,528 37.6% $90,706 3.6%
63 Wailea-Makena CDP, Hawaii $77,933 $56,806 37.2% $58,691 3.3%
64 Waikapu CDP, Hawaii $86,071 $62,813 37.0% $64,820 3.2%
65 Maunawili CDP, Hawaii $112,542 $82,148 37.0% $84,755 3.2%
66 Kihei CDP, Hawaii $63,223 $46,215 36.8% $47,613 3.0%
67 Captain Cook CDP, Hawaii $65,000 $47,644 36.4% $48,951 2.7%
68 Omao CDP, Hawaii $72,250 $53,750 34.4% $54,411 1.2%
69 Waimalu CDP, Hawaii $82,239 $61,210 34.4% $61,934 1.2%
70 Hawi CDP, Hawaii $61,607 $46,406 32.8% $46,396 -0.0%
71 Haliimaile CDP, Hawaii $65,250 $49,167 32.7% $49,140 -0.1%
72 Waipahu CDP, Hawaii $65,569 $49,444 32.6% $49,380 -0.1%
73 Makakilo City CDP, Hawaii $87,529 $66,515 31.6% $65,918 -0.9%
74 Volcano CDP, Hawaii $47,115 $35,977 31.0% $35,482 -1.4%
75 Halaula CDP, Hawaii $61,875 $47,250 31.0% $46,598 -1.4%
76 Kalaoa CDP, Hawaii $69,105 $53,024 30.3% $52,043 -1.9%
77 Fern Forest CDP, Hawaii $31,894 $24,519 30.1% $24,019 -2.0%
78 Waimanalo Beach CDP, Hawaii $72,500 $55,781 30.0% $54,600 -2.1%
79 Maili CDP, Hawaii $59,091 $45,786 29.1% $44,501 -2.8%
80 Waianae CDP, Hawaii $60,250 $46,717 29.0% $45,374 -2.9%
81 Keaau CDP, Hawaii $51,136 $39,722 28.7% $38,510 -3.1%
82 Ewa Villages CDP, Hawaii $66,193 $51,451 28.7% $49,850 -3.1%
83 Paia CDP, Hawaii $66,417 $51,696 28.5% $50,018 -3.2%
84 Honolulu CDP, Hawaii $57,936 $45,112 28.4% $43,631 -3.3%
85 Hawaiian Beaches CDP, Hawaii $36,440 $28,467 28.0% $27,443 -3.6%
86 Kahaluu-Keauhou CDP, Hawaii $66,633 $52,522 26.9% $50,181 -4.5%
87 Napili-Honokowai CDP, Hawaii $64,666 $51,030 26.7% $48,700 -4.6%
88 Kaumakani CDP, Hawaii $43,816 $34,583 26.7% $32,998 -4.6%
89 Kahaluu CDP, Hawaii $77,188 $61,098 26.3% $58,130 -4.9%
- 4. Rank Geography Median Median Percent 2009 Percent
among household household increase (not income increase
Hawaii income in income in accounting adjusted (accounting
CDP 2009 1999 for inflation) to 1999 $ for inflation)
90 Hanamaulu CDP, Hawaii $60,605 $48,239 25.6% $45,641 -5.4%
91 Haiku-Pauwela CDP, Hawaii $56,971 $45,397 25.5% $42,905 -5.5%
92 Maunaloa CDP, Hawaii $27,888 $22,232 25.4% $21,002 -5.5%
93 Wahiawa CDP, Hawaii $51,631 $41,257 25.1% $38,883 -5.8%
94 Paauilo CDP, Hawaii $43,125 $34,659 24.4% $32,477 -6.3%
95 Schofield Barracks CDP, Hawaii $42,009 $33,788 24.3% $31,637 -6.4%
96 Waipio CDP, Hawaii $76,032 $61,276 24.1% $57,259 -6.6%
97 Paukaa CDP, Hawaii $50,455 $40,804 23.7% $37,998 -6.9%
98 Lawai CDP, Hawaii $68,750 $55,662 23.5% $51,775 -7.0%
99 Lanai City CDP, Hawaii $53,445 $43,271 23.5% $40,249 -7.0%
100 Mokuleia CDP, Hawaii $61,833 $50,100 23.4% $46,566 -7.1%
101 Mililani Town CDP, Hawaii $90,109 $73,067 23.3% $67,861 -7.1%
102 Kaneohe CDP, Hawaii $80,935 $66,006 22.6% $60,952 -7.7%
103 Kualapuu CDP, Hawaii $45,714 $37,422 22.2% $34,427 -8.0%
104 Anahola CDP, Hawaii $50,952 $41,771 22.0% $38,372 -8.1%
105 Kailua CDP (Honolulu County), Hawaii $88,699 $72,784 21.9% $66,799 -8.2%
106 Wailua CDP, Hawaii $55,417 $45,875 20.8% $41,734 -9.0%
107 Maalaea CDP, Hawaii $64,875 $53,750 20.7% $48,857 -9.1%
108 Holualoa CDP, Hawaii $60,773 $50,492 20.4% $45,768 -9.4%
109 Village Park CDP, Hawaii $84,515 $70,302 20.2% $63,648 -9.5%
110 Kahului CDP, Hawaii $55,465 $46,656 18.9% $41,771 -10.5%
111 Kurtistown CDP, Hawaii $54,250 $46,012 17.9% $40,856 -11.2%
112 Ewa Beach CDP, Hawaii $67,043 $57,073 17.5% $50,490 -11.5%
113 Leilani Estates CDP, Hawaii $36,563 $31,541 15.9% $27,535 -12.7%
114 Pearl City CDP, Hawaii $71,470 $62,036 15.2% $53,824 -13.2%
115 Ewa Gentry CDP, Hawaii $70,757 $61,462 15.1% $53,287 -13.3%
116 Waihee-Waiehu CDP, Hawaii $71,174 $63,236 12.6% $53,601 -15.2%
117 Halawa CDP, Hawaii $70,875 $63,176 12.2% $53,376 -15.5%
118 Pupukea CDP, Hawaii $62,844 $56,146 11.9% $47,328 -15.7%
119 Aiea CDP, Hawaii $78,750 $71,155 10.7% $59,306 -16.7%
120 Pukalani CDP, Hawaii $68,975 $62,778 9.9% $51,945 -17.3%
121 Makaha CDP, Hawaii $39,068 $35,674 9.5% $29,422 -17.5%
122 Lahaina CDP, Hawaii $57,717 $52,984 8.9% $43,467 -18.0%
- 5. Rank Geography Median Median Percent 2009 Percent
among household household increase (not income increase
Hawaii income in income in accounting adjusted (accounting
CDP 2009 1999 for inflation) to 1999 $ for inflation)
123 Nanakuli CDP, Hawaii $48,444 $45,352 6.8% $36,483 -19.6%
124 Hawaiian Paradise Park CDP, Hawaii $38,341 $36,300 5.6% $28,874 -20.5%
125 Hana CDP, Hawaii $53,456 $50,833 5.2% $40,258 -20.8%
126 Waimanalo CDP, Hawaii $50,000 $47,594 5.1% $37,655 -20.9%
127 Kapaau CDP, Hawaii $45,682 $45,764 -0.2% $34,403 -24.8%
128 Kalaheo CDP, Hawaii $56,213 $57,813 -2.8% $42,334 -26.8%
129 Pepeekeo CDP, Hawaii $26,031 $27,946 -6.9% $19,604 -29.9%
130 Nanawale Estates CDP, Hawaii $32,303 $35,703 -9.5% $24,327 -31.9%
131 Princeville CDP, Hawaii $52,700 $63,833 -17.4% $39,688 -37.8%