
More Related Content
Similar to 13112019 Globalisation 1.0 and 2.0 helped the G7. Globalisat
Similar to 13112019 Globalisation 1.0 and 2.0 helped the G7. Globalisat (16)
More from ChantellPantoja184
More from ChantellPantoja184 (20)
Recently uploaded
Recently uploaded (20)
13112019 Globalisation 1.0 and 2.0 helped the G7. Globalisat
- 1. 13/11/2019 Globalisation 1.0 and 2.0 helped the G7. Globalisation 3.0 helped India and China instead. What will Globalisation 4.0 do? | VOX, … https://voxeu.org/content/globalisation-10-and-20-helped-g7- globalisation-30-helped-india-and-china-instead-what-will- globalisation-40-do 1/7 Columns Video Vox VoxTalks Publications Blogs&Reviews People Debates Events About VOX CEPR Policy Portal Research-based policy analysis and commentary from leading economists Search Create account | Login | Subscribe 126 A A Related Trade globalisation in the last two centuries Michel Fouquin, Jules Hugot Early globalisation and the law of one price Mario Crucini, Gregor Smith Challenges in the coming phase of globalisation: A sense of déjà vu Otaviano Canuto, José Manuel Salazar Globalisation 1.0 and 2.0 helped the G7. Globalisation 3.0 helped India and China instead.
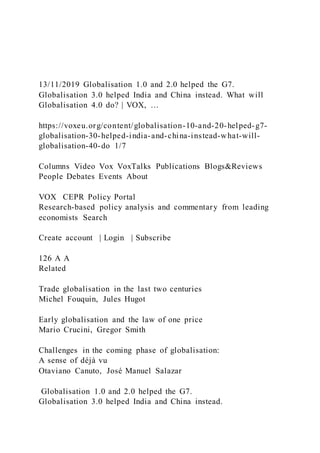
- 2. What will Globalisation 4.0 do? Richard Baldwin 21 January 2019 Richard Baldwin describes how digital technology is allowing people and companies to arbitrage large relative price differences in wages across countries, offering an enormous export opportunity for developing nations. Globalisation leapt forward in the late 19th century when steam power slashed the costs of moving goods internationally. This ‘old globalisation’ came in two waves. Globalisation 1.0 started in 1820 and ended at the start of WWI, and Globalisation 2.0 began after WWII and ended around 1990.1 In between, globalisation retreated. Old globalisation was especially beneficial to today’s rich nations. The G7 (France, Germany, Italy, Britain, US, Japan, and Canada) saw rapid growth of their exports, incomes, and industry compared to today's poor nations. This led to what Kenneth Pomeranz, a historian, calls the Great Divergence. The G7’s share of world GDP soared from one-fifth in 1820 to two-thirds in 1988. Its share of world trade rose to more than 50% (Figure 1). Enormous differences in income between rich and poor nations first emerged at this time. Figure 1 Spot the difference: Globalisations 1.0 and 2.0 (blue) and 3.0 (red) Banking, FinTech, Big Tech: Emerging challenges for financial policymakers
- 3. Challenges in the digital age The parliamentary Brexit endgame Live Long and Prosper? The Economics of Ageing Populations How to improve consumer credit ratings Richard Baldwin Professor of International Economics at The Graduate Institute, Geneva; Founder & Editor-in-Chief of VoxEU.org; exPresident of CEPR Blogs&Reviews Creating zombies and disinflation: A cul de sac for accommodative monetary policy Acharya The October truce on US- China trade failed to address subsidies Bown, Hillman
- 4. Sense and nonsense in the public discussion of the future of work Baldwin Why the CPTPP could be the answer to the US-China trade war Petri, Plummer Randomistas rule Beck more Don't Miss Petralia, Philippon, Rice, Véron Labhard, McAdam, Petroulakis, Vivian Tyson Vox eBooks Bloom, 14 October 2019 More eBooks Vox Talks Listen | Open Player By Topic By Date By Reads By Tag
- 6. discussion-future-work https://voxeu.org/content/why-cptpp-could-be-answer-us-china- trade-war https://voxeu.org/content/randomistas-rule https://voxeu.org/blogs-reviews https://voxeu.org/epubs/ebooks https://voxeu.org/vox-talks/how-improve-consumer-credit- ratings https://voxeu.org/popup/64772 https://voxeu.org/columns/topics https://voxeu.org/columns/archive https://voxeu.org/columns/reads https://voxeu.org/columns/tag 13/11/2019 Globalisation 1.0 and 2.0 helped the G7. Globalisation 3.0 helped India and China instead. What will Globalisation 4.0 do? | VOX, … https://voxeu.org/content/globalisation-10-and-20-helped-g7- globalisation-30-helped-india-and-china-instead-what-will- globalisation-40-do 2/7 Note: Gross domestic product (GDP) is a measure of a country’s total economic output and income. Source: Author’s elaboration of Maddison online data. The impact of Globalisation 1.0 on the global distribution of industry was equally shocking, as Figure 2 shows. Britain was the first industrialiser. It maintained a massive lead until 1900, when it was surpassed by the US. The other G7 nations took off in the mid- to-late 1800s. Since the emergence of human civilisation, China, India-Pakistan and other ancient nations had been the leading industrial powers. But as the G7 industrialised, these ancient
- 7. nations de-industrialised. Figure 2 Per capita industrialisation levels, 1750 to 1913 Source: Author’s elaboration of data from Bairoch (1982, Table 9). Globalisation 1.0 drove northern industrialisation and southern de-industrialisation. This is not as widely known as it should be, but it has long been recognised. As Simon Kuznets wrote in 1965: “Before the 19th century and perhaps not much before it, some presently underdeveloped countries, notably China and parts of India, were believed by Europeans to be more highly developed than Europe” (Kuznets 1965:20, cited in Baldwin and Martin 1999).2 The new globalisation: Globalisation 3.0 Globalisation leaped forward again in the late 20th century when information and communication technologies (ICT) radically lowered the cost of movi ng ideas internationally. This ‘new globalisation’, or Globalisation 3.0, had dramatically different effects on world income (GDP) shares, as can be seen from Figure 1. In just 20 years, the G7 share of world GDP plummeted to 50%, and its share of trade to 32%. This trend, which might be called the 'Great Convergence', is surely the dominant economic fact of the last 20 or 30 years. What happened to the landscape of global manufacturing? Figure 3 shows that the G7 nations lost share gradually between 1970 and 1990, followed by an
- 8. accelerated decline from 1990. To where did manufacturing go? Just six developing nations – which we might call the ‘Rapidly Industrialising 6’, or I6 for short – accounted for almost all of it. The I6 are China, Korea, India, Poland, Indonesia @VoxEU RSS Feeds Weekly Digest Albanesi More Vox Talks CEPR Policy Research Discussion Papers Insights Homeownership of immigrants in France: selection effects related to international migration flows Gobillon, Solignac Climate Change and Long- Run Discount Rates: Evidence from Real Estate Giglio, Maggiori, Stroebel, Weber The Permanent Effects of Fiscal Consolidations Summers, Fatás
- 9. Demographics and the Secular Stagnation Hypothesis in Europe Favero, Galasso QE and the Bank Lending Channel in the United Kingdom Butt, Churm, McMahon, Morotz, Schanz Subscribe http://twitter.com/VoxEU https://voxeu.org/feed/recent/rss.xml https://voxeu.org/pages/how-do-i-subscribe-vox-weekly-digest- email https://voxeu.org/vox-talks https://voxeu.org/content/globalisation-10-and-20-helped-g7- globalisation-30-helped-india-and-china-instead-what-will- globalisation-40-do?qt-quicktabs_cepr_policy_research=0#qt- quicktabs_cepr_policy_research https://voxeu.org/content/globalisation-10-and-20-helped-g7- globalisation-30-helped-india-and-china-instead-what-will- globalisation-40-do?qt-quicktabs_cepr_policy_research=1#qt- quicktabs_cepr_policy_research https://voxeu.org/epubs/cepr-dps/homeownership-immigrants- france-selection-effects-related-international-migration-flows https://voxeu.org/epubs/cepr-dps/climate-change-and-long-run- discount-rates-evidence-real-estate https://voxeu.org/epubs/cepr-dps/permanent-effects-fiscal- consolidations https://voxeu.org/epubs/cepr-dps/demographics-and-secular- stagnation-hypothesis-europe https://voxeu.org/epubs/cepr-dps/qe-and-bank-lending-channel- united-kingdom
- 10. 13/11/2019 Globalisation 1.0 and 2.0 helped the G7. Globalisation 3.0 helped India and China instead. What will Globalisation 4.0 do? | VOX, … https://voxeu.org/content/globalisation-10-and-20-helped-g7- globalisation-30-helped-india-and-china-instead-what-will- globalisation-40-do 3/7 and Thailand. China stands out. It gained almost 16 percentage points of world manufacturing in just 20 years. Figure 3 Most of the G7’s share loss in manufacturing went to just seven rapidly industrialising nations Source: UNSTAT.org. To understand why globalisation today acts differently to its effect in the 20th century, we need a broader framework for thinking about globalisation and the things that drive it. This was the theme of my 2016 book, The Great Convergence: Information Technology and the New Globalisation. This framework also helps us think about the effect that Globalisation 4.0 will have. Three cascading constraints of globalisation Economic globalisation can be defined as all the things that happen when: goods,
- 11. ideas, people, services, and capital move from one nation to another. Globalisation matters because these flows affect our jobs, salaries, income distributions, and so on. (Many more things cross borders, but these are the main flows we are interested in when we analyse economic globalisation.) But this list is too long. We should simplify to clarify. As Karl Popper said: “Science may be described as the art of systematic over-simplification.” So if we want to understand how the flows affect economies and people, it is useful to narrow the list. Capital is quite different from the other flows and so we set it aside. When services cross borders, they are either ideas (say, architectural plans) or embedded in goods (say, diamonds that have been skilfully cut in India). This means we can lump services in with either ideas and goods. this leaves us with three flows: goods, ideas, and people. The next natural question is, what drives globalisation? The answer is equally simple. Globalisation is driven by arbitrage. Arbitrage drives globalisation When a good is relatively cheap in Germany compared to China, then other goods are relatively cheap in China compared to Germany. It's a logical inevitability. For example, if good 1 is relatively
- 12. cheap compared to good 2 in Germany, then good 2 must be relatively cheap compared to good 1 in China. When companies exploit price differences – buying low and selling high – we get international trade. Companies buy what is relatively cheap in Germany and sell it in China and buy what is relatively cheap in China and sell it in Germany. Trade is driven by a two- way buy-low, sell-high arbitrage. This is not a new idea – David Ricardo was writing about it in 1817. There is also arbitrage in ideas and people. As we saw, arbitrage of knowhow was particularly important in Globalisation 3.0. The arbitrage of the three flows is limited by three costs. 13/11/2019 Globalisation 1.0 and 2.0 helped the G7. Globalisation 3.0 helped India and China instead. What will Globalisation 4.0 do? | VOX, … https://voxeu.org/content/globalisation-10-and-20-helped-g7- globalisation-30-helped-india-and-china-instead-what-will- globalisation-40-do 4/7 Globalisation has been driven by reductions in the costs of moving goods, ideas and people, because when these costs fall, so does the cost of separating production and consumption geographically. But, to understand globalisation, we need to distinguish the costs of separation for each. Since the early 19th century, all three have fallen, but not at the same time. Shipping costs fell dramatically 150 years before communication costs did. Face-
- 13. to-face interactions remain costly, even today. This shaped how globalisation evolved. To understand this, we can be guided in a gallop through the history of trade by a thought framework that I call the 'three cascading constraints' (3CC) view of globalisation. The 3CC history of globalisation When transportation involved wind power by sea, and animal power by land, almost nothing could be shipped at a profit over a long distance. The high cost of moving goods, people and ideas created three constraints that bound together the production and consumption of goods. Therefore, apart from elite goods and essential raw materials, most things that people consumed were made within walking distance of their homes. We know from books and paintings that royalty and the rich could enjoy goods made far away, but most people lived in villages. For the rest, consumption meant locally made food, shelter, and clothing. This isolation meant that the world economy was little more than a patchwork of village-level economies. The extreme separation of production hindered innovation, because small-scale production meant innovation was worth little to the innovator, and their dispersion meant that it was difficult for innovation to spread quickly. Modern growth, in other words, was stymied until Globalisation 1.0 took off. The cost of moving goods was the first of the three to fall dramatically. From the early 19th century,
- 14. steam power and transport technologies improved in a process that helped create, and was helped by, the Industrial Revolution. With cheaper international shipping, more people bought goods from far away. Kevin O’Rourke and Jeff Williamson, two economists of the history of trade, date this to 1820. But while shipping got cheaper, the cost of moving ideas and people fell much less. This unbalanced reduction in arbitrage costs triggered a sequence of changes that had a huge effect on the global economy: As markets expanded globally, industry clustered locally. These clusters were in today’s developed nations. Today’s developing nations de- industrialised. Northern industrialisation triggered northern innovation, which stimulated northern growth. But ideas were costly to move, and so northern innovations stayed in the north. The result was a vast imbalance in knowledge-per-worker ratios between the global north and the global south. The localisation of innovation also meant that growth took-off later in today’s poor nations, and was slower afterwards. The growth differences between north and south generated the colossal, north-south income asymmetry that we still see today. Globalisation accelerated again around 1990, when the ICT revolution radically lowered the cost of moving ideas. Globalisation’s second unbundling – the geographic separation of each manufacturing stage, organised in 'global value chains' (GVCs) – became feasible when the ICT
- 15. revolution made it possible to organise complex activities at distance. The north-south wage gap inherited from the first unbundling made this offshoring profitable. Nature abhors a vacuum, economies abhor imbalances. It became cheaper to move ideas, and so this inevitably triggered massive north-to-south flows of knowhow, which reconfigured the world economy as shown by the red lines in Figure 1. This new -style globalisation – where high-tech moved to places where there was low-wage labour – turned the first unbundling on its head. It de- industrialised the north and industrialised the south. Growth slowed in the north and accelerated in the south. In short, it produced the Great Convergence. The knowledge that is moving north to south mostly belongs to firms based in the G7. Firms in the G7 have invested in GVCs to ensure that they profit from the new ICT-enabled possibilities. The 21st-century contours of knowledge are increasingly defined by the geography of the GVCs, rather than the geography of nations. The 3CC view of globalisation argues that this outcome depends on the cost of moving people, not goods or ideas. Aeroplane fares have fallen, but the time-cost of travel has continued to rise because we need to factor in the salaries of managers and technicians. Since it is still expensive to move people around – and international production networks still need people to move among
- 16. 13/11/2019 Globalisation 1.0 and 2.0 helped the G7. Globalisation 3.0 helped India and China instead. What will Globalisation 4.0 do? | VOX, … https://voxeu.org/content/globalisation-10-and-20-helped-g7- globalisation-30-helped-india-and-china-instead-what-will- globalisation-40-do 5/7 facilities – most advanced manufacturing still occurs in nations that are close to the G7 industrial powerhouses, especially Germany, Japan and the US. India is an exception, but this is because India has engaged in international production networks for which face-to-face contact is less important. The industrialisation impact of the second unbundling was hyper-concentrated, but the Great Convergence is much broader because of the knock-on effects of the rapid industrialisation of the I6. About half of the world's population lives in the I6, so rapid income growth has triggered a boom in demand for raw materials. This, in turn, triggered the ‘commodity super-cycle’ that led to growth take-offs in commodity-exporting nations. In other words, the second unbundling (Globalisation 3.0) drove growth in many developing nations that were untouched directly by GVCs. I have summarised the 3CC narrative in Figure 4. It's clear that a third unbundling becomes possible if face-to-face costs plummet. And that, in my view, is what Globalisation 4.0 is all about.
- 17. Figure 4 The 3CC view of globalisation Future globalisation will be in things that we do Globalisation is, I believe, in for a radical new transformation. This will happen if the cost of face-to- face interaction falls as much as the cost of moving ideas has in the recent past. This will allow a third unbundling. This will be the unbundling of service workers and service work, or to put it differently, it makes it possible to separate labour services geographically from the labourers. Arbitrage of goods and ideas will continue, but there will be a new, disruptive aspect called 'tele- migration'. People will sit in one nation, while working in offices in another nation. There is a simple driving force for this arbitrage. Salaries and wages for this type of work are much higher in rich nations. Hundreds of millions, maybe billions, of people in poor nations would like to earn those wages. Today that is not technically possible, because there is a high face-to-face cost, and we still need in-person interactions in many service and professional jobs. If digital technology relaxes this third constraint on the global arbitrage of wage-rate differences, as I think this will, it would be a big change. If digital technology allows people in poor nations to offer their labour services in advanced economies without actually having to be there, a lot of people in advanced economies could lose their jobs. The necessary technology is already on the way. This is the topic of my new book, The
- 18. Globotics Upheaval: Globalisation, Robotics and the Future of Work. A third unbundling The service sector in G7 nations has been shielded from globalisation because most services require face-to-face contact. Times are changing. The third unbundling is unfolding before our eyes. It is all about processing and transmitting information. Laws of physics governing goods do not govern data. The explosive growth of digital technology creates the possibility of remote intelligence (RI). Digital technology is tearing down the barriers to arbitrage in labour services. Firms already hire remote knowledge workers abroad at lower wages. As more companies in rich nations source labour this way, the matchmaking network will grow. Many companies in the US and Europe seem unaware of the possibilities, or maybe they are hesitant to explore what the consequences may be. But once a firm’s competitors start using low-cost foreign labour, competition will accelerate the process. 13/11/2019 Globalisation 1.0 and 2.0 helped the G7. Globalisation 3.0 helped India and China instead. What will Globalisation 4.0 do? | VOX, … https://voxeu.org/content/globalisation-10-and-20-helped-g7- globalisation-30-helped-india-and-china-instead-what-will- globalisation-40-do 6/7
- 19. Talented foreign workers will increasingly use digital platforms like Upwork.com, looking for work, and companies that use them will join the platforms, looking for remote workers. My guess is that tipping-point economics will define the progress of global outsourcing of services. Once people begin to trust these platforms – as they have rapidly come to trust internet services like Airbnb and Uber – it will snowball into something very big, very fast. Impact on developing nations The comparative advantage of most developing nations comes from labour that is, quality-adjusted, still cheap. Mostly, the only way they exploit it is to use their labour to make a thing, and then ship that thing across borders. Since manufacturing is subject to large agglomeration economies, and requires that manufacturers get many things right, only a handful of developing nations can really transform their economies based on manufactured exports alone. Most that have succeeded have done so by joining the supply chains that were clustered in G7 nations. Tele-migration will allow people with skills in developing nations to export their services directly. This may allow the emerging market miracle to continue, but also to spread to many nations that until now have only been able to export commodities. An accelerating process The first two globalisations helped the G7 nations and hindered the developing nations – at least in
- 20. a relative sense. Until 1990, most rich nations grew faster than most poor nations. This is because it was easy to ship goods, but difficult to ship knowhow. Offshoring manufacturing fostered innovation and rising competitiveness in the G7 nations, but the opposite in developing nations. Coordinating complex activities was too expensive, and so the knowledge stayed in the G7, despite the very large imbalances. The ICT revolution opened a way for G7 firms to arbitrage the big differences in knowhow -to- labour ratios that were responsible for wage differences. Now digital technology is allowing people and companies to arbitrage large relative price differences in wages. This will be an enormous export opportunity for developing nations – especially ones, like India and China, that have fast internet in urban areas and millions of workers with recognisable skills that companies and people in rich countries would like to buy. Tele-migration will also be an export opportunity for many in the rich nations since competition in services is not always won by the cheapest. Quality and reliability still matter. Will the Great Convergence continue? Will the G7’s share of world GDP continue to decline, and India’s and China’s continue to rise? The answer to both questions is yes. The nature of future globalisation will great accelerate the process. References Baldwin, R (2016), The Great Convergence: Information Technology and the New Globalization,
- 21. Belknap Press of Harvard University Press. Baldwin, R (2019), The Globotics Upheaval: Globalisation, Robotics and the Future of Work, Oxford University Press. Baldwin, R, P Martin and G Ottaviano (2001), "Global Income Divergence, Trade, and Industrialization: The Geography of Growth Take-Offs", Journal of Economic Growth 6(1): 5-37. Braudel, F (1984), Civilisation and Capitalism, 15th-18th Century: The Perspective of the World. vol 3, Harper and Row. Chaudhuri, K N (1966), "India’s Foreign Trade and the Cessation of the East India Company’s Trading Activities, 1828-40", Economic History Review 19(2): 345-63. Kuznets, S (1965), Economic Growth and Structure, Selected Essays, Heinemann. Endnotes [1] We could probably describe pre-modern globalisation – the opening of the Silk Road in 200 BCE, the golden age of Islam (8th to 14th centuries), or the European age of discovery (15th to 17th centuries) – as beta globalisation, or maybe Globalisation 0.0. It was very different, because it had a negligible impact on the living standards of the masses. [2] Braudel (1984) and Chaudhuri (1966) show that, during the 18th century, the Indian cotton textile industry was the global leader in terms of quality, production
- 22. and exports. 18th-century India and 13/11/2019 Globalisation 1.0 and 2.0 helped the G7. Globalisation 3.0 helped India and China instead. What will Globalisation 4.0 do? | VOX, … https://voxeu.org/content/globalisation-10-and-20-helped-g7- globalisation-30-helped-india-and-china-instead-what-will- globalisation-40-do 7/7 126 A A China also produced the world’s highest-quality silk and porcelain. Before the 18th century, these manufactured goods were exported to Europe in exchange for silver, as European manufactures were uncompetitive in the East (Barraclough 1978). Clearly, the civilisations that invented gunpowder, paper and aids for oceanic navigation were by no means primitive societies, waiting for Europe to industrialise. Related Trade globalisation in the last two centuries Michel Fouquin, Jules Hugot Early globalisation and the law of one price Mario Crucini, Gregor Smith Challenges in the coming phase of globalisation: A sense of déjà vu Otaviano Canuto, José Manuel Salazar Printer-friendly version
- 23. https://voxeu.org/article/trade-globalisation-last-two-centuries https://voxeu.org/article/early-globalisation-and-law-one-price https://voxeu.org/article/challenges-coming-phase- globalisation-sense-d-j-vu https://voxeu.org/print/63781 Chapter 25: Theory Testing and Theory Evaluation* Jacqueline Fawcett INTRODUCTION The focus of this chapter is the science and art of theory development and evaluation. The chapter begins with a definition of theory and a description of the process of theory development and continues with a discussion of the critical thinking that is required for the evaluation of theories. The emphasis in this chapter is theory development and evaluation activities that are required for advanced practice nursing. The content of this chapter is especially relevant to two of the American Association of Colleges of Nursing’s Essentials of DoctoralColleges of Nursing’s Essentials of Doctoral Education for Advanced Nursing Practice: Essential I, Scientific Underpinnings for Practice , and Essential III, Clinical Scholarship and Analytical Methods for Evidence-Based Practice. THE SCIENCE AND ART OF THEORY DEVELOPMENT
- 24. The term theory is used to refer to diverse works, ranging from very abstract and general conceptual models to less abstract and general grand theories, to relatively concrete and specific middle-range theories, to very concrete and specific narrow-range situation-specific theories. Despite the lack of consensus about the meaning of theory, King and Fawcett (1997) found considerable agreement about the existence of levels of abstraction for theoretical work. In this chapter, the term refers to middle-range theories and situation-specific theories. The term conceptual model refers to the very abstract and general work from which theories are derived. Theories A theory is made up of concepts and propositions about a phenomenon. A concept is a word or phrase that captures the essence of something, such as adjustment or distress. It may have one or more dimensions. An example of a single- dimensional concept is resiliency. An example of aa multidimensional concept is perceived stigma, the six dimensions of which are fear of contagion, healthcare neglect, negative self- perception, social isolation, verbal abuse, and workplace stigma (Mwangi, 2013). A proposition is a statement about one or more concepts. A proposition about one concept is a definition or a description of the concept; resiliency, for example, is defined as “The capacity to return to a restorative level of functioning using compensatory/coping mechanisms; the ability to bounce back quickly after an insult”
- 25. (American Association of Critical Care Nurses, 2014, p. 1). A proposition about two or more concepts states an association between the concepts, including the relation between the concepts or the effect of one concept on one or more other concepts. An example of a statement of the relation between two concepts is, “Socio-demographic characteristics are related to perceived stigma” (Mwangi, 2013). An example of a statement about the effect of a concept on other concepts, which typically involves the effect of some intervention on some outcomes, is, “Information about walking exercise has a positive effect on symptoms, fatigue, emotional distress, and physical function” (Mock et al., 2007)Nursing theories usually focus on experiences of health conditions and health-related events. Examples of health conditions include such medical diagnoses as congestive heart failure cancer, and diabetes. Examples of health-related events include pregnancy, childbirth, the postpartum period, and aging. The health condition or health event of interest provides a context for a theory. For example, the concepts of exercise intervention, fatigue, and emotional distress and the propositions about those concepts could make up a theory about the effects of an exercise intervention on fatigue and emotional distress experienced by men with colon cancer. Alternatively, the concepts of fatigue and emotional distress might make up a theory about the relation
- 26. between fatigue and emotional distress during the postpartum period. Types of Theories Three types of theories are descriptive, explanatory, and predictive. Descriptive theories simply describe some phenomenon. They typically comprise one concept and one proposition that is a definition or description of the concept. An example of a descriptive theory is the theory of fatigue. In this ccase, the theory concept is fatigue. The theory proposition asserts that fatigue is a multidimensional concept defined as behavioral, sensory, and affective experiences (Piper et al., 1998). Explanatory theories specify how concepts are related to each other and, therefore, provide explanations for phenomena. They consist of two or more concepts, the propositions that are definitions or descriptions of each concept, and the propositions that specify the relation(s) between the concepts. An example is the theory of chronic pain (Tsai, Tak, Moore, & Palencia, 2003). The theory concepts are chronic pain, physical disability, social support, age, gender, perceived daily stress, and depression. The propositions that are definitions of each concept are as follows: Chronic pain is defined as the frequency and severity of pain (Tsai et al., 2003).Physical disability is defined as the frequency and extent of mobility, walking, bending, and hand and finger function (Tsai et al., 2003). Social support is defined as “perceived levels of social support .
- 27. . . [including] (a) provision of attachment/intimacy, (b) social integration, (c) opportunity for nurturant behavior, (d) reassurance of worth, and (e) availability of informational, emotional, and material help” (Tsai et al., 2003, p. 162). Age is defined as age in years (Tsai et al., 2003). Gender is defined as male or female (Tsai et al., 2003). Perceived daily stress is defined as “the degree to which older persons experience daily stress from irritating, frustrating, or repeated occurrences in their lives” (Tsai et al., 2003, p. 162). Depression is defined as the frequency of depressed mood symptoms within the past week (Tsai et al., 2003). The following theory proposition specifies the relations between the concepts: Chronic pain, physical disability, social support, age, and gender are related to perceived daily stress, which is related to depression. Predictive theories specify how a concept affects one or more other concepts. They are made up of two or more concepts, the propositions that are definitions or descriptions of each concept, and the propositions that specify the effect(s) of one concept on one or more other concepts. An example is the theory of the effects of simulated conflict management training (Pines et al., 2014). The theory concepts aresimulated conflict management training exercises, stress resiliency, psychological empowerment, and
- 28. conflict management style. The propositions that are definitions of each concept are as follows: Simulated conflict management training exercises are defined as “didactic and simulated training using a variety of scenarios for learning resiliency skills, enhancing perceptions of empowerment and increasing knowledge of personal styles of conflict management” (Pines et al., 2014, p. 87). Stressr resiliency is defined as “the ability of an individual to adjust to adversity, maintain equilibrium, retain some control over the environment, and move in a positive direction” (Pines et al., 2014, p. 86). Psychological empowerment is defined as “the individual’s perceived sense of meaning and purpose, competence, self-determination, and impact on the work role” (Pines et al., 2014, p. 86). Conflict management style is defined as “[depending] on the situation and the parties involved and [involving] a choice of methods to manage a situation. . . . [The five] conflictmanagement styles [are] accommodating, avoiding, collaborating, competing, and compromising. Accommodating is unassertive and cooperative and allows the other person to dominate. Avoiding is both uncooperative and unassertive and is characterized by the individual’s avoidance of taking any action. Collaborating is assertive and cooperative and represents an attempt to find a solution to the conflict. Competing is assertive and uncooperative. Finally, compromising is intermediate in both
- 29. assertiveness and cooperativeness and partially satisfies the needs of each party. With competing, [an individual] assertively pursues personal concerns at the expense of the concerns of another. In compromising, the object is to find a mutually agreeable solution that partially satisfies both parties. Resiliency and empowerment reflect application of the appropriate strategy/style in response to the situation” (Thomas & Kilmann, as cited in Pines et al., 2014, p. 86). The following theory proposition specifies effects: Simulated conflict management training exercises have a positive effect on stress resiliency, psychological empowerment, and conflictmanagement style (Pines et al., 2014). Empirical Indicators and Other Empirical Methods Most theory concepts and propositions cannot be directly observed or measured. Instead, each concept must be connected to an empirical indicator, which serves as a real-world proxy—or substitute—for a concept. Empirical indicators that are particularly useful for advanced practice nurses are assessment tools and intervention protocols. Assessment tools include various types of questionnaires, such as checklists and rating scales, which contain one or more items. For example, postpartum mood disorder is assessed by the 21-item Neuman Postpartum Mood Questionnaire (Fashinpaur, 2002), or as a one-item rating scale that asks the woman to indicate, on a scale of 0 to 10, the extent to which she feels depressed. One-item assessment tools are particularly
- 30. useful in advanced practice nursing because they do not impose a burden on patients, which may occur when a tool with many items is used. One-item assessment tools also are useful because they do not impose an undue burden on the advanced practice nurse, which may occur with use of a multi-item tool that requires calculation of a score. Conceptual Models Theories are developed through a melding of science and art in the form of creative conversion of ideas stemming from provocative facts (Levine, 1966; 1991) observed in practice and in the literature. These facts are noticed because they fit with the observer’s frame of reference about nursing, which also is called a conceptual model of nursing. Among the best-known conceptual models are Levine’s Conservation Model, Neuman’s Systems Model, Orem’s Self-Care Framework, and Roy’s Adaptation Model. Overviews of these and other conceptual models of nursing are found in Appendix N-1 of Taber’s Cyclopedic Medical Dictionary (Fawcett, 2013). A comprehensive analysis and evaluation of each of these and other conceptual models of nursing is given in Fawcett and DeSanto-Madeya’s (2013) book Contemporary Nursing Knowledge: Analysis and Evaluation of Nursing Models and Theories. Each conceptual model of nursing is made up of concepts and
- 31. propositions that are more abstract and general than those of a theory. Examples of concepts from Roy’s adaptation model include stimuli andgeneral than those of a theory. Examples of concepts from Roy’s adaptation model include stimuli and adaptation. For example, the following proposition defines a conceptual model concept: Adaptation is defined as “the process and outcome whereby thinking and feeling people, as individuals and in groups, use conscious awareness and choice to create human and environment integration” (Roy, 2009, p. 26). An example of a proposition that links the concepts of stimuli and adaptation is as follows: Stimuli are related to the physiological, self-concept, role function, and interdependence modes of adaptation (Fawcett, 2003). Conceptual–Theoretical–Empirical Structures for Theory Development Theory development involves specification of a conceptual – theoretical–empirical (C-T-E) structure made up of three components: A conceptual model A theory Empirical indicators and other empirical methodsTheory development is the product of research, which is a systematic process of inquiry (Fawcett & Garity, 2009). Thus, every study is explicitly or implicitly designed to develop a theory by means of generation of new theory or testing of an existing theory. Theory-generating research is descriptive research, the findings of which are new descriptive theories. Theory
- 32. testing research can be descriptive, correlational, or experimental research. The findings of descriptive theory-testing research determine the empirical adequacy of an existing descriptive theory. The findings of correlational theory-testing research determine the empirical adequacy of an existing explanatory theory. The findings of experimental theory-testing research determine the empirical adequacy of an existing predictive theory. Although the conduct of research typically is thought of as a rigorous scientific process, it is also a creative endeavor involving an appreciation of the beauty of logical reasoning and the “aha” moments that come when developing elegant C-T-E structures, designing studies, and interpreting data. 13/11/2019 Trade and investment in the global economy | VOX, CEPR Policy Portal https://voxeu.org/article/trade-and-investment-global-economy 1/4 Columns Video Vox VoxTalks Publications Blogs&Reviews People Debates Events About VOX CEPR Policy Portal Research-based policy analysis and commentary from leading economists Search Create account | Login | Subscribe
- 33. 28 A A Related Can FDI help developing countries upgrade export quality? Torfinn Harding, Beata Javorcik Protectionism backfires on FDI Holger Görg, Christiane Krieger-Boden Intellectual property rights and FDI knowledge diffusion Roger Smeets, Albert de Vaal Trade and investment in the global economy James Anderson, Mario Larch, Yoto Yotov 30 July 2019 Foreign direct investment has traditionally been viewed as a key driver of prosperity, and modern FDI has also become a vehicle for transferring intangible assets. This column uses a counterfactual experiment based on a hypothetical world with no outward or inward FDI to and from low-income and lower-middle-income countries to examine the effects of FDI on trade, domestic investment, and welfare. World welfare falls by about 6% and all countries lose out, with some poorer countries losing over 50%. World trade falls by 7%, with the losses again unevenly distributed. Foreign direct investment (FDI) is traditionally viewed as a key driver of prosperity in policy circles. According to the OECD (2002), “FDI is an integral part of an open and effective international economic system and a major catalyst to development. [...] With most FDI flows originating from OECD countries, developed countries can contribute to advancing this
- 34. agenda. They can facilitate developing countries' access to international markets and technology.” In addition, modern FDI has become a vehicle for transferring intangible assets. According to the World Bank (2015), “[t]oday, FDI is not only about capital, but also – and more important – about technology and know-how, [...] International patterns of production are leading to new forms of cross-border investment, in which foreign investors share their intangible assets such as know-how or brands in conjunction with local capital or tangible assets of domestic investors.” Academics share the hopes of policymakers for a positive economic impact of FDI, which plays central role in recent integration efforts. Slaughter (2013: 3) argues that “[i]f successfully negotiated, [TTIP and TPP] would deepen and strengthen ties with many of the most significant U.S. economic partners. A large majority of inward FDI in the United States already originates from TTIP and TPP countries, making these deals particularly important in the broader effort to recruit global business investment.” Policymakers' enthusiasm is based on the obvious partial equilibrium evidence of FDI impacts on sectoral output, employment, and capital returns. In contrast, there is relatively little structural evidence for the economy-wide importance of FDI as a vehicle for knowledge transfer and the effects on trade, domestic investment, and welfare. The lack of a unified multi-country framework of the global economy impact of FDI is, at least in part, because the relationship between FDI and various economic outcomes is intrinsically dynamic. However, as noted by Desmet and Rossi- Hansberg (2014), introducing dynamics to static multi-country
- 35. trade models is hard, typically making “spatial dynamic models intractable, both analytically and numerically.” (p. 1212). To gain traction with spatial dynamics in the case of FDI, in a recent paper (Anderson et al. 2019b) we build a framework that characterises the impact of FDI through interactions with trade and domestic investment in physical capital. On the trade side, the model is a member of the wide structural gravity class of new quantitative general equilibrium trade models described in detail by Arkolakis et al. (2012). Domestic investment in physical capital is modelled following Anderson et al. (2019a). The main novelty is the introduction of FDI on the supply side, where, in the spirit of McGrattan and Prescott (2009) and Markusen (2002), production uses FDI in the form of non-rival (or joint) technology capital along with labour and physical capital stocks. Thus, countries can use their technology capital in potentially all countries while using at home the technology capital from potentially all countries. FDI liberalisation increases FDI, with general equilibrium implications for trade, income, and expenditure. An increase in bilateral FDI directly leads to higher income and to higher expenditure in the liberalising countries. Since higher expenditure leads to more accumulation of technology Banking, FinTech, Big Tech: Emerging challenges for financial policymakers Challenges in the digital age
- 36. The parliamentary Brexit endgame James Anderson William B. Neenan Millenium Professor of Economics, Boston College Mario Larch Professor for Empirical Economics (Chair) at the University of Bayreuth Yoto Yotov Professor, LeBow College of Business, Drexel University Don't Miss Petralia, Philippon, Rice, Véron Labhard, McAdam, Petroulakis, Vivian Tyson Events Cross border financial services: Europe's Cinderella? 15 - 15 November 2019 / Brussels, Belgium / SUERF - The European Money and
- 37. Finance Forum BFF - The Belgian Financial Forum Autumn School on FinTech 20 - 22 November 2019 / Florence, Italy / Florence School of Banking and By Topic By Date By Reads By Tag https://voxeu.org/columns https://voxeu.org/videovox https://voxeu.org/vox-talks https://voxeu.org/epubs https://voxeu.org/blogs-reviews https://voxeu.org/people https://voxeu.org/debates https://voxeu.org/events https://voxeu.org/pages/about-vox https://voxeu.org/ https://www.facebook.com/cepr.org/ https://www.linkedin.com/company/centre-for-economic-policy- research/ https://www.twitter.com/voxeu/ https://www.youtube.com/voxviewscepr/ https://voxeu.org/user/register https://voxeu.org/user/login?destination=node/64421 https://voxeu.org/pages/feeds https://voxeu.org/article/can-fdi-help-developing-countries- upgrade-export-quality https://voxeu.org/article/protectionism-backfires-fdi https://voxeu.org/article/intellectual-property-rights-and-fdi- knowledge-diffusion https://voxeu.org/article/banking-fintech-big-tech-emerging- challenges-financial-policymakers https://voxeu.org/article/challenges-digital-age
- 38. https://voxeu.org/article/parliamentary-brexit-endgame https://voxeu.org/user/221485 https://voxeu.org/user/220932 https://voxeu.org/user/221486 https://voxeu.org/events/cross-border-financial-services- europes-cinderella-0 https://voxeu.org/events/autumn-school-fintech https://voxeu.org/columns/topics https://voxeu.org/columns/archive https://voxeu.org/columns/reads https://voxeu.org/columns/tag 13/11/2019 Trade and investment in the global economy | VOX, CEPR Policy Portal https://voxeu.org/article/trade-and-investment-global-economy 2/4 capital, FDI liberalisation between two countries will also trigger positive spillover effects on output and expenditure in third countries. Through its impact on output and expenditure, increases in FDI will also translate into increases in trade flows. The changes in FDI in our counterfactual experiment also indirectly affect trade between countries with no change in bilateral FDI. The structural gravity class of models describes equilibrium trade as if each country trades with a world market facing an average friction called multilateral resistance – one on outward shipments (export) and another on inward shipments (imports). Changes in outputs and expenditures change the equilibrium multilateral resistances because they are general equilibrium indexes, i.e. they capture the effects of changes between any two countries on consumer and on
- 39. producer prices in any other country in the model. Motivated by one of the opening quotes, which depicts FDI as a key driver of development, we quantify the importance of the novel FDI channel with a counterfactual experiment that describes a hypothetical world without outward and inward FDI from and to low- and lower-middle-income countries. The calibration is based on a balanced data set for 89 countries, which account for more than 96% of world GDP and for more than 94% of FDI in 2011. Of the 89 countries, 21 are classified as low- or lower-middle-income countries according to The World Bank's Country and Lending Groups classification. The impact from the elimination of FDI in the low- and lower- middle-income countries on trade and welfare in the world is depicted in Figures 1 and 2. Figure 1 reports the effects on trade, measured by the percentage change in total exports. Three main findings stand out. First, FDI is indeed an important driver of trade. On average, the gains from FDI in the poorer countries in the world amount to 7% of world's trade in 2011, the year of our counterfactual analysis. Second, all countries lose from the counterfactual elimination of FDI in the poorer countries. Third, the impact is heterogeneous. Poorer countries lose the most, but the impact varies widely even within this group – some lose over 50% and some very little. The impact on countries in the rest of the world is significant as well. Some countries lose a lot (e.g. Luxembourg, Singapore, and Ireland) while others (such as India, Ecuador, and Dominican Republic) lose
- 40. less. Pakistan and Sri Lanka actually see an increase in their total exports due to the elimination of FDI. Figure 1 Percentage change in total exports from eliminating outward and inward FDI to and from low- and lower-middle-income countries Figure 2 reports impact of the elimination of FDI in the poorer countries on welfare, measured by properly discounted consumption. Overall, in terms of direction, the welfare indexes in Figure 2 are consistent with the trade indexes that we present in Figure 1. On average, the gains from FDI amount to 6% of world's welfare in 2011. Further, all countries in the world have benefited from FDI, but the effects are very heterogeneous. The directly affected low- and lower-middle-income countries see welfare changes up to over 50% (Morocco and Nigeria), while some of the remaining 68 countries, such as Ecuador, Turkmenistan, and Dominican Republic are hardly affected. A higher country-specific production share of FDI leads to larger welfare losses, all else equal. Intuitively, a larger importance of FDI in production leads to larger welfare losses when restricting FDI. A larger net log FDI position leads to larger welfare losses. Intuitively, if a country has more inward than outward FDI, restricting FDI will lead to larger welfare losses, as FDI is complementary to other production factors and therefore overall income increases more than FDI payments. The results suggest that FDI has acted to reduce cross-country income inequality. In particular, the results suggest that FDI has led to significant increases in the
- 41. welfare of some of the poorer economies in the EU. Given the renewed interest in the determinants of inequality (European Commission 2010), our results have potentially important implications for regional policy. @VoxEU RSS Feeds Weekly Digest Finance, European University Institute Competition in Digital Markets 20 - 22 November 2019 / Barcelona / Barcelona GRaduate School of Economics Forecasting for Banking Using Time Series Methods 27 - 29 November 2019 / Florence, Italy / Florence School of Banking and Finance, European University Institute Call for papers: Workshop on Market Frictions and Macroeconomics, Santiago, Chile 28 - 29 November 2019 / Santiago, Chile / Millennium
- 42. Institute in Market Imperfections and Public Policy (MIPP) and Center for Applied Economics, University of Chile CEPR Policy Research Discussion Papers Insights Homeownership of immigrants in France: selection effects related to international migration flows Gobillon, Solignac Climate Change and Long- Run Discount Rates: Evidence from Real Estate Giglio, Maggiori, Stroebel, Weber The Permanent Effects of Fiscal Consolidations Summers, Fatás Demographics and the Secular Stagnation Hypothesis in Europe Favero, Galasso QE and the Bank Lending Channel in the United Kingdom Butt, Churm, McMahon, Morotz, Schanz
- 43. Subscribe http://twitter.com/VoxEU https://voxeu.org/feed/recent/rss.xml https://voxeu.org/pages/how-do-i-subscribe-vox-weekly-digest- email https://voxeu.org/events/competition-digital-markets https://voxeu.org/events/forecasting-banking-using-time-series- methods https://voxeu.org/events/call-papers-workshop-market-frictions- and-macroeconomics-santiago-chile-0 https://voxeu.org/article/trade-and-investment-global- economy?qt-quicktabs_cepr_policy_research=0#qt- quicktabs_cepr_policy_research https://voxeu.org/article/trade-and-investment-global- economy?qt-quicktabs_cepr_policy_research=1#qt- quicktabs_cepr_policy_research https://voxeu.org/epubs/cepr-dps/homeownership-immigrants- france-selection-effects-related-international-migration-flows https://voxeu.org/epubs/cepr-dps/climate-change-and-long-run- discount-rates-evidence-real-estate https://voxeu.org/epubs/cepr-dps/permanent-effects-fiscal- consolidations https://voxeu.org/epubs/cepr-dps/demographics-and-secular- stagnation-hypothesis-europe https://voxeu.org/epubs/cepr-dps/qe-and-bank-lending-channel- united-kingdom 13/11/2019 Trade and investment in the global economy | VOX, CEPR Policy Portal https://voxeu.org/article/trade-and-investment-global-economy 3/4 28 A A
- 44. Figure 2 Welfare effects of eliminating outward and inward FDI to and from low- and lower-middle- income countries (%) Overall, the analysis reveals that FDI is indeed an important component of the modern world economic system. The results suggest positive payoffs to policies designed to facilitate FDI, particularly those concerning protection of intellectual property. In addition, our structural approach opens new opportunities for further empirical and policy research. For example, the model delivers a structural FDI gravity system that resembles the traditional gravity system of the trade literature and lends itself to estimation with the most recent econometric techniques from the gravity literature. Another structural implication of the model is on the relationship between FDI and income/growth, which can be tested in the spirit of Frankel and Romer (1999). Yet another structurally motivated relationship that can be tested is the one between FDI and domestic investment. References Anderson, J E, M Larch, and Y V Yotov (2019a), “Growth and Trade with Frictions: A Structural Estimation Framework”, Economic Journal, forthcoming. Anderson, J E, M Larch, and Y V Yotov (2019b), “Trade and Investment in the Global Economy: A Multi-country Dynamic Analysis”, working paper. Arkolakis, C, A Costinot, and A Rodríguez-Clare (2012), “New
- 45. Trade Models, Same Old Gains?,” American Economic Review 102(1): 94–130. Desmet, K and E Rossi-Hansberg (2014), “Spatial Development”, American Economic Review 104(4): 1211–1243. European Commission (2010), Investing in Europe's Future. Frankel, J A and D H Romer (1999), “Does Trade Cause Growth?”, American Economic Review 89(3): 379–399. Markusen, J R and K E Maskus (2002), “Discriminating Among Alternative Theories of the Multinational Enterprise,” Review of International Economics 10(4): 694–707. McGrattan, E R and E C Prescott (2009), “Openness, Technology Capital, and Development,” Journal of Economic Theory 144(6): 2454–2476. OECD (2002), Foreign Direct Investment for Development: Maximising Benefits, Minimising Costs. Slaughter, M J (2013), Attracting Foreign Direct Investment through an Ambitious Trade Agenda, Organization for International Investment Research Report. Qiang, C, R Echandi and J Krajcovicova (2015), “Foreign Direct Investment and Development: Insights from Literature and Ideas for Research”, World Bank Private Sector Development Blog, 24 November. Topics: Global economy Industrial organisation International
- 46. trade Tags: FDI, welfare, knowledge transfer, investment https://www.oecd.org/investment/investmentfordevelopment/19 59815.pdf http://blogs.worldbank.org/psd/foreign-direct-investment-and- development-insights-literature-and-ideas-research https://voxeu.org/content/topics/global-economy https://voxeu.org/content/topics/industrial-organisation https://voxeu.org/content/topics/international-trade https://voxeu.org/taxonomy/term/356 https://voxeu.org/taxonomy/term/749 https://voxeu.org/taxonomy/term/ 5486 https://voxeu.org/taxonomy/term/630 13/11/2019 Trade and investment in the global economy | VOX, CEPR Policy Portal https://voxeu.org/article/trade-and-investment-global-economy 4/4 Related Can FDI help developing countries upgrade export quality? Torfinn Harding, Beata Javorcik Protectionism backfires on FDI Holger Görg, Christiane Krieger-Boden Intellectual property rights and FDI knowledge diffusion Roger Smeets, Albert de Vaal Printer-friendly version https://voxeu.org/article/can-fdi-help-developing-countries-
- 47. upgrade-export-quality https://voxeu.org/article/protectionism-backfires-fdi https://voxeu.org/article/intellectual-property-rights-and-fdi- knowledge-diffusion https://voxeu.org/print/64421 13/11/2019 The contribution of Chinese FDI to Africa’s growth | VOX, CEPR Policy Portal https://voxeu.org/article/contribution-chinese-fdi-africa-s- growth 1/2 Columns Video Vox VoxTalks Publications Blogs&Reviews People Debates Events About VOX CEPR Policy Portal Research-based policy analysis and commentary from leading economists Search Create account | Login | Subscribe 9 A A The contribution of Chinese FDI to Africa’s pre-crisis growth surge John Whalley, Aaron Weisbrod 21 December 2011 In the three years before the global crisis, the average GDP growth in sub-Saharan Africa was around 6%. This period also saw significant Chinese foreign direct investment flowing into the continent. This column uses growth-accounting methods to assess what portion of this growth can be attributed to Chinese FDI. Although for some countries and years the effects were negligible, some
- 48. countries saw total GDP growth from 2002 to 2009 increase by 0.5 percentage points due to Chinese FDI alone. In the three years before the 2008 financial crisis, GDP growth in sub-Saharan Africa (averaged over individual economies) was around 6%, 2 percentage points above the mean growth in the preceding ten years. This period also coincided with significant Chinese foreign direct investment (FDI) flows into these countries, accounting for as much as 10% of total inward FDI for some countries. In our research (Weisbrod and Whalley 2011) we use growth-accounting methods to assess what portion of this elevated growth can be attributed to Chinese inward FDI. Chinese FDI flows to Africa Chinese FDI over this period was uneven in both country and sectoral coverage. It was heavily concentrated in a relatively small number of countries and in natural resources. The majority of this FDI was new investment, with the notable exception of the purchase of a significant position in a major South African bank in 2008. Given the large number of African countries, we focus on the largest economies and the largest recipients of Chinese inward FDI. We consider 13 economies (Angola, Botswana, the Democratic Republic of the Congo (DRC), Ethiopia, Ghana, Kenya, Madagascar, Niger, Nigeria, South Africa, Sudan, Tanzania, and Zambia) accounting for 78% of sub-Saharan African GDP, and 92% of Chinese FDI flows between 2003 and 2009.
- 49. Growth accounting and the contribution of Chinese FDI to African growth We follow Solow (1957), Dennison (1962), and others and use data for individual economies between 1990 and 2009 to first calculate Solow residuals. We use capital stock, workforce, and factor-share data by country. Capital stock data is unavailable directly, so we use perpetual- inventory methods to construct the data. Factor shares come from the UN National Accounts data or the World Bank World Development Indicators, depending on the calculation method (this is further addressed in our paper). We use data on Chinese FDI inflows by country to decompose capital stock estimates by country for the years 2003-91 into a portion due to Chinese inflows, and a remaining non-Chinese FDI portion. Removing Chinese FDI-driven capital stock data in the growth accounting enables us to assess what growth would have been without Chinese FDI. We run counterfactual growth-accounting experiments for 13 sub-Saharan African countries, both for the three years 2005-7 and for the longer period 2003-9. Our estimates of Chinese FDI’s contribution to the GDP growth vary by nation and by year. There are years where GDP growth was elevated by one half of a percentage point (most notably Zambia from 2006-8 with 0.44-0.67% per annum, Niger in 2007 at 0.38%, and the DRC in 2009 at 0.65%). Although for some countries and years, the effects were smaller or even negligible, some countries saw total GDP growth over the
- 50. total period (i.e. the growth in GDP from 2002-9) increase by 0.5 percentage points or more due to inward Chinese FDI alone. The contribution of Chinese FDI to sub-Saharan African growth also expanded from having significant growth effects in a relatively small group of core countries (Nigeria, Niger, Sudan, Zambia and, to a lesser extent, the DRC) in the years preceding the world Banking, FinTech, Big Tech: Emerging challenges for financial policymakers Challenges in the digital age The parliamentary Brexit endgame John Whalley Professor and William G. Davis Chair in International Trade, Department of Economics, University of Western Ontario Aaron Weisbrod Department of Economics, University of Western Ontario Don't Miss Petralia, Philippon, Rice, Véron Labhard, McAdam, Petroulakis,
- 51. Vivian Tyson Events Cross border financial services: Europe's Cinderella? 15 - 15 November 2019 / Brussels, Belgium / SUERF - The European Money and Finance Forum BFF - The Belgian Financial Forum Autumn School on FinTech 20 - 22 November 2019 / Florence, Italy / Florence School of Banking and Finance, European University Institute Competition in Digital Markets 20 - 22 November 2019 / Barcelona / Barcelona GRaduate School of Economics Forecasting for Banking Using Time Series Methods 27 - 29 November 2019 / Florence, Italy / Florence School of Banking and Finance, European University Institute
- 52. Call for papers: Workshop on Market Frictions and Macroeconomics, Santiago, Chile 28 - 29 November 2019 / Santiago, Chile / Millennium Institute in Market Imperfections and Public Policy (MIPP) and Center for Applied Economics, University of Chile By Topic By Date By Reads By Tag https://voxeu.org/columns https://voxeu.org/videovox https://voxeu.org/vox-talks https://voxeu.org/epubs https://voxeu.org/blogs-reviews https://voxeu.org/people https://voxeu.org/debates https://voxeu.org/events https://voxeu.org/pages/about-vox https://voxeu.org/ https://www.facebook.com/cepr.org/ https://www.linkedin.com/company/centre-for-economic-policy- research/ https://www.twitter.com/voxeu/ https://www.youtube.com/voxviewscepr/ https://voxeu.org/user/register https://voxeu.org/user/login?destination=node/7457 https://voxeu.org/pages/feeds https://voxeu.org/article/banking-fintech-big-tech-emerging- challenges-financial-policymakers https://voxeu.org/article/challenges-digital-age https://voxeu.org/article/parliamentary-brexit-endgame https://voxeu.org/user/219766
- 53. https://voxeu.org/user/221821 https://voxeu.org/events/cross-border-financial-services- europes-cinderella-0 https://voxeu.org/events/autumn-school-fintech https://voxeu.org/events/competition-digital-markets https://voxeu.org/events/forecasting-banking-using-time-series- methods https://voxeu.org/events/call-papers-workshop-market-frictions- and-macroeconomics-santiago-chile-0 https://voxeu.org/columns/topics https://voxeu.org/columns/archive https://voxeu.org/columns/reads https://voxeu.org/columns/tag 13/11/2019 The contribution of Chinese FDI to Africa’s growth | VOX, CEPR Policy Portal https://voxeu.org/article/contribution-chinese-fdi-africa-s- growth 2/2 9 A A financial crisis (2005-7) to also producing noticeable, even if smaller, growth effects in a wider range of sub-Saharan African countries during the years of the crisis (2008-9). These results suggest that a significant, even if in some cases small, amount of the elevated growth in sub-Saharan Africa in recent years can be attributed to Chinese inward investment. Caveats Several caveats apply to both the data and the use of growth- accounting techniques for this purpose. One is that exploration expenses in natural resources
- 54. are largely expensed, which tends to understate the investment estimates used to construct capital stock data in some key countries. Another is that factor-share data in African national accounts are typically based on wages paid, and so returns to smallholders fully show as capital in use. This use of share data biases the contribution of investment to growth rates upward. Finally, ideally a clear separation is needed between greenfield Chinese investment and purchase of exi sting assets when using Chinese FDI data for our purposes, and we make some modifications to FDI data for this. Despite these caveats, our results are suggestive of a significant, even if in some cases small, contribution of Chinese FDI to elevated African growth, a feature which is likely even more pronounced post-crisis since Chinese FDI into Africa has increased further. References Solow, Robert M. (1957) “Technical Change and the Aggregate Production Function.” The Review for Economics and Statistics 39, No.3, 312-320. Denison, Edward (1962). The Sources of Economic Growth in the United States and the Alternatives Before Us. New York, NY: Committee for Economic Development. Weisbrod, Aaron & John Whalley (2011). "The Contribution of Chinese FDI to Africa’s Pre Crisis Growth Surge," NBER Working Paper 17544. 1 Although data for Chinese inward outward FDI is available for 2010, country-level data for our recipient countries only go up to 2009 so it is currently not possible for our experiments to include
- 55. 2010. Topics: Development Tags: growth, China, Africa, FDI Printer-friendly version @VoxEU RSS Feeds Weekly Digest CEPR Policy Research Discussion Papers Insights Homeownership of immigrants in France: selection effects related to international migration flows Gobillon, Solignac Climate Change and Long- Run Discount Rates: Evidence from Real Estate Giglio, Maggiori, Stroebel, Weber The Permanent Effects of Fiscal Consolidations Summers, Fatás Demographics and the
- 56. Secular Stagnation Hypothesis in Europe Favero, Galasso QE and the Bank Lending Channel in the United Kingdom Butt, Churm, McMahon, Morotz, Schanz Subscribe http://ideas.repec.org/p/nbr/nberwo/17544.html https://voxeu.org/content/topics/development https://voxeu.org/taxonomy/ter m/94 https://voxeu.org/taxonomy/term/137 https://voxeu.org/taxonomy/term/152 https://voxeu.org/taxonomy/term/356 https://voxeu.org/print/7457 http://twitter.com/VoxEU https://voxeu.org/feed/recent/rss.xml https://voxeu.org/pages/how-do-i-subscribe-vox-weekly-digest- email https://voxeu.org/article/contribution-chinese-fdi-africa-s- growth?qt-quicktabs_cepr_policy_research=0#qt- quicktabs_cepr_policy_research https://voxeu.org/article/contribution-chinese-fdi-africa-s- growth?qt-quicktabs_cepr_policy_research=1# qt- quicktabs_cepr_policy_research https://voxeu.org/epubs/cepr-dps/homeownership-immigrants- france-selection-effects-related-international-migration-flows https://voxeu.org/epubs/cepr-dps/climate-change-and-long-run- discount-rates-evidence-real-estate https://voxeu.org/epubs/cepr-dps/permanent-effects-fiscal- consolidations https://voxeu.org/epubs/cepr-dps/demographics-and-secular-
- 57. stagnation-hypothesis-europe https://voxeu.org/epubs/cepr-dps/qe-and-bank-lending-channel- united-kingdom 13/11/2019 How the iPhone widens the US trade deficit with China | VOX, CEPR Policy Portal https://voxeu.org/article/how-iphone-widens-us-trade-deficit- china-0 1/4 Columns Video Vox VoxTalks Publications Blogs&Reviews People Debates Events About VOX CEPR Policy Portal Research-based policy analysis and commentary from leading economists Search Create account | Login | Subscribe 22 A A Related The knock-on consequences of the US-China trade tariffs on global value chains Jayant Menon Welfare effects of Trump's China tariffs Daniel Gros How the iPhone widens the US trade deficit with China Yuqing Xing How the iPhone widens the US trade deficit with
- 58. China: The case of the iPhone X Yuqing Xing 11 November 2019 In order to pursue ‘fair trade’, the Trump administration has imposed a punitive 25% tariff on $250 billion’s worth of Chinese goods. However, conventional trade statistics greatly exaggerate the US trade deficit with China. This column uses the iPhone as an example to demonstrate how the trade deficit is inflated and why value-added should be used to assess the bilateral trade balance. If multinational enterprises, including Apple, shift part of their value chains out of China, China may no longer play a central role in global value chains targeting the US market. Depreciation of the yuan will be insufficient to counter the effect. Editor’s note: This is an update of a column first published in April 2011. In 2018, the US trade deficit with China in goods surged to $420 billion. The huge trade deficit triggered the on-going US-China trade war. In order to pursue so-called fair trade, the Trump administration has imposed a punitive 25% tariff on $250 billion’s worth of Chinese goods. Since the start of the trade war, the Chinese yuan has been depreciating against the US dollar. Alleging that the Chinese government used depreciation as a trade-war weapon, the Trump administration has designated China a ‘currency manipulator’. There has been a consensus among economists that conventional trade statistics greatly exaggerate the US trade deficit with China (Johnson and Noguera 2012, OECD and WTO 2013, Koopman, Wang and Wei 2014). Xing and Detert (2010) use the iPhone 3G as a case and explain
- 59. how the US trade deficit with China was inflated and why value-added should be used to assess the bilateral trade balance. Since the 2007 release of the first-generation iPhone, China has been the exclusive base for iPhone assembly. With the launch of the iPhone X, the iPhone has evolved into a luxury high-tech gadget. In this column, I use the iPhone X as a case to discuss three questions. (1) Have the Chinese firms involved in the iPhone production moved up in the value-chain ladder? (2) Does the iPhone remain a significant source of the trade imbalance between the US and China? (3) Could the yuan depreciation hedge the risk of Trump’s tariffs? Moving up the iPhone value chain For an understanding of Chinese firms’ upward progress in the iPhone value chain, I examine the iPhone teardown data to assess Chinese-firm involvement in the production of the iPhone X. The teardown data identifies 10 domestic Chinese companies involved in iPhone X production. Their tasks go beyond simple assembly to include roles in relatively sophisticated segments. Table 1 lists the tasks performed by Chinese firms for the iPhone X in comparison with that for the iPhone 3G. Table 1 Tasks performed by Chinese firms in iPhone 3G and iPhone X production Banking, FinTech, Big Tech: Emerging challenges for financial policymakers
- 60. Challenges in the digital age The parliamentary Brexit endgame Yuqing Xing Professor of Economics at the National Graduate Institute for Policy Studies, Tokyo Don't Miss Petralia, Philippon, Rice, Véron Labhard, McAdam, Petroulakis, Vivian Tyson Events Cross border financial services: Europe's Cinderella? 15 - 15 November 2019 / Brussels, Belgium / SUERF - The European Money and Finance Forum BFF - The Belgian Financial Forum Autumn School on FinTech 20 - 22 November 2019 / Florence, Italy / Florence School of Banking and Finance, European University Institute
- 61. Competition in Digital Markets 20 - 22 November 2019 / Barcelona / Barcelona GRaduate School of Economics Forecasting for Banking Using Time Series Methods 27 - 29 November 2019 / Florence, Italy / Florence School of Banking and Finance, European University Institute Call for papers: Workshop on Market Frictions and Macroeconomics, Santiago, Chile 28 - 29 November 2019 / Santiago, Chile / Millennium Institute in Market Imperfections and Public Policy (MIPP) and Center for Applied Economics, University of Chile CEPR Policy Research Discussion Papers Insights Homeownership of immigrants in France: selection effects related to international migration flows Gobillon, Solignac
- 62. By Topic By Date By Reads By Tag https://voxeu.org/columns https://voxeu.org/videovox https://voxeu.org/vox-talks https://voxeu.org/epubs https://voxeu.org/blogs-reviews https://voxeu.org/people https://voxeu.org/debates https://voxeu.org/events https://voxeu.org/pages/about-vox https://voxeu.org/ https://www.facebook.com/cepr.org/ https://www.linkedin.com/company/centre-for-economic-policy- research/ https://www.twitter.com/voxeu/ https://www.youtube.com/voxviewscepr/ https://voxeu.org/user/register https://voxeu.org/user/login?destination=nod e/64776 https://voxeu.org/pages/feeds https://voxeu.org/article/knock-consequences-us-china-trade- tariffs-global-value-chains https://voxeu.org/article/welfare-effects-trumps-china-tariffs https://voxeu.org/article/how-iphone-widens-us-trade-deficit- china https://voxeu.org/article/how-iphone-widens-us-trade-deficit- china https://voxeu.org/article/banking-fintech-big-tech-emerging- challenges-financial-policymakers https://voxeu.org/article/challenges-digital-age https://voxeu.org/article/parliamentary-brexit-endgame https://voxeu.org/user/221432 https://voxeu.org/events/cross-border-financial-services- europes-cinderella-0 https://voxeu.org/events/autumn-school-fintech
- 63. https://voxeu.org/events/competition-digital-markets https://voxeu.org/events/forecasting-banking-using-time-series- methods https://voxeu.org/events/call-papers-workshop-market-frictions- and-macroeconomics-santiago-chile-0 https://voxeu.org/article/how-iphone-widens-us-trade-deficit- china-0?qt-quicktabs_cepr_policy_research=0#qt- quicktabs_cepr_policy_research https://voxeu.org/article/how-iphone-widens-us-trade-deficit- china-0?qt-quicktabs_cepr_policy_research=1#qt- quicktabs_cepr_policy_research https://voxeu.org/epubs/cepr-dps/homeownership-immigrants- france-selection-effects-related-international-migration-flows https://voxeu.org/columns/topics https://voxeu.org/columns/archive https://voxeu.org/columns/reads https://voxeu.org/columns/tag 13/11/2019 How the iPhone widens the US trade deficit with China | VOX, CEPR Policy Portal https://voxeu.org/article/how-iphone-widens-us-trade-deficit- china-0 2/4 Source: Xing (2019). For instance, Sunwada, a leading Chinese battery maker, supplies the battery pack of the iPhone X, and Chinese company Dongshan Precision supplies the printed circuit boards for the iPhone X through its acquired American company M-Flex. The involvement of those Chinese firms, though restricted to non-core technology segments of the iPhone X value chain, indicates that the Chinese mobile phone industry as a whole has moved to an upper rung in
- 64. the iPhone value-chain ladder. The bill of materials of the iPhone X is estimated at $409.25, of which the Chinese firms jointly contribute $104, about 25.4%. Chinese value-added in the iPhone X is dramatically higher than the $6.5 captured in the iPhone 3G. The retail price of the iPhone X is $1,000; the Chinese firms together gain 10.4% of the total value added of every iPhone X sold on the global market. Figure 1 compares the Chinese value-added of the iPhone X with that of the iPhone 3G. It clearly demonstrates that the Chinese value-added embedded in iPhones increased substantially from the first generation to the iPhone X. Figure 1 Chinese value-added embedded in the iPhone 3G and iPhone X Source: Xing (2019). The iPhone remains a significant source of the Sino-US trade imbalance To date, trade statistics are still compiled using the gross value of exports, implicitly assuming that all gross value is generated by the exporting nation. According to that principle, whenever China ships one iPhone X to the US, the current system of trade statistics calculates it as a $409.25 export to the US. The teardown data reveals that the total value of the parts imported from the US for assembly of the iPhone X is $76.5. Hence, importing one iPhone X from China
- 65. generates a $332.75 ($409.25– $76.5) trade deficit for the US. That is the conventional approach to calculating bilateral trade balances. However, Korea, Japan, and other countries are also involved in the production of the iPhone X and supply more than 45% of the parts and components. In other words, the $332.75 consists of not only value-added originating in China but also that contributed by Korea, Japan, and other non-US countries. It should be considered as a trade deficit between the US and all other countries involved in manufacturing the iPhone X, not just China. @VoxEU RSS Feeds Weekly Digest Climate Change and Long- Run Discount Rates: Evidence from Real Estate Giglio, Maggiori, Stroebel, Weber The Permanent Effects of Fiscal Consolidations Summers, Fatás Demographics and the Secular Stagnation Hypothesis in Europe Favero, Galasso
- 66. QE and the Bank Lending Channel in the United Kingdom Butt, Churm, McMahon, Morotz, Schanz Subscribe http://twitter.com/VoxEU https://voxeu.org/feed/recent/rss.xml https://voxeu.org/pages/how-do-i-subscribe-vox-weekly-digest- email https://voxeu.org/epubs/cepr-dps/climate-change-and-long-run- discount-rates-evidence-real-estate https://voxeu.org/epubs/cepr-dps/permanent-effects-fiscal- consolidations https://voxeu.org/epubs/cepr-dps/demographics-and-secular- stagnation-hypothesis-europe https://voxeu.org/epubs/cepr-dps/qe-and-bank-lending-channel- united-kingdom 13/11/2019 How the iPhone widens the US trade deficit with China | VOX, CEPR Policy Portal https://voxeu.org/article/how-iphone-widens-us-trade-deficit- china-0 3/4 In terms of value-added, the US deficit with China for the import of one iPhone X is only $104, less than one-third of the figure based on gross value (Figure 2). For every iPhone X imported by the US, current trade statistics mistakenly add $228.75 to its trade deficit with China. In 2017, American consumers bought 42.2 million iPhones units (Finder 2019). Using that figure as a reference, the
- 67. iPhone trade alone exaggerated US trade deficit with China in 2018 by $9.65 billion, about 2.3% of its total deficit with China. Figure 2 US trade deficit with China for one imported iPhone X ($) Source: Xing (2019). The iPhone case unambiguously demonstrates that conventional trade statistics significantly inflate China’s trade imbalance with the US. The iPhone, a product of an iconic American company Apple, remains a significant source of the Sino-US trade imbalance. Reducing the US trade deficit with China requires not only fair trade but, more importantly, unbiased trade statistics consistent with value chain trade. Hedging Trump’s tariffs by yuan depreciation: Mission impossible Xing and Detert (2010) argue that, because of the foreign value- added embedded in the iPhone 3G, appreciation of the yuan would have little impact on iPhone exports to the US. The same logic applies to the depreciation of the yuan. The large portion of the foreign value-added embedded in the iPhone X greatly weakens the effectiveness of yuan depreciation in counterbalancing Trump’s tariffs. When the Chinese yuan depreciates against the US dollar, only the $104 Chinese value-added of the iPhone X will be affected. The rest of the iPhone X’s production cost—$305.25, the sum of all
- 68. parts and components imported for assembling the iPhone X— will remain constant and not be affected whatsoever. However, if President Trump decides to levy a 25% tariff on the iPhone X, the tax base will be $409.25, i.e. the sum of both Chinese and foreign value-added. To offset the tariff burden due to the foreign value-added, the yuan should depreciate much more than 25%. The level of yuan depreciation needed to completely offset the negative impact of a tariff can be calculated for any given foreign value-added. Figure 3 reports the computation results for two tariffs: 10% and 25%, where the horizontal axis denotes the percentage of foreign value-added embedded in Chinese exports. Figure 3 Yuan depreciation required to offset US tariff effects (%) 13/11/2019 How the iPhone widens the US trade deficit with China | VOX, CEPR Policy Portal https://voxeu.org/article/how-iphone-widens-us-trade-deficit- china-0 4/4 22 A A Source: Xing (2019). With a 10% tariff, an 11.2% depreciation of the yuan can counterbalance the tariff if foreign value
- 69. added is 10%; for exports with 75% foreign value-added, the required depreciation surges to 57.1%. If the tariff rises to 25%, the required depreciation increases substantially in all scenarios. The yuan would have to depreciate 28.6% in order to cancel the tariff’s negative impact if foreign value added is 10%, and 100% depreciation is required for Chinese exports with 60% of foreign value-added. On average, foreign value-added accounts for 33.9% of Chinese exports to the US. This implies that a 43.4% depreciation of the yuan is required to completely cancel the negative impact of a 25% punitive tariff on all Chinese exports to the US, while an unthinkable 400% depreciation of the yuan is necessary to eliminate the negative impact of the same tariff levied on the iPhone X. The depreciation rates required to compensate for a 25% tariff are generally too high to be realised. It is ‘mission impossible’ to use yuan depreciation to hedge the risk of Trump’s tariffs. Since conventional approaches cannot eliminate tariff burdens, for multinational enterprises using China to assemble products catering to the US market, one feasible option is to shift part of their value chains out of China. Apple has asked its major suppliers to evaluate the cost implications of shifting 15-30% of their production capacity from China to Southeast Asia (Li and Cheng 2019). The trade war is reshaping China-centred value chains. The redeployment of the China-centred global value chains will permanently damage China’s export
- 70. capacity and China will no longer play a central role in the global value chains targeting the US market. Reference Finder (2019), “iPhone sales statistics: Just how popular is Apple’s smartphone in the US?”, Finder.com. Johnson, R C, and G Noguera (2012), “Accounting for intermediates: Production sharing and trade in value added”, Journal of International Economics 86: 224– 236. Koopman, R, Z Wang and S Wei (2014), “Tracing value-added and double counting in gross exports”, American Economic Review 104(2): 459–94. Li, K, and T Cheng (2019), “Apple weighs 15%-30% capacity shift out of China amid trade war”, Nikkei Asian Review, 19 June. OECD and WTO (2013), “Trade in value-added: Concepts, methodologies and challenges”, Joint OECD-WTO Note. Xing, Y (2019), “How the iPhone widens the US trade deficit with China: The case of the iPhone X”, GRIPS Discussion Papers 19-21. Xing, Y, and N Detert (2010), “How the iPhone widens the US trade deficit with PRC”, ADB Institute Working Paper 257. Topics: Exchange rates International trade
- 71. Tags: value-added, GVCs, global value chain, China, US, trade war, tariffs, currency depreciation, exports, US-China trade war Related The knock-on consequences of the US-China trade tariffs on global value chains Jayant Menon Welfare effects of Trump's China tariffs Daniel Gros How the iPhone widens the US trade deficit with China Yuqing Xing Printer-friendly version https://voxeu.org/content/topics/exchange-rates https://voxeu.org/content/topics/international-trade https://voxeu.org/category/tags/value-added https://voxeu.org/category/tags/gvcs https://voxeu.org/category/tags/global-value-chain https://voxeu.org/taxonomy/term/137 https://voxeu.org/taxonomy/term/63 https://voxeu.org/taxonomy/term/591 https://voxeu.org/taxonomy/term/279 https://voxeu.org/category/tags/currency-depreciation https://voxeu.org/taxonomy/term/813 https://voxeu.org/taxonomy/term/9898 https://voxeu.org/article/knock-consequences-us-china-trade- tariffs-global-value-chains https://voxeu.org/article/welfare-effects-trumps-china-tariffs https://voxeu.org/article/how-iphone-widens-us-trade-deficit- china https://voxeu.org/print/64776
- 72. Global Economic and Business Operations Assessment Document 2020-21 Module Code: BIN3022 Module Title: Global Economics and Business operations Submission Date: Module Aim This module examines business operations in the context of the global economy. One part investigates the operation of the global economy, looking particularly at international trade, the importance of multinational enterprises and foreign investment, and the growth and development of economics, especially the emerging economies of the BRIC group, among others. Other internationally important global economic issues are also examined, such as globalisation and environmental policy. In the business operations part of the module, the emphasis is on the management methods used to aid resource allocation and decision making in organisations. The nature of the operational process is examined and techniques are developed and applied in practical settings. Module Learning Outcomes Module learning outcomes detail the specific knowledge and understanding, cognitive and intellectual skills, practical and professional skills, and the key transferable skills that you will develop during this module. The learning outcomes for this module are detailed below. These learning outcomes will be assessed when marking your assignment.
- 73. Personal & Transferable Skills 1. Engage effectively in debate and present arguments in a professional manner. 2. Select and justify approaches to the analysis of organisational dynamics and apply them to produce practical improvements. 3. Develop reflective practice skills in the study and analysis of global business dynamics. Research, Knowledge & Cognitive Skills 4. Describe and evaluate models of the dynamics of organisational behaviour. 5. Critically evaluate alternative approaches to the modelling of global business dynamics. 6. Effectively organise global business dynamics knowledge using a variety of techniques. 7. Evaluate a range of approaches to the analysis of organisational dynamics models. Professional Skills 8. Understand and select from a range of key business dynamics modelling skills Module Assessment The assessment requirements for the module, in addition to the generic level 6 University Assessment Criteria and correct use of the required referencing format and style, include the following module specific criteria: ICA (50% of the final mark Global Economics Part of the
- 74. assessment In-Course Assessment Word Limit: 2000 words Submission deadline: You are required to answer all following questions using appropriate theories and concepts that were introduced in our lectures. Use evidence from case study articles where it is relevant. Outline the factors in increased globalization. Discuss how these underling forces are interlinked and reinforce each other. (40 marks) Outline and discuss both benefits of and issues arising from trade protection. You should include the role of FDI in international trade and use evidence from case studies articles as examples to support your discussion. (60 marks) Important instructions: Word limit: 2,000. You should make use of the case study articles as supporting documents i.e. use the evidence from these articles to support your answers. You should also draw on the theories, concepts and frameworks that we covered in ‘global economics’ part of the module. All references, quotes, paraphrasing and summaries should be
- 75. cited clearly in the text (e.g. page numbers, authors, web address etc.) and sources consulted listed in the bibliography. Use a consistent referencing system, preferably Harvard. The mark for this assignment is 50% of the final module mark. Case Study Materials Globalisation 1.0 and 2.0 helped the G7. Globalisation 3.0 helped India and China instead. What will Globalisation 4.0 do The contribution of Chinese FDI to Africa’s growth The return to protectionism The materials are attached in a separate file. In this ICA, Demonstrate good fundamental academic knowledge of Global Economics; Critically analyse data using appropriate techniques; Draw appropriate conclusions; Present the assignment in a clear and understandable way, using the conventions appropriate to a business report with no spelling or grammatical errors. Module Assessment Criteria ICA/ECA Assignments will be marked in accordance with the following marking criteria: ICA ECA Assessment Criteria
- 76. Max Mark 1st Mark 2nd Mark Feedback Comments: Knowledge and understanding of Business Operations and Global Economics to be demonstrated through a clearly presented discussion of OPS MGMT and Strategy principles. 15 Knowledge and understanding of Supply Chain in Business Operations: to be demonstrated through a clearly presented description of the Supply chain of the product/service 30 Illustration and use of examples: to be demonstrated through clearly presented and accurate use of worked examples of the presented company/industry 20 Analysis, interpretation and solution of Business Operations and Global Economics: to be demonstrated through a clearly presented and accurate solution based on academic refrences, industrial reports 30
- 77. Presentation: your report should be well structured and written, be free of sentence construction and grammatical errors and include correctly formatted referencing. Analyses should be clearly and logically presented. 5 Module Assessment: Submission Guidelines The reflective report should be submitted electronically using the ‘Assessment’ link on Blackboard. The deadline for submission is shown at the top of this document. Feedback will be provided for the purposes of guidance and to assist your learning and development. Any reference to marks is entirely provisional and subject to confirmation following University procedures. Only University Assessment Boards are able to issue confirmed, definitive marks. The pass mark for this assessment is 40%. Resit: If you do not reach a pass mark, you will have the opportunity to resit the module assignment by ‘making good’ your original submission using the feedback given by the marker and moderator. Word limits and penalties for assignments If the assignment is within +10% of the stated word limit no penalty will apply.
- 78. The word count is to be declared on the front page of your assignment and the assignment cover sheet. If this word count is falsified, this will be regarded as academic misconduct. The word count does not include: Title and Contents page; Reference list; Appropriate tables, figures and illustrations. Please note, in-text citations [e.g. (Smith, 2011)] and direct secondary quotations [e.g. “dib-dab nonsense analysis” (Smith, 2011 p.123)] are INCLUDED in the word count. If the word limit of the full assignment exceeds the +10% limit, 10% of the mark provisionally awarded to the assignment will be deducted. For example: if the assignment is worth 70 marks but is above the word limit by more than 10%, a penalty of 7 marks will be imposed, giving a final mark of 63. Summarising and compressing the information in your assignment into the word limit is one of the skills that students are expected to acquire and demonstrate as part of the assignment process. Page 1 of 1 PAGE Page 2 of 6