Download as PDF, PPTX


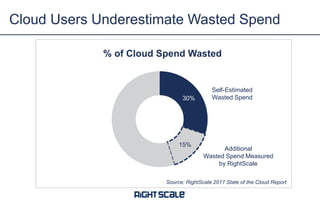
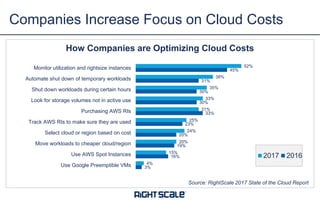
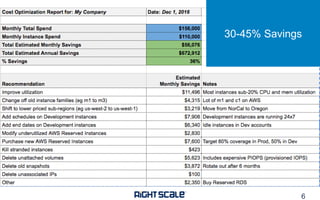
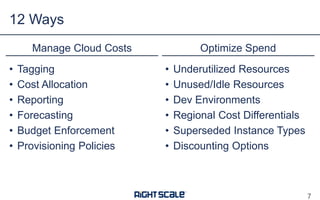

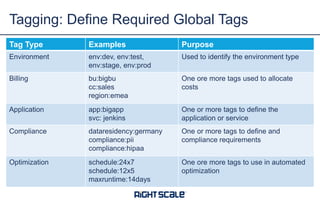
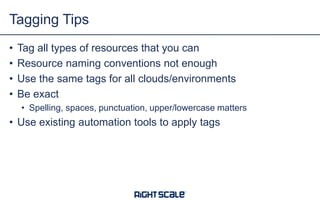


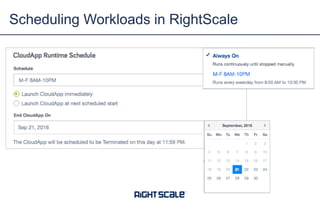

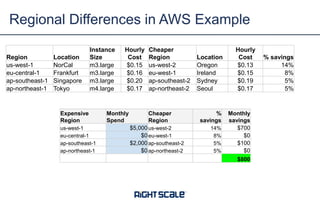
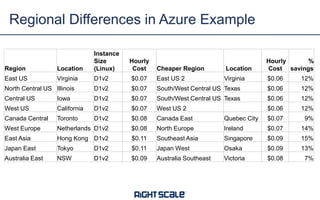

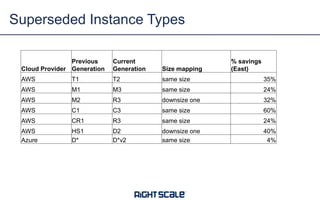


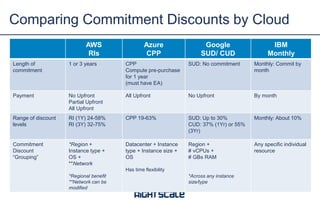
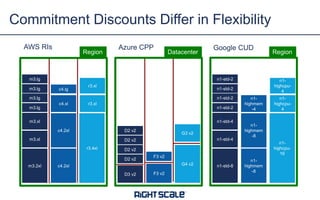

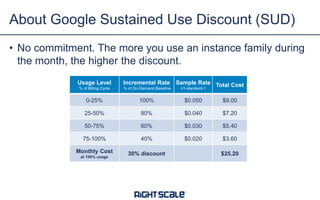
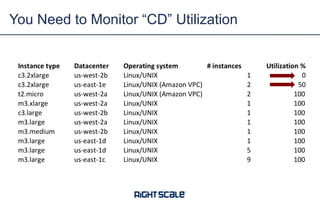

The document outlines 12 effective strategies for managing and optimizing cloud costs, highlighting issues such as wasted cloud spending and the importance of utilizing cost-saving features across cloud services. Key recommendations include using preemptible VMs, tracking resource utilization, automating workload management, and implementing tagging for better resource allocation. Additionally, the document suggests leveraging different pricing options, optimizing instance types, and monitoring cloud expenditures to achieve significant savings.


![Getting Started with Apache Spark: Big Data Made Simple [Free Meetup]](https://cdn.slidesharecdn.com/ss_thumbnails/apachesparkgettingstarted-260203175547-8361bcc3-thumbnail.jpg?width=640&height=640&fit=bounds)