Download as PDF, PPTX
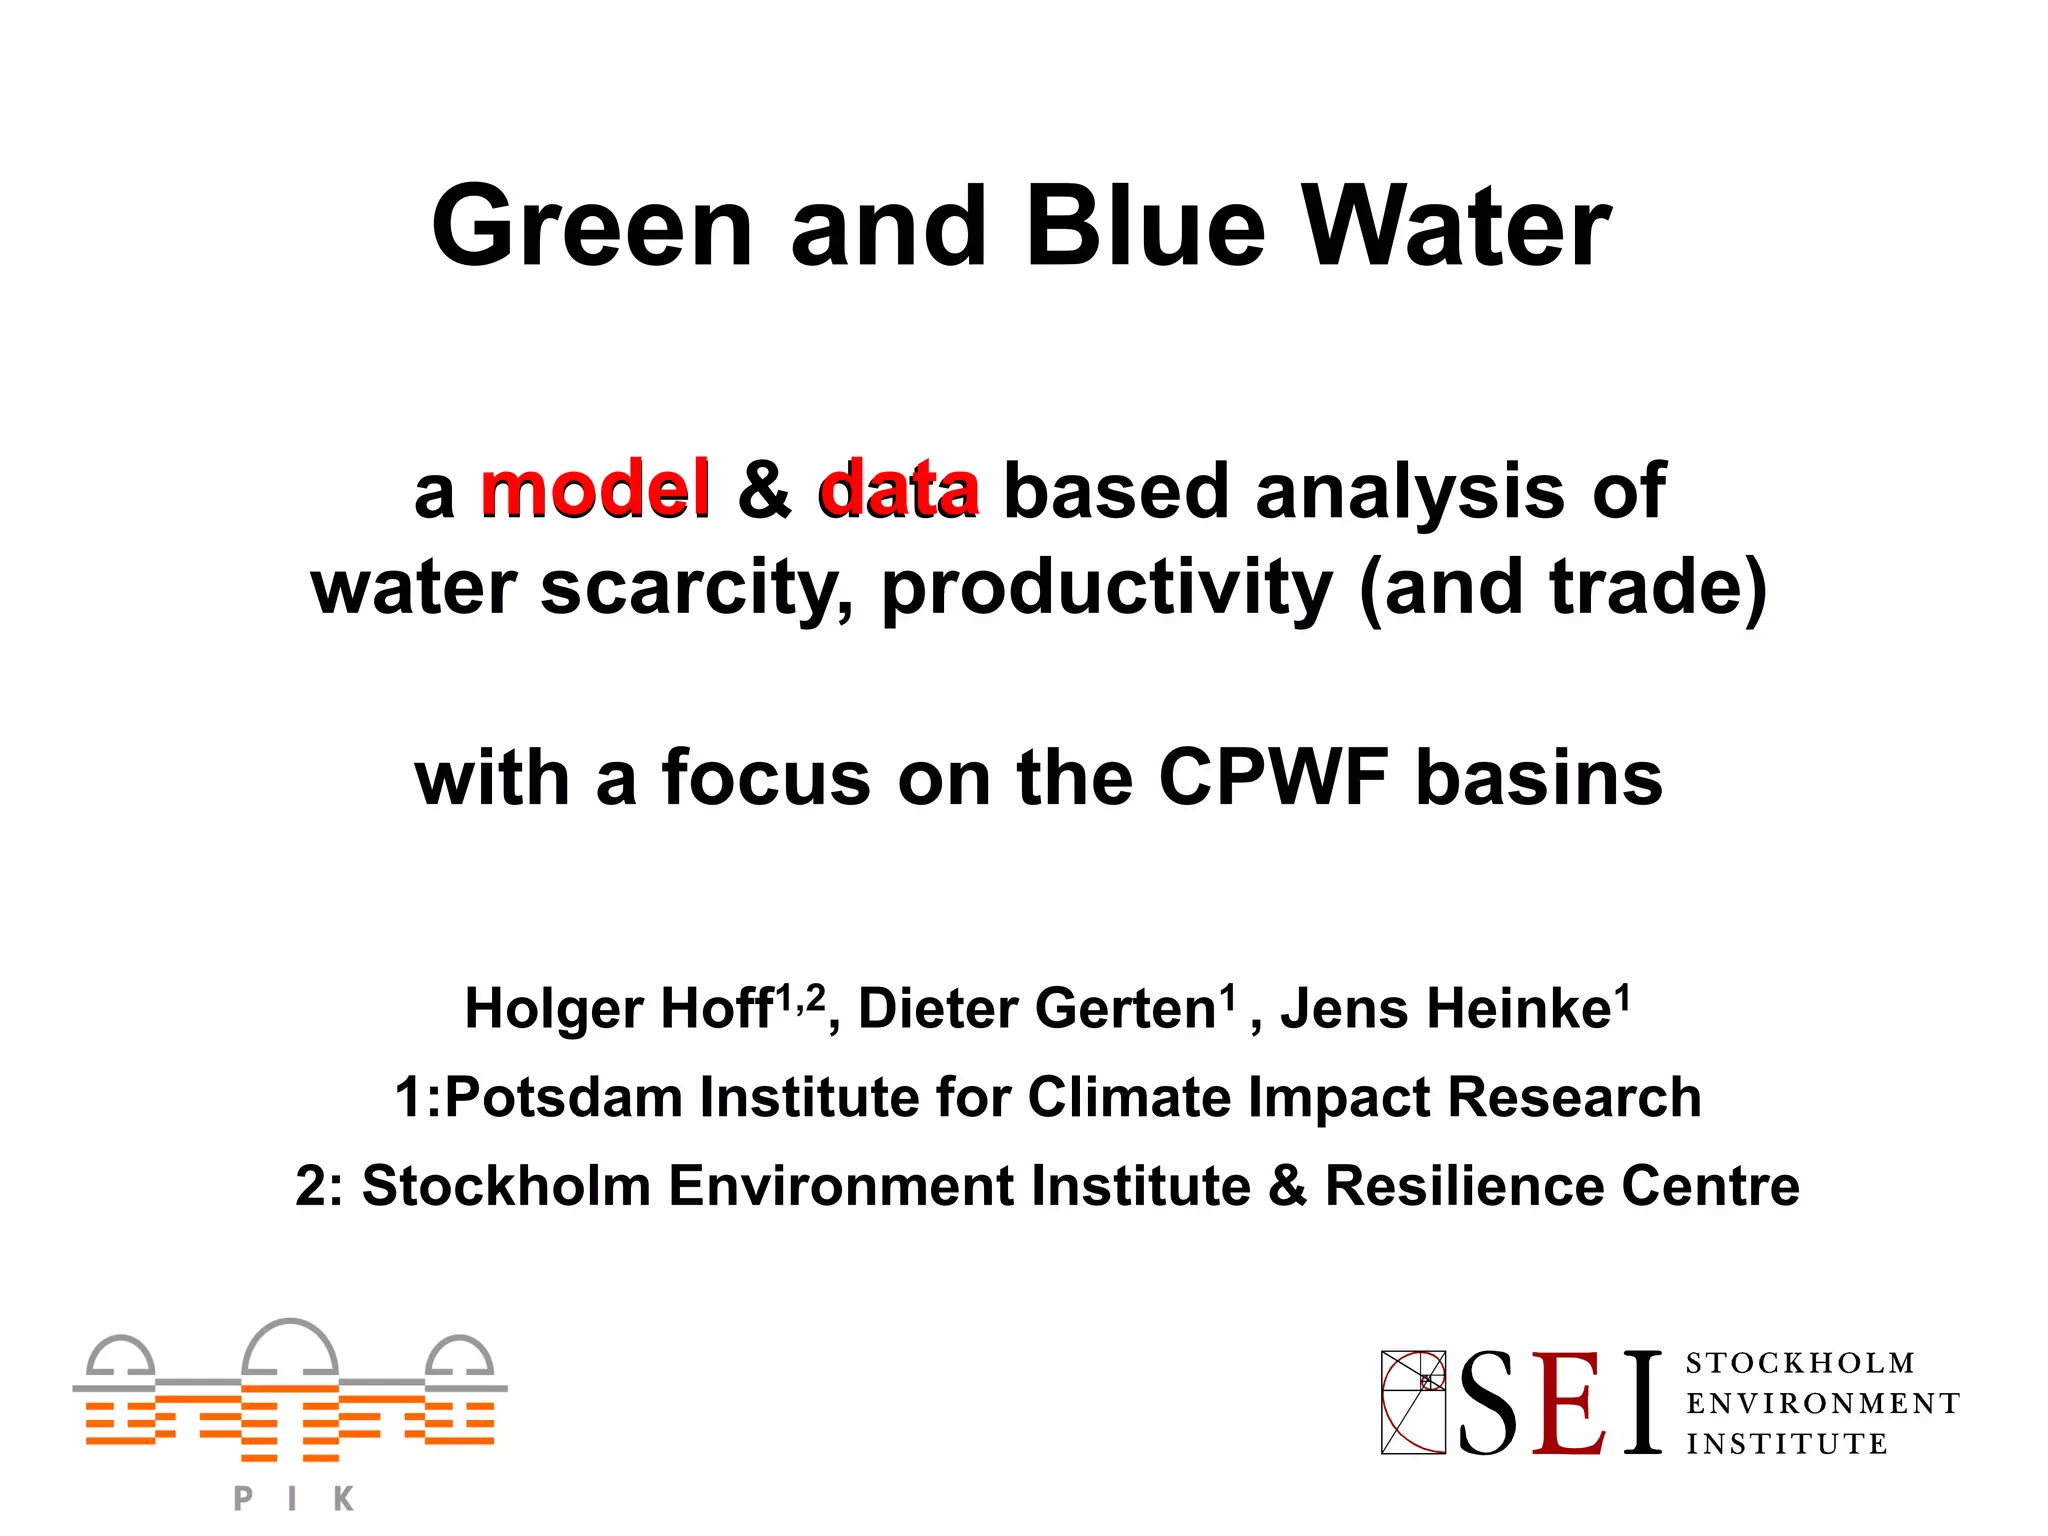
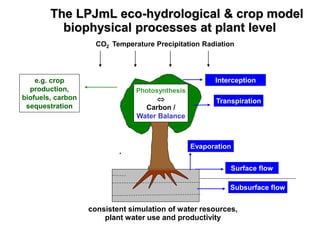
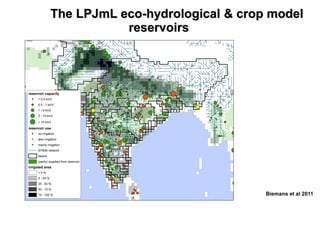
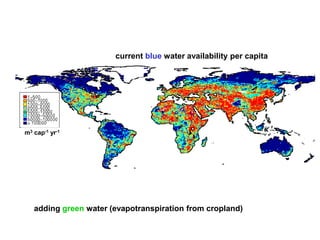
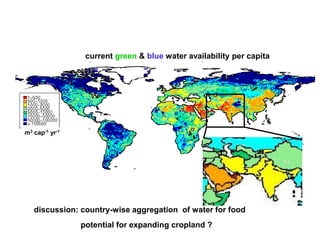
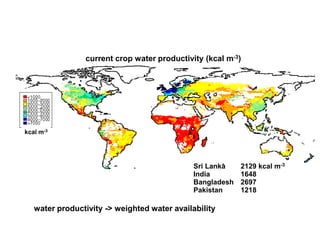
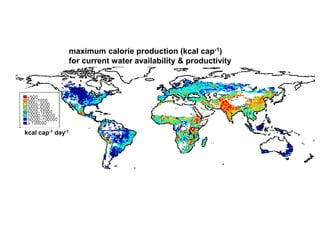
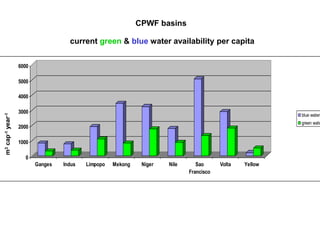
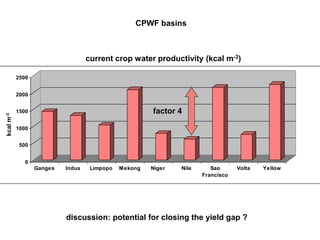
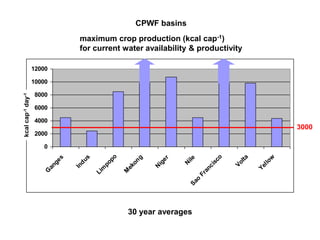
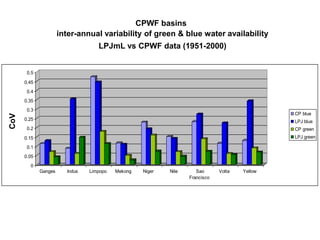
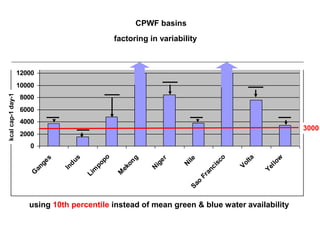
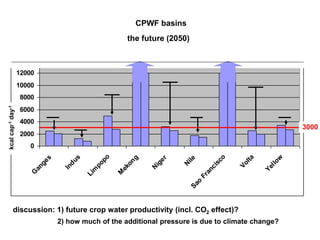
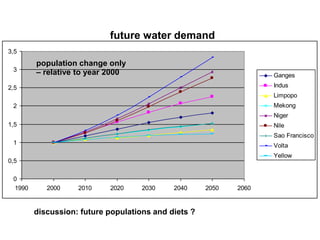
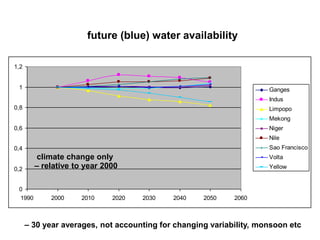
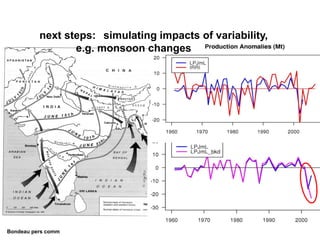
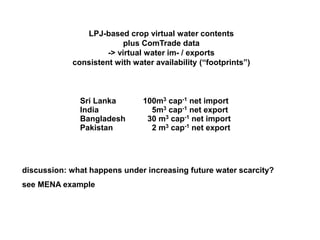
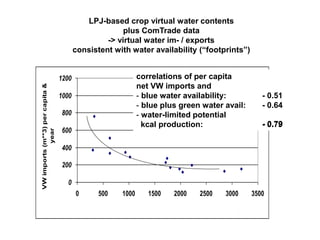
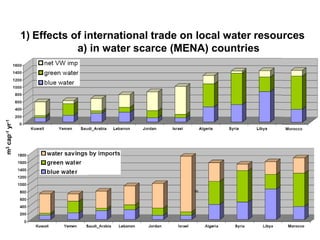

The document summarizes analyses from an eco-hydrological model (LPJmL) regarding global water scarcity and agricultural productivity. It shows: 1) Current green and blue water availability per capita in major river basins. 2) Current crop water productivity (calories produced per cubic meter of water) in countries. 3) The maximum potential crop calorie production for each river basin based on current water availability and productivity. 4) Inter-annual variability in green and blue water availability for each basin as modeled by LPJmL versus observed CPWF data.


