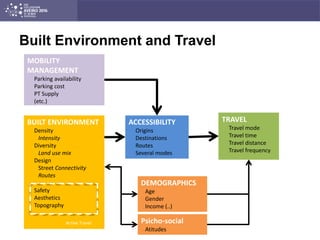
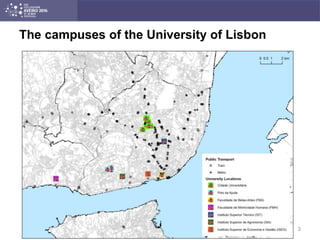
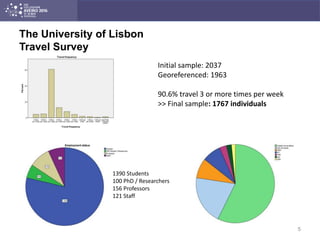
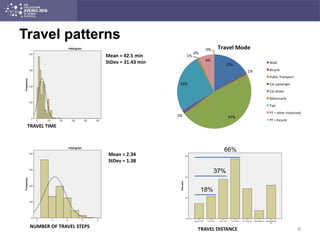
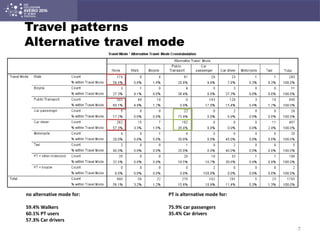
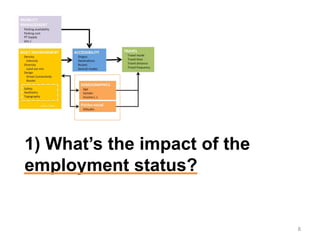
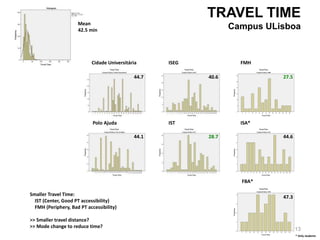
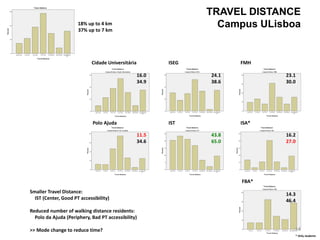
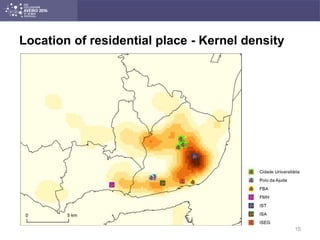
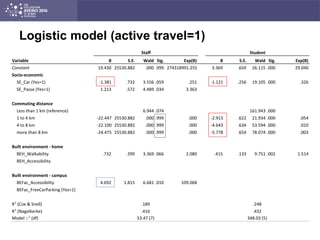
Looking at destinations to explain walking
and cycling: the case of the multiple
locations of the University of Lisbon
David S. Vale
Mauro Pereira
Cláudia M. Viana
dvale@fa.ulisboa.pt
Built Environment and Travel
BUILT ENVIRONMENT
Density
Intensity
Diversity
Land use mix
Design
Street Connectivity
Routes
Safety
Aesthetics
Topography
Active Travel
DEMOGRAPHICS
Age
Gender
Income (..)
Psicho-social
Atitudes
MOBILITY
MANAGEMENT
Parking availability
Parking cost
PT Supply
(etc.)
ACCESSIBILITY
Origins
Destinations
Routes
Several modes
TRAVEL
Travel mode
Travel time
Travel distance
Travel frequency
The campuses of the University of Lisbon
3
The campuses of the University of Lisbon
4
POLO DA AJUDA
ISEG
IST
The University of Lisbon
Travel Survey
5
Initial sample: 2037
Georeferenced: 1963
90.6% travel 3 or more times per week
>> Final sample: 1767 individuals
1390 Students
100 PhD / Researchers
156 Professors
121 Staff
Travel patterns
6
Mean = 42.5 min
StDev = 31.43 min
Mean = 2.34
StDev = 1.38
18%
37%
66%
TRAVEL TIME
NUMBER OF TRAVEL STEPS
TRAVEL DISTANCE
17%
1%
47%2%
26%
1%
0%
6%
0% Travel Mode
Walk
Bicycle
Public Transport
Car passenger
Car driver
Motorcycle
Taxi
PT + other motorized
PT + bicycle
Travel patterns
Alternative travel mode
no alternative mode for:
59.4% Walkers
60.1% PT users
57.3% Car drivers
PT is alternative mode for:
75.9% car passengers
35.4% Car drivers
7
1) What’s the impact of the
employment status?
8
TRAVEL TIME
Employment Status
Student
45.3 min
Professor
26.2 min
PhD / Researcher
34.2 min
Staff
38.9 min
Mean
42.5 min
9
Student
18% Walk
54% PT
Professor
9% Walk
81.4% Car driver
PhD / Researcher
16% Walk
41% PT
31% Car driver
Staff
10% Walk
34% PT
46% Car driver
TRAVEL MODE
Employment Status
Student Phd / Researcher
Professor Staff
17%
1%
47%2%
26%
1%
0%
6%
0% Travel Mode
Walk
Bicycle
Public Transport
Car passenger
Car driver
Motorcycle
Taxi
PT + other motorized
PT + bicycle
10
TRAVEL DISTANCE
Employment Status
Professor
20% up to 4 km
44% up to 7 km
PhD / Researcher
23% up to 4 km
54% up to 7 km
Staff
9% up to 4 km
30% up to 7 km
Student
18% up to 4 km
36% up to 7 km
18% up to 4 km
37% up to 7 km
11
2) What’s the impact of the
location of the campus?
12
Cidade Universitária ISEG FMH
Polo Ajuda IST ISA*
FBA*
* Only students
TRAVEL TIME
Campus ULisboaMean
42.5 min
13
44.7
44.1
40.6
28.7
27.5
44.6
47.3
Smaller Travel Time:
IST (Center, Good PT accessibility)
FMH (Periphery, Bad PT accessibility)
>> Smaller travel distance?
>> Mode change to reduce time?
TRAVEL DISTANCE
Campus ULisboa
Cidade Universitária ISEG FMH
Polo Ajuda IST ISA*
FBA*
* Only students
18% up to 4 km
37% up to 7 km
14
16.0
34.9
11.5
34.6
24.1
38.6
43.8
65.0
23.1
30.0
16.2
27.0
14.3
46.4
Smaller Travel Distance:
IST (Center, Good PT accessibility)
Reduced number of walking distance residents:
Polo da Ajuda (Periphery, Bad PT accessibility)
>> Mode change to reduce time?
Location of residential place - Kernel density
15
Cidade Universitária ISEG FMH
Polo Ajuda IST ISA*
FBA*
* Only students
Location of residential place
Kernel density
By different campuses
16
TRAVEL MODE
Campus ULisboa
Cidade Universitária ISEG
FMH
Polo da Ajuda IST
ISA*
FBA*
* Only students
17%
1%
47%2%
26%
1%
0%
6%
0% Travel Mode
Walk
Bicycle
Public Transport
Car passenger
Car driver
Motorcycle
Taxi
PT + other motorized
PT + bicycle
More car drivers:
Polo da Ajuda + FMH
More walkers:
IST + ISEG
More PT users:
FBA
17
3) What explains active travel
commuting?
Logistic model (Active Travel = 1)
5 campuses only (staff and student data: 1474 sample)
18
Independent Variables
BUILT ENVIRONMENT (6)
Density:
Number of dwellings
Number of residents
Diversity:
Number of POI
Variety of POI types
Design
Pedestrian shed ratio
Average Link Length
FCA500metersnetwork
ACCESSIBILITY (4)
Has Metro < 500 m (01)
Has Train < 800 m (01)
Number of Stops
FCA example
19
Walkability Index
(z-score)
Accessibility index
(0-1 normalization)
Free Parking
(dummy)
only for campus
SOCIO-ECONOMIC (9)
Gender
Age (5 classes)
Household size
Number of years @Ulisboa
Has a car (dummy)
Has Drivers license (dummy)
Buys PT monthly ticket (dummy)
Has PT card (dummy)
Variable B S.E. Wald Sig. Exp(B) B S.E. Wald Sig. Exp(B)
Constant 19.430 25530.882 .000 .999 274318991.255 3.369 .659 26.115 .000 29.040
Socio-economic
SE_Car (Yes=1) -1.381 .732 3.556 .059 .251 -1.121 .256 19.105 .000 .326
SE_Passe (Yes=1) 1.213 .572 4.489 .034 3.363
Commuting distance
Less than 1 km (reference) 6.944 .074 161.943 .000
1 to 4 km -22.447 25530.882 .000 .999 .000 -2.913 .622 21.934 .000 .054
4 to 8 km -22.100 25530.882 .000 .999 .000 -4.643 .634 53.594 .000 .010
more than 8 km -24.475 25530.882 .000 .999 .000 -5.778 .654 78.074 .000 .003
Built environment - home
BEH_Walkability .732 .399 3.369 .066 2.080 .415 .133 9.751 .002 1.514
BEH_Accessibility
Built environment - campus
BEFac_Accessibility 4.692 1.815 6.681 .010 109.068
BEFac_FreeCarParking (Yes=1)
R2
(Cox & Snell) .189 .248
R2
(Nagelkerke) .416 .432
Model c2
(df) 53.47 (7) 348.03 (5)
Staff Student
Logistic model (active travel=1)
Final remarks
• Staff and students: different travel patterns
– specific policies for different groups
– small bicycle commuting overall
• Staff: increase multimodal accessibility of campuses
– Reveal possibility of choice
• Students: decrease travel distance
– Struggling with travel time, consequence of poor multimodal accessibility
• Carrots and sticks package of tools required
– Transform campuses into TODs, increasing their multimodal
accessibility and integration in the city
– Provision of student accommodation near campuses

1.2. david vale

  • 1.
    Looking at destinationsto explain walking and cycling: the case of the multiple locations of the University of Lisbon David S. Vale Mauro Pereira Cláudia M. Viana dvale@fa.ulisboa.pt
  • 2.
    Built Environment andTravel BUILT ENVIRONMENT Density Intensity Diversity Land use mix Design Street Connectivity Routes Safety Aesthetics Topography Active Travel DEMOGRAPHICS Age Gender Income (..) Psicho-social Atitudes MOBILITY MANAGEMENT Parking availability Parking cost PT Supply (etc.) ACCESSIBILITY Origins Destinations Routes Several modes TRAVEL Travel mode Travel time Travel distance Travel frequency
  • 3.
    The campuses ofthe University of Lisbon 3
  • 4.
    The campuses ofthe University of Lisbon 4 POLO DA AJUDA ISEG IST
  • 5.
    The University ofLisbon Travel Survey 5 Initial sample: 2037 Georeferenced: 1963 90.6% travel 3 or more times per week >> Final sample: 1767 individuals 1390 Students 100 PhD / Researchers 156 Professors 121 Staff
  • 6.
    Travel patterns 6 Mean =42.5 min StDev = 31.43 min Mean = 2.34 StDev = 1.38 18% 37% 66% TRAVEL TIME NUMBER OF TRAVEL STEPS TRAVEL DISTANCE 17% 1% 47%2% 26% 1% 0% 6% 0% Travel Mode Walk Bicycle Public Transport Car passenger Car driver Motorcycle Taxi PT + other motorized PT + bicycle
  • 7.
    Travel patterns Alternative travelmode no alternative mode for: 59.4% Walkers 60.1% PT users 57.3% Car drivers PT is alternative mode for: 75.9% car passengers 35.4% Car drivers 7
  • 8.
    1) What’s theimpact of the employment status? 8
  • 9.
    TRAVEL TIME Employment Status Student 45.3min Professor 26.2 min PhD / Researcher 34.2 min Staff 38.9 min Mean 42.5 min 9
  • 10.
    Student 18% Walk 54% PT Professor 9%Walk 81.4% Car driver PhD / Researcher 16% Walk 41% PT 31% Car driver Staff 10% Walk 34% PT 46% Car driver TRAVEL MODE Employment Status Student Phd / Researcher Professor Staff 17% 1% 47%2% 26% 1% 0% 6% 0% Travel Mode Walk Bicycle Public Transport Car passenger Car driver Motorcycle Taxi PT + other motorized PT + bicycle 10
  • 11.
    TRAVEL DISTANCE Employment Status Professor 20%up to 4 km 44% up to 7 km PhD / Researcher 23% up to 4 km 54% up to 7 km Staff 9% up to 4 km 30% up to 7 km Student 18% up to 4 km 36% up to 7 km 18% up to 4 km 37% up to 7 km 11
  • 12.
    2) What’s theimpact of the location of the campus? 12
  • 13.
    Cidade Universitária ISEGFMH Polo Ajuda IST ISA* FBA* * Only students TRAVEL TIME Campus ULisboaMean 42.5 min 13 44.7 44.1 40.6 28.7 27.5 44.6 47.3 Smaller Travel Time: IST (Center, Good PT accessibility) FMH (Periphery, Bad PT accessibility) >> Smaller travel distance? >> Mode change to reduce time?
  • 14.
    TRAVEL DISTANCE Campus ULisboa CidadeUniversitária ISEG FMH Polo Ajuda IST ISA* FBA* * Only students 18% up to 4 km 37% up to 7 km 14 16.0 34.9 11.5 34.6 24.1 38.6 43.8 65.0 23.1 30.0 16.2 27.0 14.3 46.4 Smaller Travel Distance: IST (Center, Good PT accessibility) Reduced number of walking distance residents: Polo da Ajuda (Periphery, Bad PT accessibility) >> Mode change to reduce time?
  • 15.
    Location of residentialplace - Kernel density 15
  • 16.
    Cidade Universitária ISEGFMH Polo Ajuda IST ISA* FBA* * Only students Location of residential place Kernel density By different campuses 16
  • 17.
    TRAVEL MODE Campus ULisboa CidadeUniversitária ISEG FMH Polo da Ajuda IST ISA* FBA* * Only students 17% 1% 47%2% 26% 1% 0% 6% 0% Travel Mode Walk Bicycle Public Transport Car passenger Car driver Motorcycle Taxi PT + other motorized PT + bicycle More car drivers: Polo da Ajuda + FMH More walkers: IST + ISEG More PT users: FBA 17
  • 18.
    3) What explainsactive travel commuting? Logistic model (Active Travel = 1) 5 campuses only (staff and student data: 1474 sample) 18
  • 19.
    Independent Variables BUILT ENVIRONMENT(6) Density: Number of dwellings Number of residents Diversity: Number of POI Variety of POI types Design Pedestrian shed ratio Average Link Length FCA500metersnetwork ACCESSIBILITY (4) Has Metro < 500 m (01) Has Train < 800 m (01) Number of Stops FCA example 19 Walkability Index (z-score) Accessibility index (0-1 normalization) Free Parking (dummy) only for campus SOCIO-ECONOMIC (9) Gender Age (5 classes) Household size Number of years @Ulisboa Has a car (dummy) Has Drivers license (dummy) Buys PT monthly ticket (dummy) Has PT card (dummy)
  • 20.
    Variable B S.E.Wald Sig. Exp(B) B S.E. Wald Sig. Exp(B) Constant 19.430 25530.882 .000 .999 274318991.255 3.369 .659 26.115 .000 29.040 Socio-economic SE_Car (Yes=1) -1.381 .732 3.556 .059 .251 -1.121 .256 19.105 .000 .326 SE_Passe (Yes=1) 1.213 .572 4.489 .034 3.363 Commuting distance Less than 1 km (reference) 6.944 .074 161.943 .000 1 to 4 km -22.447 25530.882 .000 .999 .000 -2.913 .622 21.934 .000 .054 4 to 8 km -22.100 25530.882 .000 .999 .000 -4.643 .634 53.594 .000 .010 more than 8 km -24.475 25530.882 .000 .999 .000 -5.778 .654 78.074 .000 .003 Built environment - home BEH_Walkability .732 .399 3.369 .066 2.080 .415 .133 9.751 .002 1.514 BEH_Accessibility Built environment - campus BEFac_Accessibility 4.692 1.815 6.681 .010 109.068 BEFac_FreeCarParking (Yes=1) R2 (Cox & Snell) .189 .248 R2 (Nagelkerke) .416 .432 Model c2 (df) 53.47 (7) 348.03 (5) Staff Student Logistic model (active travel=1)
  • 21.
    Final remarks • Staffand students: different travel patterns – specific policies for different groups – small bicycle commuting overall • Staff: increase multimodal accessibility of campuses – Reveal possibility of choice • Students: decrease travel distance – Struggling with travel time, consequence of poor multimodal accessibility • Carrots and sticks package of tools required – Transform campuses into TODs, increasing their multimodal accessibility and integration in the city – Provision of student accommodation near campuses