Download to read offline


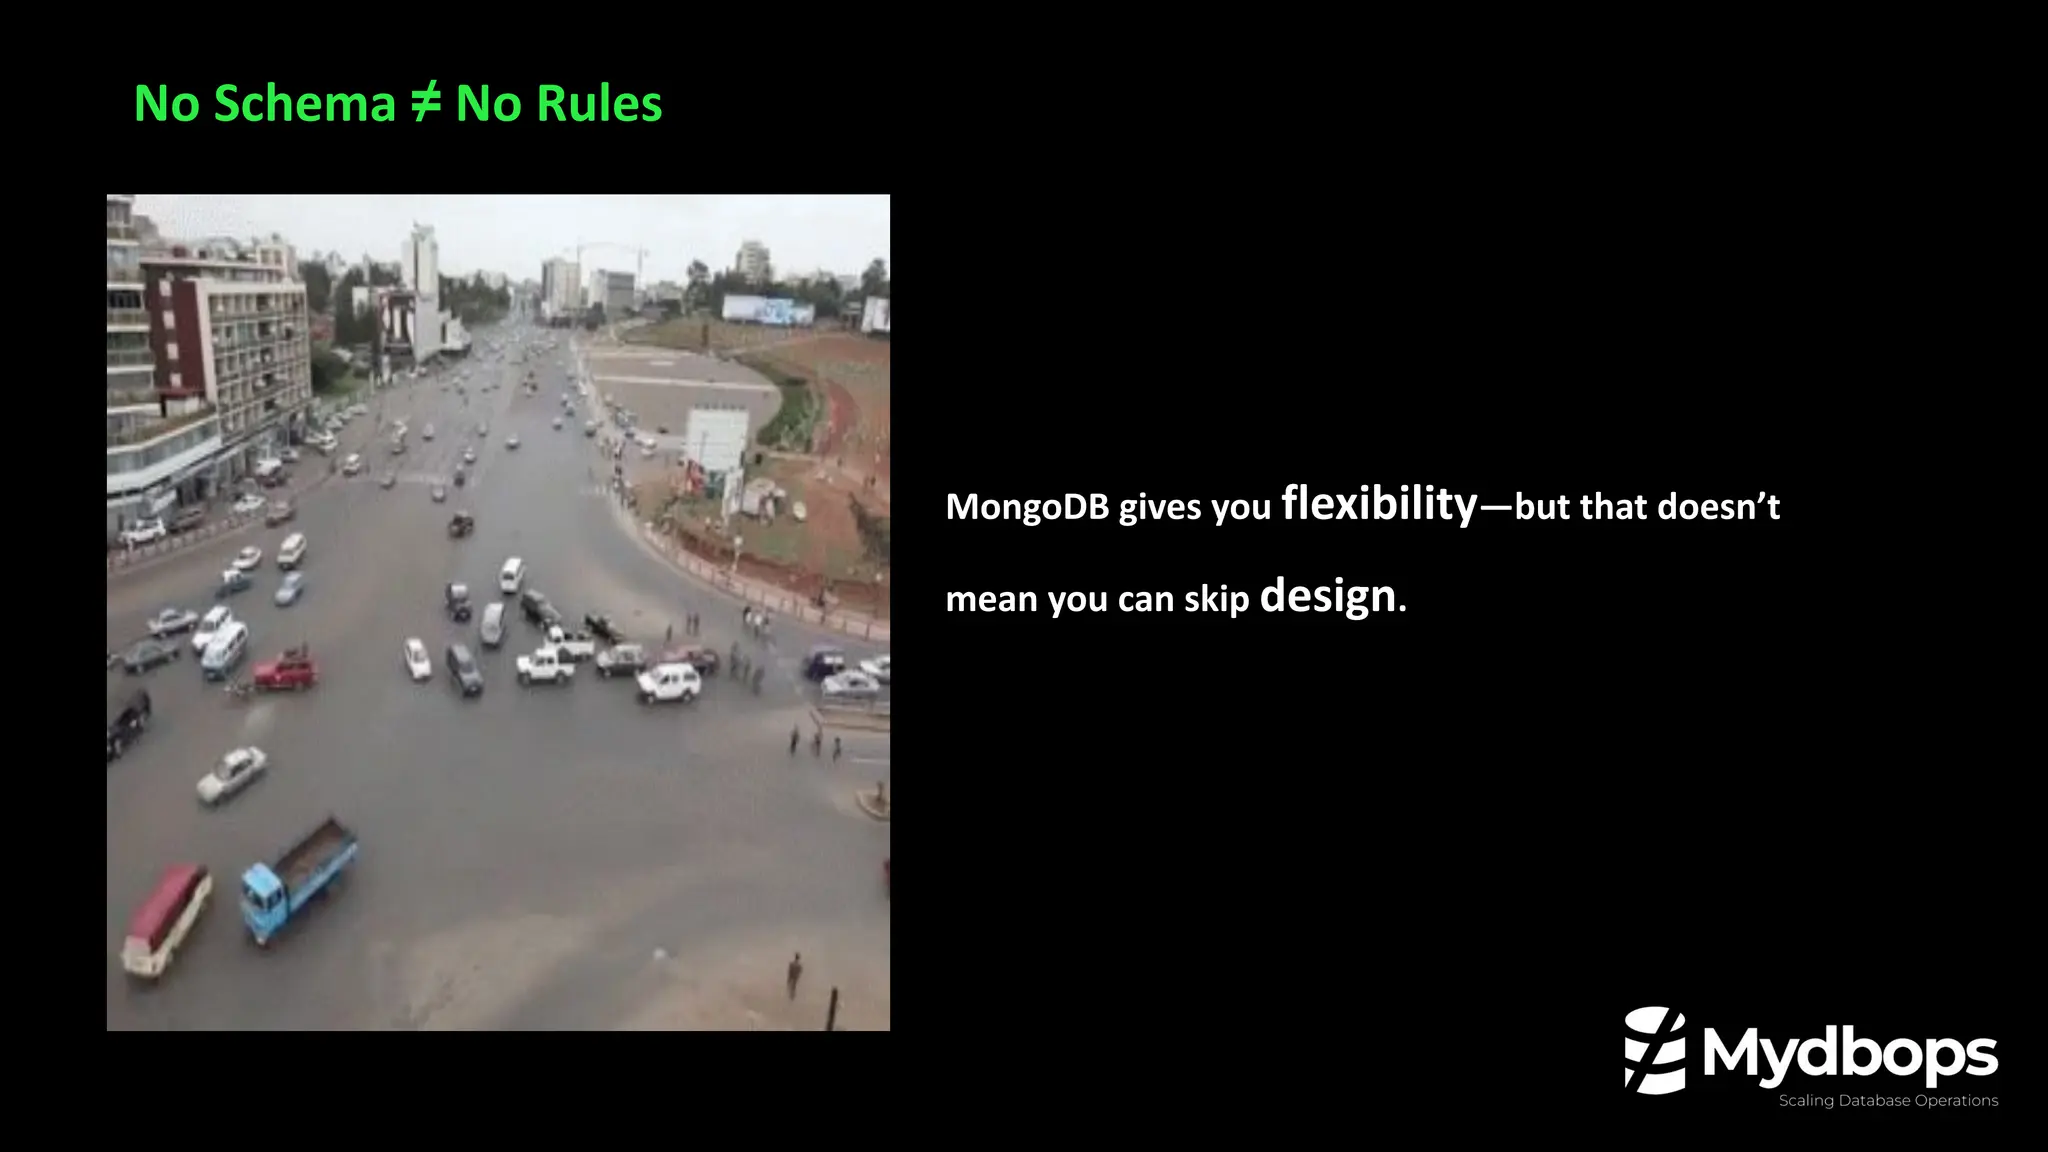
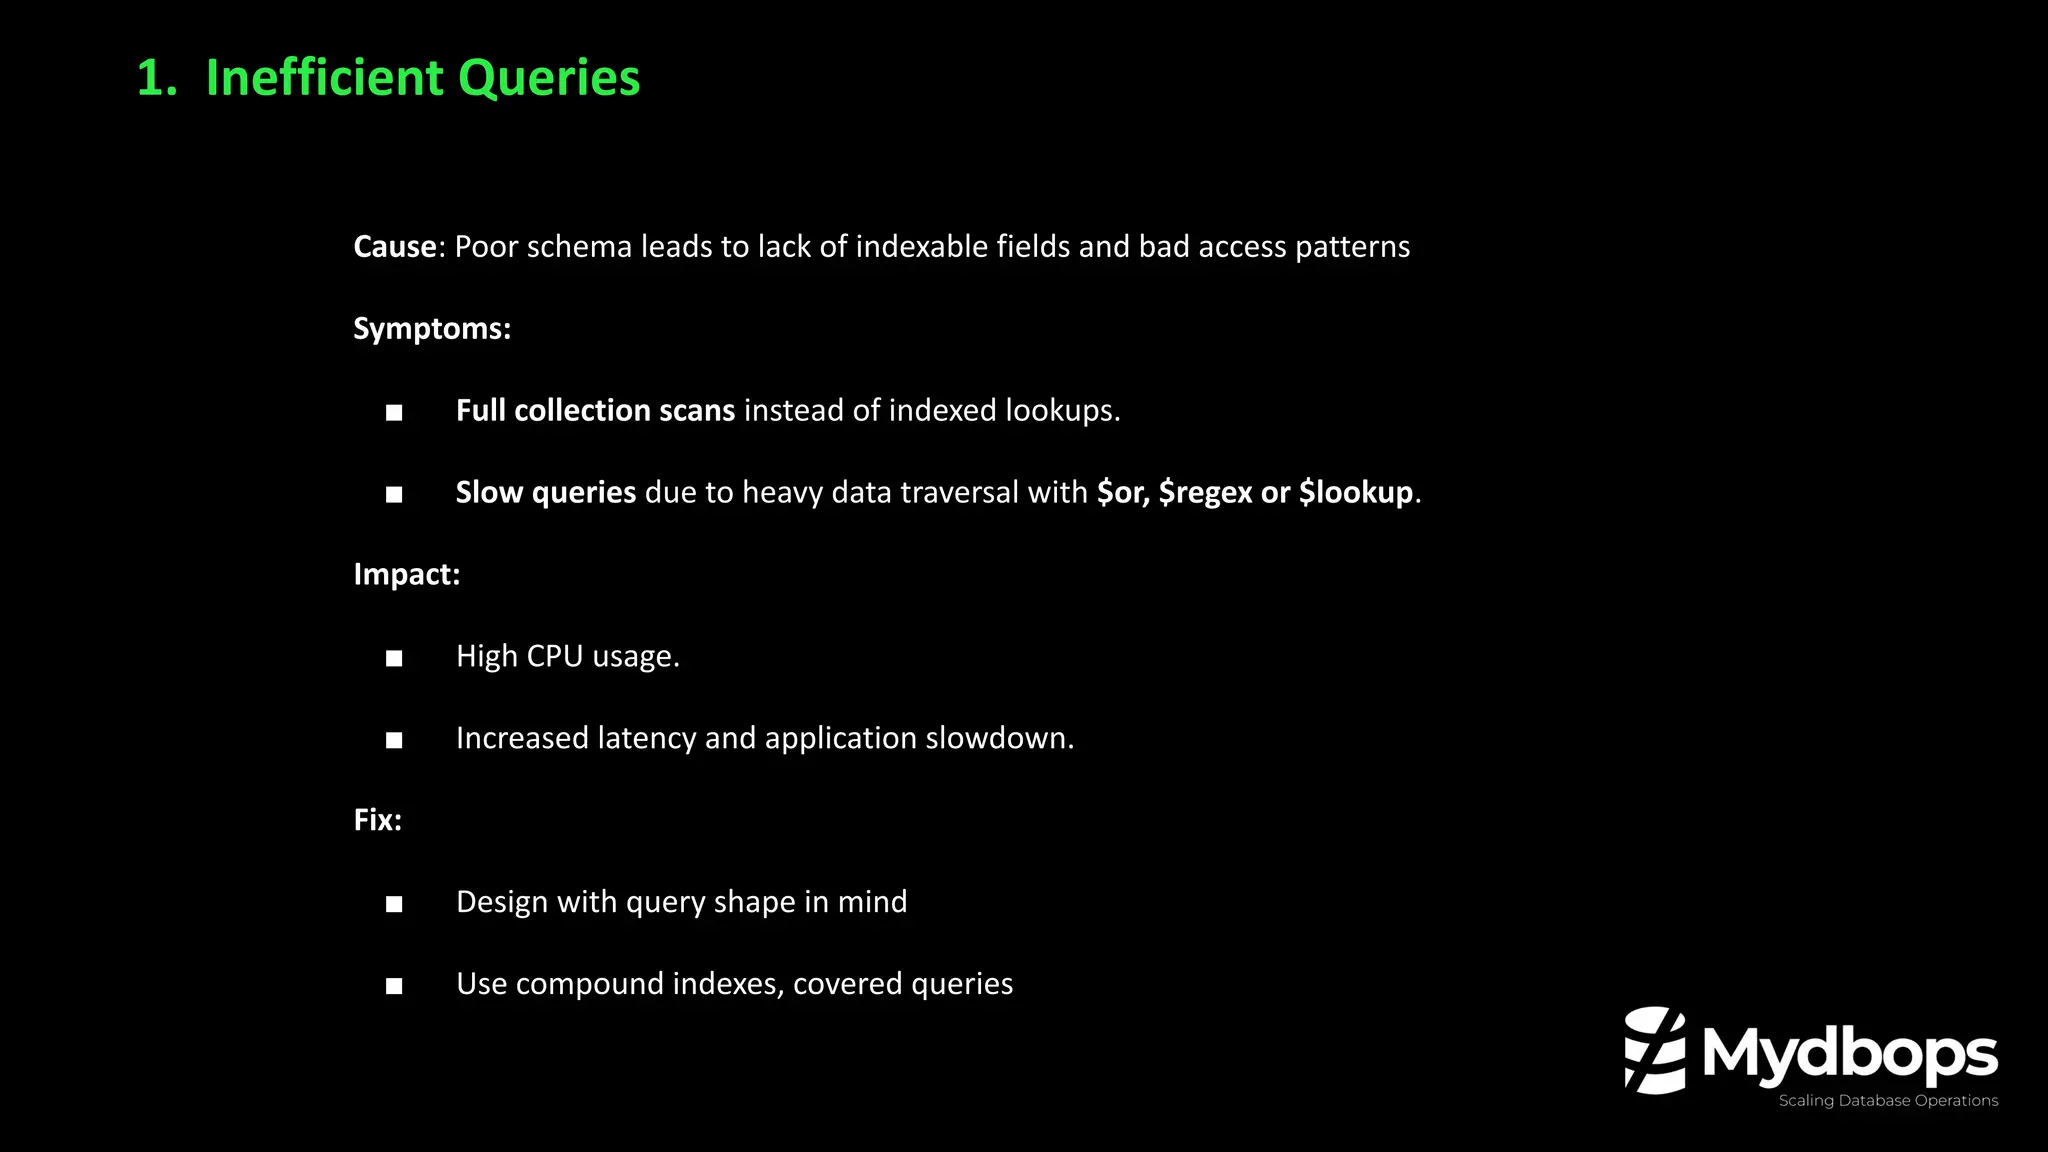
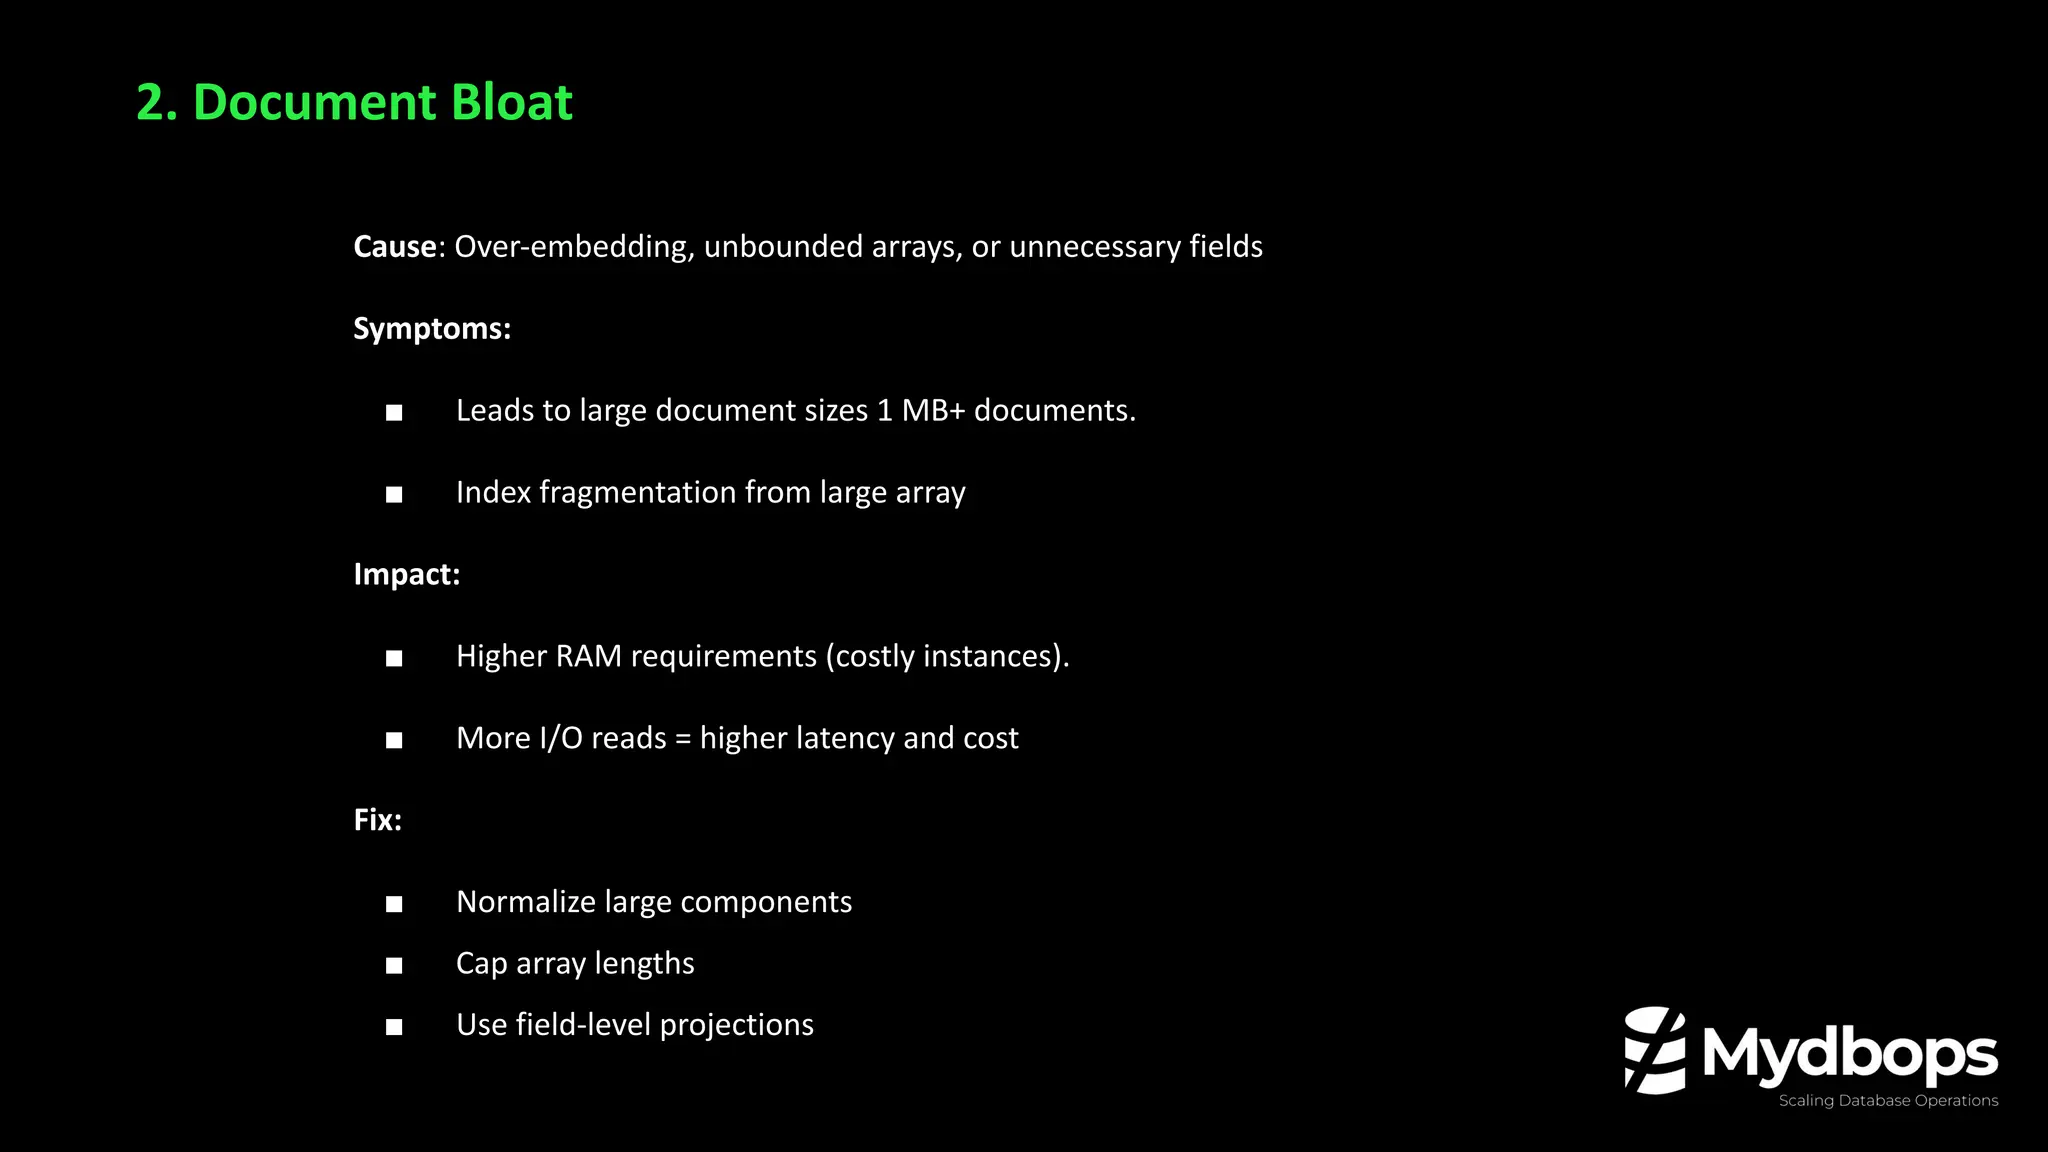
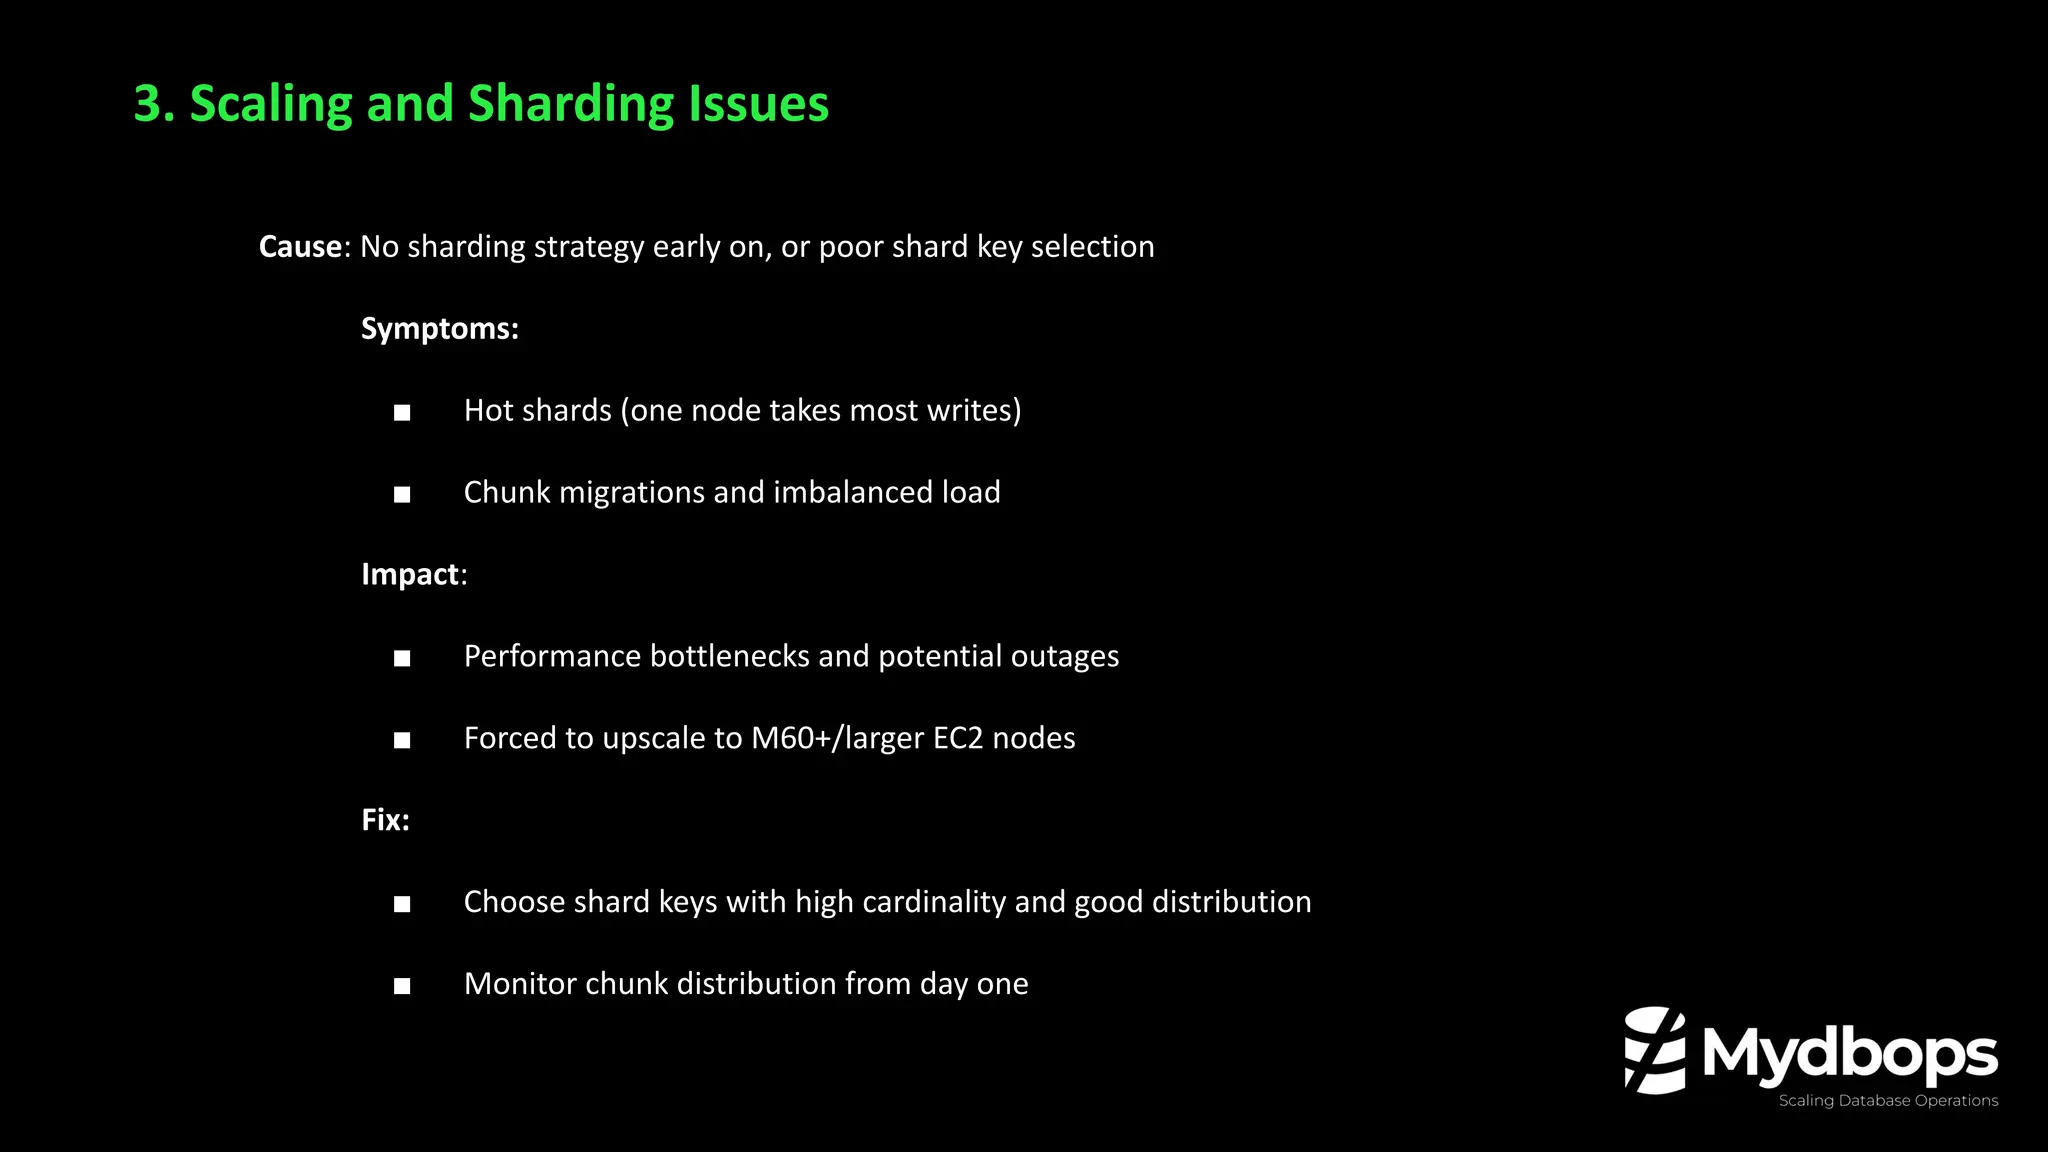
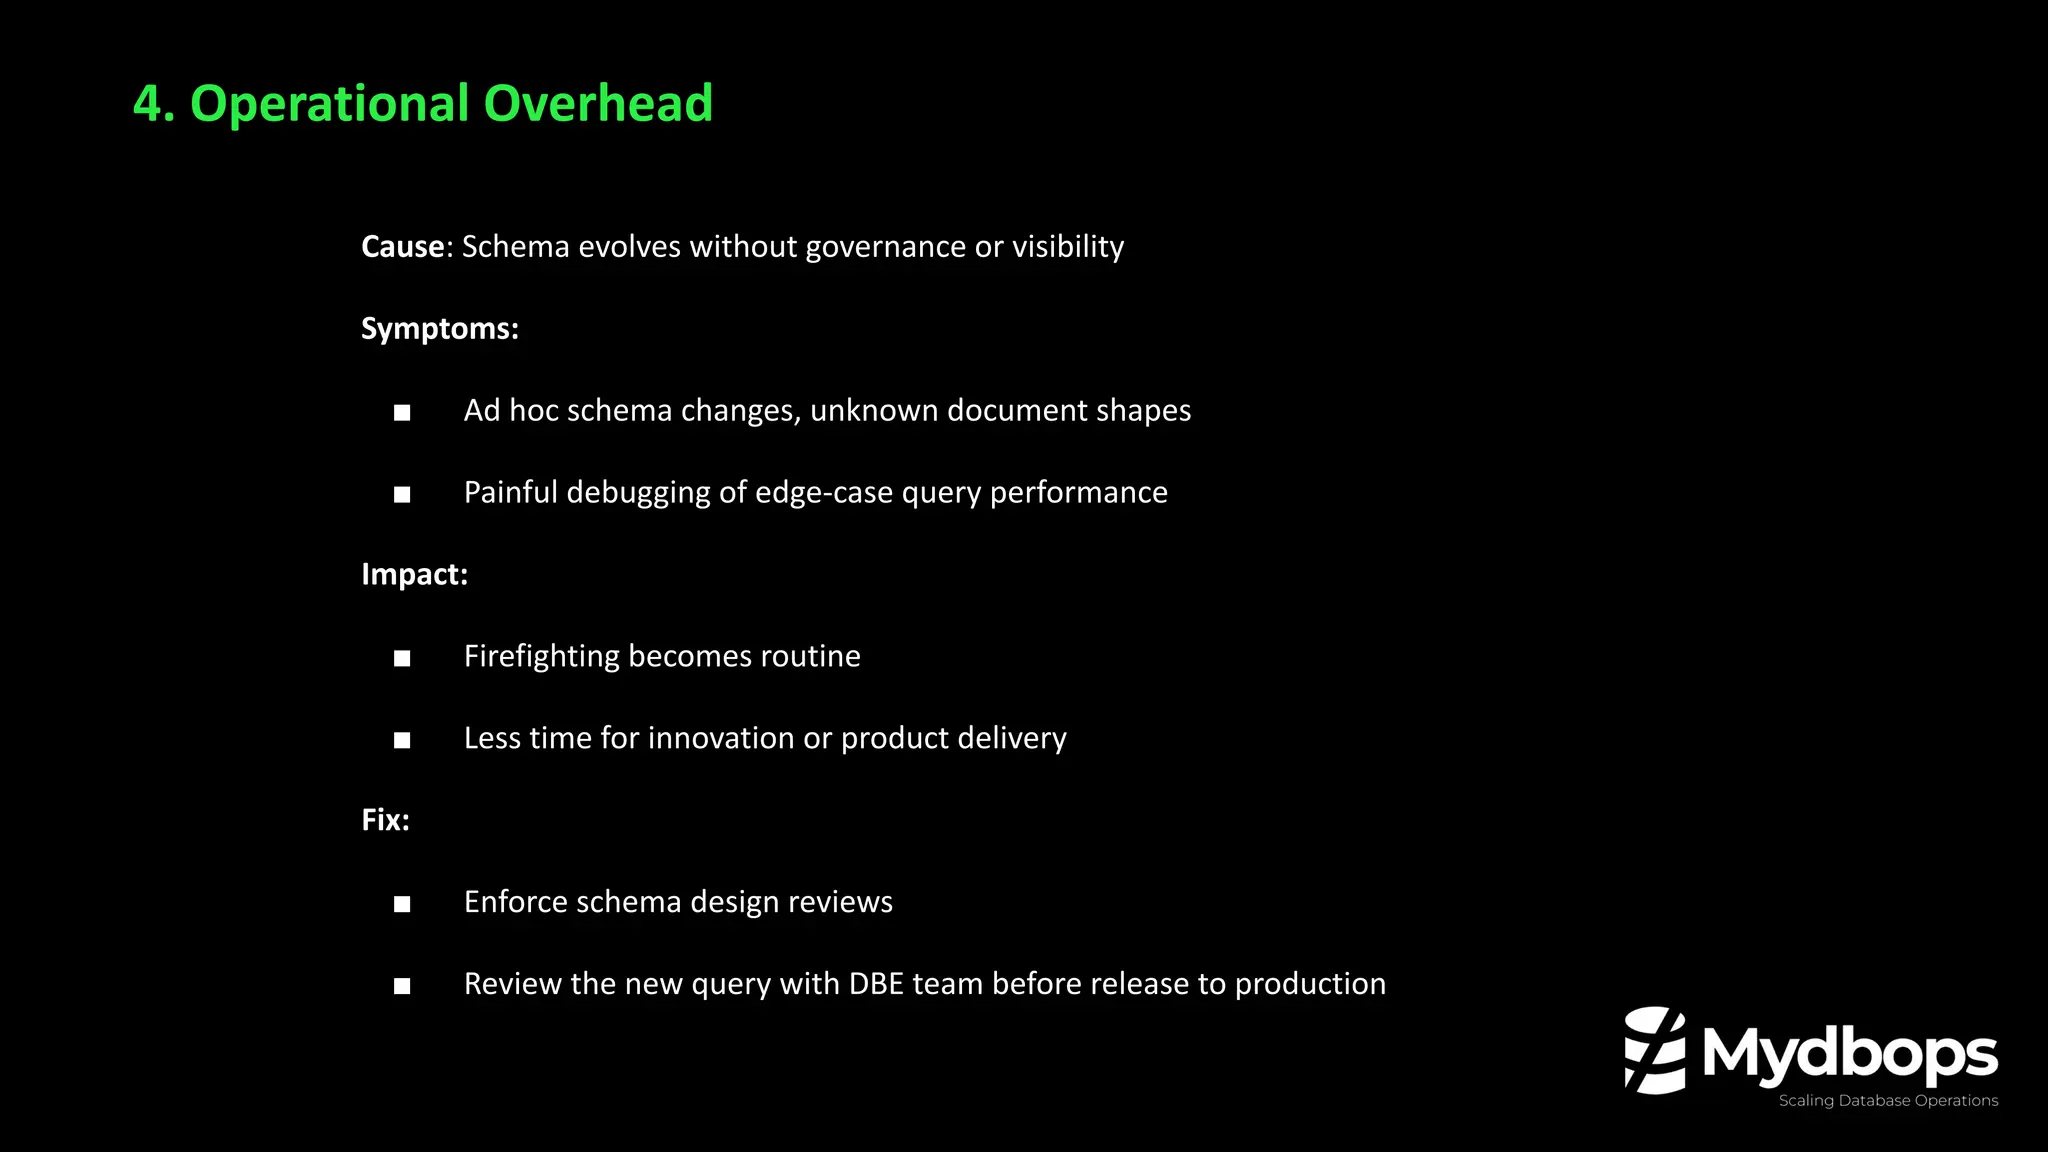
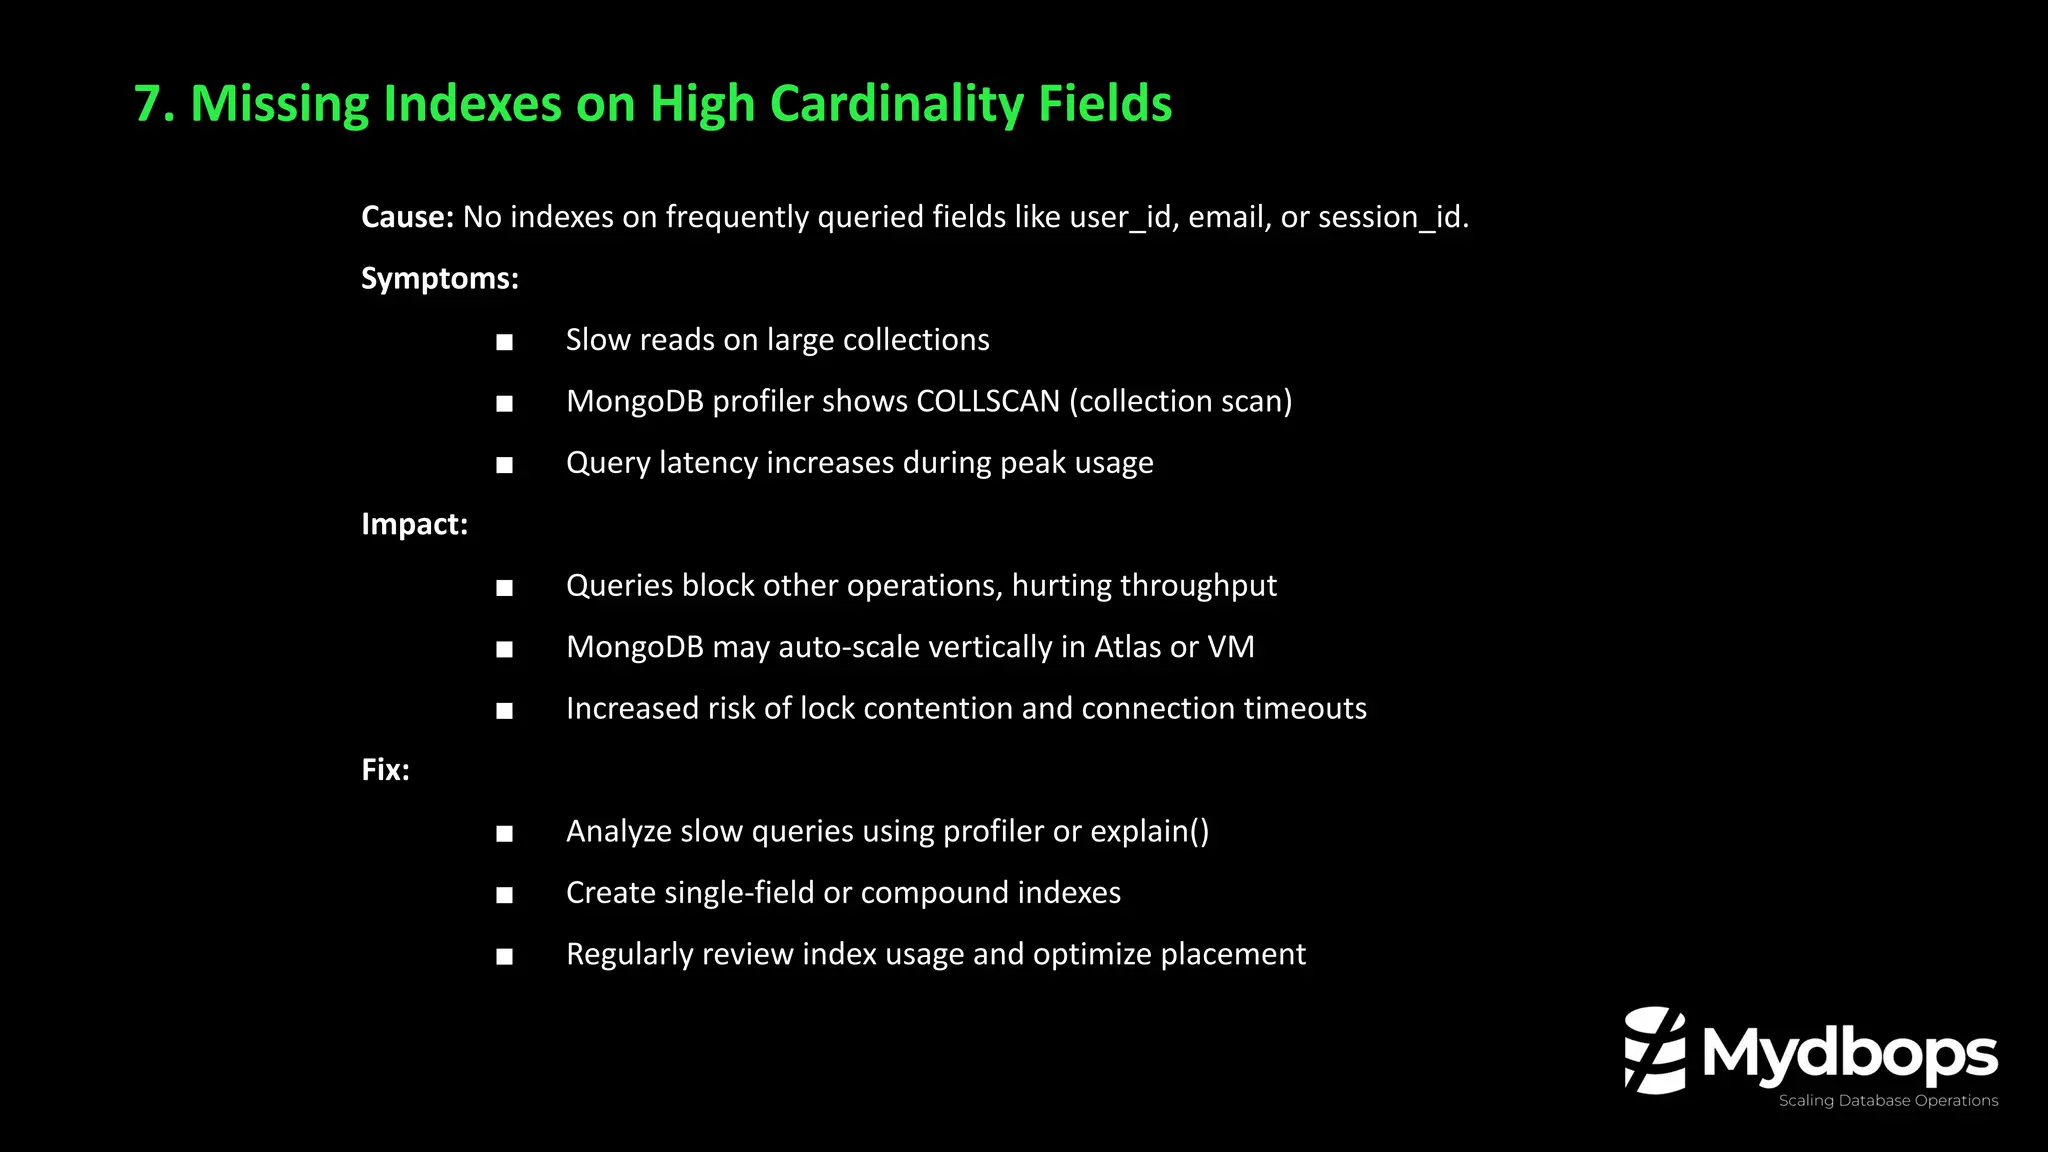
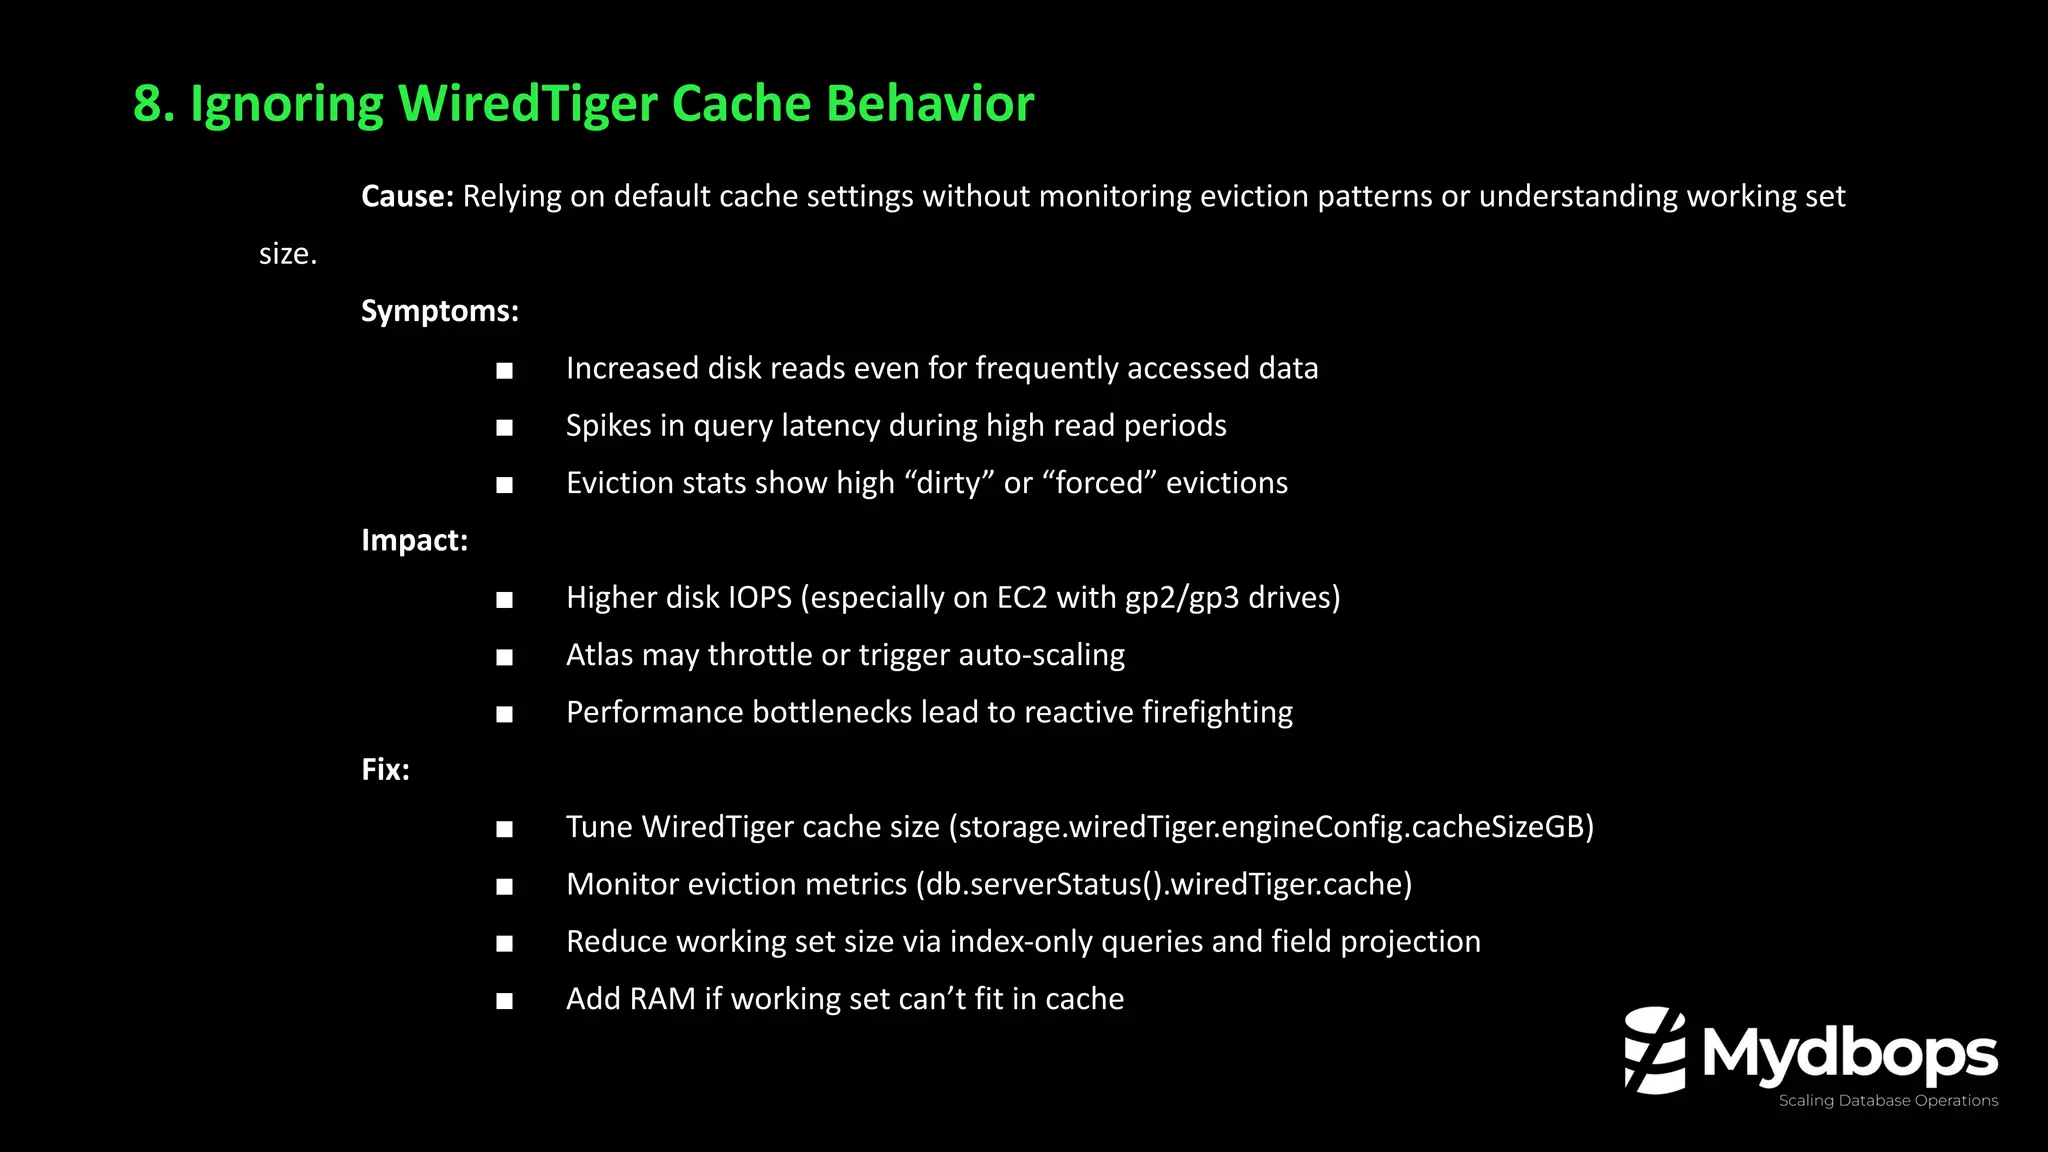
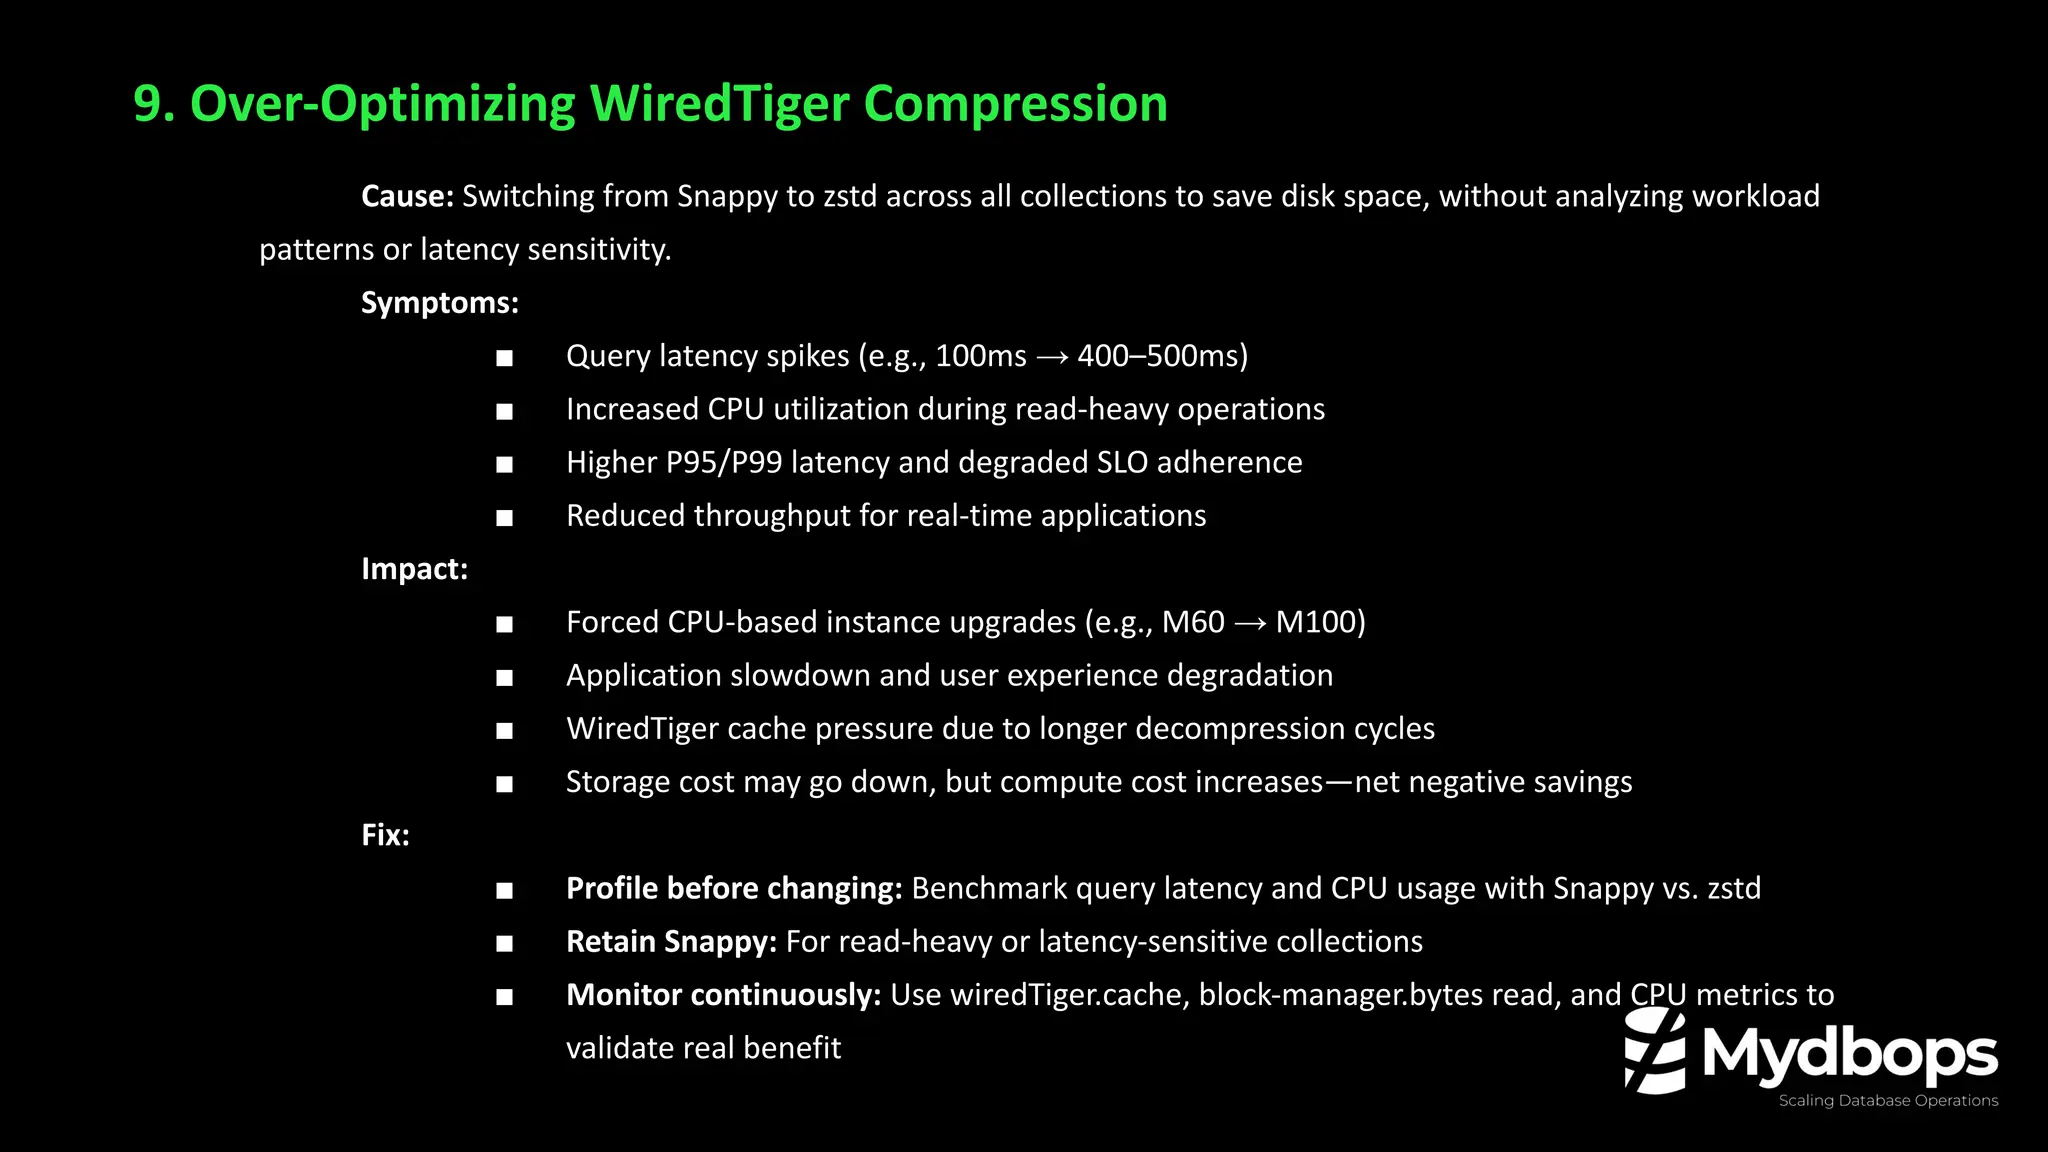
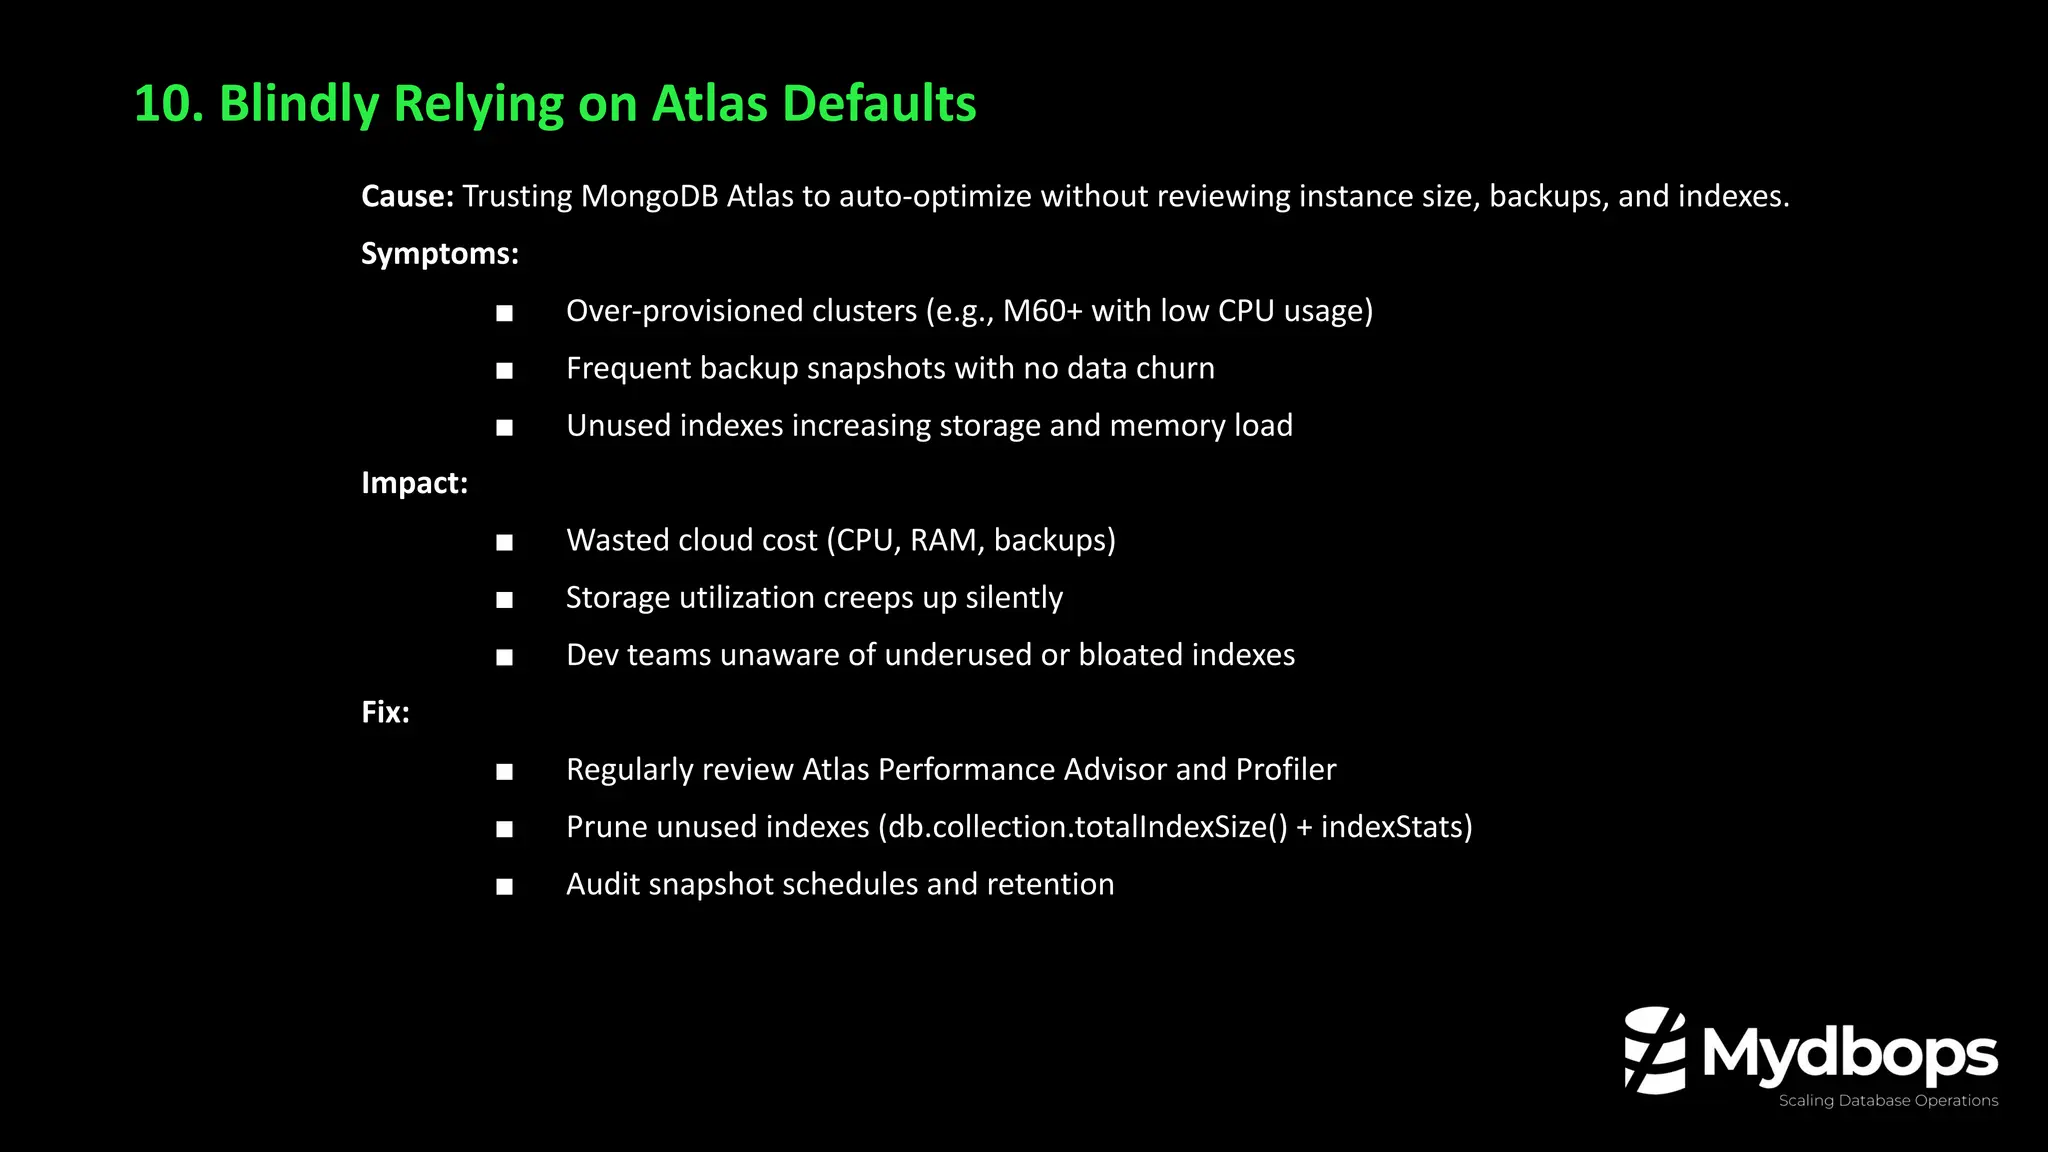

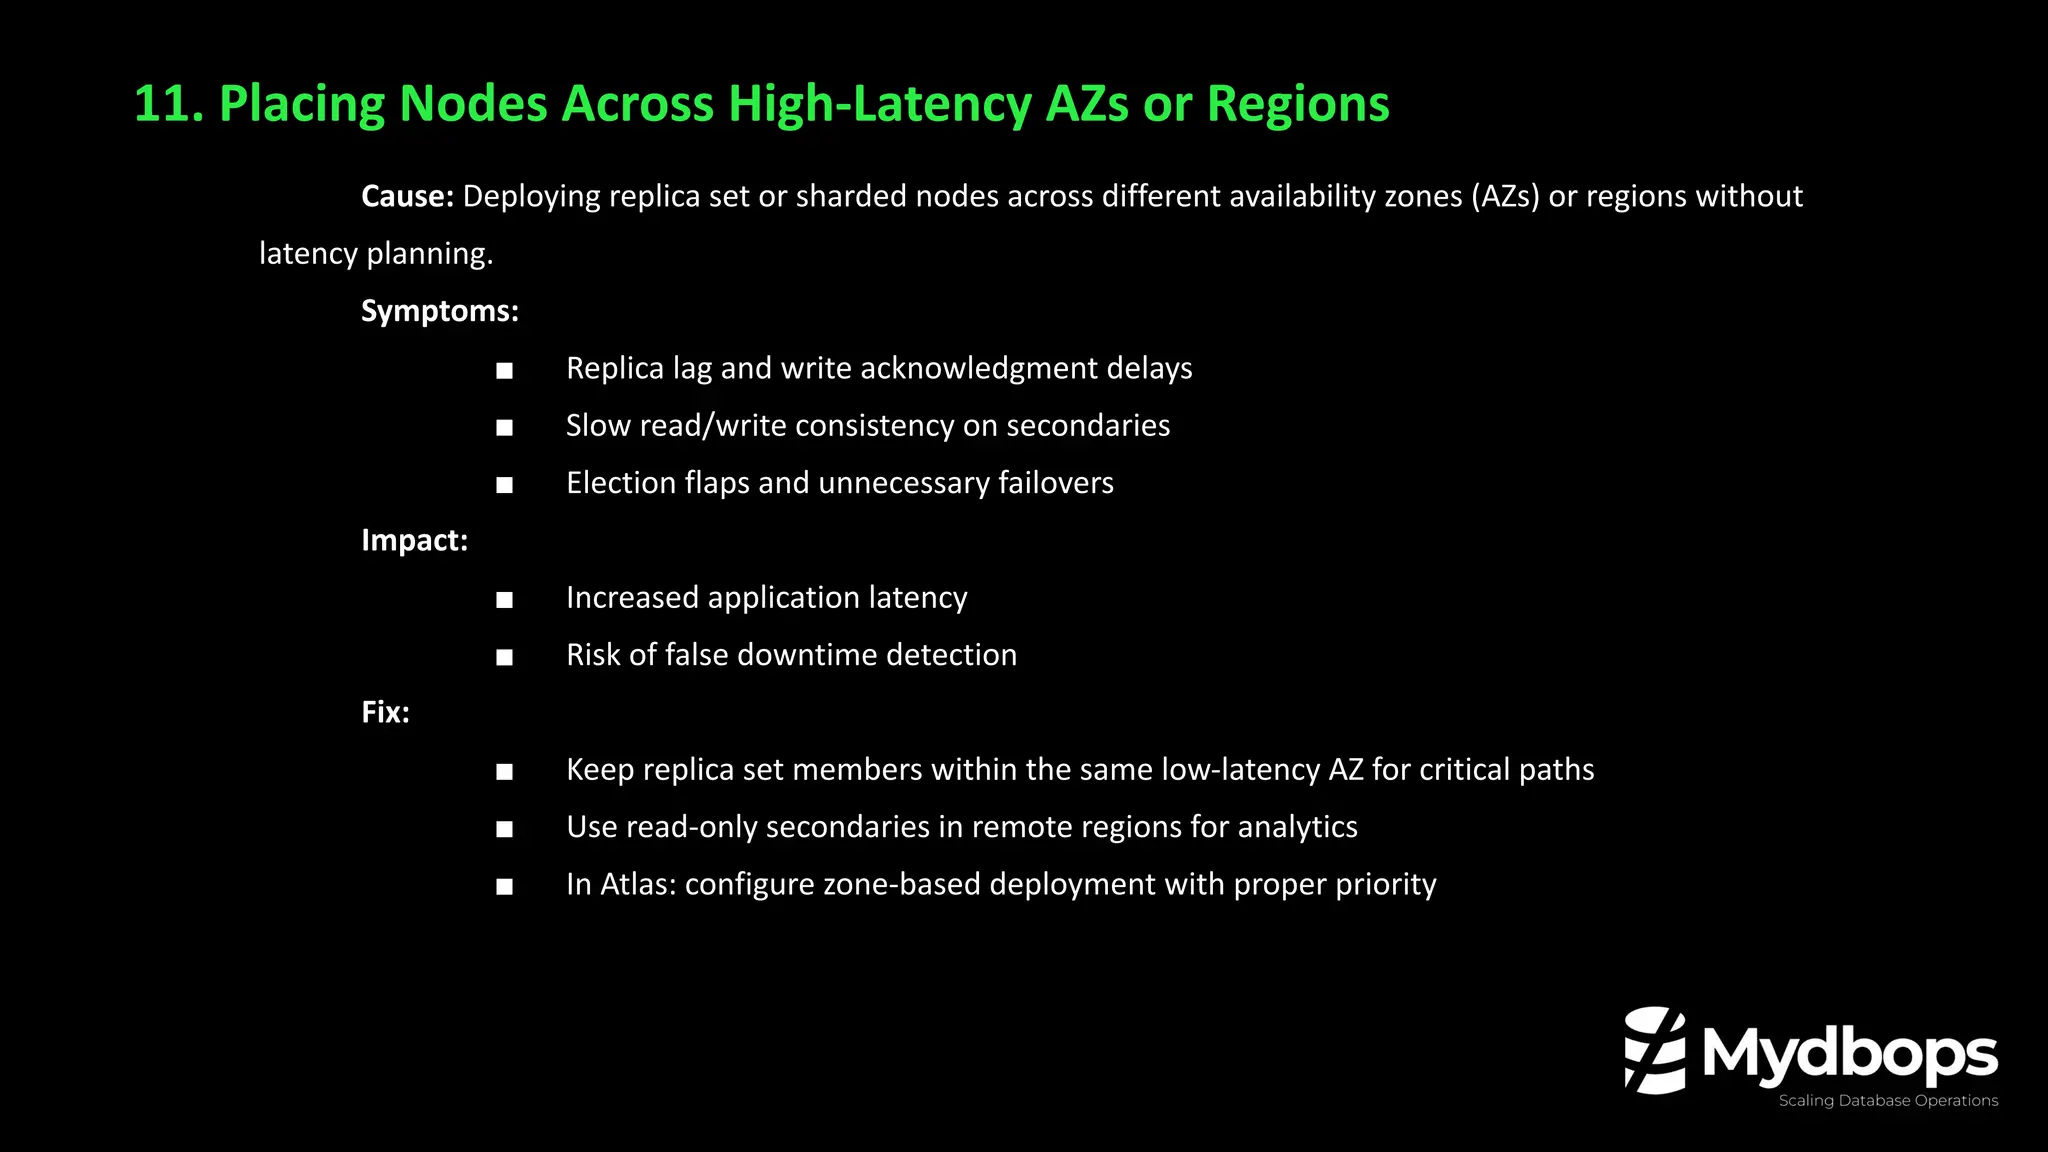
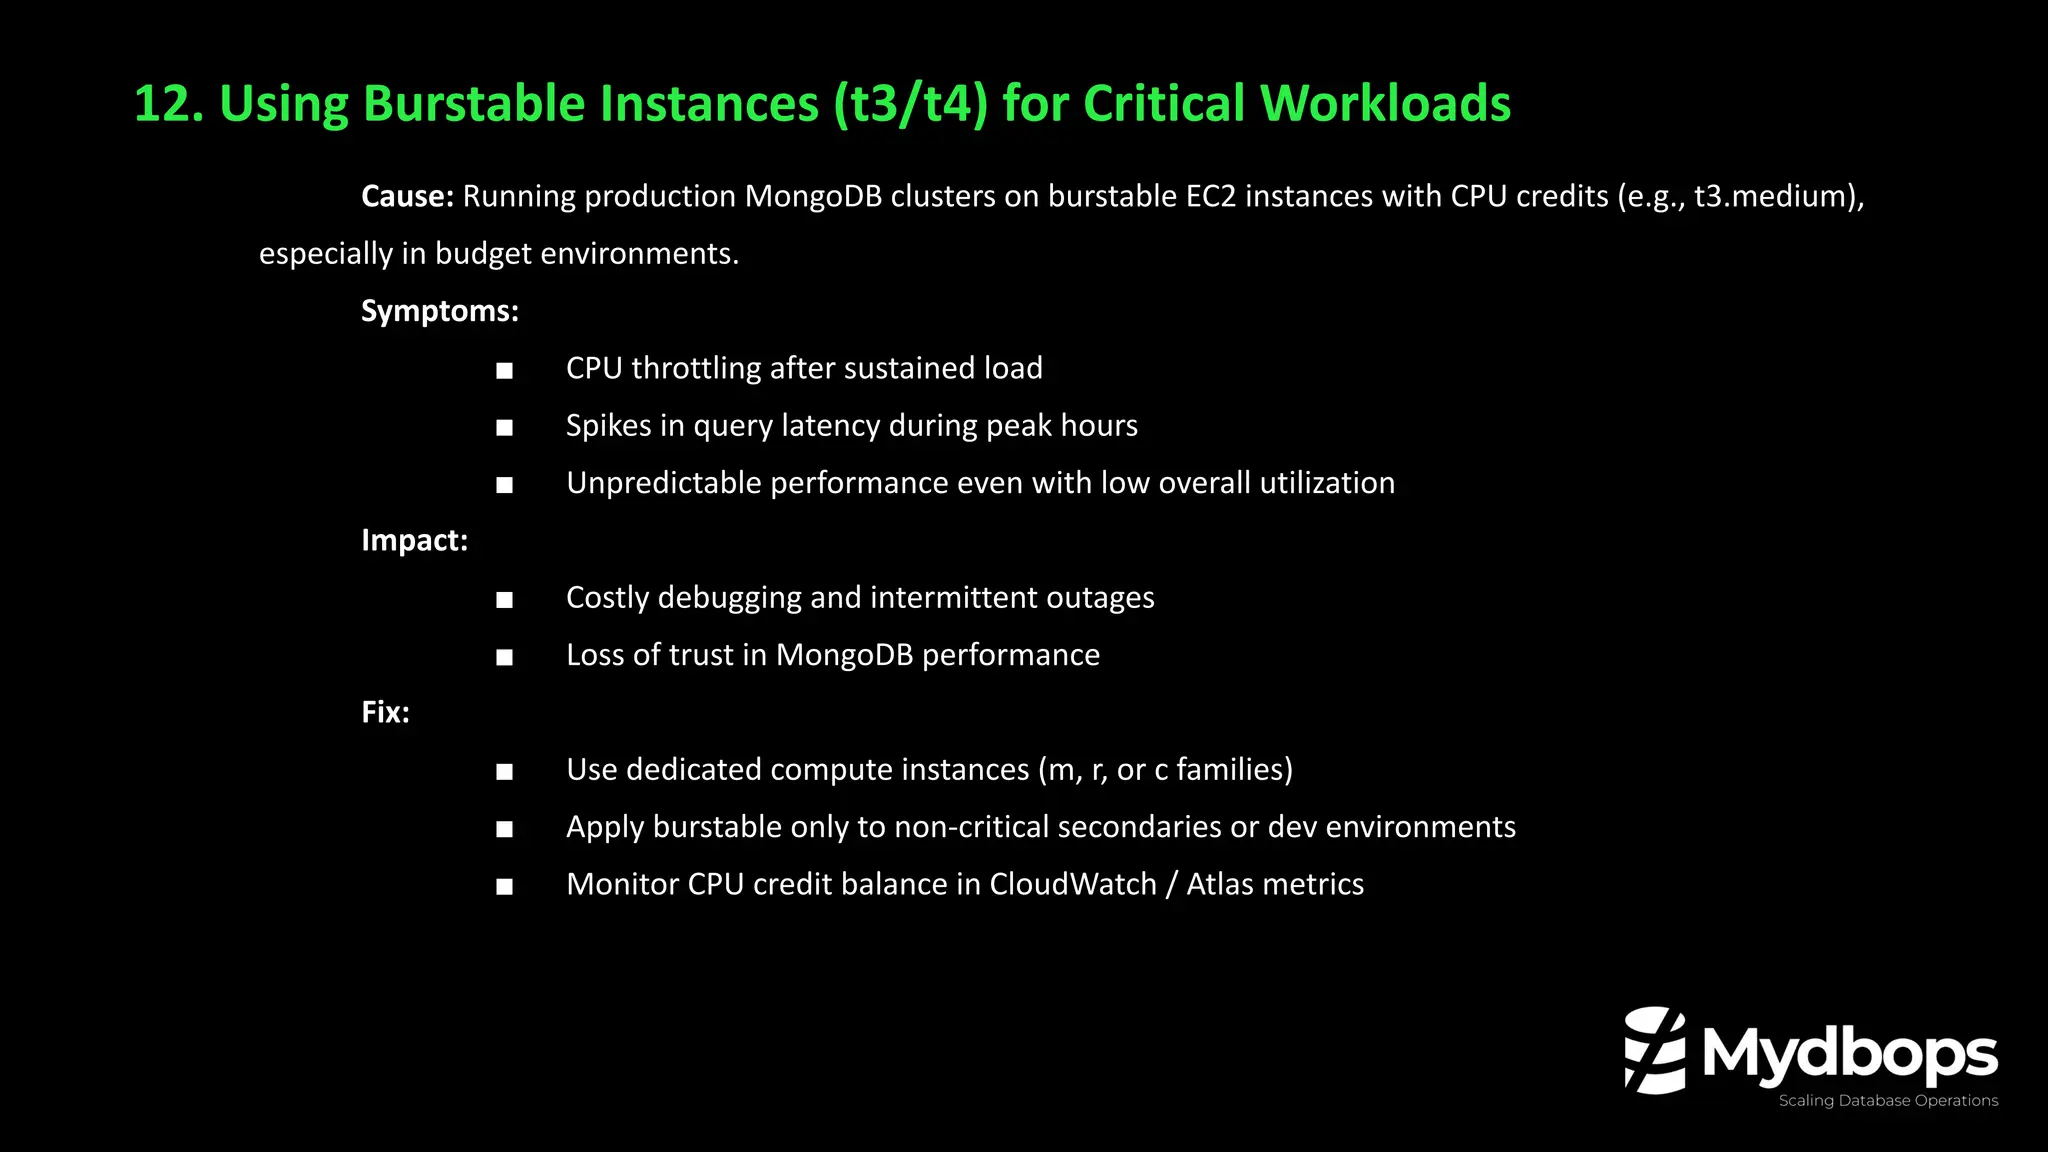


MongoDB is known for its flexibility—but misusing it can quietly damage your performance, scalability, and burn through cloud budgets. In this session, Manosh Malai reveals 10 critical MongoDB anti-patterns that he’s seen repeatedly in real-world systems during consulting engagements. 🔍 What You'll Learn: • The hidden cost of poor schema design and indexing • Query patterns that kill performance • Locking, memory bloat, and I/O inefficiencies • How to refactor for speed and scale • Case studies from actual consulting projects • Optimization tips for MongoDB Atlas, EC2, and Kubernetes setups Whether you're a developer, DBA, SRE, or architect, this session is packed with actionable insights to make your MongoDB infrastructure faster, leaner, and more reliable. 📌 Stay Connected with Mydbops: Website: https://www.mydbops.com Contact: info@mydbops.com Blog: https://www.mydbops.com/blog/ Meetup: https://www.meetup.com/mydbops-database-meetup/ #mongodb #mydbops #mywebinar #databaseperformance #nosql #mongodbatlas #cloudcostoptimization #dba #opensource #Database #webinar #devops #DatabaseConsulting #community #event


![Vibe Coding vs. Spec-Driven Development [Free Meetup]](https://cdn.slidesharecdn.com/ss_thumbnails/vibecodingvsspecdrivendevelopment-251209105622-43f455e7-thumbnail.jpg?width=640&height=640&fit=bounds)

