Download to read offline
![Contents lists available at ScienceDirect
Experimental Thermal and Fluid Science
journal homepage: www.elsevier.com/locate/etfs
Frictional pressure drop of aqueous-organic two-phase flow through packed
and unpacked rectangular serpentine millichannel
Somen Mondal, Subrata Kumar Majumder
⁎
Department of Chemical Engineering, Indian Institute of Technology Guwahati, Guwahati 781039, Assam, India
A R T I C L E I N F O
Keywords:
Serpentine channel
Frictional pressure drop
Friction factor
Millichannel
Packed channel
Liquid-liquid flow
A B S T R A C T
This research work depicts the pressure drop characteristics of single-phase as well as aqueous-organic liquid-
liquid two-phase flow through the rectangular serpentine millichannel in a horizontal orientation. Experiments
were performed to investigate the pressure drops for both single and immiscible two component liquid-liquid
aqueous-organic flows through the same rectangular serpentine channel with medium sand packing. The ex-
perimental results are enunciated with the available models for both empty and packed channels. Empirical
models are developed to predict the pressure drop and friction factor for both single and two-component liquid-
liquid flows through the prescribed serpentine geometry based on operating variables. The present work may be
useful for further understanding of the multiphase system in the serpentine micro-dimensional unit for its design
and development.
1. Introduction
Millichannel technologies with liquid-liquid flow have attracted
considerable attention in compact heat exchangers and mass transfer
devices in chemical industries. Liquid-liquid extraction is an important
mass transfer operation in the chemical, food processing and pharma-
ceutical industries. Essential oil from the natural sources dissolved in
alcoholic water can be extracted by an organic phase by continuously
passing the phases through the packed channel. The packed channel
facilitates high retention time of phases and regular mixing which
benefits the higher extraction rate. Liquid-liquid extraction using aqu-
eous-organic phase (water and butanol) is one of the important study
for intensification of extraction by microfluidic device in this context
[1]. Seibert and Fair [2] studied the influences of phase flow rates, the
direction of solute transfer, and phase dispersion in spray and packed
liquid-liquid extraction column. They developed a fundamental model
to account dispersed phase holdup, and mass-transfer efficiency with
two widely different chemical systems: toluene/acetone/water and 1-
butanol/succinic acid/water. Esmaeilzadeh et al. [3] studied the
spearmint oil extraction in a packed bed using SC-CO2 and its analysis
by mathematical modeling. Sahu et al. [4] studied the overall extrac-
tion performance characterizing as a function of the residence time of
the phases and the hydrodynamics. They reported that the micro-
channel can be a superior extraction device in the slug flow regime as
compared to the well-mixed batch system having comparable sizes of
the dispersed phase. They stated that the strong internal circulations
induced by shear in the slug flow regime attributed to the fact. Priest
et al. [5] demonstrated microfluidic solvent extraction of metal ions
from particle-laden aqueous solutions as an alternative to conventional
solvent extraction for the extraction of Cu2+
using 2-hydroxy-5-non-
ylacetophenone. They reported that the microfluidic method is able to
access extraction kinetics for particle-laden systems. As the micro-
channels are closed systems, there is greater potential for recycling of
volatile liquids and reduced human exposure to potentially hazardous
chemicals. Darekar et al. [6] studied single-stage solvent extraction of
nitric acid using tri-butyl phosphate (TBP) in dodecane in microbore
tubes. The experiments showed that the configuration of microbore
tube is efficient in the extraction of the solute. Kriel et al. [7] studied
the degree of extraction integrating scrubbing and stripping process in
the channel based microfluidic solvent extraction chips using a sec-
ondary amine as the extractant. They reported the real time-efficiency
of the phase disengagement. Tsaoulidis and Angeli [8] studied the effect
of channel size on the mass transfer characteristics of liquid-liquid plug
flow for capillaries with an internal diameter ranging from 0.5 to 2 mm.
The extraction of {UO2}2+
ions from nitric acid solutions into tri-butyl
phosphate – ionic liquid mixtures, relevant to spent nuclear fuel re-
processing, was studied at different residence times, dispersed phase
fractions, and mixture velocities. They reported that extraction effi-
ciencies dependent on channel size. The packed column is widely used
in oil purification and recovery in oil industries, as well as a small sand-
https://doi.org/10.1016/j.expthermflusci.2018.02.011
Received 30 October 2017; Received in revised form 16 January 2018; Accepted 10 February 2018
⁎
Corresponding author.
E-mail address: skmaju@iitg.ernet.in (S.K. Majumder).
URL: http://www.iitg.ernet.in/chemeng/skm/home (S.K. Majumder).
Experimental Thermal and Fluid Science 94 (2018) 215–230
Available online 12 February 2018
0894-1777/ © 2018 Elsevier Inc. All rights reserved.
T](https://image.slidesharecdn.com/1-s2-180228185958/85/1-s2-0-s0894177718301973-main-1-320.jpg)
![Contents lists available at ScienceDirect
Experimental Thermal and Fluid Science
journal homepage: www.elsevier.com/locate/etfs
Frictional pressure drop of aqueous-organic two-phase flow through packed
and unpacked rectangular serpentine millichannel
Somen Mondal, Subrata Kumar Majumder
⁎
Department of Chemical Engineering, Indian Institute of Technology Guwahati, Guwahati 781039, Assam, India
A R T I C L E I N F O
Keywords:
Serpentine channel
Frictional pressure drop
Friction factor
Millichannel
Packed channel
Liquid-liquid flow
A B S T R A C T
This research work depicts the pressure drop characteristics of single-phase as well as aqueous-organic liquid-
liquid two-phase flow through the rectangular serpentine millichannel in a horizontal orientation. Experiments
were performed to investigate the pressure drops for both single and immiscible two component liquid-liquid
aqueous-organic flows through the same rectangular serpentine channel with medium sand packing. The ex-
perimental results are enunciated with the available models for both empty and packed channels. Empirical
models are developed to predict the pressure drop and friction factor for both single and two-component liquid-
liquid flows through the prescribed serpentine geometry based on operating variables. The present work may be
useful for further understanding of the multiphase system in the serpentine micro-dimensional unit for its design
and development.
1. Introduction
Millichannel technologies with liquid-liquid flow have attracted
considerable attention in compact heat exchangers and mass transfer
devices in chemical industries. Liquid-liquid extraction is an important
mass transfer operation in the chemical, food processing and pharma-
ceutical industries. Essential oil from the natural sources dissolved in
alcoholic water can be extracted by an organic phase by continuously
passing the phases through the packed channel. The packed channel
facilitates high retention time of phases and regular mixing which
benefits the higher extraction rate. Liquid-liquid extraction using aqu-
eous-organic phase (water and butanol) is one of the important study
for intensification of extraction by microfluidic device in this context
[1]. Seibert and Fair [2] studied the influences of phase flow rates, the
direction of solute transfer, and phase dispersion in spray and packed
liquid-liquid extraction column. They developed a fundamental model
to account dispersed phase holdup, and mass-transfer efficiency with
two widely different chemical systems: toluene/acetone/water and 1-
butanol/succinic acid/water. Esmaeilzadeh et al. [3] studied the
spearmint oil extraction in a packed bed using SC-CO2 and its analysis
by mathematical modeling. Sahu et al. [4] studied the overall extrac-
tion performance characterizing as a function of the residence time of
the phases and the hydrodynamics. They reported that the micro-
channel can be a superior extraction device in the slug flow regime as
compared to the well-mixed batch system having comparable sizes of
the dispersed phase. They stated that the strong internal circulations
induced by shear in the slug flow regime attributed to the fact. Priest
et al. [5] demonstrated microfluidic solvent extraction of metal ions
from particle-laden aqueous solutions as an alternative to conventional
solvent extraction for the extraction of Cu2+
using 2-hydroxy-5-non-
ylacetophenone. They reported that the microfluidic method is able to
access extraction kinetics for particle-laden systems. As the micro-
channels are closed systems, there is greater potential for recycling of
volatile liquids and reduced human exposure to potentially hazardous
chemicals. Darekar et al. [6] studied single-stage solvent extraction of
nitric acid using tri-butyl phosphate (TBP) in dodecane in microbore
tubes. The experiments showed that the configuration of microbore
tube is efficient in the extraction of the solute. Kriel et al. [7] studied
the degree of extraction integrating scrubbing and stripping process in
the channel based microfluidic solvent extraction chips using a sec-
ondary amine as the extractant. They reported the real time-efficiency
of the phase disengagement. Tsaoulidis and Angeli [8] studied the effect
of channel size on the mass transfer characteristics of liquid-liquid plug
flow for capillaries with an internal diameter ranging from 0.5 to 2 mm.
The extraction of {UO2}2+
ions from nitric acid solutions into tri-butyl
phosphate – ionic liquid mixtures, relevant to spent nuclear fuel re-
processing, was studied at different residence times, dispersed phase
fractions, and mixture velocities. They reported that extraction effi-
ciencies dependent on channel size. The packed column is widely used
in oil purification and recovery in oil industries, as well as a small sand-
https://doi.org/10.1016/j.expthermflusci.2018.02.011
Received 30 October 2017; Received in revised form 16 January 2018; Accepted 10 February 2018
⁎
Corresponding author.
E-mail address: skmaju@iitg.ernet.in (S.K. Majumder).
URL: http://www.iitg.ernet.in/chemeng/skm/home (S.K. Majumder).
Experimental Thermal and Fluid Science 94 (2018) 215–230
Available online 12 February 2018
0894-1777/ © 2018 Elsevier Inc. All rights reserved.
T](https://image.slidesharecdn.com/1-s2-180228185958/75/1-s2-0-s0894177718301973-main-1-2048.jpg)
![packed column is also used in the laboratories [9–10]. Varteressian and
Fenske [11] studied the liquid-liquid extraction performance in a
packed column. Later on, Moorhead and Himmelblau [12] optimized
the operating condition of a packed liquid-liquid extraction column.
These study motivated researchers to study in depth regarding hy-
drodynamics and mass transfer in extraction process even in channel
based extractor in recent years. Millichannel has the potential to
overcome the shortcomings associated with large-scale equipment
through the reduction of analyte and reagent volumes. Millichannels
are also amenable to gentle and high throughput cell handling.
Incorporation of curvature into the rectangular channel specifies the
importance of Dean flow inside the noncircular ducts [13] causing the
high efficiency of mixing resulting higher mass transfer. Another way to
enhance the transport processes is the incorporation of packing mate-
rials inside the rectangular curved ducts.
Pressure drop is one of the most important design parameter for
designing heat and mass transfer equipments, especially in channel
based equipments for process intensification. Rectangular channels
provide higher pressure drop facilitating higher molecular transport
processes as well as low fabrication cost over conventional circular
channels. The knowledge of pressure drop gives the pattern of energy
dissipation, helps in modeling the system, and forms the basis of as-
sessment of the performance of the equipments. Pressure drop calcu-
lation for the fluid flows through the channel is required to install an
appropriate pump for pumping the fluids. Inside the flow systems, the
mixing of multiphase is mostly depended on the pressure drop of the
system. Therefore the comprehensive understanding of pressure drop
during liquid-liquid flows through millichannel is of considerable
practical importance.
There are several models available to interpret the multiphase flow
system in pipes and channels. Lockhart and Martinelli [14] proposed
separated flow model for air-water two-phase flow through circular
Nomenclature
List of symbols
A cross sectional area of the channel (m2
)
Ac aspect ratio of the channel = ( )w
h
(–)
a,b,c rational number (–)
C Chisholm constant (–)
Ca Capillary number =( )μU
σ
(–)
De Dean number ⎛
⎝
= ⎞
⎠
d Uρ
μ
d
r2
H H
c
(–)
dH hydraulic diameter (m)
dpor dp,eff effective particle diameter (m)
Eu Euler number (–)
′Eu modified Euler number (–)
f’ Fanning friction factor (–)
Fr Froude number ⎛
⎝
= ⎞
⎠
U
gdH
(–)
G mass flux (kg/m2
-s)
g gravity of acceleration (m/s2
)
h height of the channel (m)
j volumetric flux (m3
/s-m2
)
K contraction or expansion coefficient (–)
k roughness of the channel wall (–)
L length of the channel (m)
∗Lo Laplace constant ⎛
⎝
= ⎞
⎠−( ) d/
σ
g ρ ρ H( )
0.5
m
w o
(–)
M molecular weight of the liquid (kg/mol)
n total number of variables (–)
nw total number of moles of water (mol)
n0 total number of moles of organic (mol)
nL number of moles of water in liquid phase (mol)
ns number of moles of water at surface (mol)
nv number of moles of water in vapor phase (mol)
ΔP Density difference of the two-fluids (kg/m3
)
ΔPa accelerating pressure drop (N/m2
)
ΔPf frictional pressure drop (N/m2
)
ΔPg gravitational pressure loss (N/m2
)
ΔPinlet sum of inlet pressure losses (N/m2
)
ΔPT total pressure drop for flow (N/m2
)
Q volumetric flow rate of the liquid (m3
/s)
rc radius of curvature (m)
Re Reynolds number =( )d Uρ
μ
H
(–)
RU relative uncertainties (–)
SD standard deviation (–)
SU standard uncertainties (–)
U actual velocity (m/s)
VB total volume of the bed (m3
)
Vp volume of the pores (m3
)
Vtot total volume of the liquid-liquid mixture (m3
)
vs superficial velocity (m/s)
w width of the channel (m)
We Weber number = =( )CaRe
d ρU
σ
H
2
(–)
We’ modified Weber number ⎛
⎝
= = ⎞
⎠
DeCa
d ρU
σ
d
r2
H H
c
2
(–)
x mixture mass quality (–)
xw liquid phase mole fraction of water (–)
xo liquid phase mole fraction of organic (–)
xi ith component of variables (–)
x mean value of the components (–)
X Martinelli parameter (–)
yw interphase mole fraction of water (–)
yo interphase mole fraction of organic (–)
zw vapor phase mole fraction of water (–)
zo vapor phase mole fraction of organic (–)
Greek symbols
ρ density (kg/m3
)
µ viscosity (N-s/m2
)
σ surface tension (N/m)
ζ entrance loss coefficient (–)
ɛ or εeff effective porosity (–)
ɛtotal total porosity (–)
α volume fraction (–)
ϕ two-phase friction multiplier (–)
ϕs sphericity of the packing material (–)
λ correlation coefficient (–)
Subscripts
C curved channel
m multiphase flow through unpacked channel
m,p multiphase flow through packed channel
o organic phase
S straight channel
s single phase flow through unpacked channel
s,o single phase organic
s,p single phase flow through packed channel
s,w single phase water
w water or liquid or aqueous phase
g gas or air or vapor phase
S. Mondal, S.K. Majumder Experimental Thermal and Fluid Science 94 (2018) 215–230
216](https://image.slidesharecdn.com/1-s2-180228185958/85/1-s2-0-s0894177718301973-main-2-320.jpg)
![tubes in a horizontal orientation and incorporated the concept of dif-
ferent two-phase friction multipliers. Chisholm [15] expressed the two-
phase friction multipliers as a function of Lockhart-Martinelli para-
meter (X) and the Chisholm parameter (C). Many researchers conducted
the two-phase flow experiments through rectangular channels and tried
to develop the correlations for Chisholm parameter (C) and two-phase
friction multipliers to interpret the frictional pressure drop. Moriyama
et al. [16] proposed a correlation for Chisholm parameter (C) for R113-
N2 flow in a horizontal rectangular duct of hydraulic radius (dH) of
0.014–0.195 mm. Mishima et al. [17] developed a correlation for ‘C’
using air-water two-phase flow through a vertical rectangular duct of
hydraulic diameter ranges from 2.08 to 8.89 mm. Mishima and Hibiki
[18] studied the flow regime, void fraction, rise velocity of slug bubbles
and measured the pressure loss for air-water two-phase flow through
capillary tubes of inner diameter ranges from 1.0 to 4.0 mm. They
proposed correlation for the prediction of ‘C’ values which is applicable
for the flow through vertical and horizontal round tubes as well as
rectangular ducts. Lee and Lee [19], Lee and Mudawar [20] also sug-
gested the correlation for the determination of ‘C’ for the flow of air-
water and water-R134a through a rectangular duct of hydraulic radius
0.78–6.67 mm and 0.349 mm respectively. Rectangular channel and
tubes of hydraulic radius 0.506–12 mm in a horizontal position were
used by Sun and Mishima [21] to investigate the hydrodynamics. They
proposed another correlation for ‘C’ using air-water, refrigerant-CO2
based on their experimental results. Zhang et al. [22] modified the
correlation of Mishima and Hibiki [18] for gas-liquid flow systems.
Tran et al. [23] experimented for the flow of R- 134a, R-12, and R-113,
through a horizontal rectangular duct of the hydraulic diameter of
2.397 mm and incorporated the expression of two-phase friction mul-
tiplier as per Lockhart-Martinelli concept. Followed by the same way in
2012, Qin et al. [24] also suggested a correlation for water-steam sys-
tems but for a rectangular vertical channel of hydraulic radius 3.81 mm.
Chen et al. [25] introduced two different correlations for laminar and
turbulent flow regions for the flow of air-water systems through a
horizontal rectangular channel of hydraulic diameter 3–4.5 mm.
Blasius [26] proposed a friction factor relation with Reynolds
number for fully developed turbulent flow through the circular tubes as
well as rectangular channels. Shah and London [27], Harnett and Kostic
[28], Abdelall et al. [29], Hrnjak and Tu [30] used the same relation to
determine the friction factors for laminar flow through rectangular
channels. The friction factor for both developing and developed flow
regimes through rectangular microchannel was categorized by Phillips
[31]. Churchill [32] in 1977 developed a friction factor correlation for
flow through the rectangular channel. In 2017, Li and Hibiki [33] used
the same correlation developed by Churchill [32] for both laminar and
turbulent flow through a rectangular channel. Flows through curved
microchannel were investigated by Hua and Yang [34], Wang and Liu
[35]. They [34,35] developed the pressure drop and friction factor re-
lationship as a function of Reynolds number and Dean number.
Pressure drop correlation for the flow through packed bed was first
developed by Ergun [36,37] in the year 1952. It was the combination of
Kozeny–Carman equation [37], applicable for laminar flow regimes and
Burke-Plummer equation [37], applicable for turbulent flow regimes.
Therefore, the Ergun equation is valid for a wide range of flow condi-
tions through the packed bed. Later on, many investigators (Feng [38],
Foumeny et al. [39], Eisfeld et al. [40], Montillet et al. [41]) were tried
to modify the Ergun equation according to geometry and application of
packed unit.
From the literature, it is observed that very less attention has been
given to the rectangular serpentine channels in both micro and macro
domain. Most of the experiments have been carried out using air-water
systems even though they used the rectangular curved channel. To the
best of our knowledge, no experiment has been carried out to in-
vestigate the pressure drop of liquid-liquid flow through rectangular
serpentine channels in both packed and unpacked conditions. Liquid-
liquid flow has potential application in the mass transfer like extraction
in micro and millichannel for process intensifications. The present study
aims to investigate the effect of operating variables on the pressure drop
and friction factor for the liquid-liquid flow through rectangular ser-
pentine millichannel with and without packing and the development of
general empirical models to interpret the results based on experimental
results. In industries, it would be the new beginning of the introduction
of the rectangular serpentine packed bed for the process intensification
for physical and reactive mass transfer.
2. Theoretical background
Frictional pressure drop for multiphase phase liquid flow can be
expressed as
= − − −P P P P PΔ Δ Δ Δ Δf T a g inlet (1)
where ΔPf is the multiphase frictional pressure drop, ΔPT is the total
pressure drop, ΔPa is the pressure drop due to the acceleration of fluid
velocity, ΔPg is the gravitational pressure drop. In the present study, the
ΔPa term of Eq. (1) is nullified as the inlet and outlet velocities are
considered to be the same. ΔPinlet is the sum of contraction or expansion
and entrance loss at the inlet which can be expressed as
= +P K ζ
ρU
Δ ( )
2
inlet
2
(2)
where ρ is the density of the fluid, U is the actual velocity of the fluid at
the contraction or expansion zone, K is the contraction or expansion
coefficient which is assumed to be equal to 0.5 and ζ is entrance loss
coefficient and holds the value nearly equal to 1.31 [42]. Gravitational
effect on the pressure drop is expressed as Froude number as
=Fr
U
gdH (3)
where g is the gravitational acceleration and dH is the hydraulic dia-
meter. Though the horizontal flow is encountered in the following
context, the density ratio of the two fluids greater than one results in
the slip between the phases which incorporated the effect of Froude
number or gravity or hydraulic jump [43–45,71]. In that case, when the
velocity of the phases increase, a wave is generated at the interphase of
the two fluids and at high velocity the waves break down and form
bubbles or slugs inside the flow field. Surface waves can form under the
influence of gravity even in the absence of air and in the horizontal flow
condition when the densities of the fluids are different. If there is
stratified flow due to density difference the film inversion [72] at the
bends also influences the mixing or formation of bubble and slug in the
channel. At that condition difference in density persists along the ver-
tical line through the channel which demands the effect of gravity or
Froude number. In the present study, the density ratio is 1.154 and the
Froude number for the mixture ranges from 0.99 to 5.18 makes the
incorporation of Froude number in case of mixed phase flow sig-
nificantly. The Froude number ranges for the hydraulic jumps for air-
water flows are [46]:1 < Fr < 2.5 for weak jump, 2.5 < Fr < 4.5
for oscillating jump, 4.5 < Fr < 9 for steady jump and Fr > 9 for
strong jump. The liquid densimetric Froude number is given by the Eq.
(4) as [47]
⎜ ⎟= ⎛
⎝
⎞
⎠
Fr
ρ
ρgd
U
Δ
d
s
H
s
0.5
(4)
The hydraulic jump is also observed in single-phase flow in la-
boratory channels [47,73]. In the present study, the Froude number for
the single-phase flow ranges from 0.39 to 3.02, which also implies an
effect on the fluid flow. In oil and gas station Froude number is kept
always less than 0.30 using submerged outlets to avoid air entrainment
and ensure undistributed flow without pulsations. The present study
uses an air open outlet where entrainment might causes hydraulic jump
and accounts higher Froude number. Moreover, there might be the
S. Mondal, S.K. Majumder Experimental Thermal and Fluid Science 94 (2018) 215–230
217](https://image.slidesharecdn.com/1-s2-180228185958/85/1-s2-0-s0894177718301973-main-3-320.jpg)
![release of dissolved gas or vapor of its own or some air pocket at the
joining of the pressure sensors. As a result, the Froude number is sig-
nificant in both single and mixed phase flows. Depending on the above
effects various types of flow patterns are observed in the liquid-liquid
two-phase flows through the rectangular channels [48–50]. Hydraulic
diameter of the rectangular channel was calculated as
=
+
d
wh
w h
2
( )
H
(5)
where w and h are the width and height of the rectangular channel
respectively. The calculations were done based on the actual velocities
of the phases depending on the flow distribution inside the channel.
Actual velocities are calculated from the volume fraction of each phase
inside the channel by measuring the volumetric flow rate of each phase.
The friction factor is a dimensionless representation of the viscous
pressure drop due to the effect of the fluid's viscosity near the surface of
the channel. As per Fanning equation, the Fanning friction factor can be
represented by
′ =f
d P
ρU L
Δ
2
H f
2
(6)
In the case of the packed bed, U is replaced byU ε/ eff . The term, εeff is
the porosity of the packed channel. From, the experimental results, it
was observed that with changing velocities of the phases, the pressure
drop changes. Therefore, the pressure drop mainly depends on
Reynolds number (Re). In the case of a rectangular curved channel, the
radius of curvature affects the flow creating Dean effect. As a result
Dean number (De) replaces the Reynolds number (Re) for the flow
through the rectangular curved channel. Friction factor depends on
another two significant dimensionless numbers [67] such as capillary
number (Ca) for milli- and micro-channel and Froude number (Fr) for
mainly the fluids of different densities. According to viscous-capillary
paradox, an apparent contradiction, the structure of Darcy's law is that
of a viscous law but typical capillary numbers of 10−6
– 10−3
indicate a
capillary dominated behavior [51]. In the visco-inertia regime, capil-
lary number is higher than 10−3
. When one studies a multi-phase flow
system, the calculation of the capillary number is very much important
to understand the factors that are affecting the flow behavior. The
critical value of the capillary number depends on the geometry of the
packing material and other fluid properties. The internal circulation
within the slugs may arise depending on the physical properties of the
fluids and the prevalent operating conditions [52,53]. Capillary pres-
sure acts as both the opposing and driving force for fluid transport. The
phases, water and toluene used in the present study are wetting with
the channel wall and the sand particles. So, there must be some capil-
lary pressure due to the wetting characteristics. The Dean number,
capillary number, Froude number and friction factor for single and
multi-phase flows through the unpacked channel are represented as
follows:
Dean number for the single phase is defined as
=De
d
r
Re
2
s s
H
c (7)
where
=
d ρ U
μ
Res
H s s
s (8)
=Ca
μ U
σ
s
s s
s (9)
=Fr
U
gd
s
s
H (10)
and
′ =f
d
ρ U
P
L2
Δ
s
H
s s
f
2
(11)
Dean number for the mixture phase is defined as
=De
d
r
Re
2
m m
H
c (12)
where
=
d ρ U
μ
Rem
H m m
m (13)
=Ca
μ U
σ
m
m m
m (14)
=Fr
U
gd
m
m
H (15)
= +U U α U α/ /m s o o s w w, , (16)
and
′ =f
d
ρ U
P
L2
Δ
m
H
m m
f
2
(17)
where the subscripts ‘s’ represents the single-phase flow and ‘m’ re-
presents the multi-phase mixture flow. Hydraulic diameter (dH) is re-
presented by the Eq. (5). Similarly, the three dimensionless numbers
and the friction factor for the packed channel are calculated using the
following relations:
Dean number for the single phase flow through packed channel is
defined as
=De
d
r
Re
2
s p s p
H
c
, ,
(18)
where
=
d ρ U ε
μ
Re
( / )
s p
p s s eff
s
,
(19)
=Ca
μ U ε
σ
( / )
s p
s s eff
s
,
(20)
=Fr
U ε
gd
( / )
s P
s eff
p
,
(21)
and
′ =f
d
ρ U ε
P
L
( )
2 ( / )
(Δ )
s p
p
s s eff
f p
2
(22)
Dean number for mixture flow through packed channel is defined as
=De
d
r
Re
2
m p m p
H
c
, ,
(23)
where
=
d ρ U ε
μ
Re
( / )
m p
p m m eff
m
,
(24)
=Ca
μ U ε
σ
( / )
m p
m m eff
m
,
(25)
=Fr
U ε
gd
( / )
m p
m eff
p
,
(26)
= +U U ε α U ε α( / / )m p s o eff o s w eff w, , , (27)
and
S. Mondal, S.K. Majumder Experimental Thermal and Fluid Science 94 (2018) 215–230
218](https://image.slidesharecdn.com/1-s2-180228185958/85/1-s2-0-s0894177718301973-main-4-320.jpg)
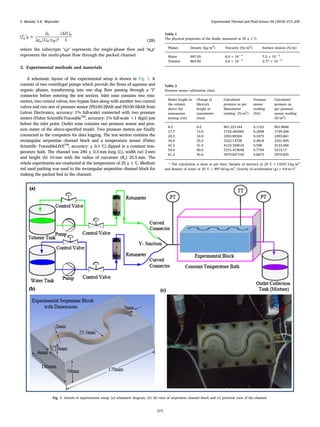
![The physical properties of the systems measured at 25 ± 1 °C are
shown in Table 1. The dimensions of the serpentine channel block are
shown in schematic diagram (Fig. 1). The pressure sensors and the
temperature sensor are calibrated before the main experiment. The
pressure sensors are calibrated with the help of a mercury manometer
in which one side of the manometer was kept open to air. A graduated
cylindrical column of height 1.5 m is connected to the pressure sensor
and the manometer at the same height from the datum. The column is
filled with water at a certain level and set the pressure sensor reading as
zero as per manometer initial reading. When the water height of the
column is increased the change in manometer as well as pressure sensor
reading are noted down. The noted data of the pressure sensor and the
manometer with respect to water height are shown in Table 2. The
pressure sensor calibration curve is represented in Fig. 2(a). The tem-
perature sensor is calibrated with the help of a high accuracy calibrated
handheld thermometer (TTI-10, Isotech, accuracy = ± 0.01 °C). Both
the temperature sensor (accuracy =± 0.1 °C) and the thermometer are
dipped in a constant temperature water bath. The recorded data are
shown in Table 3 and the calibration curve is represented in Fig. 2(b).
The densities, viscosities and surface tensions are measured by specific
gravity bottle (ATICO Medical Pvt. Ltd., AM-90024, 100 ml), rheometer
(Anton Paar, Physica MCR-301) and tensiometer (Kyowa Interface
Science, DY-300) respectively. Finally, the volumetric flow rate of the
two fluid mixtures is measured by collecting the sample for a particular
time by measuring cylinder and a stopwatch. The volumetric flow rates
are controlled and measured by the valves and the rotameters by
changing one keeping the other fixed and vice versa. Average pressure
drop for a particular mixture flow rate is noted by averaging 200 data
points measured using pressure sensor at each flow rate. The volume
fraction of each phase in the channel is calculated from the total mixed
phase volumetric flow rate and the volumetric flow rate of a single
phase for a particular set of flow condition.
The mixture properties of the fluids are calculated from the fol-
lowing equations
= +ρ ρ α ρ αm w w o o (29)
where ρm, ρw and ρo are densities of the mixture, aqueous phase (water)
and the organic phase (toluene) respectively. The symbols αw and αo
denote the volume fractions of aqueous phase and organic phase re-
spectively. According to Olimans [54] viscosity of the mixture is cal-
culated by
= +μ μ α μ αm w w o o (30)
where μm, μw and μo are viscosities of the mixture, aqueous phase and
organic phase respectively.
The surface tension of the liquid-liquid mixture: The liquid mixture
of two components, water and organic liquid (toluene), is assumed to be
in equilibrium with its own vapor. The liquid-vapor interface is treated
here in the manner of Bakker [55], Verschaffelt [56] and Guggenheim
[57] as a thin phase separated from the bulk liquid and vapor by two
dividing surfaces which enclose the region of property variation normal
to the interface (Eberhart, 1966 [58]).
The bulk liquid phase is assumed to have mole fractions xw for water
and xo for organic liquid (toluene), while the bulk vapor phase has mole
fractions zw and zo for water and organic liquid respectively. Although
the interfacial or surface phase has a composition which varies in a
direction normal to the dividing surfaces, it is assigned overall mole
fractions yw and yo for water and organic liquid respectively which
satisfy the material balance conditions for the system. For component
water in the mixture, for example, this condition is nw = nLxw + nsyw +
nvzw where nw is the total number of moles of water in the three
“phases,” of the mixture and nL, ns, and nv are the number of moles of
water and toluene in the liquid, surface, and vapor phases, respectively.
Since, in general, ns and nv are very much smaller than nL, it will be
assumed that xw is essentially equal to the overall mole fraction of
water, nw/(nw + n0). The surface tension of liquid mixture, σm, is then
assumed to be a linear function of the surface layer mole fraction which
is expressed as (Eberhart, 1966 [58]). In the present study, we are
considering the liquid-liquid surface tension separately with its in-
dividual liquid vapour. Based on the individual surface tension of the
liquid with its vapour, the surface tension of the liquid-liquid mixture is
calculated according to Eq. (31).
= +
= ++ +
σ y σ y σ
σ σ
m w w o o
α V ρ M
α V ρ M α V ρ M w
α V ρ M
α V ρ M α V ρ M o
( ) /
( ) / ( ) /
( ) /
( ) / ( ) /
w tot w w
w tot w w o tot o o
o tot o o
w tot w w o tot o o (31)
where σm, σw and σo are surface tensions of the mixture, aqueous phase
and organic phase respectively. Vtot is the total volume of the liquid-
liquid mixture, M is the molecular weight of the liquid.
The average particle diameter (dp,eff), effective porosity of the
packed bed (εeff) and sphericity of the packing material (ϕp) are the
three important parameters to govern the hydrodynamics in the packed
bed. The average particle diameter is determined by sieving method. In
(a)
0 1 2 3 4 5 6
0
1
2
3
4
5
6
PS×10
-3
(N/m
2
)
PM × 10
-3
(N/m
2
)
PS = 0.99991PM + 0.0002391
(b)
20 25 30 35 40 45 50 55 60 65
20
25
30
35
40
45
50
55
60
65
Ts(
o
C)
TTTI-10 thermometer (
o
C)
Ts
= 0.99951 TTTI-10
+ 0.02237
Fig. 2. Pressure and Temperature sensor calibration: (a) Pressure sensor calibration plot (b) Temperature sensor calibration plot.
Table 3
Temperature sensor calibration chart.
TTTI-10 high accuracy handheld thermometer
reading (°C)
Temperature sensor reading
(°C)
22.305 22.31
24.481 24.50
25.001 25.01
26.203 26.22
30.402 30.41
40.142 40.13
50.121 50.12
60.042 60.04
S. Mondal, S.K. Majumder Experimental Thermal and Fluid Science 94 (2018) 215–230
220](https://image.slidesharecdn.com/1-s2-180228185958/85/1-s2-0-s0894177718301973-main-6-320.jpg)
![this method, a series of sieve set has been used and the particles are
screened by the sieve of sizes ASTM No. 35 and 40 (U.S. Standard).
Based on the average particle diameter according to the literature [68],
the sand is classified as medium sand. The average particle size as per
present experiment is 462 µm. The effective porosity is calculated by
using the Eq. (32) [69].
=ε
V
V
eff
p
B (32)
where Vp is the volume of the pores and VB is the total volume of the
bed. According to Zou and Yu [59] for dH/dp > 3.95, the effective
porosity εeff is defined as
= + −ε e0.372 0.002( 1)eff
d d15.306 /p H
(33)
The effective porosity (εeff) of a packed bed can also be calculated by
the correlation (Eq. (34)) developed by Klerk [60] which is valid in the
range of 2 ≤ dH/dp ≤ 19. The correlation can be expressed as
⎜ ⎟= + ⎛
⎝
− ⎞
⎠
ε
d
d
0.373 0.917exp 0.824eff
H
p (34)
The effective porosity estimated experimentally in the present work
is 0.36 which is within 6% error based on the predicted value calculated
by the equation (33) and (34). The experimental determination of the
effective porosity is done by dividing the pore volume with the total
volume of the channel. From the literature, it is seen that the porosity
range of the medium sand is 0.22–0.49 [61,62,68,70]. Therefore the
present experimental data of porosity is justified for the sand particle
taken for the experiment. The third and another important parameter
for packed bed is sphericity of the packing materials. The sphericity is
calculated by using the modified procedure of Krumbein and Sloss [63].
It is defined as the ratio of the diameter of the largest drawn circle
possible inside the particle (rp) to the diameter of the smallest drawn
circle surrounding the particle (rc) as shown in Fig. 3(a). A typical
snapshot of the sand particle taken by Sony DSC-H400 Point and Shoot
Camera is shown in Fig. 3(b). It is analyzed by Digimizer®4 software.
The mathematical form of sphericity of particle is expressed as
=ϕ
r
rp
c
p (35)
From the analysis, it is found that the sphericity of particle is 0.80,
which is within the range 0.50–0.90 for natural sands reported by Cho
et al. [64]. The volume fraction of each phase inside the channel was
measured by volumetric flow rate measurement process using a mea-
suring cylinder (Borosil, 100 ml, Tolerance ± 0.5 ml) and a stopwatch
(Seiko digital stopwatch Cal. S056, Accuracy ± 0.0012%).
The percentage error of the experimental and calculated values are
determined by
⎜ ⎟= ⎛
⎝
− ⎞
⎠
×%Error
Experimental Calculated
Experimental
100%
(36)
Finally, the deviation of experimental results from the available
correlations and newly generated correlations are analyzed by root
mean square deviation (RMSD) and mean deviation (MD) which are
defined respectively as
∑ ⎜ ⎟=
⎛
⎝
⎜
⎡
⎣
⎢
⎛
⎝
− ⎞
⎠
⎤
⎦
⎥
⎞
⎠
⎟ ×RMSD
N
1 (Experimental Calculated)
Experimental
100%
2 0.5
(37)
∑⎜ ⎟= ⎛
⎝
− ⎞
⎠
×MD
N
1 (Experimental Calculated)
Experimental
100%
(38)
3.1. Uncertainty analysis of experimental data
In the present work each experiment is repeated at least ten times
and then the average value of the results are taken. The standard de-
viation (SD), standard uncertainties (SU) and percentage relative un-
certainties (RU) of the repeated experiments are calculated by Eq. (39),
Eqs. (40) and (42) respectively [65].
∑
=
−
−
=
SD
x x
n
( )
1
i
N
i
1
2
(39)
=S
SD
n
U
(40)
where xi is the ith component of variables and n is the total number of
variables. x represents the mean value and mathematically it is ex-
pressed as
∑=
=
x
n
x
1
i
N
i
1 (41)
= ×R
S
x
100%U
U
(42)
The ranges of mean, standard deviation and uncertainty of the ex-
perimental results of total volumetric flow rate and frictional pressure
drop for both packed and unpacked channel are shown in Table 4.
Fig. 3. Measurement of sphericity of packing materials: (a) schematic representation of sphericity and (b) typical pictorial analysis of particle by image analysis software.
S. Mondal, S.K. Majumder Experimental Thermal and Fluid Science 94 (2018) 215–230
221](https://image.slidesharecdn.com/1-s2-180228185958/85/1-s2-0-s0894177718301973-main-7-320.jpg)
![4. Results and discussion
4.1. Variations of frictional pressure drop and friction factor with operating
variables
Frictional pressure drop depends on flow velocity. Flow velocity is
directly influenced by the Reynolds number. Reynolds number in-
creases with increasing flow velocity. Dean number is considered to
interpret the hydrodynamics in case of flow through the serpentine
channel as the curvature effects generate secondary flow [13]. Capillary
number influences the flow when the channel becomes milli or micro in
size. In case of two-phase flow, when the densities of the two phases are
different, the gravity also affects the flow. The variations of pressure
drop per unit length of the channel with the above three dimensionless
numbers are shown in Fig. 4(a) and (b) for single and multiphase flows
respectively.
Frictional pressure drop per unit length increases with increasing
Dean number, capillary number as well as Froude number [67] for both
single and multiphase flow (Fig. 4(a), (b)). In both the figures, Dean
number curve is steeper than the others which confirm the higher effect
on frictional pressure drop with increasing the velocity of the phases.
According to the experimental result, Froude number effect is more
pronounced in the case of multiphase flow than single phase flow due to
the density difference between the two fluids. As the Dean number has
the higher contribution to frictional pressure drop, its influence on the
friction factor prevails accordingly as shown in Fig. 5(a) and (b).
The friction factor decreases exponentially with increasing Dean
number [Fig. 5(a) and (b)]. Friction factor value for the multiphase flow
is lower than the single phase flow as the Dean number is higher for the
multiphase system. In case of the packed channel also the Dean number
has the significant effect on pressure drop as well as friction factor.
Along with the Dean number, capillary number and Froude number
effects are significant on the frictional pressure drop for the flow
through the packed channel as shown in Fig. 6(a) and (b).
As the Dean number has the higher impact on the pressure drop, it
demands valuable impression on friction factor. The friction factor
variation with the Dean number for the flow through the packed
channel is shown in Fig. 7(a) and (b).
Figs. 6 and 7 shows the higher values of the pressure drop and
friction factor for the packed channel than those in the unpacked
channel (Figs. 4 and 5).
4.2. Analysis by model
There is no reliable theoretical model available to predict the
pressure drop as well as friction factor for the water or organic single
phase and water-toluene multiphase flow through the rectangular
packed and unpacked serpentine horizontal channel. In the present
study, an attempt has been made to predict the pressure drop and
friction factor by developing empirical correlations.
4.2.1. Analysis by empirical models for flow through unpacked channel
Pressure drop generally depends on different operating variables:
hydraulic diameter, the radius of curvature, liquid superficial or actual
velocity (U), the density of the liquid, the viscosity of the liquid, the
surface tension of the liquid. The experimental data have been analyzed
to develop the correlation for pressure drop as a function of the oper-
ating variables as:for single phase flow,
⎜ ⎟
⎛
⎝
⎞
⎠
=
P
L
f d r U ρ μ σ g
Δ
( , , , , , , )
f
s
H c s s s s
(43)
For mixture flow,
⎜ ⎟
⎛
⎝
⎞
⎠
=
P
L
f d r U ρ μ σ g
Δ
( , , , , , , )
f
m
H c m m m m
(44)
The subscripts ‘s’ denotes single-phase flow whereas ‘m’ denotes the
mixture flow of phases. The functionality of pressure drop obtained by
dimensional analysis (Buckingham Pi theorem) in terms of various
significant dimensionless groups which can be expressed as
′ = = =Eu Eu
d
L
P
ρU
d
L
λDe Ca Fr
ΔH f H a b c
2
(45)
where Eu' is the modified Euler number. The Euler number (Eu) is
signified by the ratio of pressure forces to inertial forces. The parameter
λ is a coefficient and ‘a’, ‘b’, and ‘c’ is the rational numbers. The
Table 4
Uncertainties to the experimentally measured quantities.
Properties and measurements Mean No. of run Standard Deviation × 102
Standard uncertainty × 102
% relative uncertainties
Total volumetric flow rate × 106
(m3
/s) [without packing] 0.89 – 5.43 10 0.037 – 0.24 0.012 – 0.075 0.013 – 0.014
Total volumetric flow rate × 106
(m3
/s) [with packing] 0.30 – 1.52 10 0.038 – 0.23 0.012 – 0.074 0.04 – 0.05
Pressure drop per unit length × 104
(N/m3
) [without packing] 3.51 – 9.28 10 0.032 – 0.038 0.010 – 0.012 0.0013 – 0.003
Pressure drop per unit length × 105
(N/m3
) [with packing] 4.09 – 9.68 10 0.033 – 0.040 0.010 – 0.013 0.0013 – 0.002
(a)
0 100 200 300 400 500 600 700 800
2
3
4
5
6
7
Des
Cas
×10
5
Frs
×10
3
(ΔPf
/L)s
×10
-3
-experimental(N/m
3
)
Des
,Cas
,Frs
(-)
(b)
0 1000 2000 3000 4000 5000
30
40
50
60
70
80
90
100
Dem
Cam
×10
5
Frm
×10
3
(ΔPf
/L)m
×10
-3
-experimental(N/m
3
)
Cam
, Frm
, Dem
(-)
Fig. 4. Variation of frictional pressure drop with the dimensionless numbers in unpacked channel: (a) single phase flow and (b) multiphase flow.
S. Mondal, S.K. Majumder Experimental Thermal and Fluid Science 94 (2018) 215–230
222](https://image.slidesharecdn.com/1-s2-180228185958/85/1-s2-0-s0894177718301973-main-8-320.jpg)
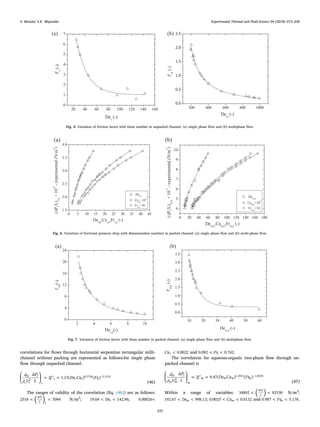
![The correlation coefficients and the standard errors are found to be
0.999 and 0.035 for Eq. (46), 0.999 and 0.024 for Eq. (47). The Eq. (46)
and Eq. (47) fit the experimental data with maximum 4.6% (Fig. 11(a))
and 5.0% (Fig. 11(b)) error respectively. From Eqs. (46) and (47), it is
obvious that the pressure drop for single and multiphase flow depends
on three significant dimensionless numbers such as Dean number De( ),
capillary number Ca( ) and Froude number Fr( ).
4.2.2. Analysis by Lockhart-Martinelli model
Lockhart-Martinelli [14], first introduced the pressure drop model
for the two-phase flow through the circular channel. The basics of the
model are that the two-phase frictional pressure drop is a multiplier of
any single phase frictional pressure drop. The multiplier is called
pressure drop multiplier which is denoted by ϕw
2
. According to their
model,
=P L ϕ P L(Δ / ) (Δ / )f m w f w
2
(48)
The pressure drop multiplier is related to the Lochart-Martinelli’s
parameter [14] as:
= + +ϕ
C
X X
1
1
w
2
2 (48a)
= + +ϕ CX X1o
2 2
(48b)
where C is called Chisholm’s [15] constant. The parameter X is called
Lockhart-Martinelli’s parameter which is defined as for aqueous-or-
ganic mixture
= ⎡
⎣
⎢
⎤
⎦
⎥
X
P L
P L
(Δ / )
(Δ / )
f w
f o
0.5
(49)
Based on the present experimental results, the correlations for ′ ′ϕw
2
and C are developed incorporating the different operating variables
which are represented as follows:
= = ′ϕ De Ca We7.594( ) 7.594( )w w w w
2 0.0398 0.0398
(50)
where ′Wew is the modified Weber number which is defined as
⎜ ⎟′ = = ⎛
⎝
⎞
⎠
We De Ca
d
r
Ca( ) Re
2
w w w w
H
c
w
(51)
and
=C De Ca4.92( )w w w
0.07912
(52)
The ranges of operating variables for the correlations [Eqs. (50) and
(52)] are < <De77.77 441.21w and × < < ×− −Ca1.01 10 5.713 10w
3 3.
The correlation satisfies the experimental data with maximum 4.7%
error with the mean deviation of 2.51. The variations of ϕw
2
and C with
the dimensionless numbers are shown in Fig. 8(a) and (b).
The predicted values from the correlations are close enough to the
experimental values. Predicted values from the present correlation are
plotted against the experimental values and represented in the Fig. 9(a)
and (b). The pressure drop data obtained from the present study were
also compared with the previous models as shown in Table 5.
The mean and root mean square deviation of the experimental
(a)
100 200 300 400 500 600
6.6
6.8
7.0
7.2
7.4
7.6
7.8
8.0
Dew
Caw
×10
5
----- Correlation (Eq. (50))
φ
2
w
(−)
Dew
,Caw
(-)
(b)
100 200 300 400 500
3.8
4.0
4.2
4.4
4.6
4.8
5.0
5.2
Dew
Caw
×10
5
---- Correlation (Eq. (52))
Cw
(-)
Dew
, Caw
(-)
Fig. 8. Variation of pressure drop parameters with dimensionless numbers in unpacked channel: (a) pressure drop multiplier and (b) Chisholm’s constant.
(a)
6.0 6.5 7.0 7.5 8.0 8.5
6.0
6.5
7.0
7.5
8.0
8.5
+3.87%
-3.68%
φw
2
-predicted(-)
φw
2
- experimental (-)
(b)
3.0 3.5 4.0 4.5 5.0 5.5 6.0
3.0
3.5
4.0
4.5
5.0
5.5
6.0
-2.58%
+4.65%
Cw
-predicted(-)
Cw
- experimental (-)
Fig. 9. Experimental and predicted value comparison: (a) Lockhart-Martinelli parameter and (b) Chisholm constant.
S. Mondal, S.K. Majumder Experimental Thermal and Fluid Science 94 (2018) 215–230
224](https://image.slidesharecdn.com/1-s2-180228185958/85/1-s2-0-s0894177718301973-main-10-320.jpg)
![Table 5
Important pressure drop models and correlations for unpacked channel.
Working fluids Correlations Geometry & Orientation Authors & Years
Water, oils,
hydrocarbons
=( ) ( ) ϕ
dP
dz m
dP
dz w
w
2
where = + +ϕ 1w
Cw
X X
2 1
2;
=C 20tt (liquid turbulent and organic turbulent)
=C 12lt (liquid laminar and organic turbulent)
=C 10tl (liquid turbulent and organic laminar)
=C 5ll (liquid laminar and organic laminar)
= ( ) ( )X /
dP
dz w
dP
dz o
, = −( ) f x(1 )
dP
dz w
w
G
dH ρW
O
2 2
2
and =( ) f x
dP
dz O
O
G
dH ρo
o
2 2
2
=fw w
16
Re
for <Re 2000w or = −
f 0.079Rew w
0.25
for >Re 2000w
=fo o
16
Re
for <Re 2000o or = −
f 0.079Reo o
0.25
for >Re 2000o
=
−
Rew
G xo dH
μw
(1 )
and =Reo
GxodH
μo
Mainly circular tubes, Horizontal Lockhart and
Martinelli (1949),
[14]
Gas-liquid and Vapor-
liquid
=( ) ( ) ϕ
dP
dz m
dP
dz w
w
2
,
= + − ⎡
⎣
⎢
− + ⎤
⎦
⎥
− − −
ϕ X Bx x x1 ( 1) (1 )w g
n
g
n
g
n2 2
2
2
2
2
2
where n = 0.2
= ( ) ( )X /
dP
dz W
dP
dz g
2 ;
If < <X0 9.5:
=B
G
55
0.5
for ⩾G 1900 kg/m2
s;
=B
G
2400
for < <G500 1900 kg/m2
s;
=B 4.8for <G 500 kg/m2
s;If < <X9.5 28: =B
YG
520
0.5 for ⩽G 600 kg/m2
s
=B
Y
21
for >G 600 kg/m2
s For >X 28: =B
X G
15,000
2 0.5
Mainly circular pipes, Horizontal Chisholm (1967), [15]
Water-air = − −C e21(1 )dH319
using the Lockhart-Martinelli model
Rectangular duct, dH = 2.08 – 8.89 mm,
Vertical upward
Mishima et al. (1993),
[17]
Refrigerants, R-12
⎜ ⎟= − ⎛
⎝
⎞
⎠
( ) f0.87Re
dp
dz m
eq w
Geqρw
dH
0.12
2
=Re ,eq
GeqdH
μw
>Re 2500eq ; = ⎡
⎣
⎢
− + ⎛
⎝
⎞
⎠
⎤
⎦
⎥
G G x x(1 )eq o o
ρw
ρo
0.5
Rectangular channel, dH = 1.56 – 2.64 mm. Yang and Webb
(1995), [66]
Water-air = − −C d21[1 exp( 0.319 )]H Mainly vertical and horizontal round tube,
also applicable in horizontal rectangular duct.
dH= 1.0 – 4.0 mm.
Mishima and Hibiki
(1996), [18]
R- 134a, R-12, and R-1
13
=( ) ( ) ϕ
dP
dz m
dP
dz w
w
2
with
= + − − +∗ϕ X Lo x x x1 (4.3 1)[ (1 ) ]w o o o
2 2 0.875 0.875 1.75
⎜ ⎟= ⎛
⎝
⎞
⎠
∗
−
Lo
σm
dH g ρw ρo
2 ( )
0.5
and =X
dP dz w
dP dz o
2 ( / )
( / )
Rectangular channel, dH = 2.397 mm,
Horizontal
Tran et al. (1999),
[23]
Water-air =C Aλ ψ Req r
eq
S
using the Lockhart-Martinelli model
=λ
μw
ρwσmdH
2
and =ψ
μwj
σm
Laminar: <Re ,Re 2000w g ; Turbulent: >Re ,Re 2000w g .
Rectangular duct, dH = 0.78 – 6.67 mm,
Horizontal
Lee and Lee (2001),
[19]
Water-R134a For laminar liquid and laminar vapor:
=C We2.16Rew w w
0.047 0.6
For laminar liquid and turbulent vapor:
=C We1.45Rew w w
0.25 0.23
and =Wew
GwdH
ρwσw
2
using the Lockhart-Martinelli model
Rectangular channel, dH = 0.349 mm,
Horizontal
Lee and Mudawar
(2005), [20]
Air-water For laminar flow region:
= − −ϕ A U gd0.2485 { /( ) } Rel c w H w
0.355 0.5 0.233 (3/8)
For turbulent flow region:
= +−
ϕ A U U U0.848 {( )/ } Rel c w g w w
0.145 0.425 (3/8)
Rectangular channel, dH = 3 – 4.5 mm,
Horizontal
Chen et al. (2007),
[25]
(continued on next page)
S. Mondal, S.K. Majumder Experimental Thermal and Fluid Science 94 (2018) 215–230
225](https://image.slidesharecdn.com/1-s2-180228185958/85/1-s2-0-s0894177718301973-main-11-320.jpg)
![values with predicted values from the available models are tabulated in
Tables 6 and 7. Percentage errors of the models with the experimental
values are also plotted as shown in Fig. 10(a) and (b).
Fig. 10(a) and (b) represent the fact that there is a wide difference
between the experimental data for ϕw
2
and C with the other available
pressure drop equations for flow through the rectangular channel which
is either straight rectangular channel or two-phase flow having one
gaseous in most of the cases. The present study consists totally different
geometries as well as different fluids like water and toluene. In this
context modification of the previous model was done. The calculated ‘
ϕw
2
’ and ‘C’ values of experimental data are compared with the available
correlations (Tables 6 and 7). From Table 6 and Fig. 10(a), it is seen that
Tran et al. model [23] is the best fit with present experimental value for
ϕw
2
. Whereas Sun and Mishima [21], Zhang et al. [22] models show
better fit for coefficient C as shown in Table 7 and Fig. 10(b). As per
newly developed correlation in this work, the present experimental
data is shown better fit with respective errors as shown in Fig. 9(a) and
(b).
The single-phase flow friction factor ( ′fs ) through the unpacked
channel can be obtained by using the Eq. (46). Similarly, the multiphase
flow friction factor ( ′fm) through the unpacked channel can be obtained
by using Eq. (47). Models available for the calculation of friction factor
for both unpacked and packed channel and their deviation from the
present values are tabulated in Table 8–11.
Calculated friction factor values from the present experiment are
compared with the available correlations which are shown in Table 9.
Churchill [32], Li and Hibiki [33] correlations are the better fit with our
present experimental data but error percentage is high enough 91.06
(Table 9).
4.2.3. Pressure drop models for flow through packed channel
Following the similar way of the unpacked channel, the correlations
were generated for the pressure drop for both single and multiphase
flows through the packed rectangular serpentine millichannel. Medium
sand was used as the packing material. The generated correlations are
as follows:
For single phase:
⎜ ⎟
⎛
⎝
⎜
⎞
⎠
⎟
⎛
⎝
⎞
⎠
= ′ = × −
d
ρ U ε
P
L
f De Ca Fr
/
Δ
2( ) 1.94 10 ( ) ( )
p
s s eff
f
s p
s p s p s p s p2 2
,
2
, ,
0.368
,
2.351
(53)
The subscript ‘ s p, ’ represents the single-phase flow through the
packed bed. The correlation coefficient and the standard error of the Eq.
(53) are 0.999 and 0.023. Various parameters for the correlation are
× < < ×( )1.845 10 3.764 10
P
L s p
5 Δ
,
5f
N/m3
; < <De1.77 11.84s p, ;
< <Ca0.00053 0.0035s p, and < <Fr0.387 3.016s p, . Eq. (53) shows the
similarity with the experimental data by maximum error 5.1%
(Fig. 11(a)).
For mixture of two phases:
⎜ ⎟
⎛
⎝
⎜
⎞
⎠
⎟
⎛
⎝
⎞
⎠
= ′ = × −
d
ρ U ε
P
L
f De Ca Fr
/
Δ
2( ) 4.419 10 ( ) ( )
p
m m eff
f
m p
m p m p m p m p2 2
,
1
, ,
0.073
,
1.694
(54)
The subscript ‘ m p, ’ represents the multiphase flow through the
packed bed. The correlation coefficient and the standard error of the Eq.
(54) are 0.999 and 0.025 respectively. The ranges of operating variables
for the correlation are × < < ×( )4.063 10 9.644 10
P
L m p
5 Δ
,
5f
N/m3
;
< <De9.866 59.697m p, ; < <Ca0.0026 0.0151m p, and <2.548
<Fr 16.640m p, . Eq. (54) shows the similarity with the experimental data
by maximum error 5.3% (Fig. 11(b)). The comparison of the
Table 5 (continued)
Working fluids Correlations Geometry & Orientation Authors & Years
Air–water, refrigerants,
CO2
For Rew < 2000 and Reg < 2000:
=( ) ( )ϕ
dp
dz m
w
dp
dz w
2
; = + +ϕ 1w
Cw
X
Cw
X
2
2 ;
= +
⎡
⎣
⎢ −
⎤
⎦
⎥
⎛
⎝
−
+ ∗
⎞
⎠( )C e26 1 1w
w Lo
Re
1000
0.153
0.8 0.27
For ⩾Rew 2000 and ⩾Reg 2000:
=( ) ( )ϕ
dp
dz m
w
dp
dz w
2
; = + +ϕ 1w
Cw
X X
2
1.19
1
2
Rectangular Channel & tube, dH = 0.506 –
12 mm, Horizontal
Sun and Mishima
(2009), [21]
Liquid-gas = − − ∗C Lo21[1 exp( 0.358/ )]
where ⎟=
⎛
⎝
⎜
⎞
⎠
∗
−
Lo d
σm
g ρw ρg
H( )
0.5
⩽ ⩽d0.014 6.25 mmH ; ⩽Re 2000w and ⩽Re 2000g
Modified the Mishima and Hibiki (1996)
correlation
Zhang et al. (2010),
[22]
Water-steam = −−
C x209.5Re (1 )m g
0.29 1.38 Rectangular channel, dH = 3.81 mm, Vertical Qin et al. (2012), [24]
Liquid-liquid (water-
toluene)
=( ) ( )ϕ ;
dp
dz m
w
dp
dz w
2
= = ′ϕ De Ca We7.594( ) 7.594( )w w w w
2 0.0398 0.0398 and
=C De Ca4.92( )w w w
0.07912
Rectangular channel, dH = 3.33 mm,
Horizontal
Present work
Table 6
Comparison of the ϕw
2
values with the other models.
Authors Mean deviation (MD)
(%)
Root mean square deviation
(RMSD) (%)
Chisholm (1967), [15] 81.01 81.07
Tran et al. (1999), [23] 37.32 38.63
Chen et al. (2007), [25] 707.09 708.25
Present correlation 2.09 2.36
Table 7
C –value comparison.
Authors Mean deviation
(MD) (%)
Root mean square deviation
(RMSD) (%)
Mishima et al. (1993), [17] 213.71 216.19
Mishima and Hibiki (1996),
[18]
99.49 99.49
Lee and Lee (2001), [19] 493.29 558.86
Lee and Mudawar (2005),
[20]
66.45 67.49
Sun and Mishima (2009),
[21]
15.28 20.51
Zhang et al. (2010), [22] 16.99 18.89
Qin et al. (2012), [24] 136.48 148.20
Present correlation 2.51 2.72
S. Mondal, S.K. Majumder Experimental Thermal and Fluid Science 94 (2018) 215–230
226](https://image.slidesharecdn.com/1-s2-180228185958/85/1-s2-0-s0894177718301973-main-12-320.jpg)
![experimental pressure drop values with the values calculated from the
present correlation (modified Ergun) are shown in Fig. 12.
The previously specified correlations for the pressure drop in packed
bed were for the generally cylindrical geometry and for a structured
column. According to our knowledge, no study has been performed till
date using rectangular serpentine packed channels. Due to the variation
in the system geometry from the present study, the pressure drop cal-
culated using the above available correlations indicates a higher de-
viation from the experimental values. But the newly generated modified
Ergun equation shows maximum 5.21% error for both single and
multiphase flow through rectangular serpentine packed channel
[Fig. 12(a), (b)].
The single phase friction factor ′f( )s p and multiphase friction factor
′f( )m p for the flow through the packed channel can be obtained by the
Eqs. (53) and (54) respectively. Different correlations for the flow
through the packed channel are represented (Table 10) and compared
with the present proposed correlation. The model proposed by Mon-
tillet et al. [41] satisfies the experimental results better with root means
square deviation error 15.14% for the multiphase flow (Table 11).
Table 8
Correlations for friction factor as per different investigators for unpacked channel.
Authors & Years Friction factor correlations Channel geometry Flow types
Fanning (1896), [37]
=f
dH Pf
ρmUmL
Δ
2 2 For rectangular serpentine channel this equation takes the form
=
+
f
rcθc
w h Pf
ρmQm h w
180
Π
3 3Δ
2 ( )
Rectangular serpentine
channel
Fully developed flow
Blasius (1913), [26] = −f 0.0791Re 0.25
where < <2000 Re 105
Circular tube as well as
Rectangular channel
Fully developed
turbulent flow
Shah and London (1978), Harnett and
Kostic (1989), Abdelall et al.
(2005), Hrnjak and Tu (2007),
[27–30]
=f λ24 /Re
Where
=
⎛
⎝
⎜
− +
− + −
⎞
⎠
⎟λ
A A
A A A
1 1.3553 1.9467
1.7012 0.9564 0.2537
C C
C C C
2
3 4 5
Rectangular channel Laminar flow
Hua and Yang (1985), [34]
= ( )f
w
rC
5
Re0.65 2
0.175
where <Re 600
Curved Microchannel Laminar flow regimes
Phillips (1990), [31] = ∗f ARe B
Where = +A 0.09290
x dH
1.01612
/
and = − −B 0.26800
x dH
0.32930
/
; For rectangular
microchannels laminar-equivalent Reynolds number
=
=
∗
+ −
Re
ρmUmdH
μm
ρmUm AC AC dH
μm
[(2 / 3) (11 / 24)(1 / )(2 1 / )]
Rectangular
microchannel
Both developing and
developed flow
regimes
Wang and Liu (2007), [35] = +f f DeRe / Re 0.96194 0.01035C S
0.78715 where
< ⩽De0 450
Curved microchannel Laminar flow regimes
Li and Hibiki (2017), [33]; Churchill
(1977), [32] ′ = ⎡
⎣⎢
+ ⎤
⎦⎥+( )f 8m m A B
8
Re
12 1
( )3/2
1/12
where
=
⎧
⎨
⎪
⎩
⎪
⎡
⎣
⎢
⎢
⎢
⎤
⎦
⎥
⎥
⎥
⎫
⎬
⎪
⎭
⎪⎜ ⎟
⎛
⎝
⎞
⎠
+
A 2.457ln
m
k
dH
1
7
Re
0.9
0.27
16
and
= ( )B
m
37530
Re
16
when ⩾Re 3000
Rectangular Channel For both laminar and
turbulent regimes
Present work For the single phase: ′ = × − −f De Ca Fr57.7 10 ( ) ( )s s s s
2 0.3743 2.2106
For the mixture phase:
′ = −f De Ca Fr4.7252( ) ( )m m m m
1.292 3.971
Rectangular serpentine
millichannel
For both laminar and
turbulent flow regimes
Table 9
Deviation of calculated friction factor values from different correlations with the present
experimental data for unpacked channel.
Authors Mean deviation (MD)
(%)
Root mean square deviation
(RMSD) (%)
Single
phase
Multi-
phase
Single
Phase
Multi-phase
Blasius (1913), [26] 98.85 97.69 98.85 97.70
Shah and London (1978),
[27]
95.18 97.81 95.19 97.81
Hua and Yang (1985), [34] 95.89 96.29 95.92 96.31
Phillips (1990), [31] – 97.52 – 97.53
Li and Hibiki (2017), [33];
Churchill (1977), [32]
– 90.85 – 91.06
Present correlation 2.48 1.47 2.94 1.73
Table 10
Important correlations for pressure drop in packed channel [62].
Authors & years Equations
Ergun (1952),
[36]
= +
− −
P μ v vΔ 150 1.75
ε L
ϕpε dp
s
ε Lρ
ϕpdpε
s
(1 )2
2 3 2
(1 )
3
2
Feng (1989),
[38]
= −
( )Re
P
L g
ρ
D
u
ε
Δ 0.106
2
0.25
2
kPa/m; =
−
D dp
ϕ
ε
2
6
2
3(1 )
Foumeny et al.
(1993), [39]
= +
−
+
−
P μ v vΔ 130
ε L
ϕpε dp
s
dH dp
dH dp
ε Lρ
ϕpdpε
s
(1 )2
2 3 2
/
0.335( / ) 2.28
(1 )
3
2
Eisfeld and
Schitzlein
(2001), [40]
= +
− −Pdp
ρvs L
Aw
p
ε
ϕpε
Aw
Bw
ε
ϕpε
Δ
2
154 2
Re
(1 )2
2 3
1
3 where = +
−
A 1w dH dp ε
2
3( / )(1 )
and = ⎡
⎣⎢
+ ⎤
⎦⎥( )B 1.15 0.87w
dp
dH
2 2
Montillet et al.
(2007), [41] ⎜ ⎟=
⎛
⎝
+ +
⎞
⎠
−
− −
( )0.061 ( ) 12
Pdp
Lρvs
ε
ε
dH
dp
p
ϕp
p
ϕp
Δ
2
1
3
0.20
1000Re 1
2
60Re 0.5
Newly developed
modified
Ergun
equation
(present
work)
⎛
⎝
⎞
⎠
= ×
⎡
⎣
⎢
⎤
⎦
⎥
⎡
⎣
⎢
⎤
⎦
⎥
−
−
−
9.51 10
Pf
L
s p
μvs ε
ϕpdpε
ρvs ε
ϕpdpε
Δ
,
4 (1 )2
2 2 3
0.468
(1 )
3
0.427
and
⎛
⎝
⎞
⎠
= ×
⎡
⎣
⎢
⎤
⎦
⎥
⎡
⎣
⎢
⎤
⎦
⎥
− −
1.895 10
Pf
L
m p
μvs ε
ϕpdpε
ρvs ε
ϕpdpε
Δ
,
4 (1 )2
2 2 3
0.155
(1 )
3
0.149
S. Mondal, S.K. Majumder Experimental Thermal and Fluid Science 94 (2018) 215–230
227](https://image.slidesharecdn.com/1-s2-180228185958/85/1-s2-0-s0894177718301973-main-13-320.jpg)
![The experimental pressure drop in the packed channel is plotted
against predicted values from available correlations, which is shown in
Fig. 13. From the Table 11 and Fig. 13, it is seen that most of the
correlation shows high deviation from the experimental data. Max-
imum deviation is 174.02% for single phase and 224.74% for multi-
phase flow. Among them, Montillet et al. [41] correlation predict closer
results with the experimental values, maximum mean 49.39% for single
phase and 12.94% for multiphase flow. On the other hand, the best
fitting expression for the single-phase flow is given by Eisfeld and
schnitzlein [40] having maximum 39.04% error.
5. Conclusions
The present study enunciates the frictional pressure drop correla-
tions available for the rectangular straight channel as well as the curved
channel. Pressure drop results from the present study are not predicted
well with the available correlation as the geometry and the flowing
fluids are different. Therefore, the new correlations are developed for
the present geometry and fluid systems based on the concept of dif-
ferent models. Based on the present work, the following conclusions can
be made:
a. Pressure drop and friction factor for both single and multiphase flow
through empty or packed rectangular serpentine channel are highly
dependent on Dean Number. The effect of Froude number is more
for multiphase flow than the single phase flow.
b. The measured single phase and multiphase frictional pressure drop
data for the flow through the rectangular serpentine channel
without packing matched well with the developed correlations with
a maximum error of ± 5%.
c. The empirical correlations for the friction factor, two-phase friction
multiplier, and the Chisholm constant also satisfied the calculated
data from the experiment for the flow through the same unpacked
channel with a maximum error of ± 5%.
d. The single and multiphase frictional pressure drop correlations for
the flow through packed bed having above specified geometry clo-
sely resembled the experimental data with a maximum error
of ± 6%.
e. Finally, the Ergun equation, used in the packed channel pressure
Table 11
Deviations of the calculated data for pressure drop from correlation with the present
experimental data for packed channel.
Authors Mean deviation (MD)
(%)
Root mean square deviation
(RMSD) (%)
Single
Phase
Multi-
phase
Single
Phase
Multi-phase
Ergun (1952), [36] 67.07 171.26 83.68 174.41
Feng (1989), [38] 50.01 93.95 55.38 99.54
Foumeny et al. (1993), [39] 63.54 136.12 79.14 139.14
Eisfeld and Schitzlein
(2001), [40]
39.04 53.02 46.85 57.25
Montillet et al. (2007), [41] 49.39 12.94 56.53 15.14
Newly developed modified
Ergun equation
(present work)
1.77 1.90 2.08 2.51
(a)
0 2 4 6 8 50 55 60 65 70
0
2
4
6
8
50
55
60
65
70
Chisholm [3]
Tran et al. [11]
Chen et al. [12]
Present correlation
(Eq. (49))
φw
2
-predicted(-)
φw
2
- experimental (-)
(b)
0 2 4 6 8 30 40 50 60 70
0
2
4
6
8
30
40
50
60
70
PredictedC-value(-)
Experimental C - value (-)
Mishima and Hibiki [18]
Mishima et al. [17]
Lee and Lee [19]
Lee and Mudawar [20]
Sun and Mishima [21]
Zhang et al. [22]
Qin et al. [24]
Present correlation (Eq. (52))
Fig. 10. Comparison of the experimental values with the models: (a) ϕw
2
value comparison and (b) C value comparison.
(a)
0.0 0.2 0.4 0.6 0.8 20.0 25.0 30.0 35.0 40.0
0.0
0.2
0.4
0.6
0.8
20.0
25.0
30.0
35.0
40.0
2.92%
-5.13%
4.29%
-4.68%
(ΔPf
/L)s
×10
-4
-predicted(N/m
3
)
(ΔPf
/L)s
×10
-4
- experimental (N/m
3
)
Packed channel
Unpacked channel
(b)
0.0 0.5 1.0 4 6 8 10
0.0
0.5
1.0
4
6
8
10
-5.30%
+4.37%
-5.08%
+3.56%
Packed channel
Unpacked channel
(ΔPf
/L)m
×10
-5
-predicted(N/m
3
)
(ΔPf
/L)m
×10
-5
- experimental (N/m
3
)
Fig. 11. Comparison of experimental and predicted pressure drop values for unpacked channel: (a) single phase flow and (b) multiphase flow.
S. Mondal, S.K. Majumder Experimental Thermal and Fluid Science 94 (2018) 215–230
228](https://image.slidesharecdn.com/1-s2-180228185958/85/1-s2-0-s0894177718301973-main-14-320.jpg)
![drop calculations has been modified. The modified Ergun equation
fits the experimental data well.
The geometry of the rectangular serpentine channel used in the
present study can be scaled up by numbering up approach. Our pro-
posed correlations based on the present experiment may be used for the
design of millichannel based multiphase unit. The present study may be
useful for further understanding of multiphase flow through milli or
microchannel based devices applied for process intensification. The
rectangular serpentine channel in packed condition is highly re-
commended for intense mixing and mass transfer at the cost of high
frictional pressure loss.
References
[1] P. Mary, V. Studer, P. Tabeling, Microfluidic droplet-based liquid-liquid extraction,
Anal. Chem. 80 (2008) 2680–2687.
[2] A.F. Seibert, J.R. Fair, Hydrodynamics and mass transfer in spray and packed liquid-
liquid extraction columns, Ind. Eng. Chem. Res. 27 (3) (1988) 470–481.
[3] F. Esmaeilzadeh, R. Lashkarboluki, M. Lashkarbolooki, A.Z. Hezave, Modeling of
spearmint oil extraction in a packed bed using sc-co2, Chem. Eng. Commun. 201 (3)
(2014) 300–322.
[4] A. Sahu, A.B. Vir, L.N.S. Molleti, S. Ramji, S. Pushpavanam, Comparison of liquid-
liquid extraction in batch systems and micro-channels, Chem. Eng. Process. 104
(2016) 190–200.
[5] C. Priest, J. Zhou, R. Sedev, J. Ralston, A. Aota, K. Mawatari, T. Kitamori,
Microfluidic extraction of copper from particle-laden solutions, Int. J. Miner.
Process. 98 (2011) 168–173.
[6] M. Darekar, K.K. Singh, S. Mukhopadhyay, K.T. Shenoy, Single-stage micro-scale
extraction: Studies with single microbore tubes and scale-up, Sep. Sci. Technol. 158
(2016) 160–170.
[7] F.H. Kriel, G. Holzner, R.A. Grant, S. Woollam, J. Ralston, C. Priest, Microfluidic
solvent extraction, stripping, and phase disengagement for high-value platinum
chloride solutions, Chem. Eng. Sci. 138 (2015) 827–833.
[8] D. Tsaoulidis, P. Angeli, Effect of channel size on mass transfer during liquid–liquid
plug flow in small scale extractors, Chem. Eng. J. 262 (2015) 785–793.
[9] E.J. Gudina, J.F.B. Pereira, R. Costa, J.A.P. Coutinho, J.A. Teixeira, L.R. Rodrigues,
Biosurfactant-producing and oil-degrading Bacillus subtilis strains enhance oil re-
covery in laboratory sand-pack columns, J. Hazard. Mater. 261 (2013) 106–113.
[10] W. Bigui, L. Jianlin, W. Gang, C. Qing, Filtration of oil from oily wastewater via
hydrophobic modified quartz sand filter medium, J. Water Reuse and Desalination,
In press (2018). doi:10.2166/wrd.2018.052.
[11] K.A. Varteressian, M.R. Fenske, Liquid-liquid extraction performance of a packed
extraction column, using continuous countercurrent operation, Ind. Eng. Chem. 28
(8) (1936) 928–933.
[12] D.H. Moorhead, D.M. Himmelblau, Optimization of operating conditions in a
packed liquid-liquid extraction column, Ind. Eng. Chem. Fundam. 1 (1) (1962)
68–72.
[13] M. Norouzi, N. Biglari, An analytical solution for dean flow in curved ducts with
rectangular cross section, Phys. Fluids 25 (053602) (2013) 1–15.
[14] R.W. Lockhart, R.C. Martinelli, Proposed correlation of data for isothermal two-
phase, two-component flow in pipes, Chem. Eng. Prog. 45 (1) (1949) 39–48.
[15] D. Chisholm, A theoretical basis for the Lockhart-Martinelli correlation for two-
phase flow, Int. J. Heat Mass Transf. 10 (12) (1967) 1767–1778.
[16] K. Moriyama, A. Inoue, H. Ohira, The thermohydraulic characteristics of twophase
flow in extremely narrow channels (the frictional pressure drop and void fraction of
adiabatic two-component two-phase flow), Trans. JSME (Ser. B) 58 (1992)
401–407.
[17] K. Mishima, T. Hibiki, H. Nishihara, Some characteristics of gas–liquid flow in
narrow rectangular ducts, Int. J. Multiphase Flow 19 (1993) 115–124.
[18] K. Mishima, T. Hibiki, Some characteristics of air-water two-phase flow in small
diameter vertical tubes, Int. J. Multiphase Flow 22 (4) (1996) 703–712.
[19] H.J. Lee, S.Y. Lee, Pressure drop correlations for two-phase flow within horizontal
rectangular channels with small heights, Int. J. Multiphase Flow 27 (2001)
783–796.
[20] J. Lee, I. Mudawar, Two-phase flow in high-heat-flux micro-channel heat sink for
refrigeration cooling applications. Part I—pressure drop characteristics, Int. J. Heat
Mass Transfer 48 (2005) 928–940.
[21] L. Sun, K. Mishima, Evaluation analysis of prediction methods for two-phase flow
pressure drop in mini-channels, Int. J. Multiphase Flow 35 (2009) 47–54.
[22] W. Zhang, T. Hibiki, K. Mishima, Correlations of two-phase frictional pressure drop
and void fraction in mini-channel, Int. J. Heat Mass Transfer 53 (2010) 453–465.
[23] T.N. Tran, M.C. Chyu, M.W. Wambsganss, D.M. France, Two-phase pressure drop of
refrigerants during flow boiling in small channels: an experimental investigation
and correlation development, Int. Conf. on Compact Heat Exchangers and
Enhancement Technology for the Process Industries, Banff, Canada, July 18-23,
1999.
[24] S.J. Qin, B.D. Chen, X. Yan, Z.J. Xiao, Y.P. Huang, Experimental investigation on
frictional pressure drop of water in vertical rectangular channel, Nucl. Eng. Des.
250 (2012) 567–572.
[25] I.Y. Chen, Y.M. Chen, J.S. Liaw, C.C. Wang, Two-phase frictional pressure drop in
small rectangular channels, Exp. Therm Fluid Sci. 32 (2007) 60–66.
[26] P.R.H. Blasius, The similarity law in the case of reimbursement in fluids, research
Issue 131 (1913) pp. 1- 41.
[27] R.K. Shah, A.L. London, Laminar flow forced convection in ducts, Academic Press,
New York, Advances in heat transfer supplement, 1978.
[28] J.P. Harnett, M. Kostic, Heat transfer to Newtonian and non-Newtonian fluids in
rectangular ducts, Adv. Heat Transf. 19 (1989) 247–356.
0 2 4 6 8 10 12
0
2
4
6
8
10
12
Montillet Correlation for multiphase [27]
Foumeny Correlation for multiphase [25]
Eisfeld Correlation for multiphase [26]
Ergun Correlation ×10-1 for multiphase [23]
Modified Ergun correlation multiphase [Eq. (54)]
Montillet Correlation for single phase [27]
Foumeny Correlation for single phase [25]
Eisfeld Correlation for single phase [26]
Ergun Correlation for single phase [23]
Modified Ergun correlation single phase
[Eq. (53)]
(ΔPf
/L)p
×10
-5
-predicted(N/m
3
)
(ΔPf
/L)p
× 10
-5
- experimental (N/m
3
)
Fig. 13. Variation of the experimental values with the models in packed channel.
(a)
1.5 2.0 2.5 3.0 3.5 4.0
1.5
2.0
2.5
3.0
3.5
4.0
+3.11%
(ΔPf
/L)s,p
×10
-5
-Ergunpredicted(N/m
3
)
(ΔPf
/L)s,p
×10
-5
- experimental (N/m
3
)
-4.92%
(b)
4 5 6 7 8 9 10
4
5
6
7
8
9
10
-5.21%
+4.90%
(ΔPf
/L)m,p
×10
-5
-Ergunpredicted(N/m
3
)
(ΔPf
/L)m,p
×10
-5
- experimental (N/m
3
)
Fig. 12. Comparison of experimental and modified Ergun pressure drop values for packed channel: (a) single phase flow and (b) multiphase flow.
S. Mondal, S.K. Majumder Experimental Thermal and Fluid Science 94 (2018) 215–230
229](https://image.slidesharecdn.com/1-s2-180228185958/85/1-s2-0-s0894177718301973-main-15-320.jpg)
![[29] F.F. Abdelall, G. Hahn, S.M. Ghiaasiaan, S.I. Abdel-Khalik, S.S. Jeter, M. Yoda,
D.L. Sadowski, Pressure drop caused by abrupt flow area changes in small channels,
Exp. Therm Fluid Sci. 29 (2005) 425–434.
[30] P. Hrnjak, X. Tu, Single phase pressure drop in microchannels, Int. J. Heat Fluid
Flow 28 (2007) 2–14.
[31] R.J. Phillips, Microchannel heat sinks, Advances in Thermal Modeling of Electronic
Components and Systems, Hemisphere Publishing Corporation, New York, NY,
1990 Chapter 3.
[32] S.W. Churchill, Friction-factor equation spans all fluid-flow regimes, Chem. Eng. 84
(1977) 91–92.
[33] X. Li, T. Hibiki, Frictional pressure drop correlation for two-phase flows in mini and
micro single-channels, Int. J. Multiphase Flow 90 (2017) 29–45.
[34] S.Z. Hua, X.N. Yang, Actual Fluid Friction Manual, National Defense Industry Press,
Beijing, 1985, p. 269.
[35] L. Wang, F. Liu, Forced convection in slightly curved microchannels, Int. J. Heat
Mass Transfer 50 (2007) 881–897.
[36] S. Ergun, Fluid flow through packed columns, Chem. Eng. Prog. 89 (1952) 89–94.
[37] W.L. McCabe, J.C. Smith, P. Harriott, Unit operations of Chemical Engineering,
Seventh edition, The McGraw-Hill Companies Inc, New York, 2005, pp. 165–166.
[38] B.H. Feng, Handbook of Chemical Engineering vol. 3, (1989) 13.
[39] E.A. Foumeny, J.A. Benyahia, J.A. Castro, H.A. Moallem, S. Rashani, Correlations of
pressure drop in packed beds taking into account the effect of the confirming wall,
Int. J. Heat Mass Transfer 36 (1993) 536–540.
[40] B. Eisfeld, K. schnitzlein, The influence of confining walls on the pressure drop in
packed beds, Chem. Eng. Sci. 56 (2001) 4321–4329.
[41] A. Montillet, E. Akkari, J. Comiti, About a correlating equation for predicting
pressure drops through packed beds of spheres in a large range of Raynolds num-
bers, Chem. Eng. Proc. 46 (2007) 329–333.
[42] J.J. Martin, An example of engineering analysis, Michigan (1974) 138–140.
[43] B.D. Woods, T.J. Hanratty, Influence of Froude number on physical processes de-
termining frequency of slugging in horizontal gas–liquid flows, Int. J. Multiph. Flow
25 (1999) 1195–1223.
[44] H.Y. Kuntoro, A.Z. Hudaya, O. Dinaryanto, Deendarlianto, Indarto, Experimental
study of the interfacial waves in horizontal stratified gas-liquid two-phase flows by
using the developed image processing technique, 10th Int. Forum on Strategic
Technology, Indonesia, June 3 - 5, 2015.
[45] J.Y. Sun, W.P. Jepson, U. Ohio, Slug flow characteristics and their effect on cor-
rosion rates in horizontal oil and gas pipelines, SPE 24787 (1992) 215–228.
[46] R. Rautenbach, T. Katz, Common fundamentals and unit operations in thermal
desalination systems - volume I, Eolss PublishersCo., United Kingdom, 2010
[47] C.T. Crowe, Multiphase Flow Handbook, CRC Press, Florida, United States, 2005.
[48] Y. Zhao, G. Chen, Q. Yuan, Liquid-liquid two-phase flow patterns in a rectangular
microchannel, AlChE J. 52 (12) (2006) 4052–4060.
[49] S.K.R. Cherlo, S. Kariveti, S. Pushpavanam, Experimental and numerical in-
vestigations of two-phase (liquid-liquid) flow behavior in rectangular micro-
channels, Ind. Eng. Chem. Res. 49 (2010) 893–899.
[50] D. Tsaoulidis, V. Dore, P. Angeli, N.V. Plechkova, K.R. Seddon, Flow patterns and
pressure drop of ionic liquid–water two-phase flows in microchannels, Int. J.
Multiphase Flow 54 (2013) 1–10.
[51] A.W. Cense, S. Berg, The viscous-capillary paradox in 2-phase flow in porous media,
International Symposium of theSociety of Core Analysts, Noordwijk, Netherlands,
Sept. 27-30, 2009.
[52] M.N. Kashid, I. Gerlach, S. Goetz, J. Franzke, J.F. Acker, F. Platte, D.W. Agar,
S. Turek, Internal circulation within the liquid slugs of a liquid-liquid slug-flow
capillary microreactor, Ind. Eng. Chem. Res. 44 (2005) 5003–5010.
[53] Y. Chaoqun, Z. Yuchao, Y. Chunbo, D. Minhui, D. Zhengya, C. Guangwen,
Characteristics of slug flow with inertial effects in a rectangular microchannel,
Chem. Eng. Sci. 95 (2013) 246–256.
[54] R. Olimans, Two phase flow in gas-transmission pipelines, ASME paper 76-Pet-25,
Petroleum Division ASME meeting, Mexico, September 19–24 (1976).
[55] G. Bakker, D. Handbuch, Experimentalphysik Vol. 6 Akademisohe Verlags-
Gesellschaft, Leipzig, 1928.
[56] J.E. Verschaffelt, Bull. Classe Sei. Acad., Roy. Belg., (1936) 22, 373, 390, 402.
[57] E.A. Guggenheim, Thermodynamics, North-Holland Publishing Co., Amsterdam,
1957.
[58] J.G. Eberhart, The surface tension of binary liquid mixtures, J. Phys. Chem. 70
(1966) 1183–1186.
[59] R.P. Zou, A.B. Yu, The packing of spheres in a cylindrical container: the thickness
effect, Chem. Eng. Sci. 50 (1995) 1504–1507.
[60] A. Klerk, Voidage variation in packed beds at small column to particle diameter
ratio, AICHE J. 49 (2003) 2022–2029.
[61] D.A. Morris, A.I. Johnson, Summary of hydrologic and physical properties of rock
and soil materials as analyzed by the Hydrologic Laboratory of the U.S. Geological
Survey, U.S. Geological Survey Water-Supply Paper 1839-D (1967) pp. 42.
[62] A.M. Ribeiro, P. Neto, C. Pinho, Mean porosity and pressure drop measurements in
packed beds of monosized spheres: side wall effects, Int. Rev. Chem. Eng. 2 (2010)
40–46.
[63] W.C. Krumbein, L.L. Sloss, Stratigraphy and Sedimentation, 2nd Edition, W.H.
Freeman and Company, San Francisco, 1963.
[64] G.C. Cho, J. Dodds, J.C. Santamarina, Particle shape effects on packing density,
stiffness and strength: natural and crushed sands, J. Geotech. Geoenviron. 132 (5)
(2006) 591–602.
[65] R.J. Moffat, Describing the uncertainties in experimental results, Exp. Therm. Fluid
Sci. 1 (1988) 3–17.
[66] C.Y. Yang, R.L. Webb, Friction pressure drop of R-12 in small hydraulic diameter
extruded aluminium tubes with and without micro-fins, Int. J. Heat Mass Transfer
39 (1996) 801–809.
Web References
[67] https://en.wikipedia.org/wiki/Dimensionless_numbers_in_fluid_mechanics
[68] https://www.scribd.com/doc/35548819/USGS-Wentworth-Grain-Size-Chart#
download
[69] http://www.informit.com/articles/article.aspx?p=1626870&seqNum=2
[70] http://www.geotechdata.info/parameter/soil-porosity.html
[71] http://fekete.com/SAN/TheoryAndEquations/HarmonyTheoryEquations/Content/
HTML_Files/Reference_Material/Calculations_and_Correlations/Pressure_Loss_
Calculations.htm#Multi-Phase_Flow
[72] http://14.139.172.204/nptel/CSE/Web/103105058/mod2lec5.html
[73] https://www.google.co.in/url?sa=t&rct=j&q=&esrc=s&source=web&cd=14&
ved=0ahUKEwitpara7tDYAhVJu48KHZUzBXEQFghgMA0&url=https%3A%2F
%2Fpublicwiki.deltares.nl%2Fdownload%2Fattachments%2F4521988%2FUSM_
WSUD_paper_0129.pdf%3Fversion%3D1%26modificationDate
%3D1277126408000&usg=AOvVaw37ZnUyiPkV3t5xmAJvztag
S. Mondal, S.K. Majumder Experimental Thermal and Fluid Science 94 (2018) 215–230
230](https://image.slidesharecdn.com/1-s2-180228185958/85/1-s2-0-s0894177718301973-main-16-320.jpg)

This research investigates the pressure drop characteristics of both single-phase and aqueous-organic two-phase flow through rectangular serpentine millichannels, focusing on the use of packed and unpacked configurations. Experimental results are presented alongside empirical models aimed at predicting pressure drop and friction factors based on various operating conditions. The findings are significant for enhancing the understanding and design of multiphase systems in microfluidic applications, particularly for extraction processes in chemical and pharmaceutical industries.


