Download to read offline

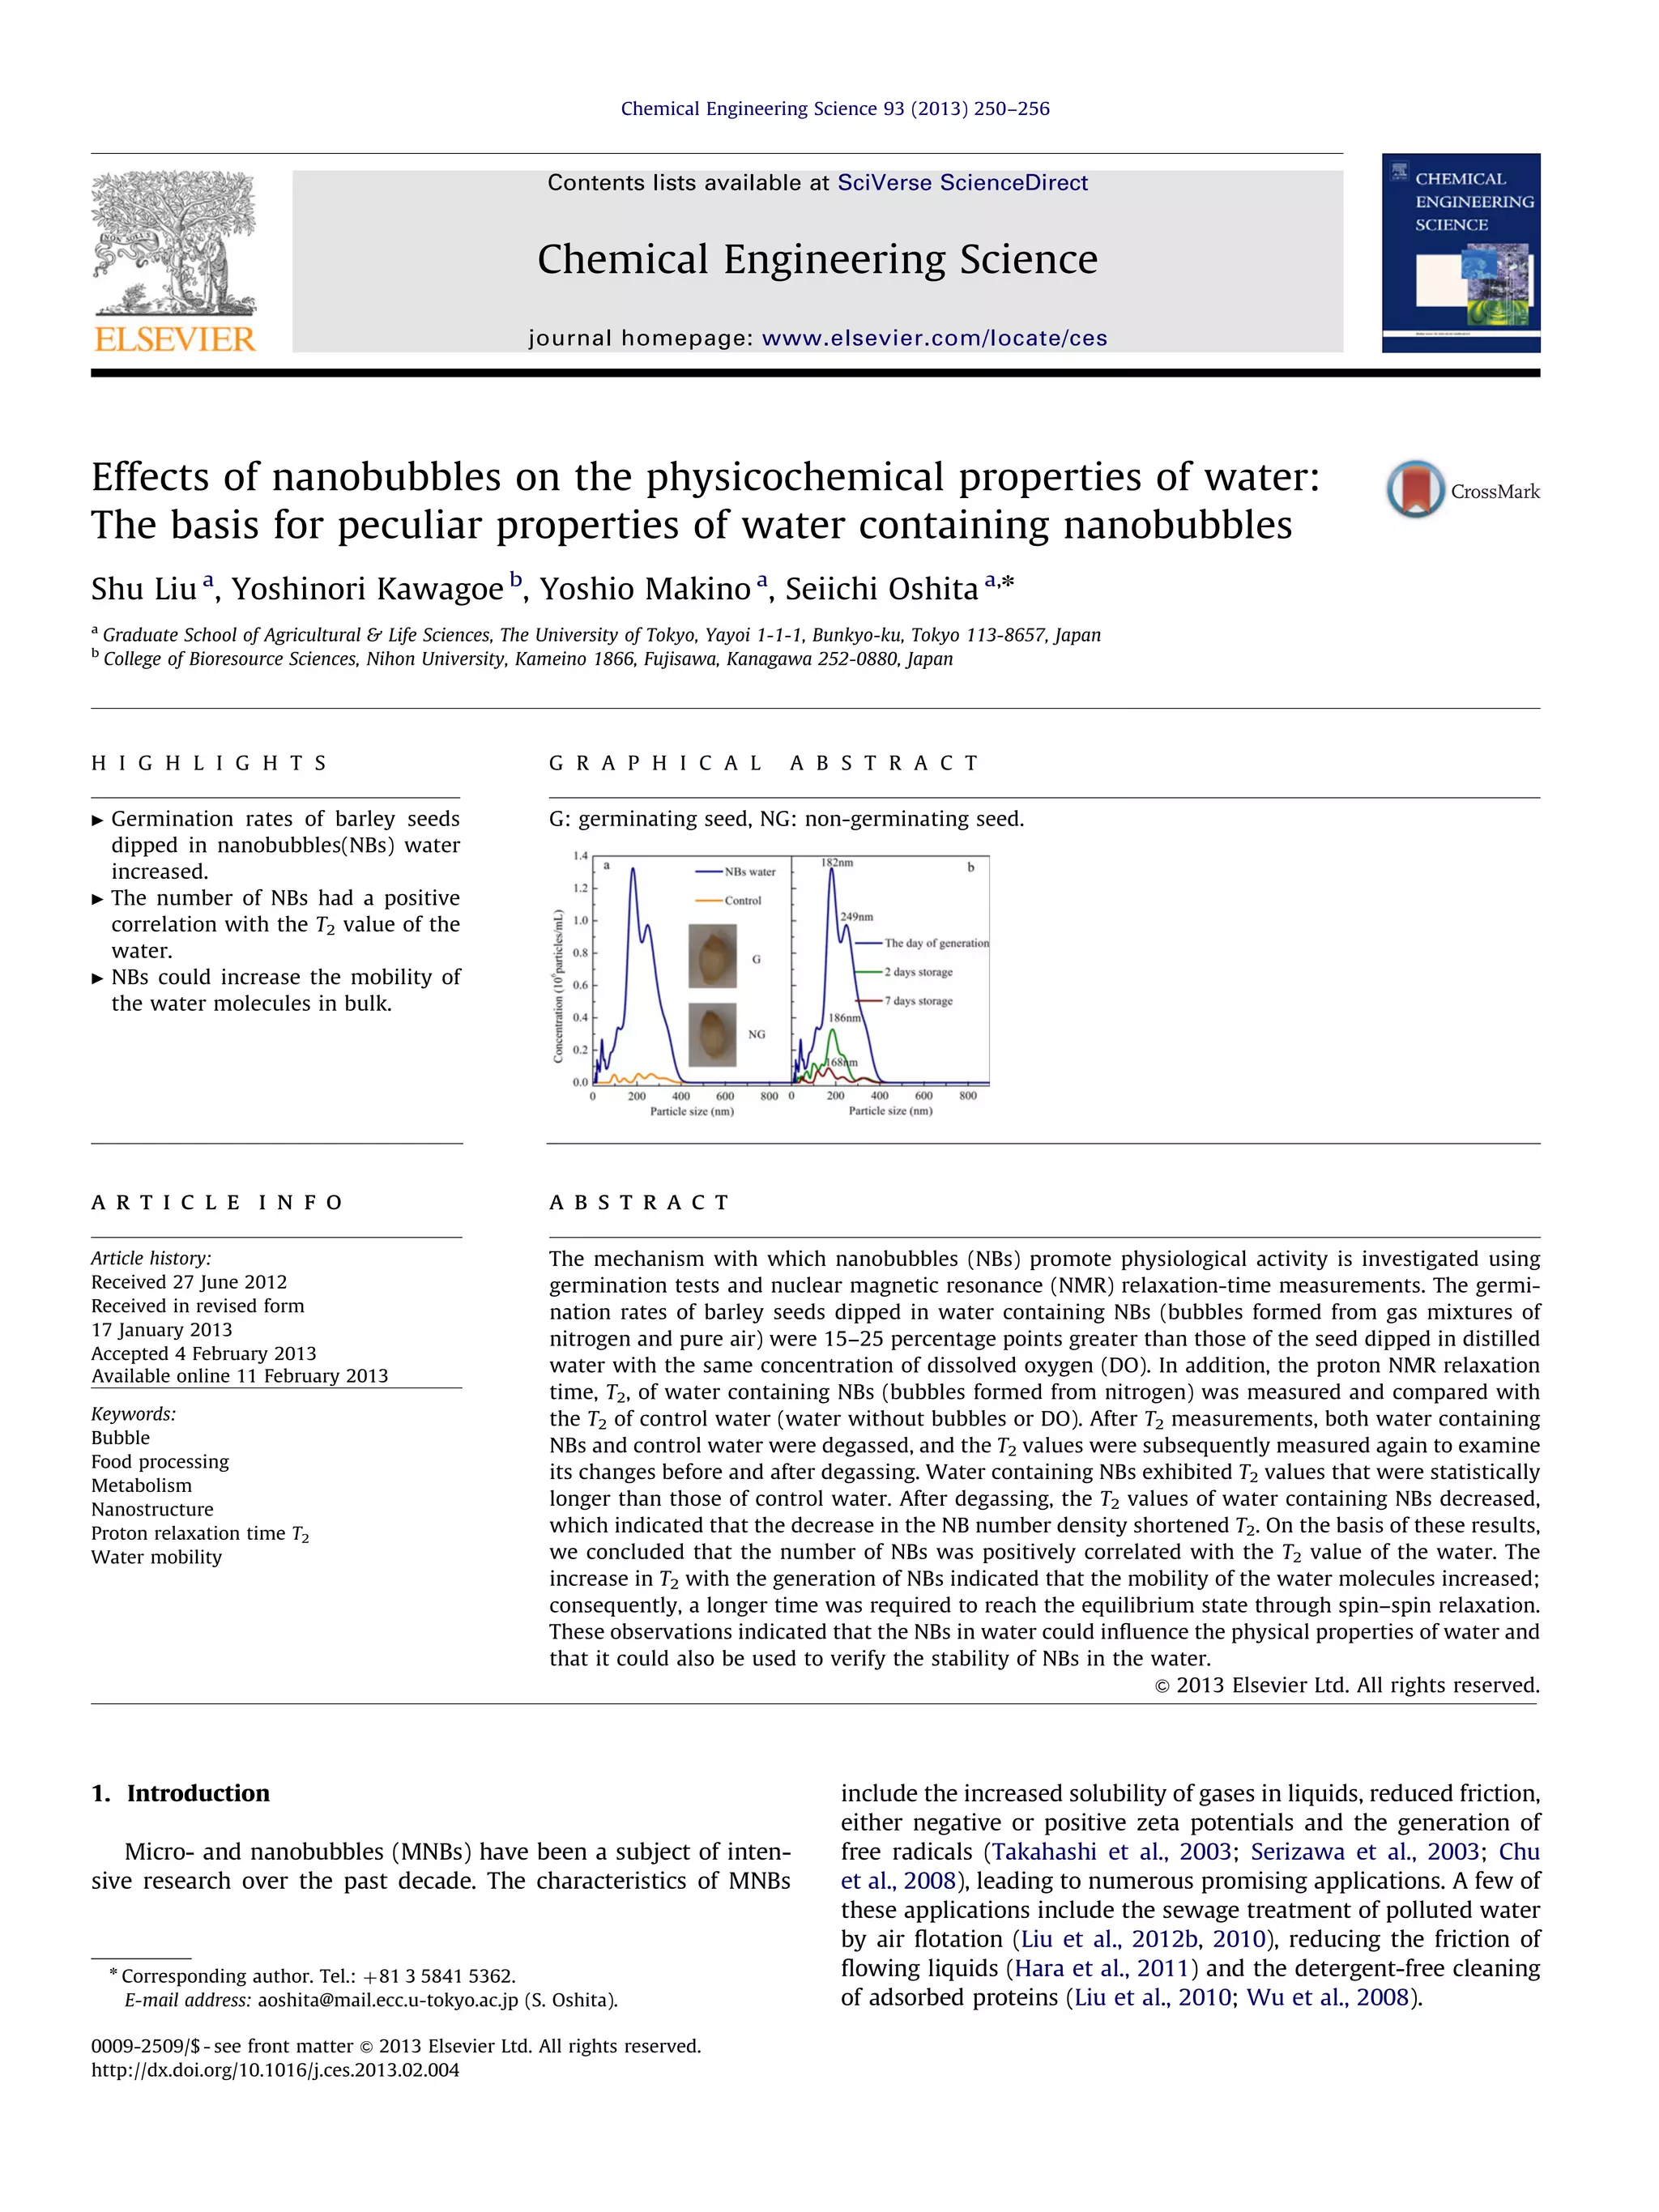
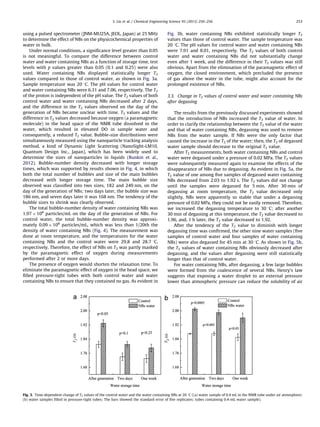
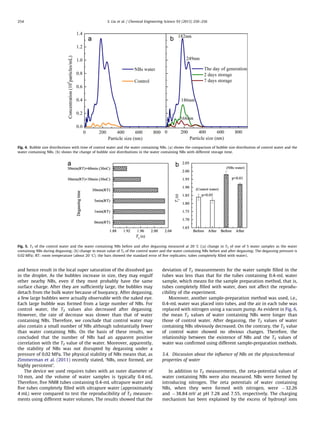
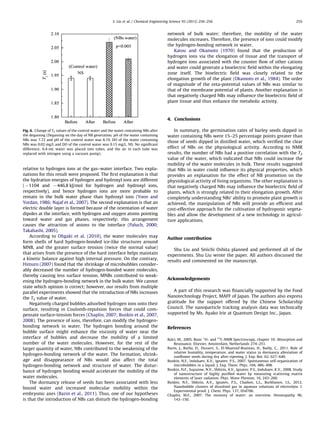

This document investigates the effects of nanobubbles (nbs) on the physicochemical properties of water and their impact on seed germination, specifically barley seeds. The study found that water containing nbs significantly improved germination rates by 15-25 percentage points compared to distilled water, and measured longer proton NMR relaxation times (T2), indicating enhanced molecular mobility. The research suggests that the presence of nbs influences the physical properties of water, thereby promoting physiological activities in seeds.