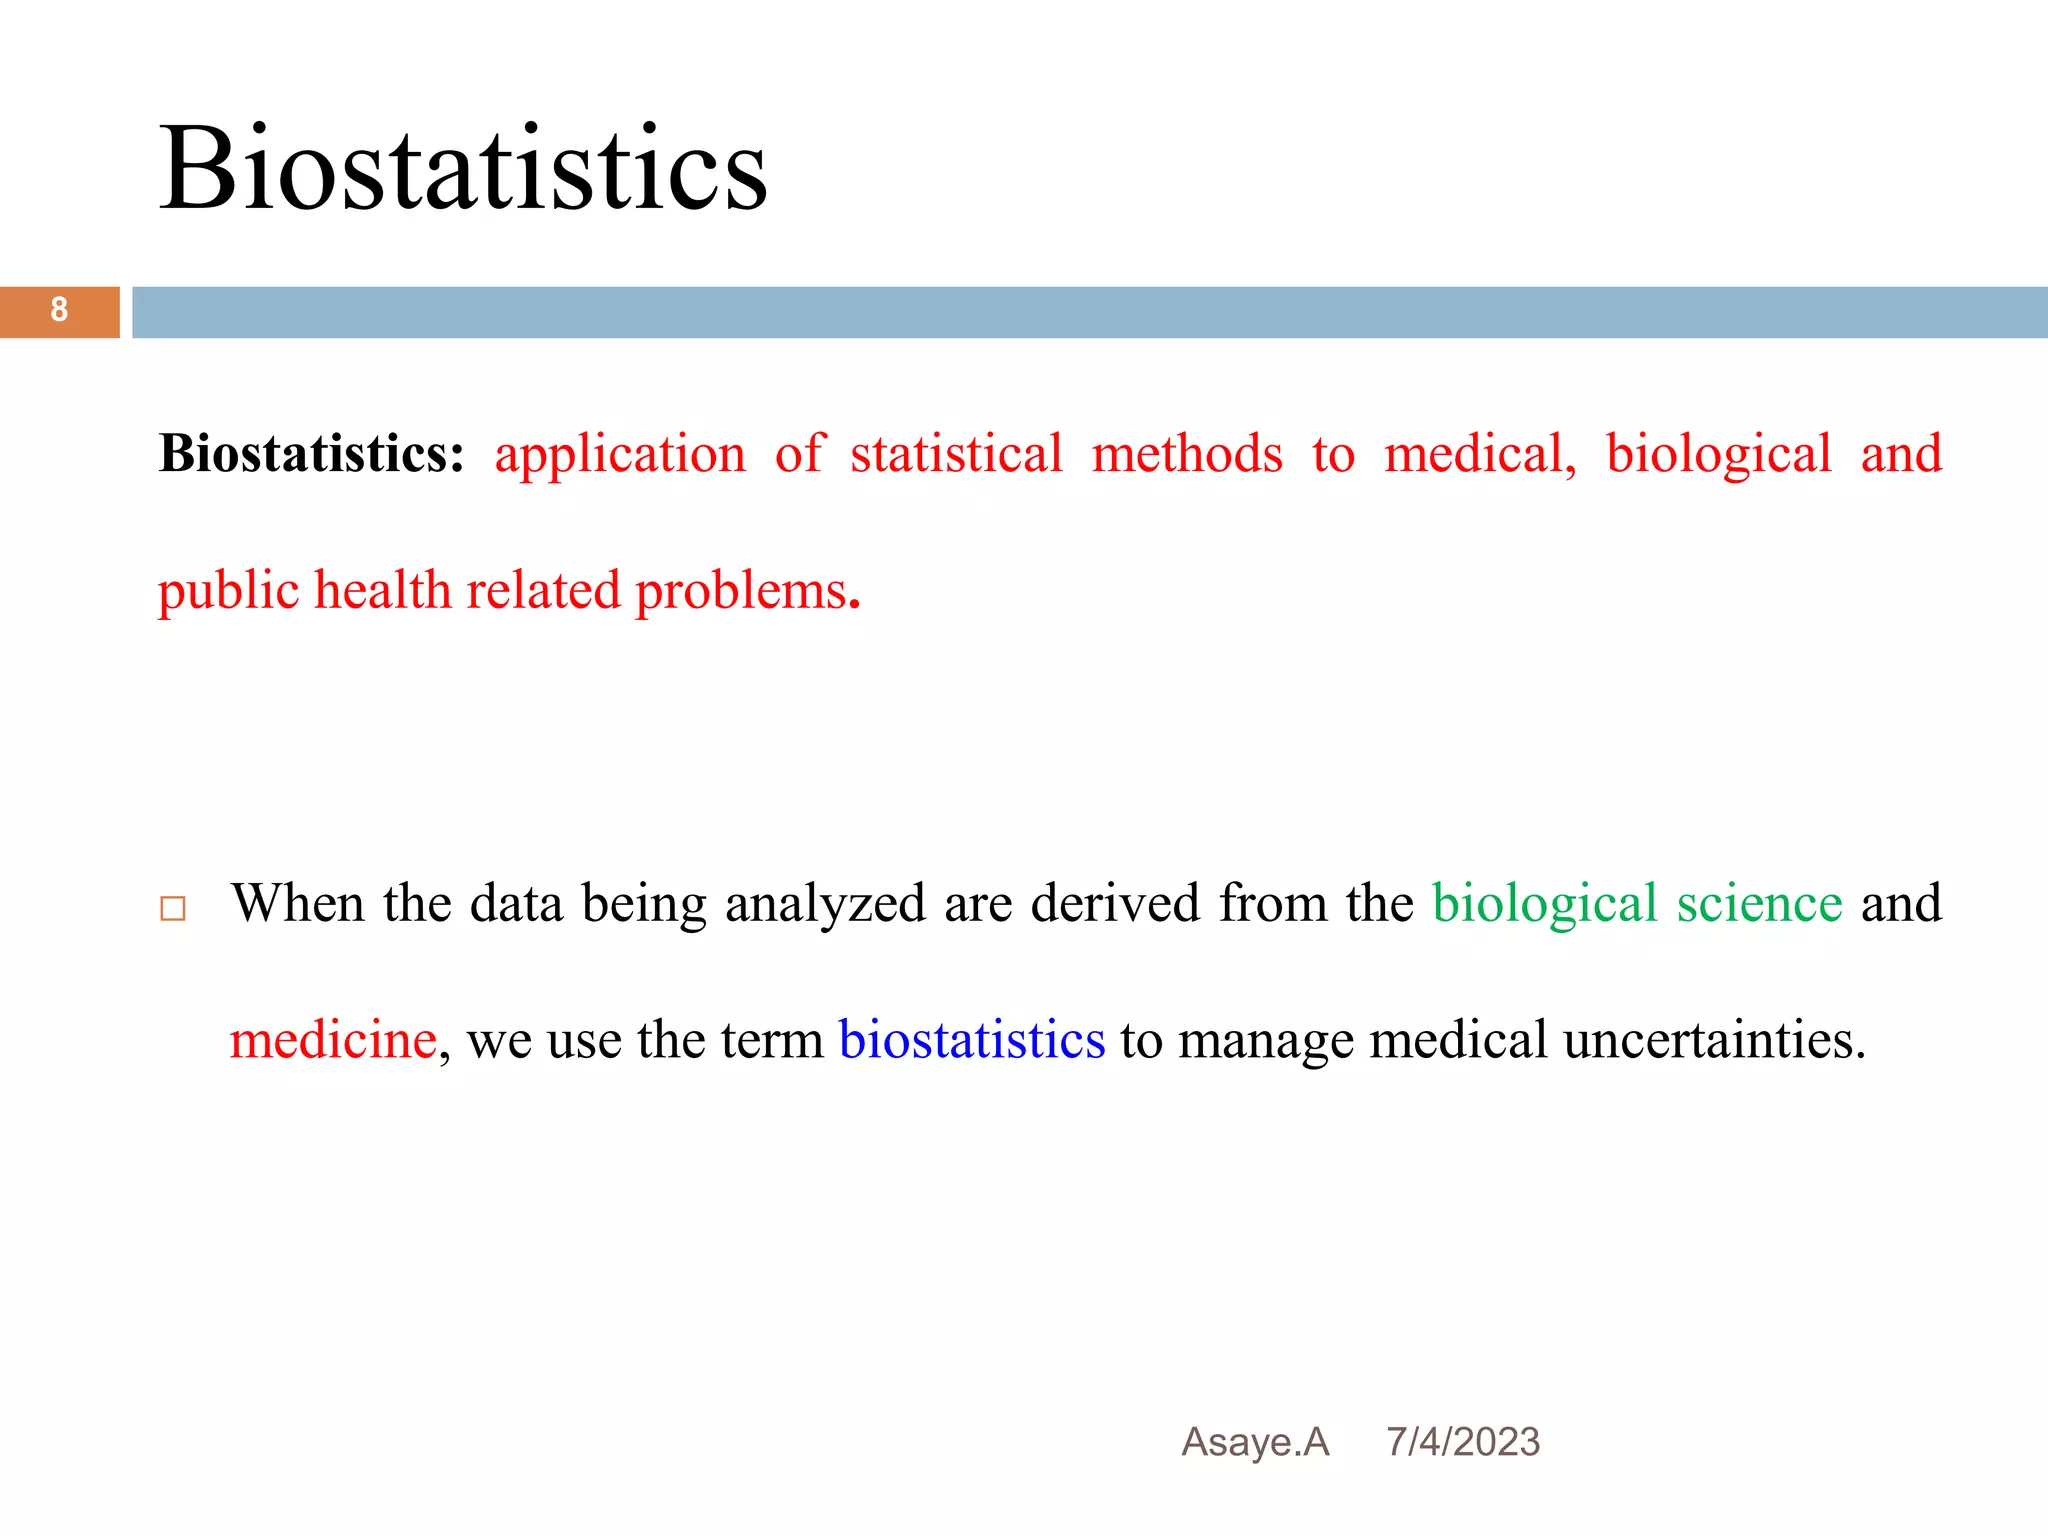
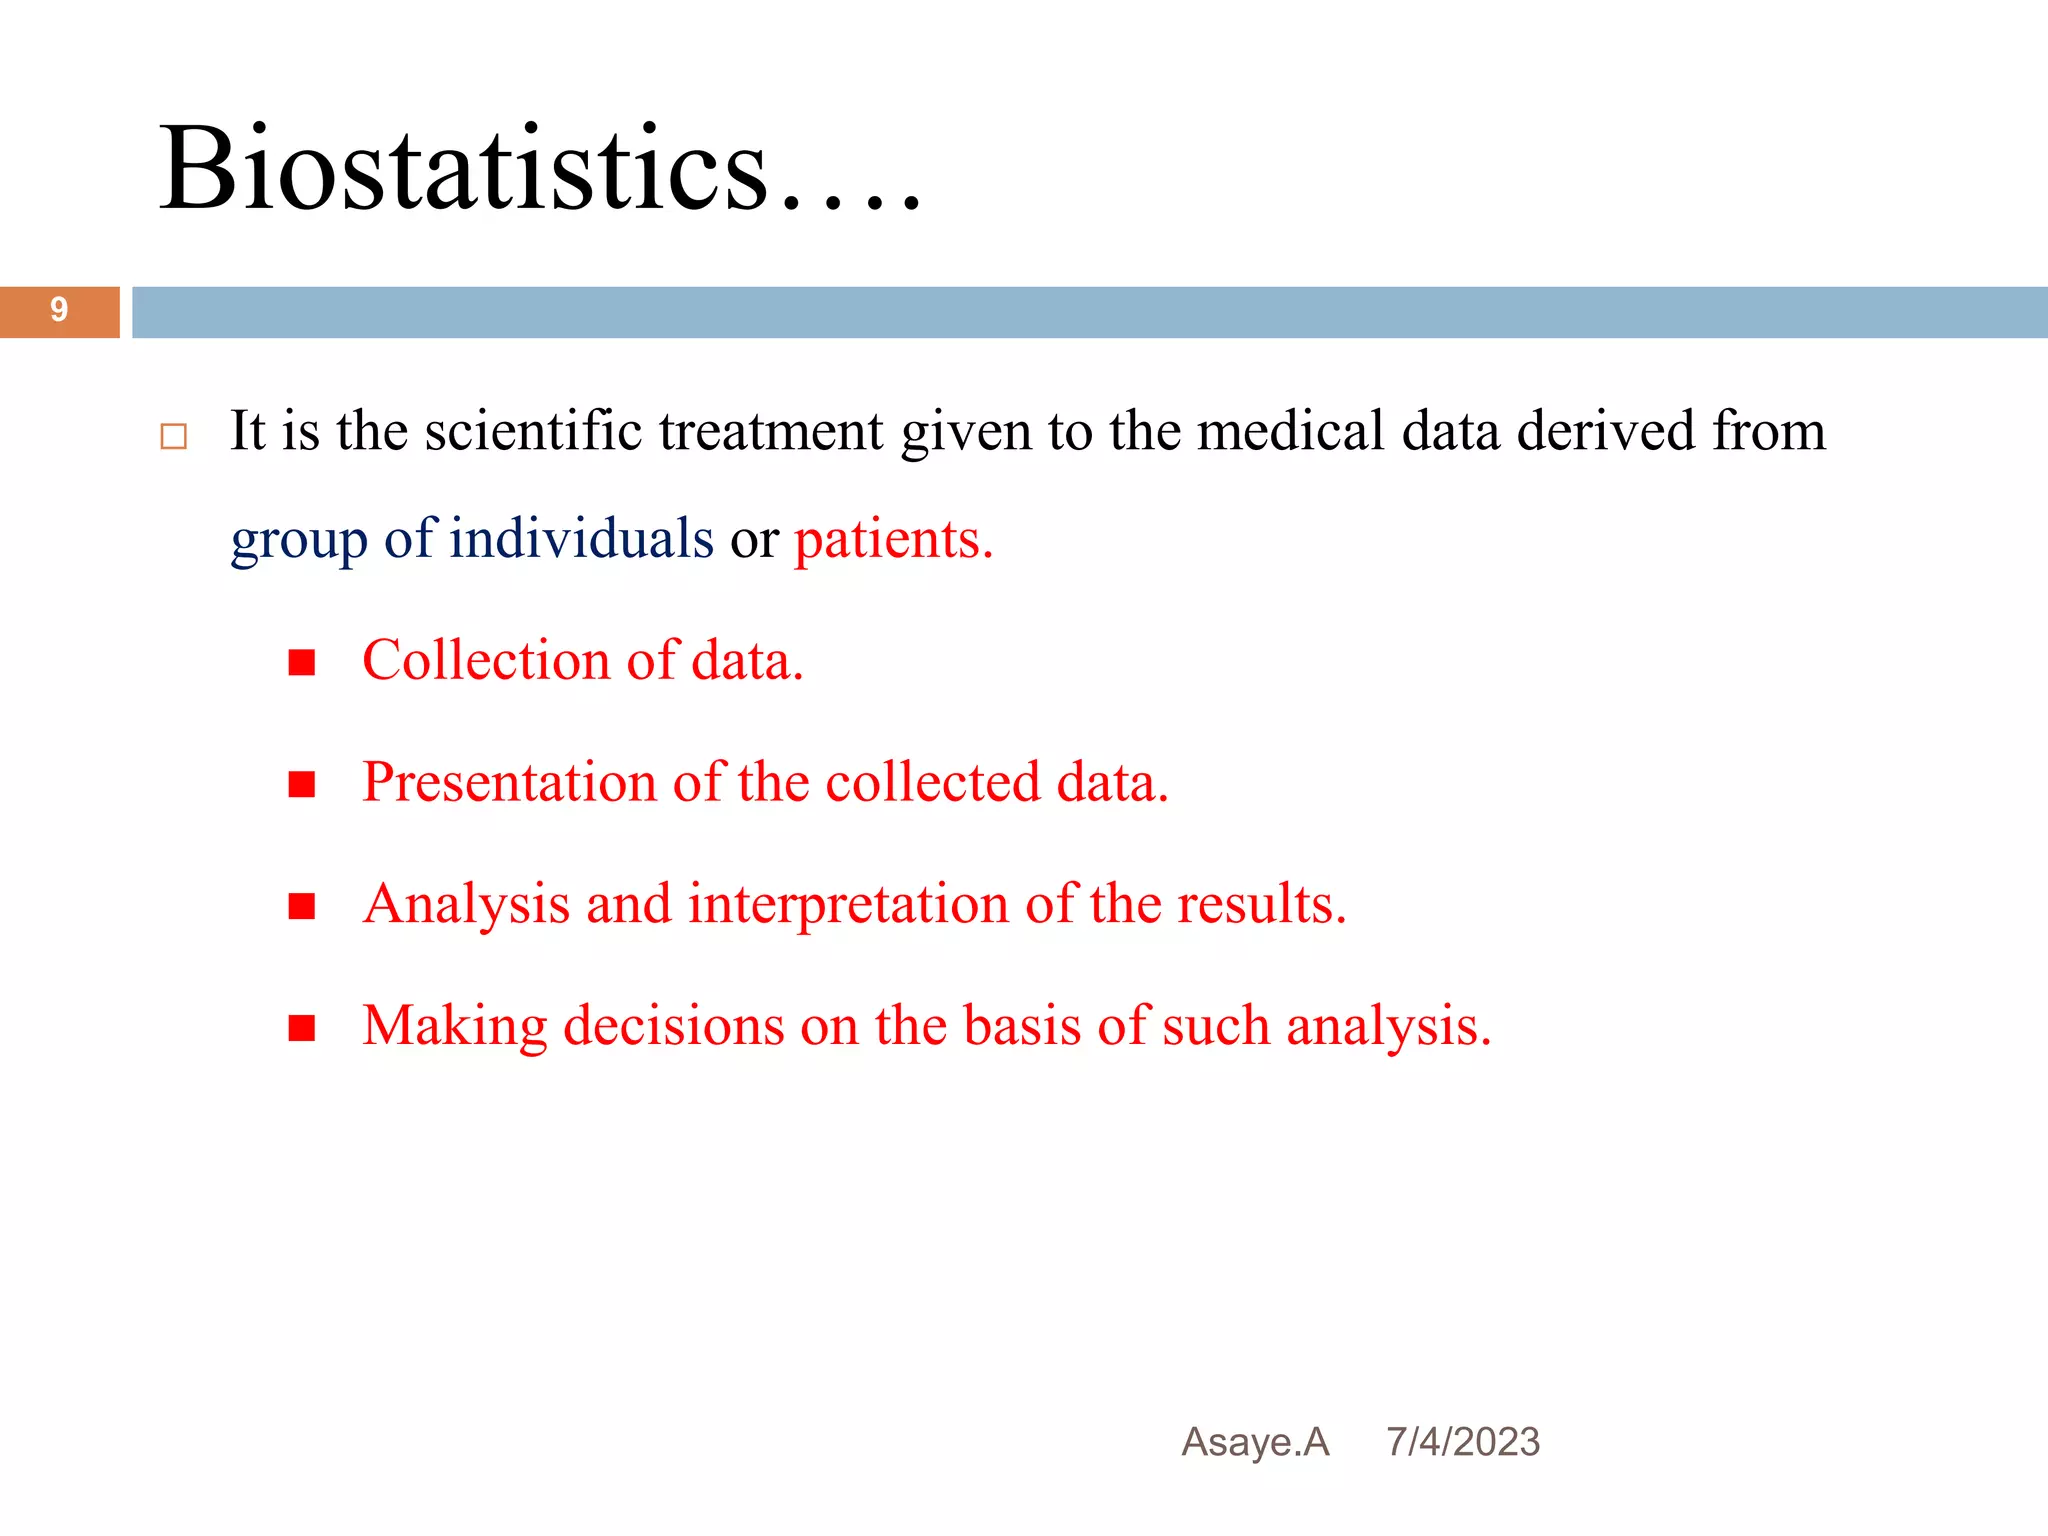
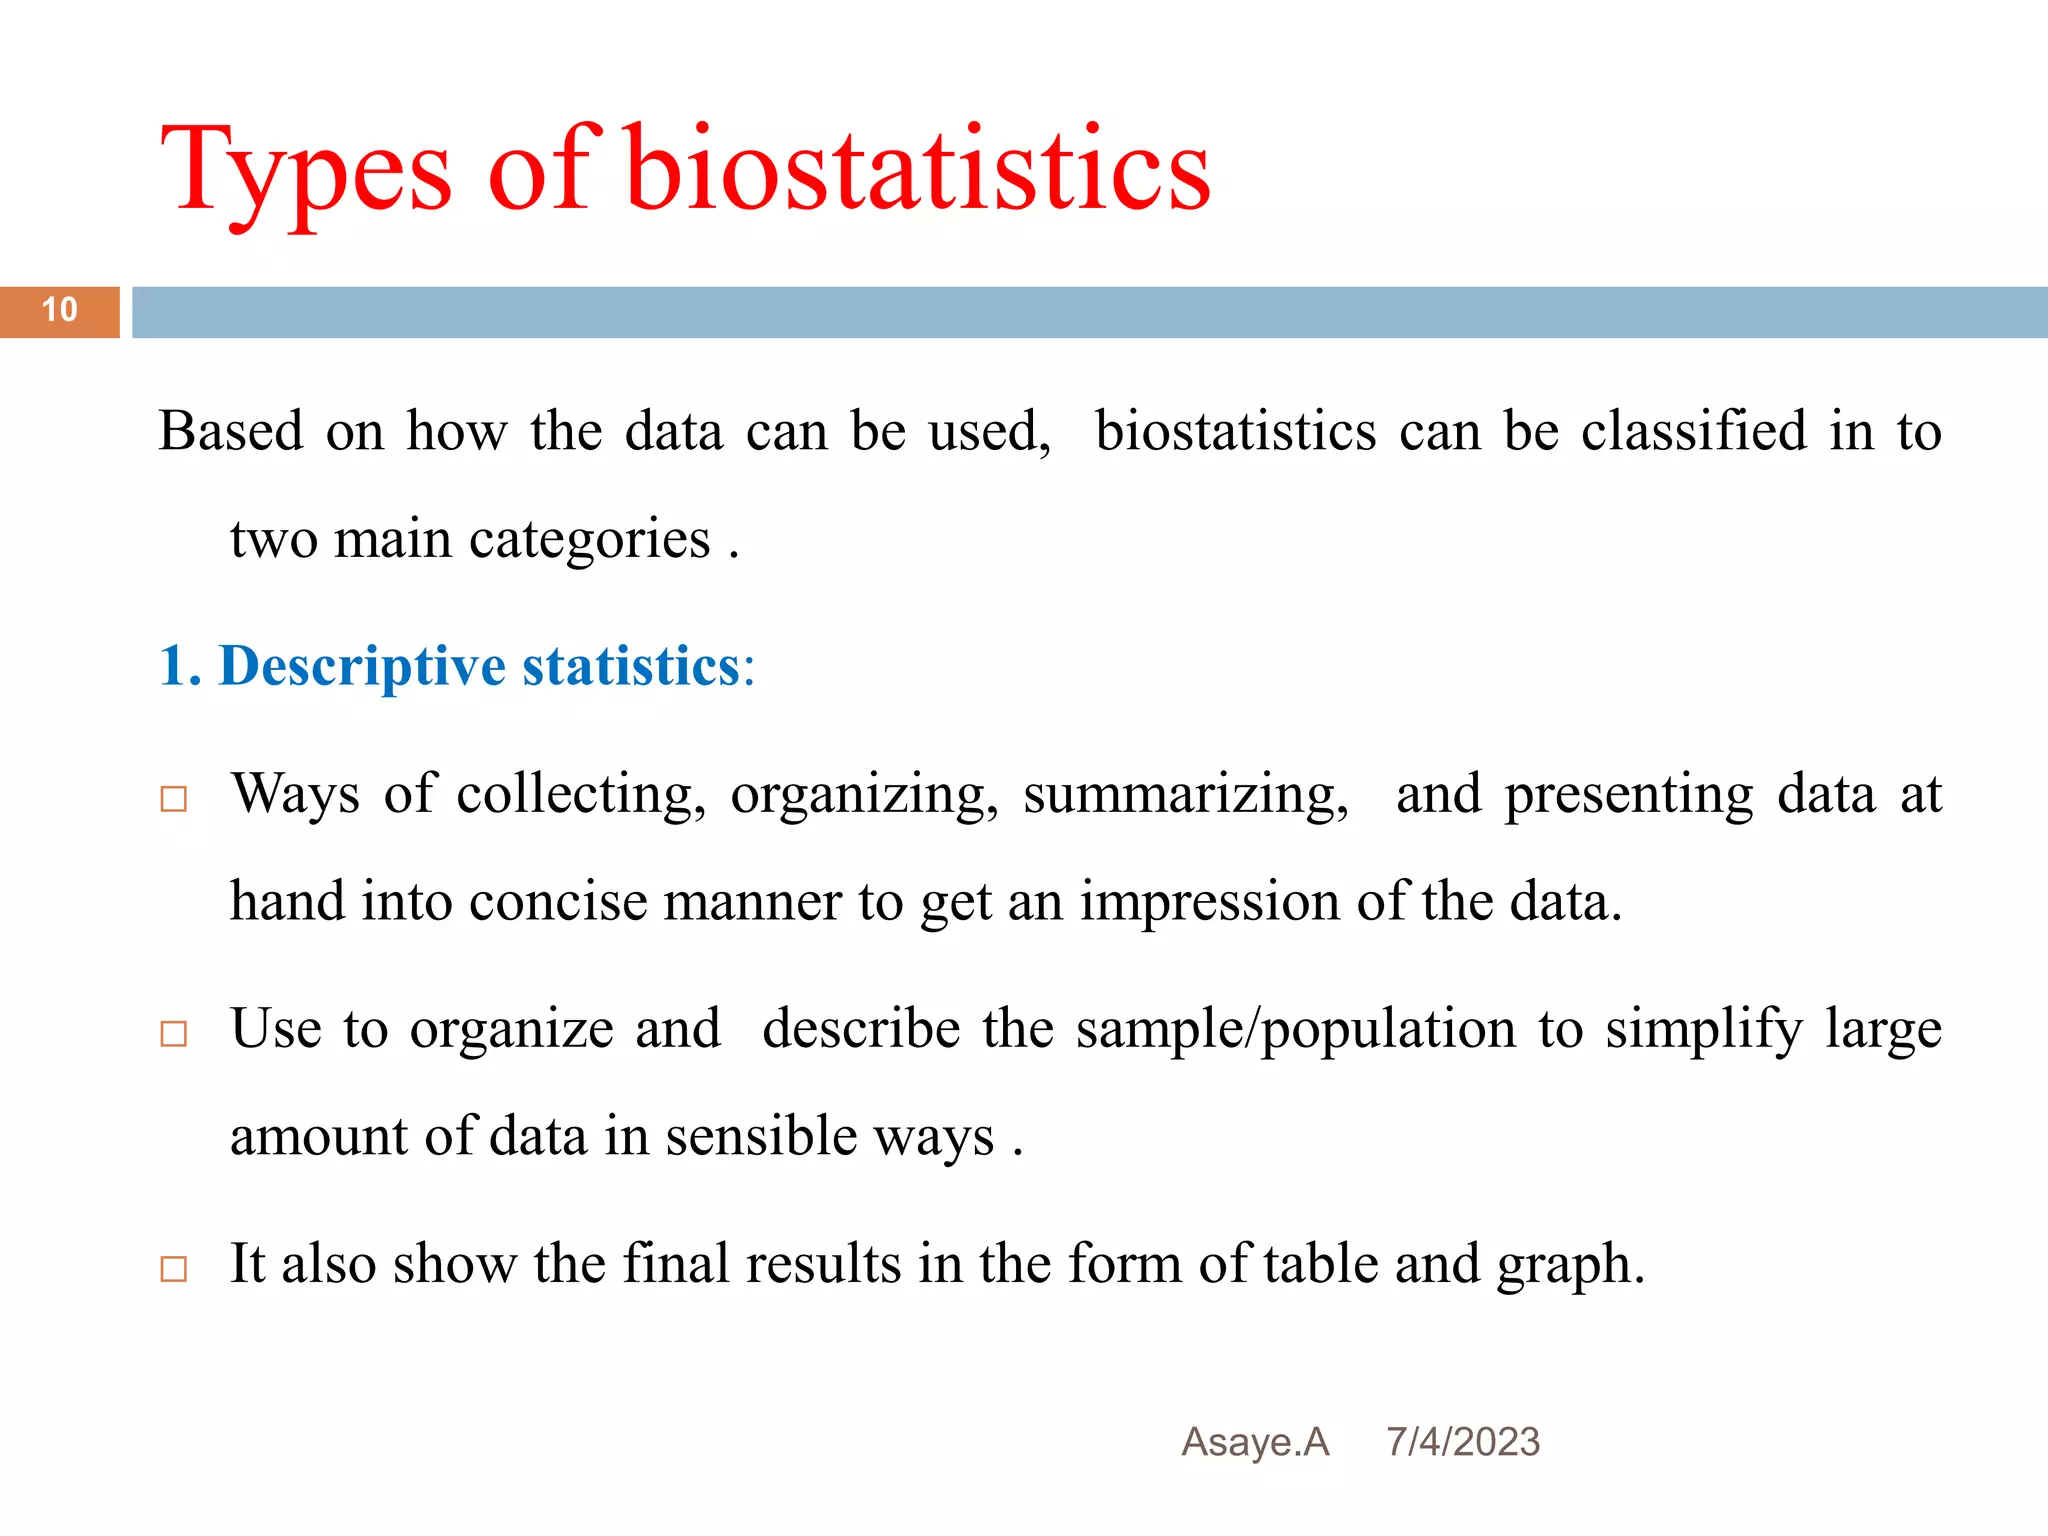
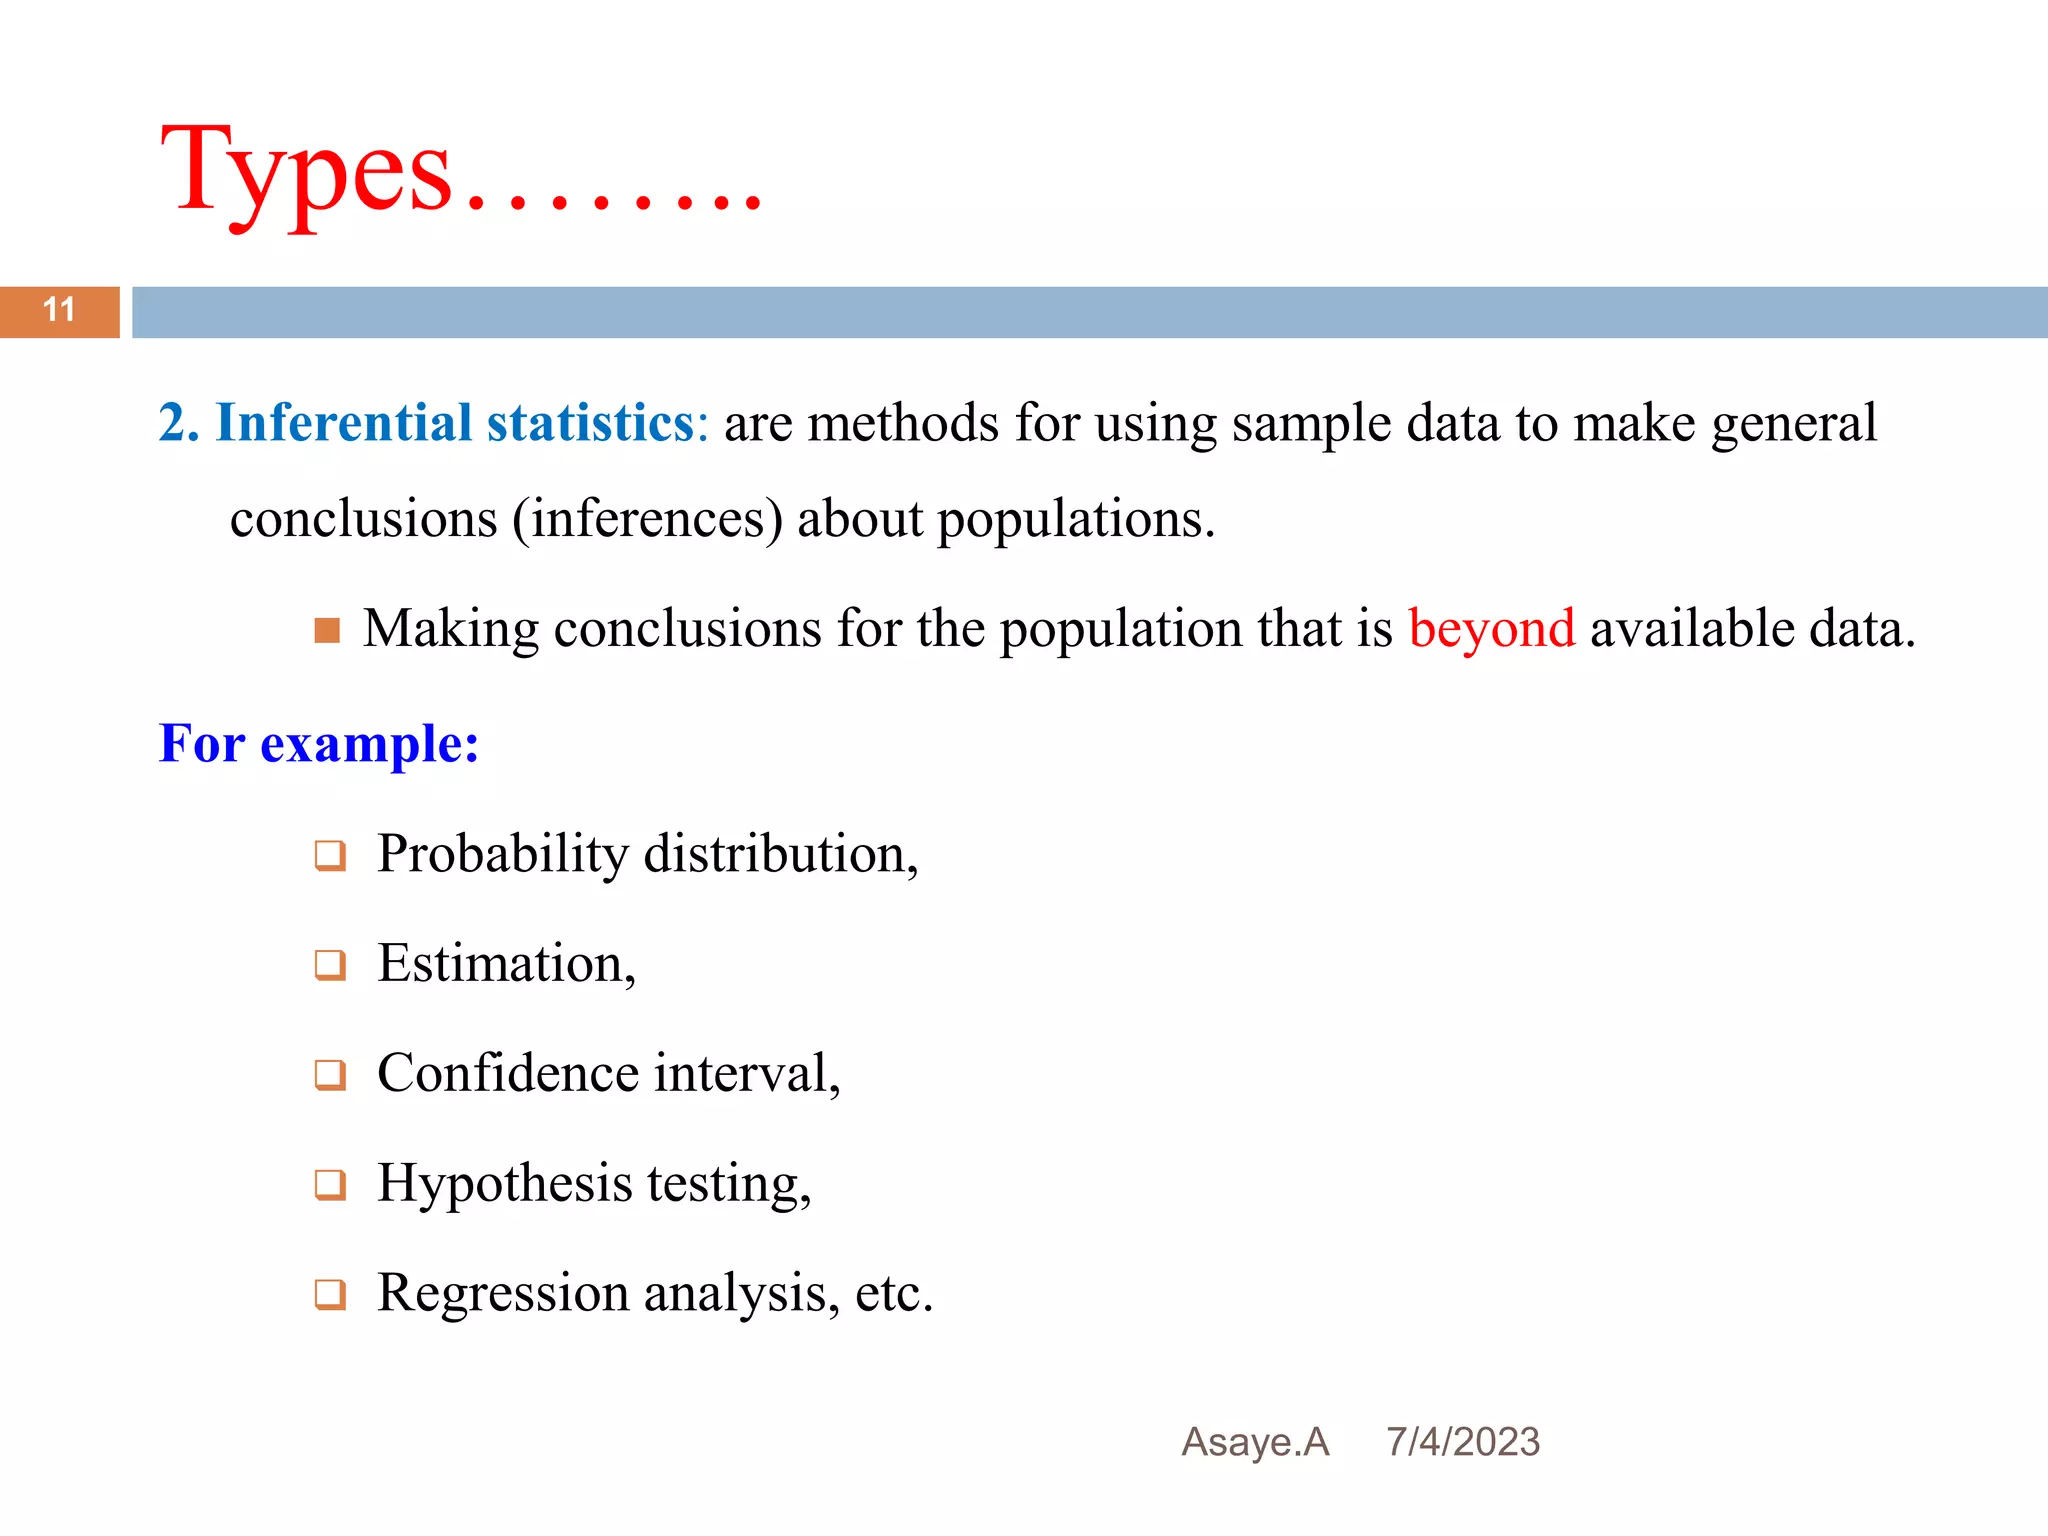
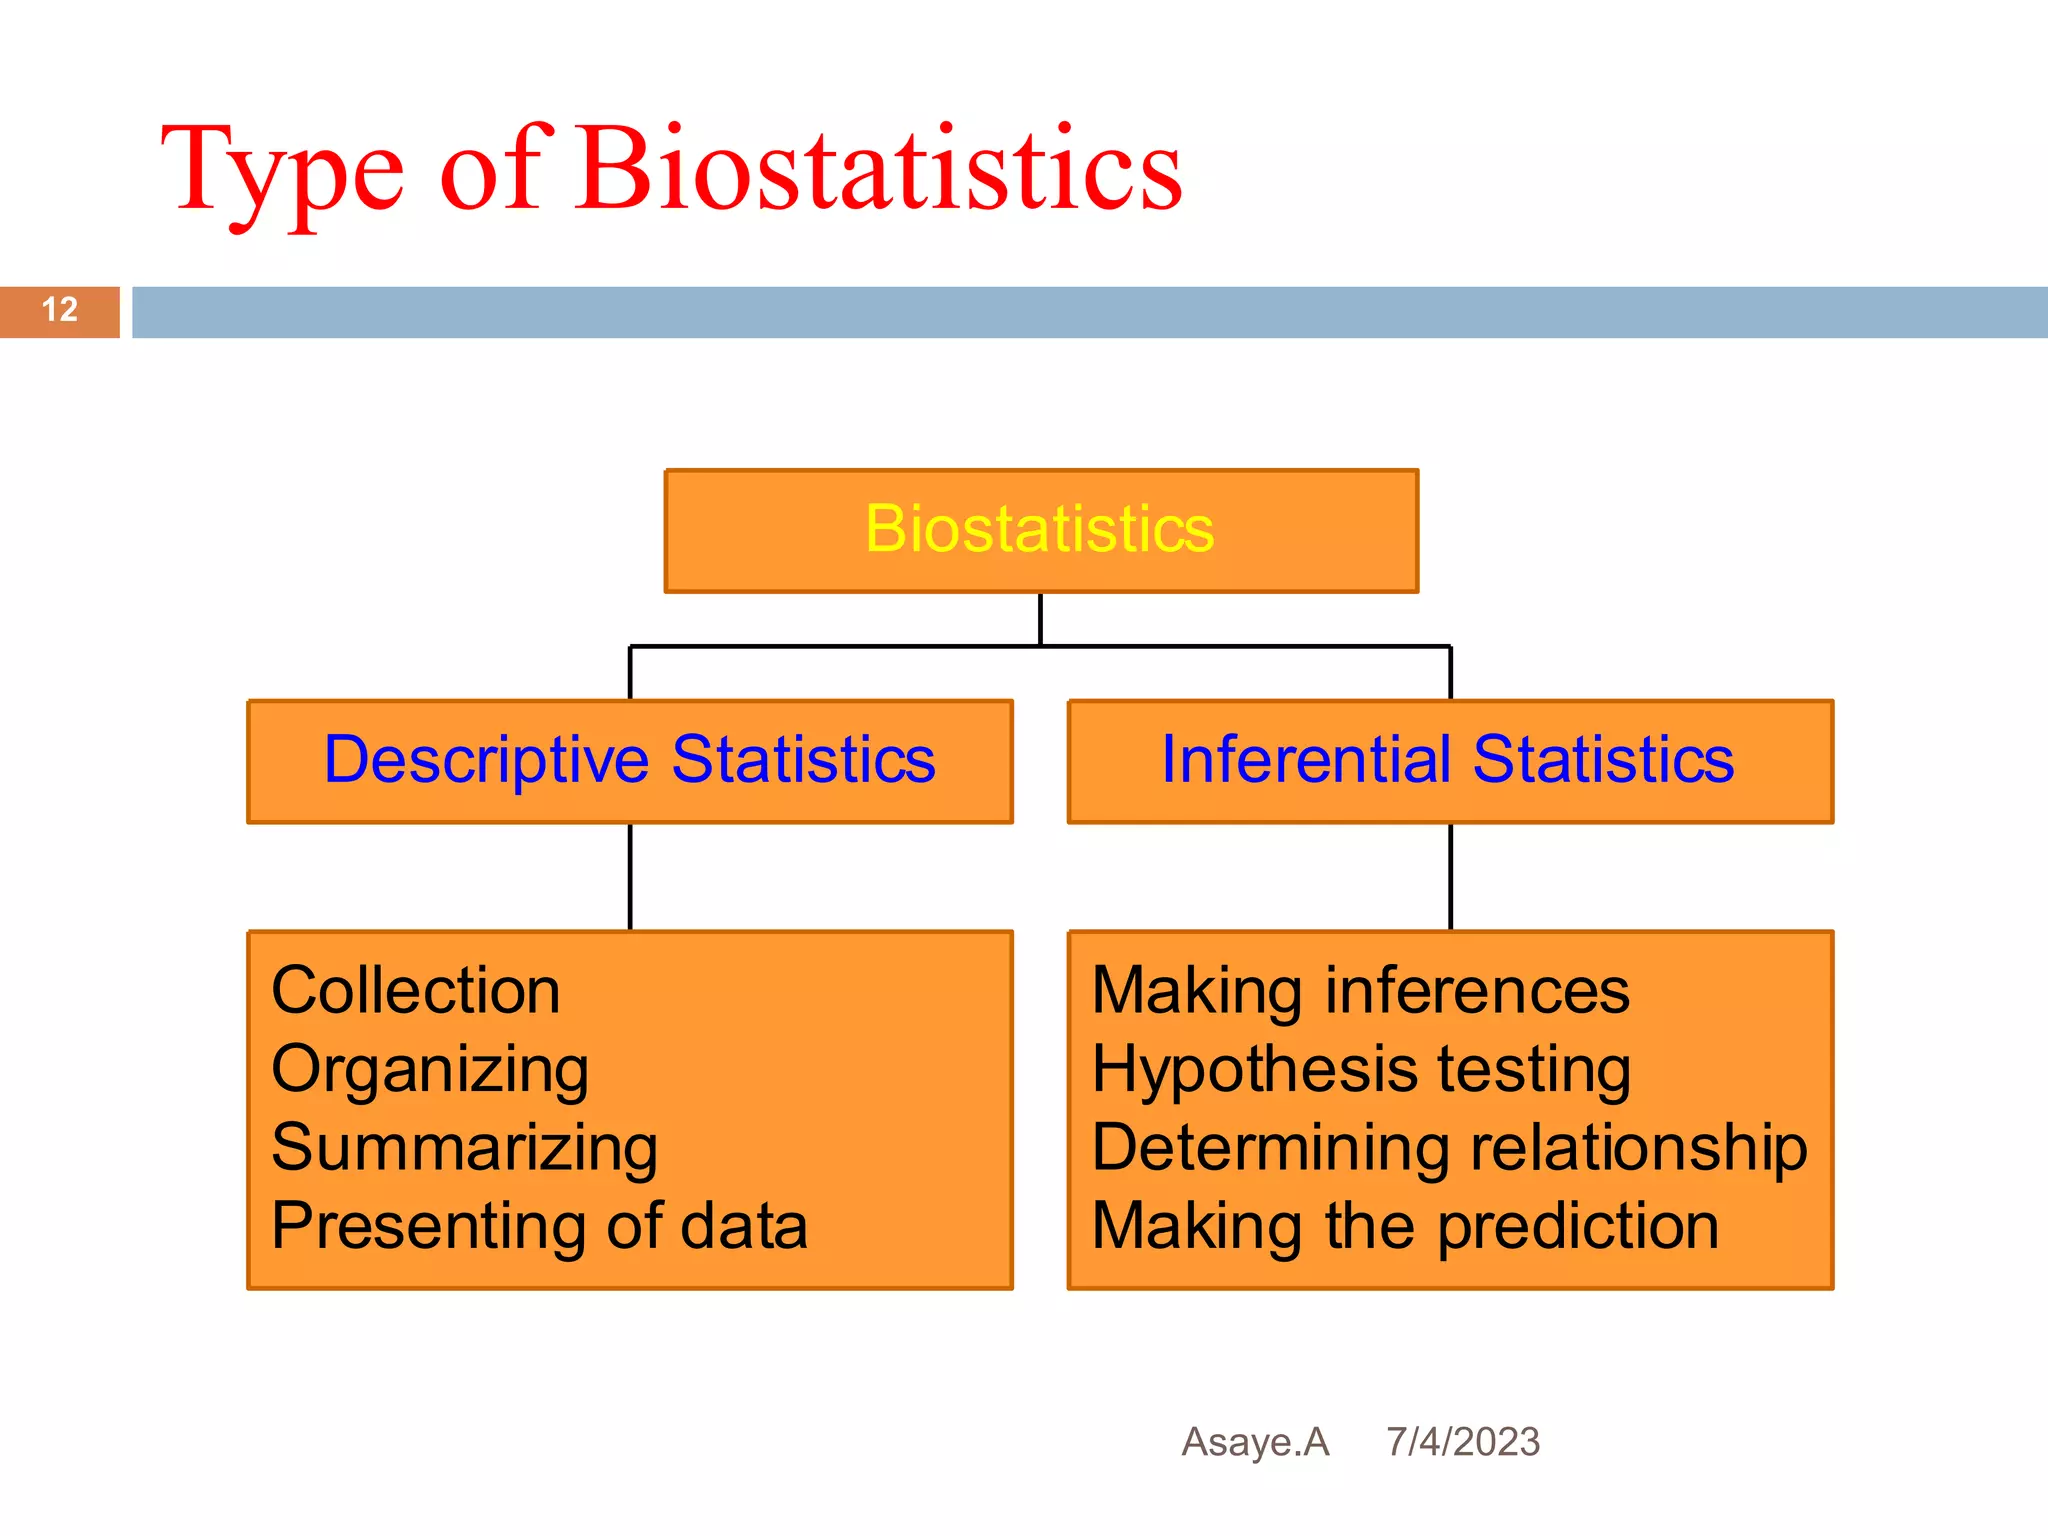
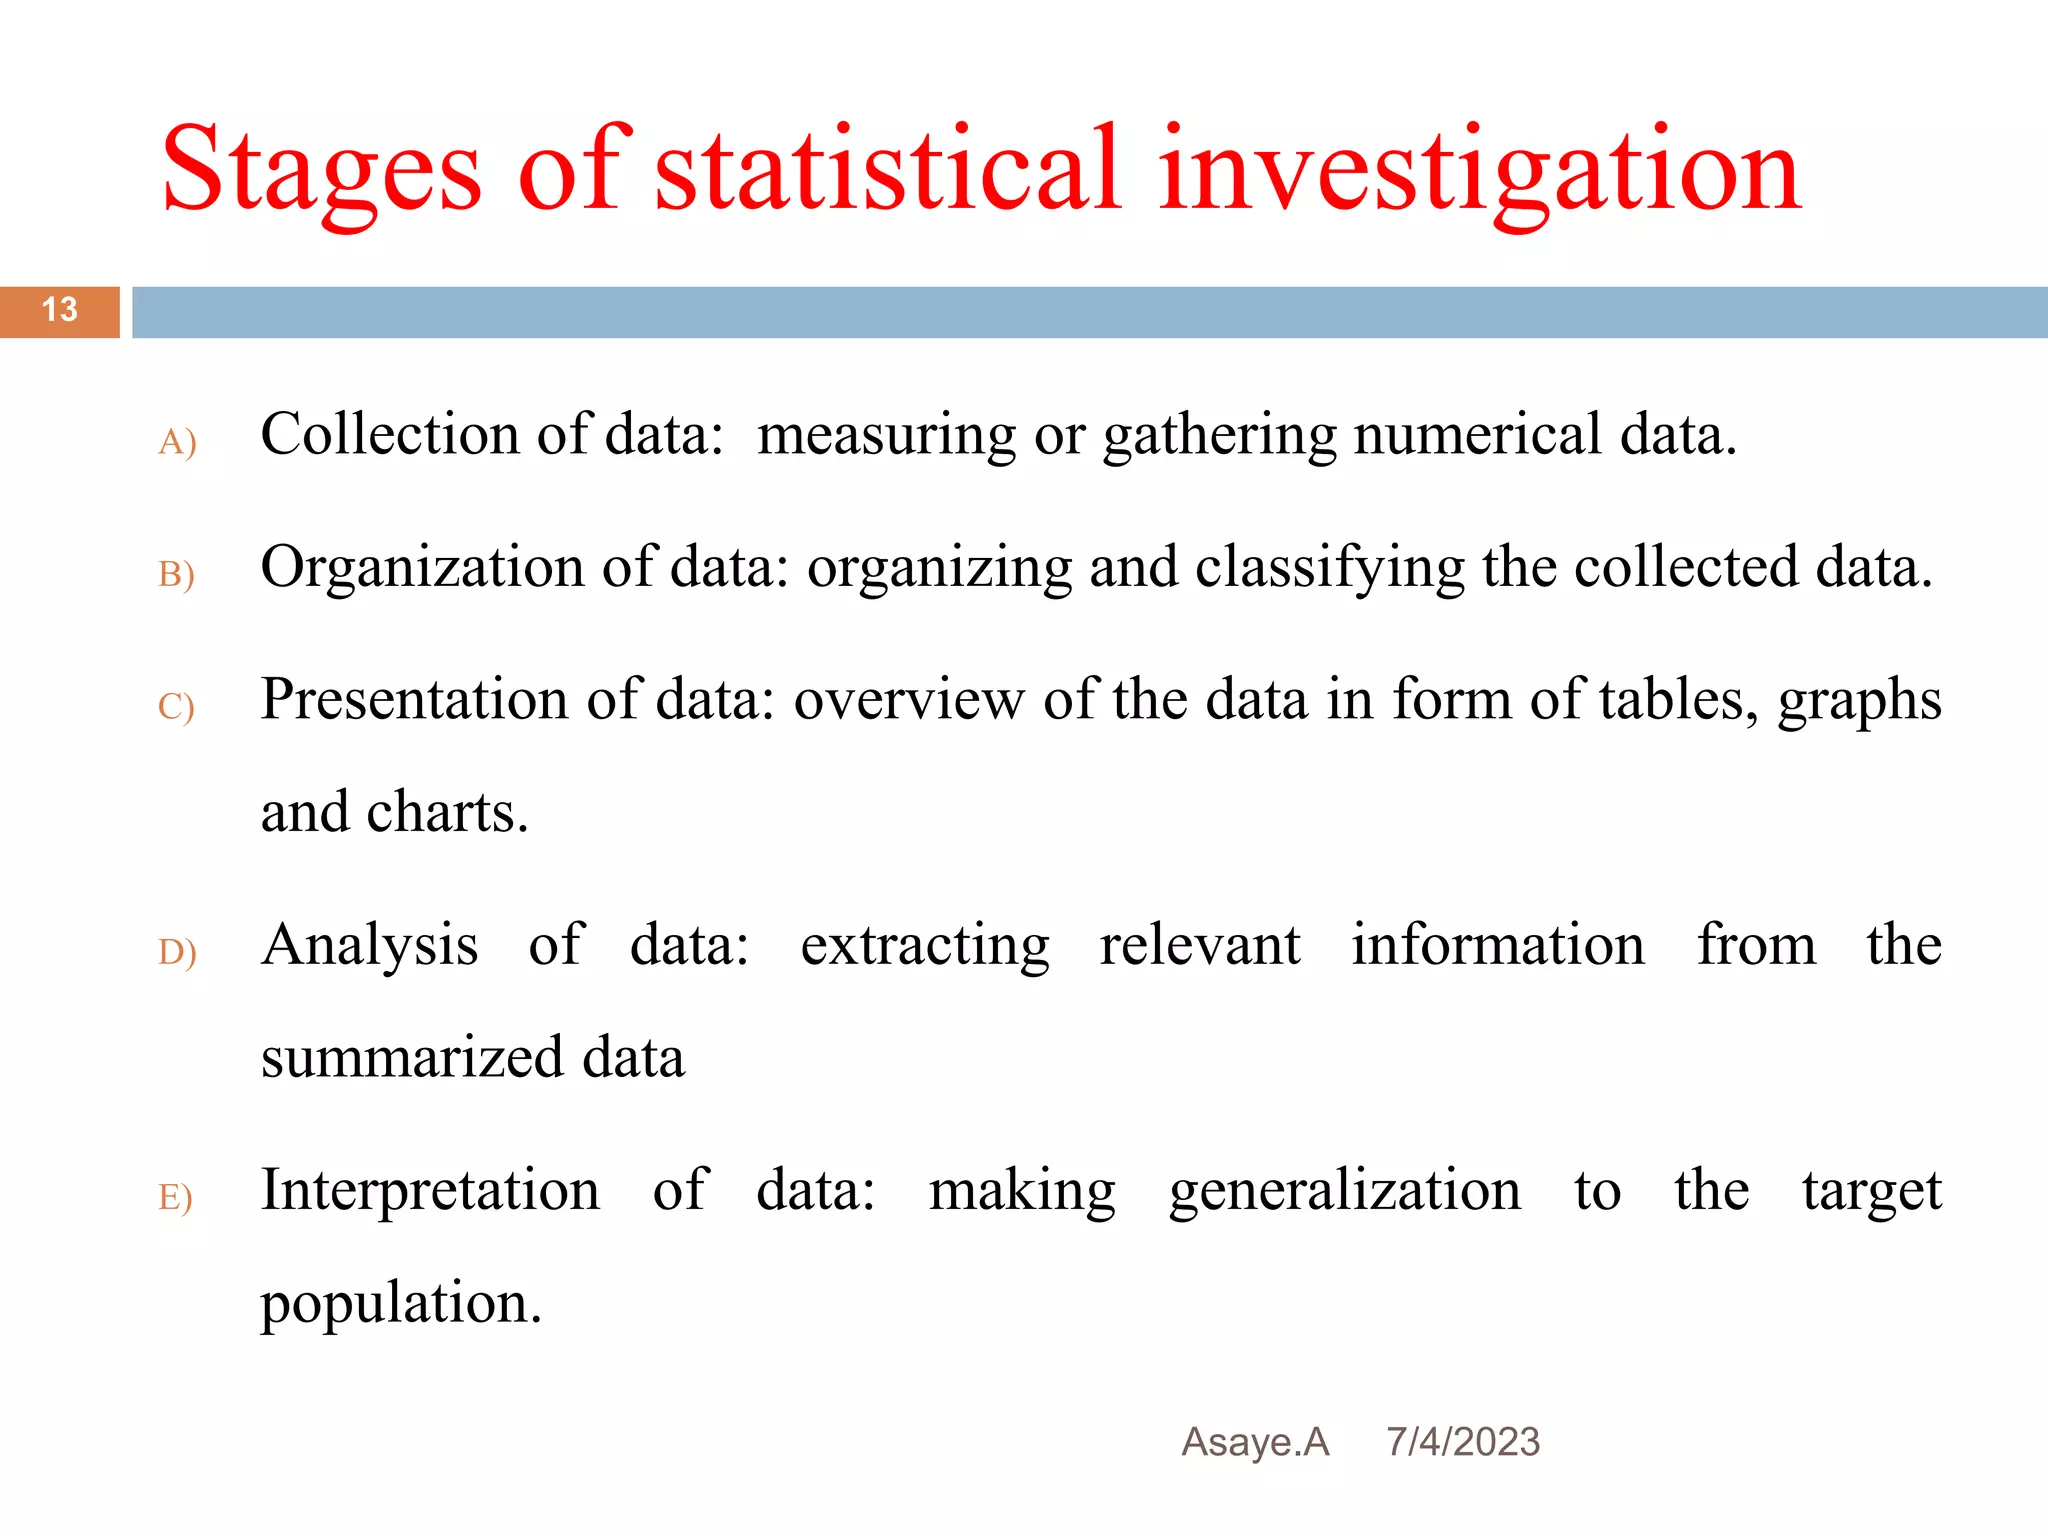
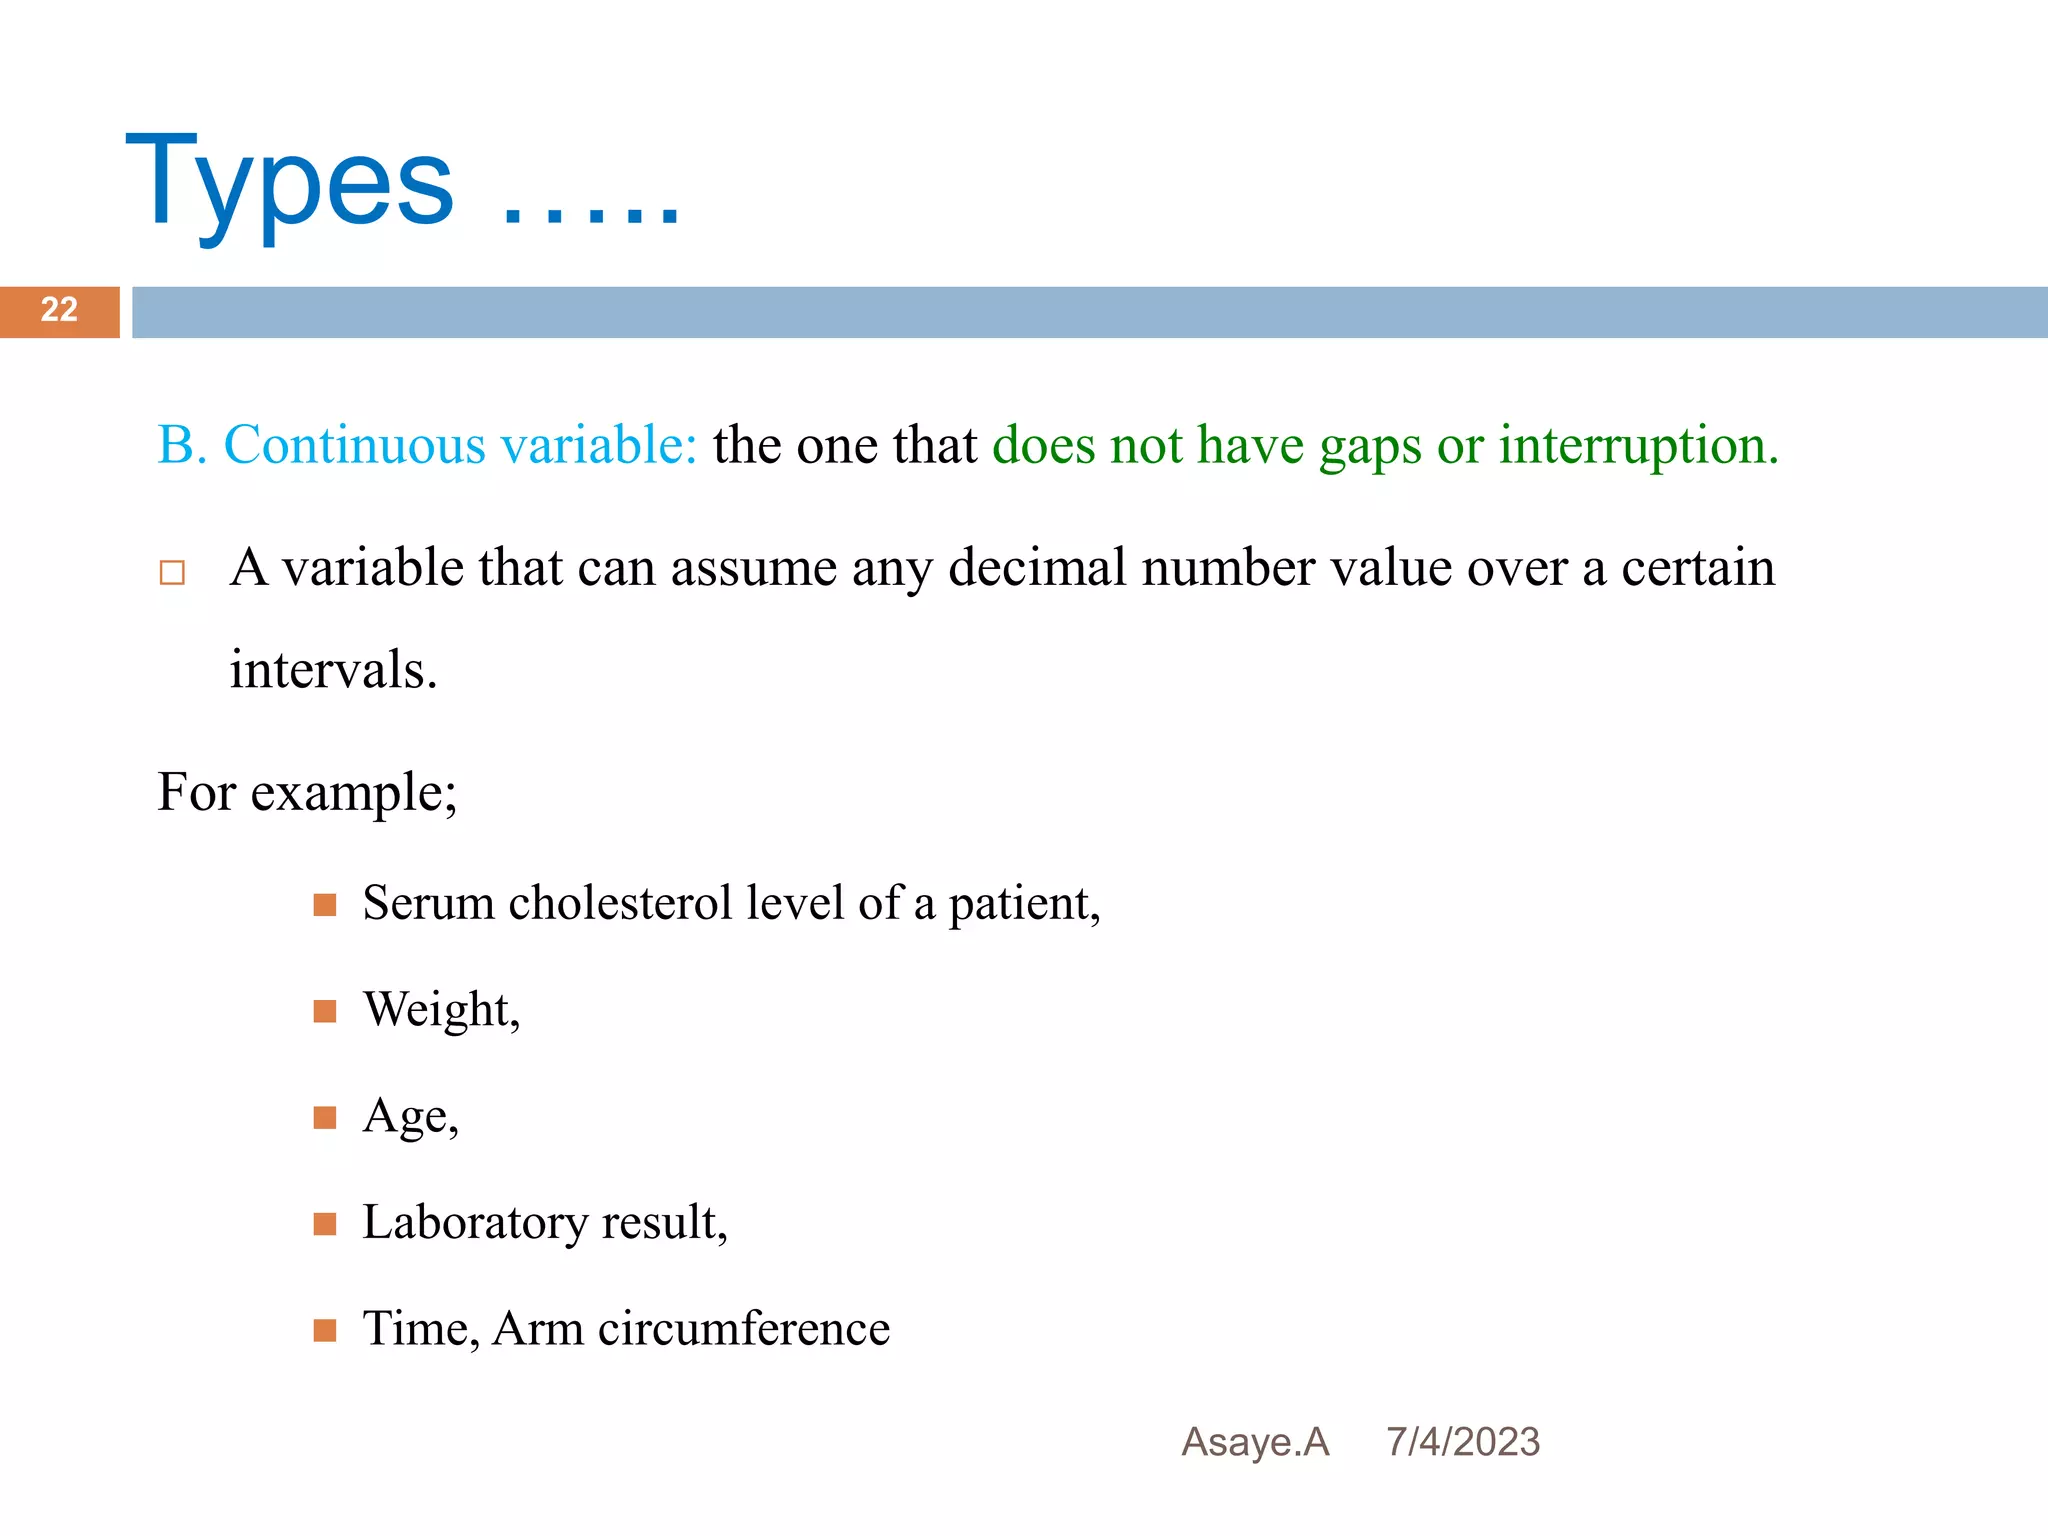
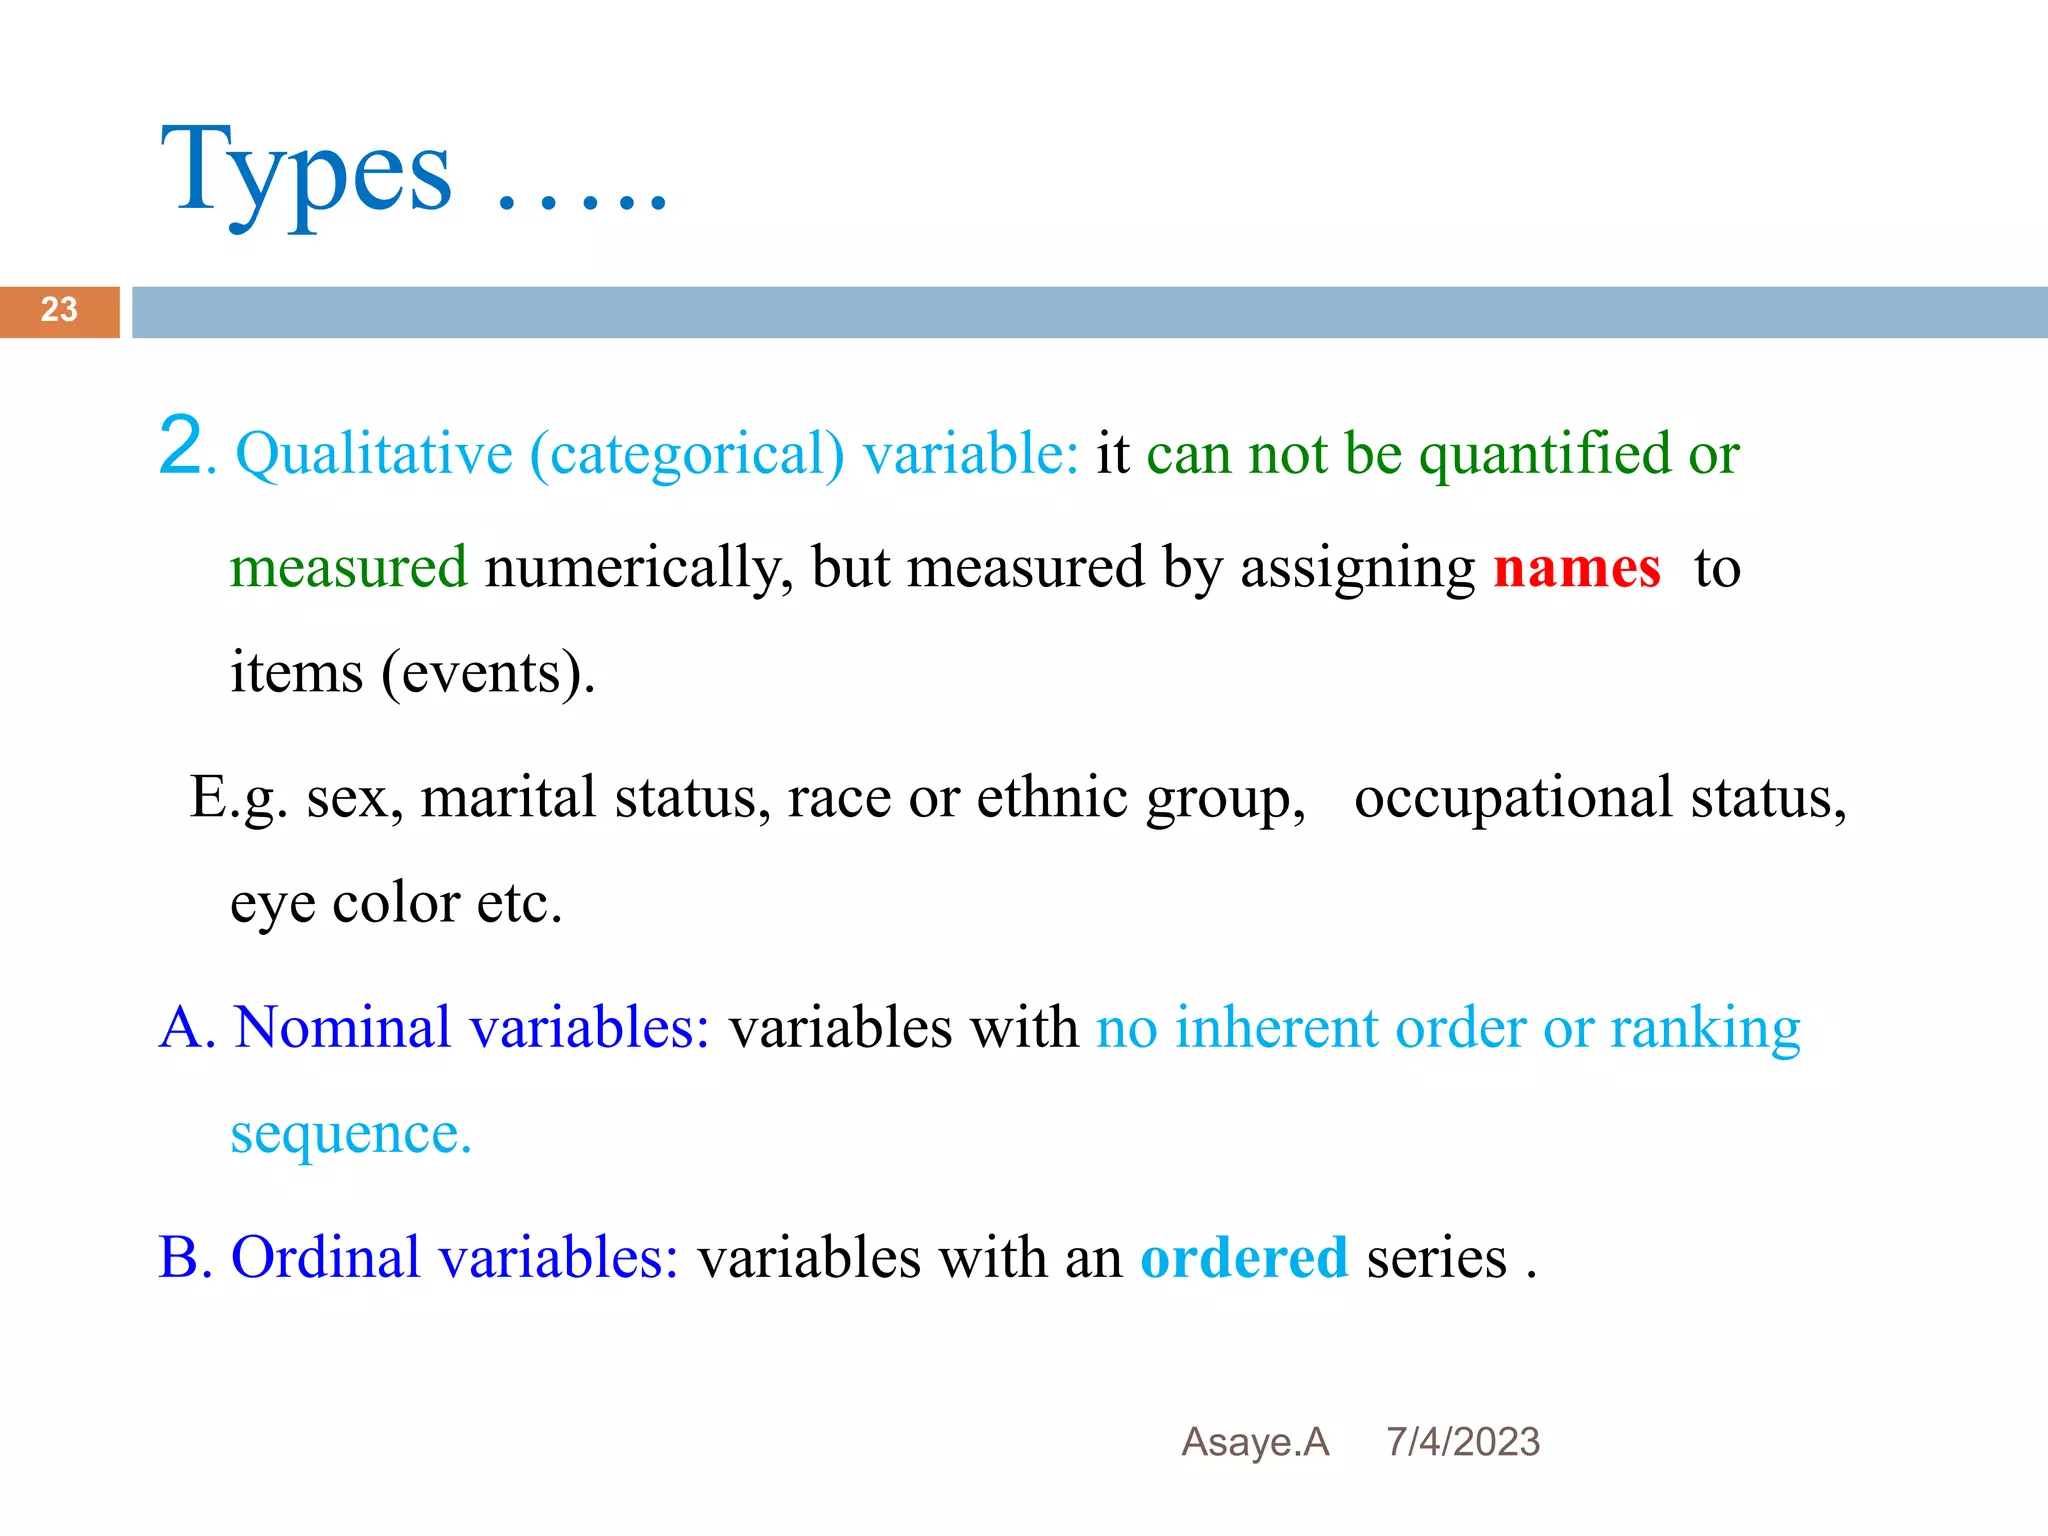
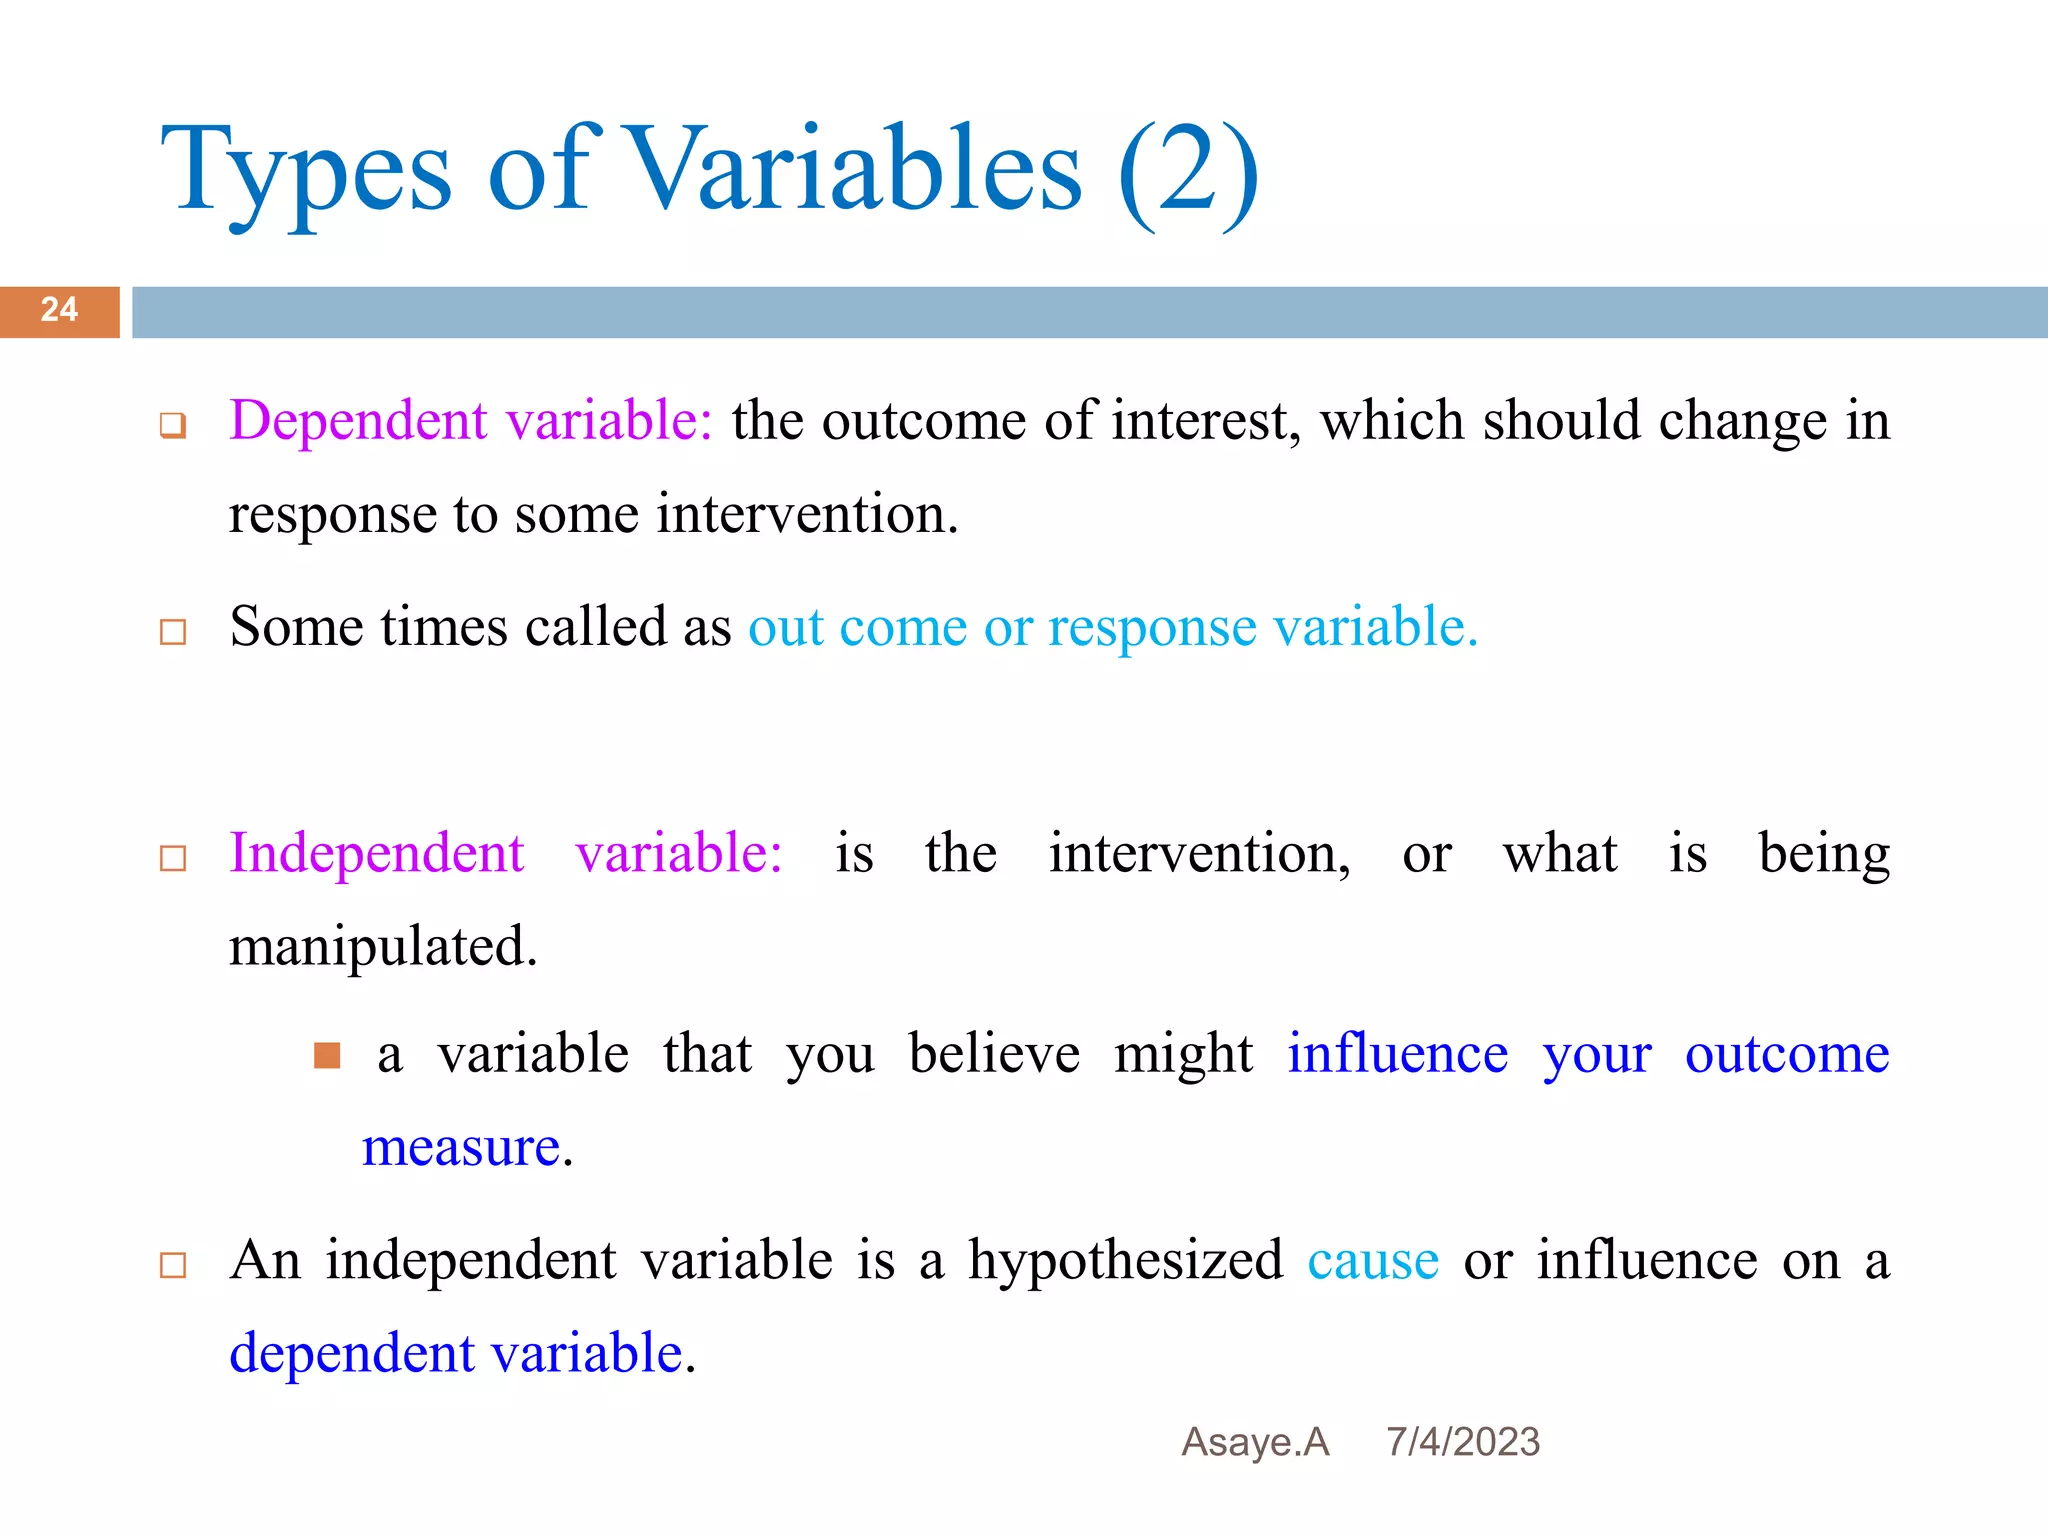
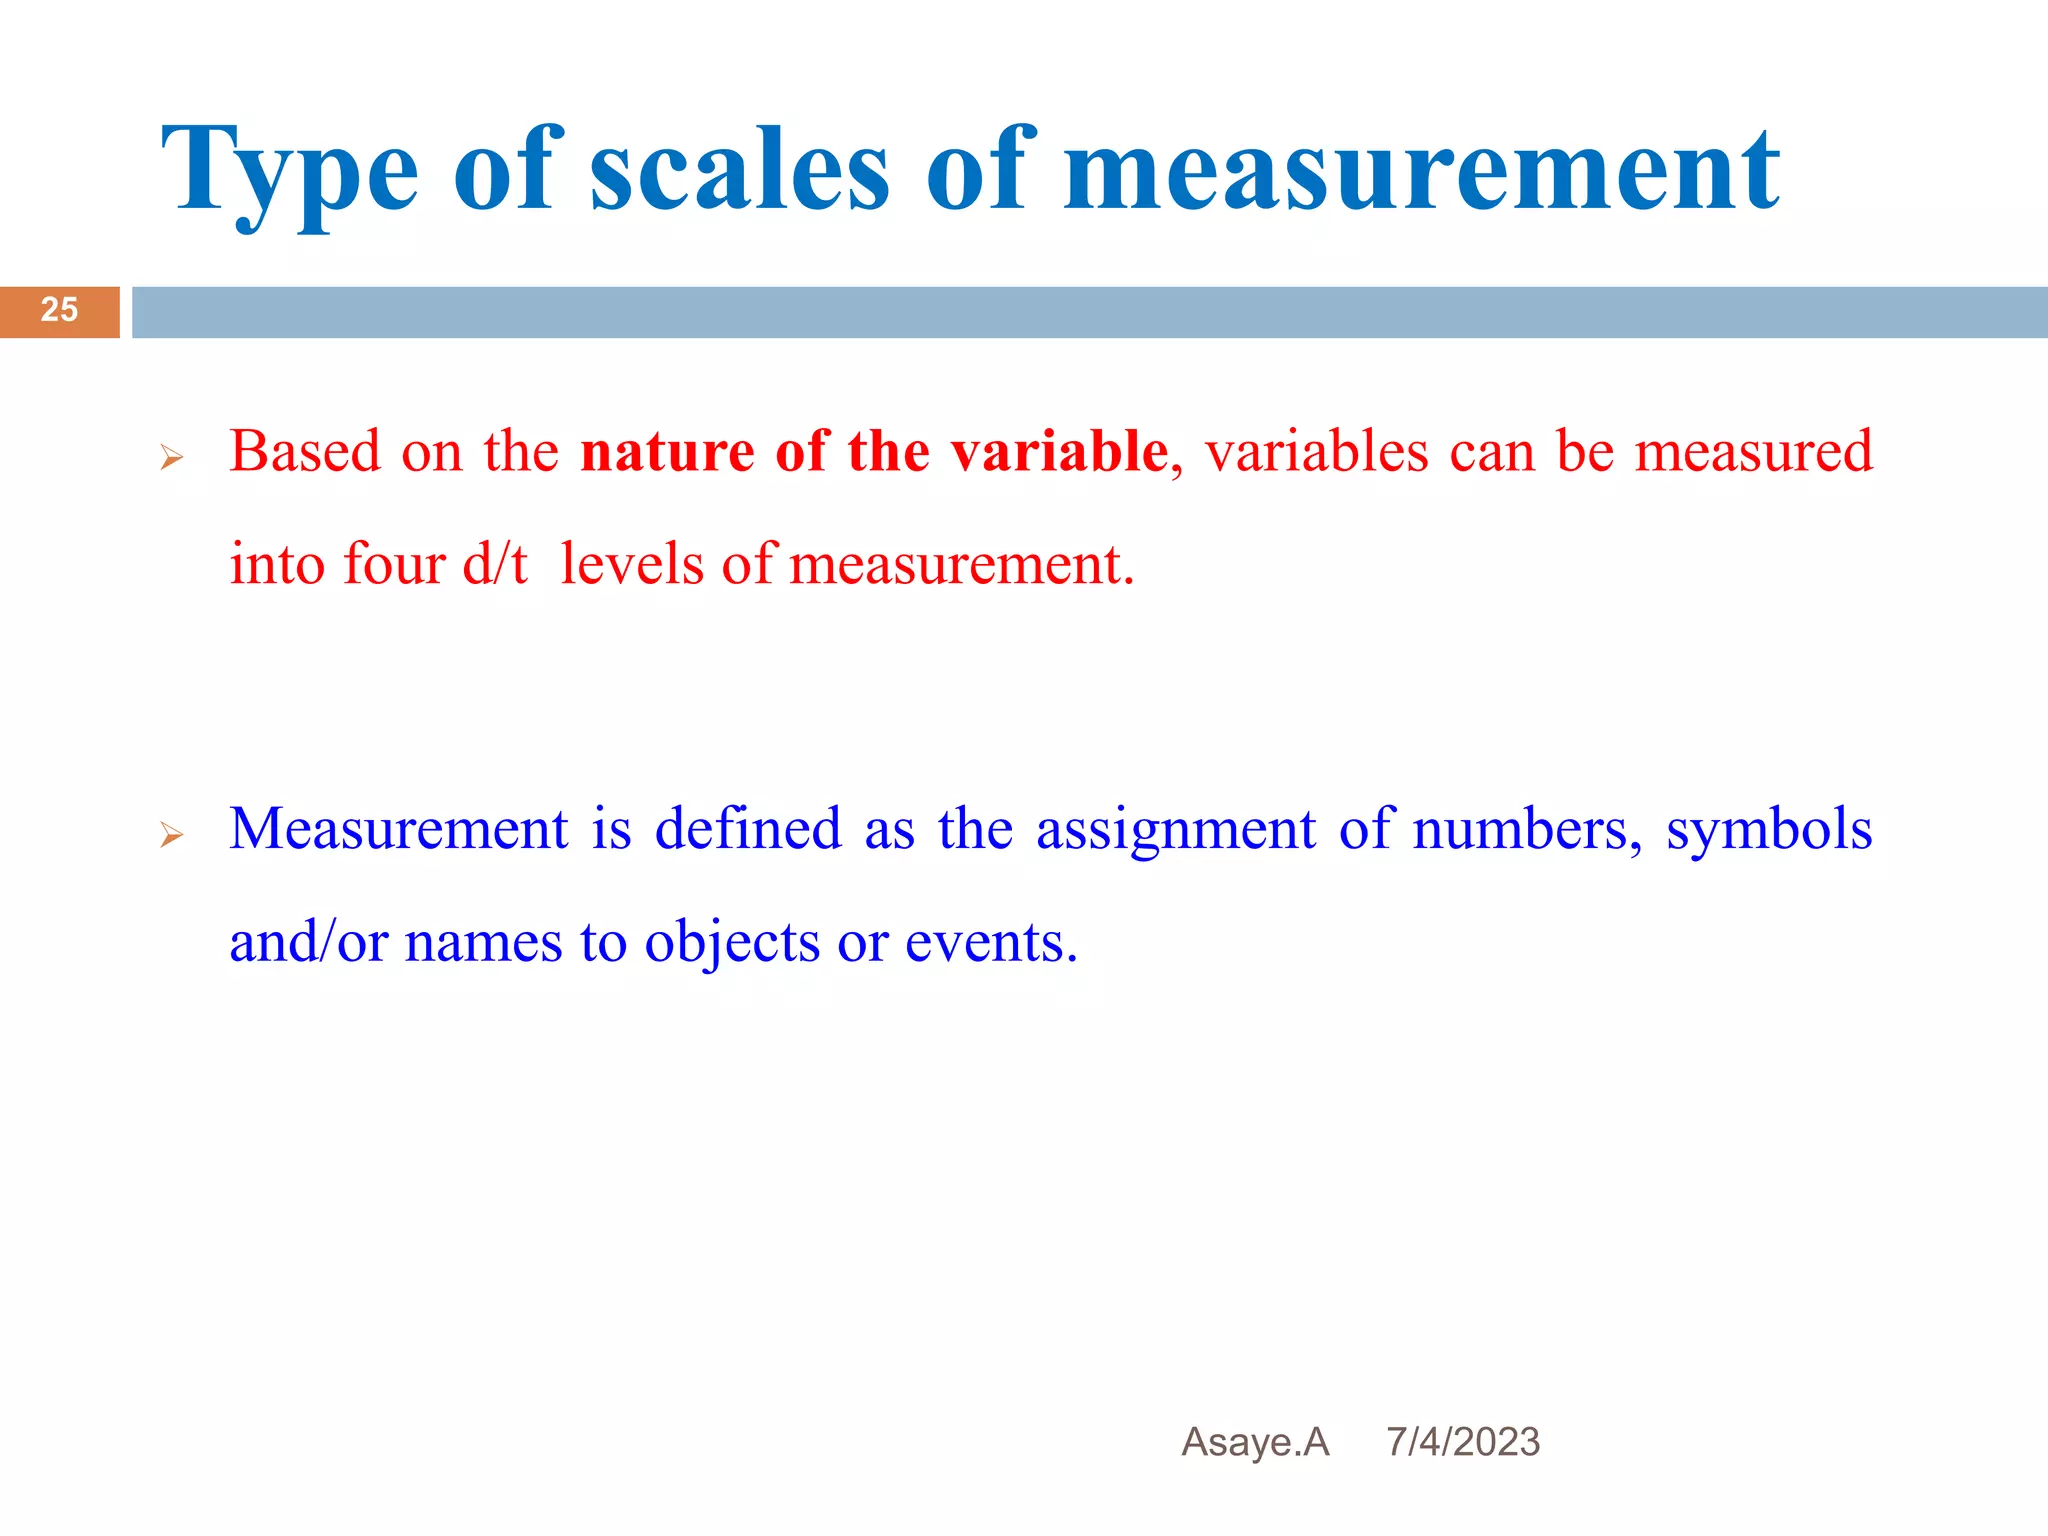
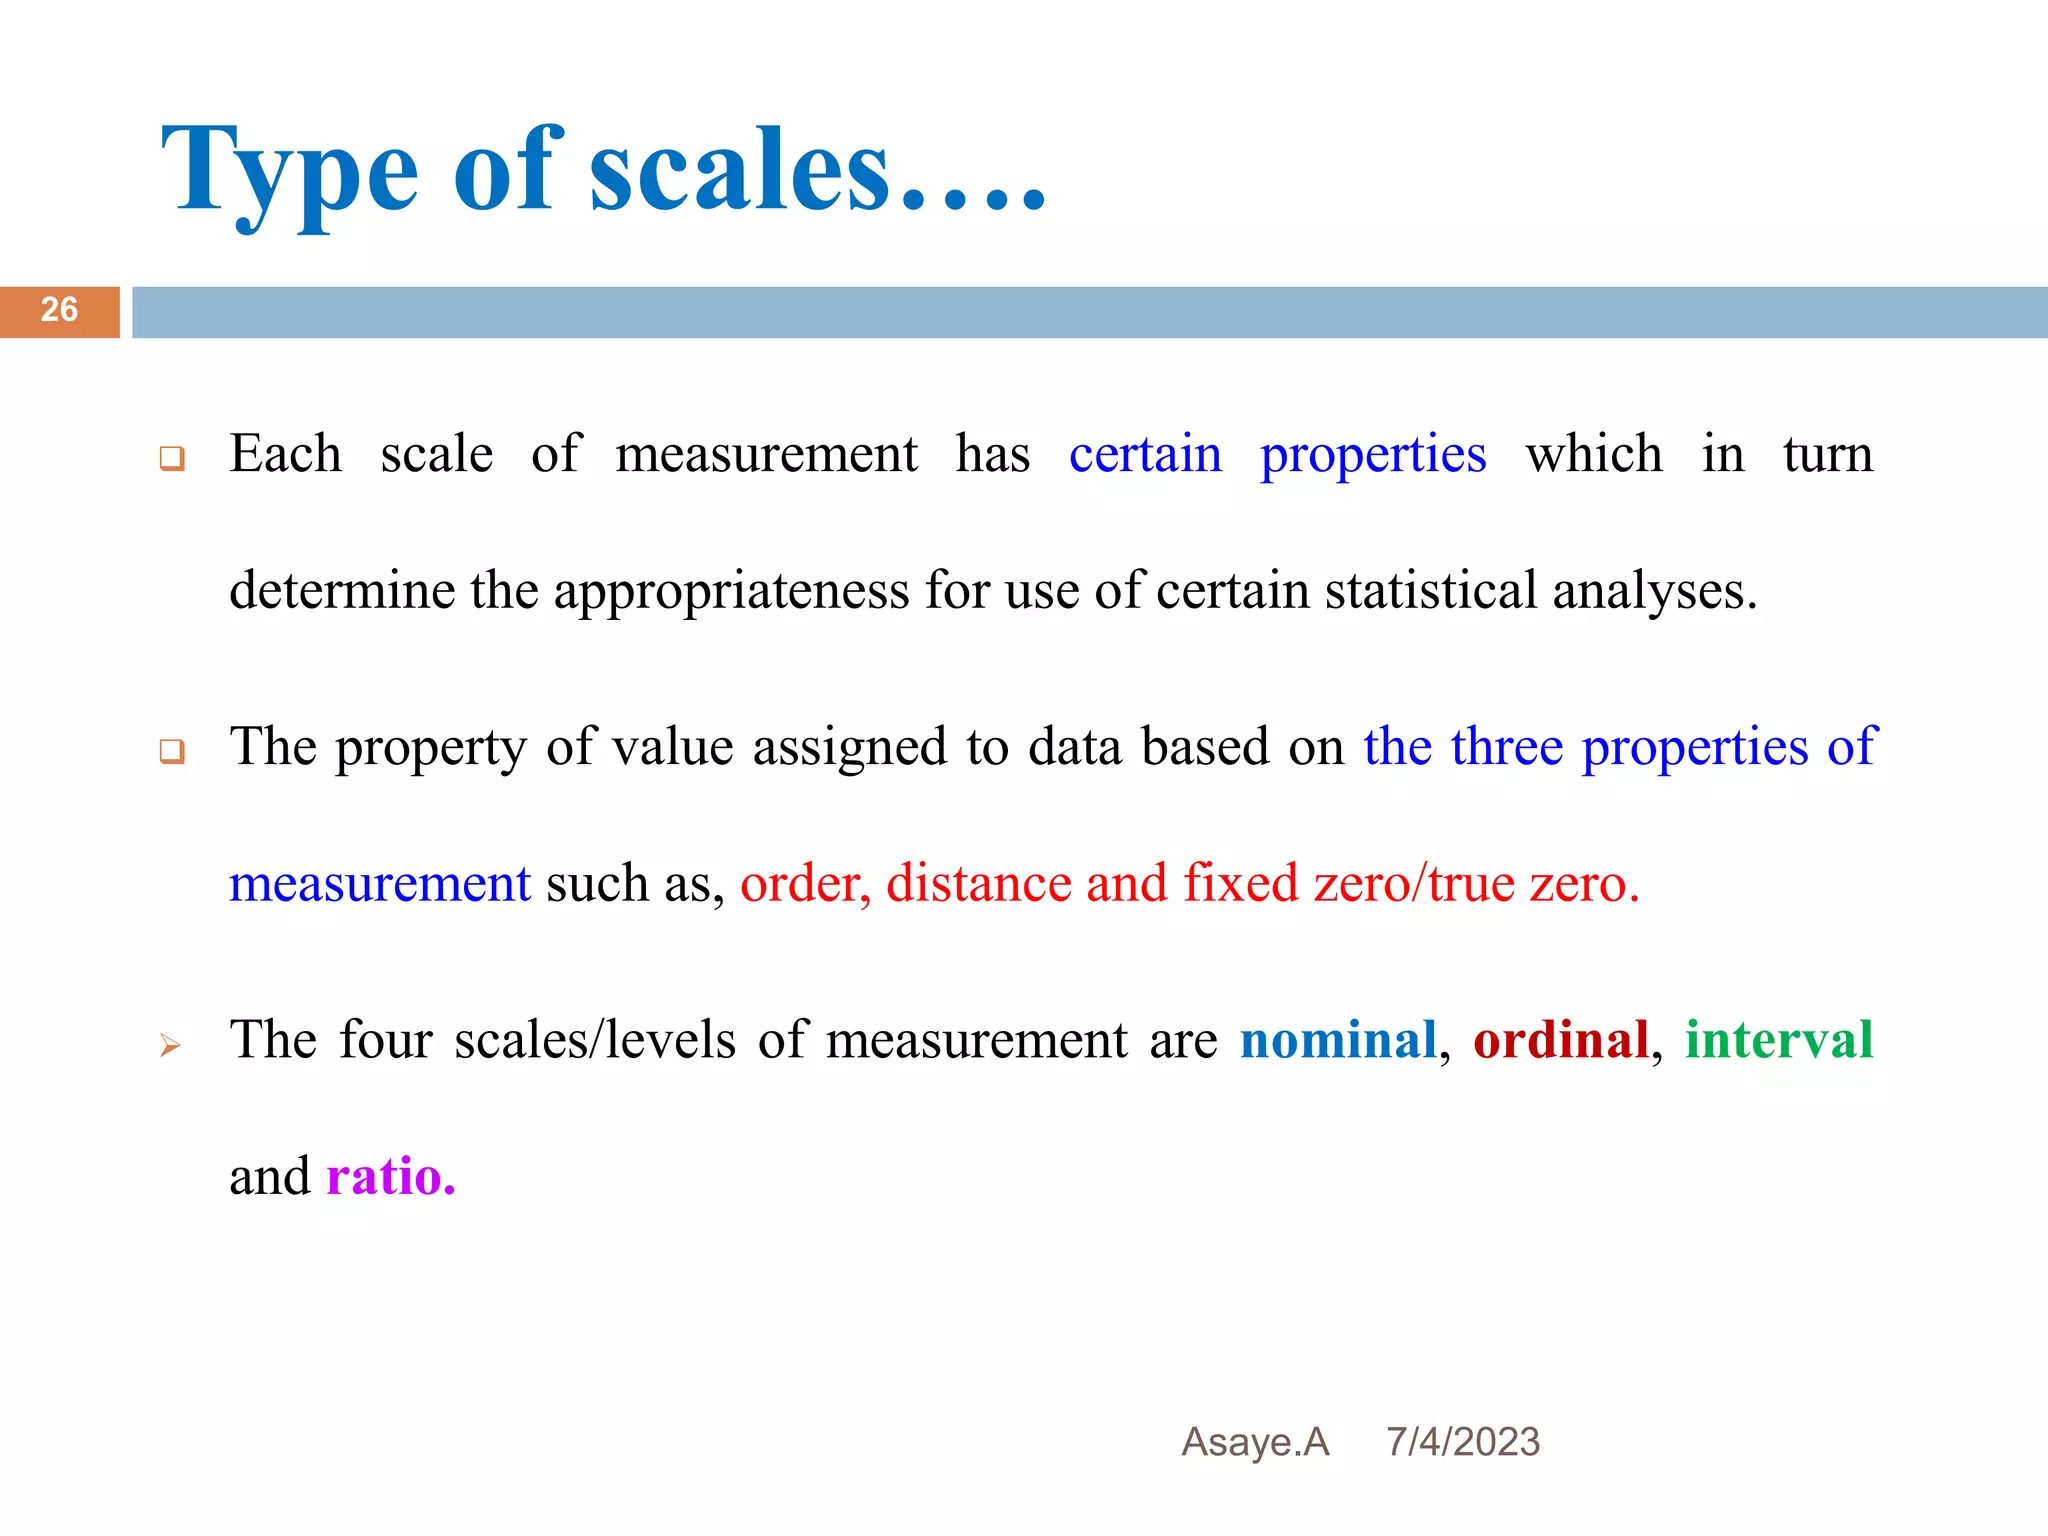
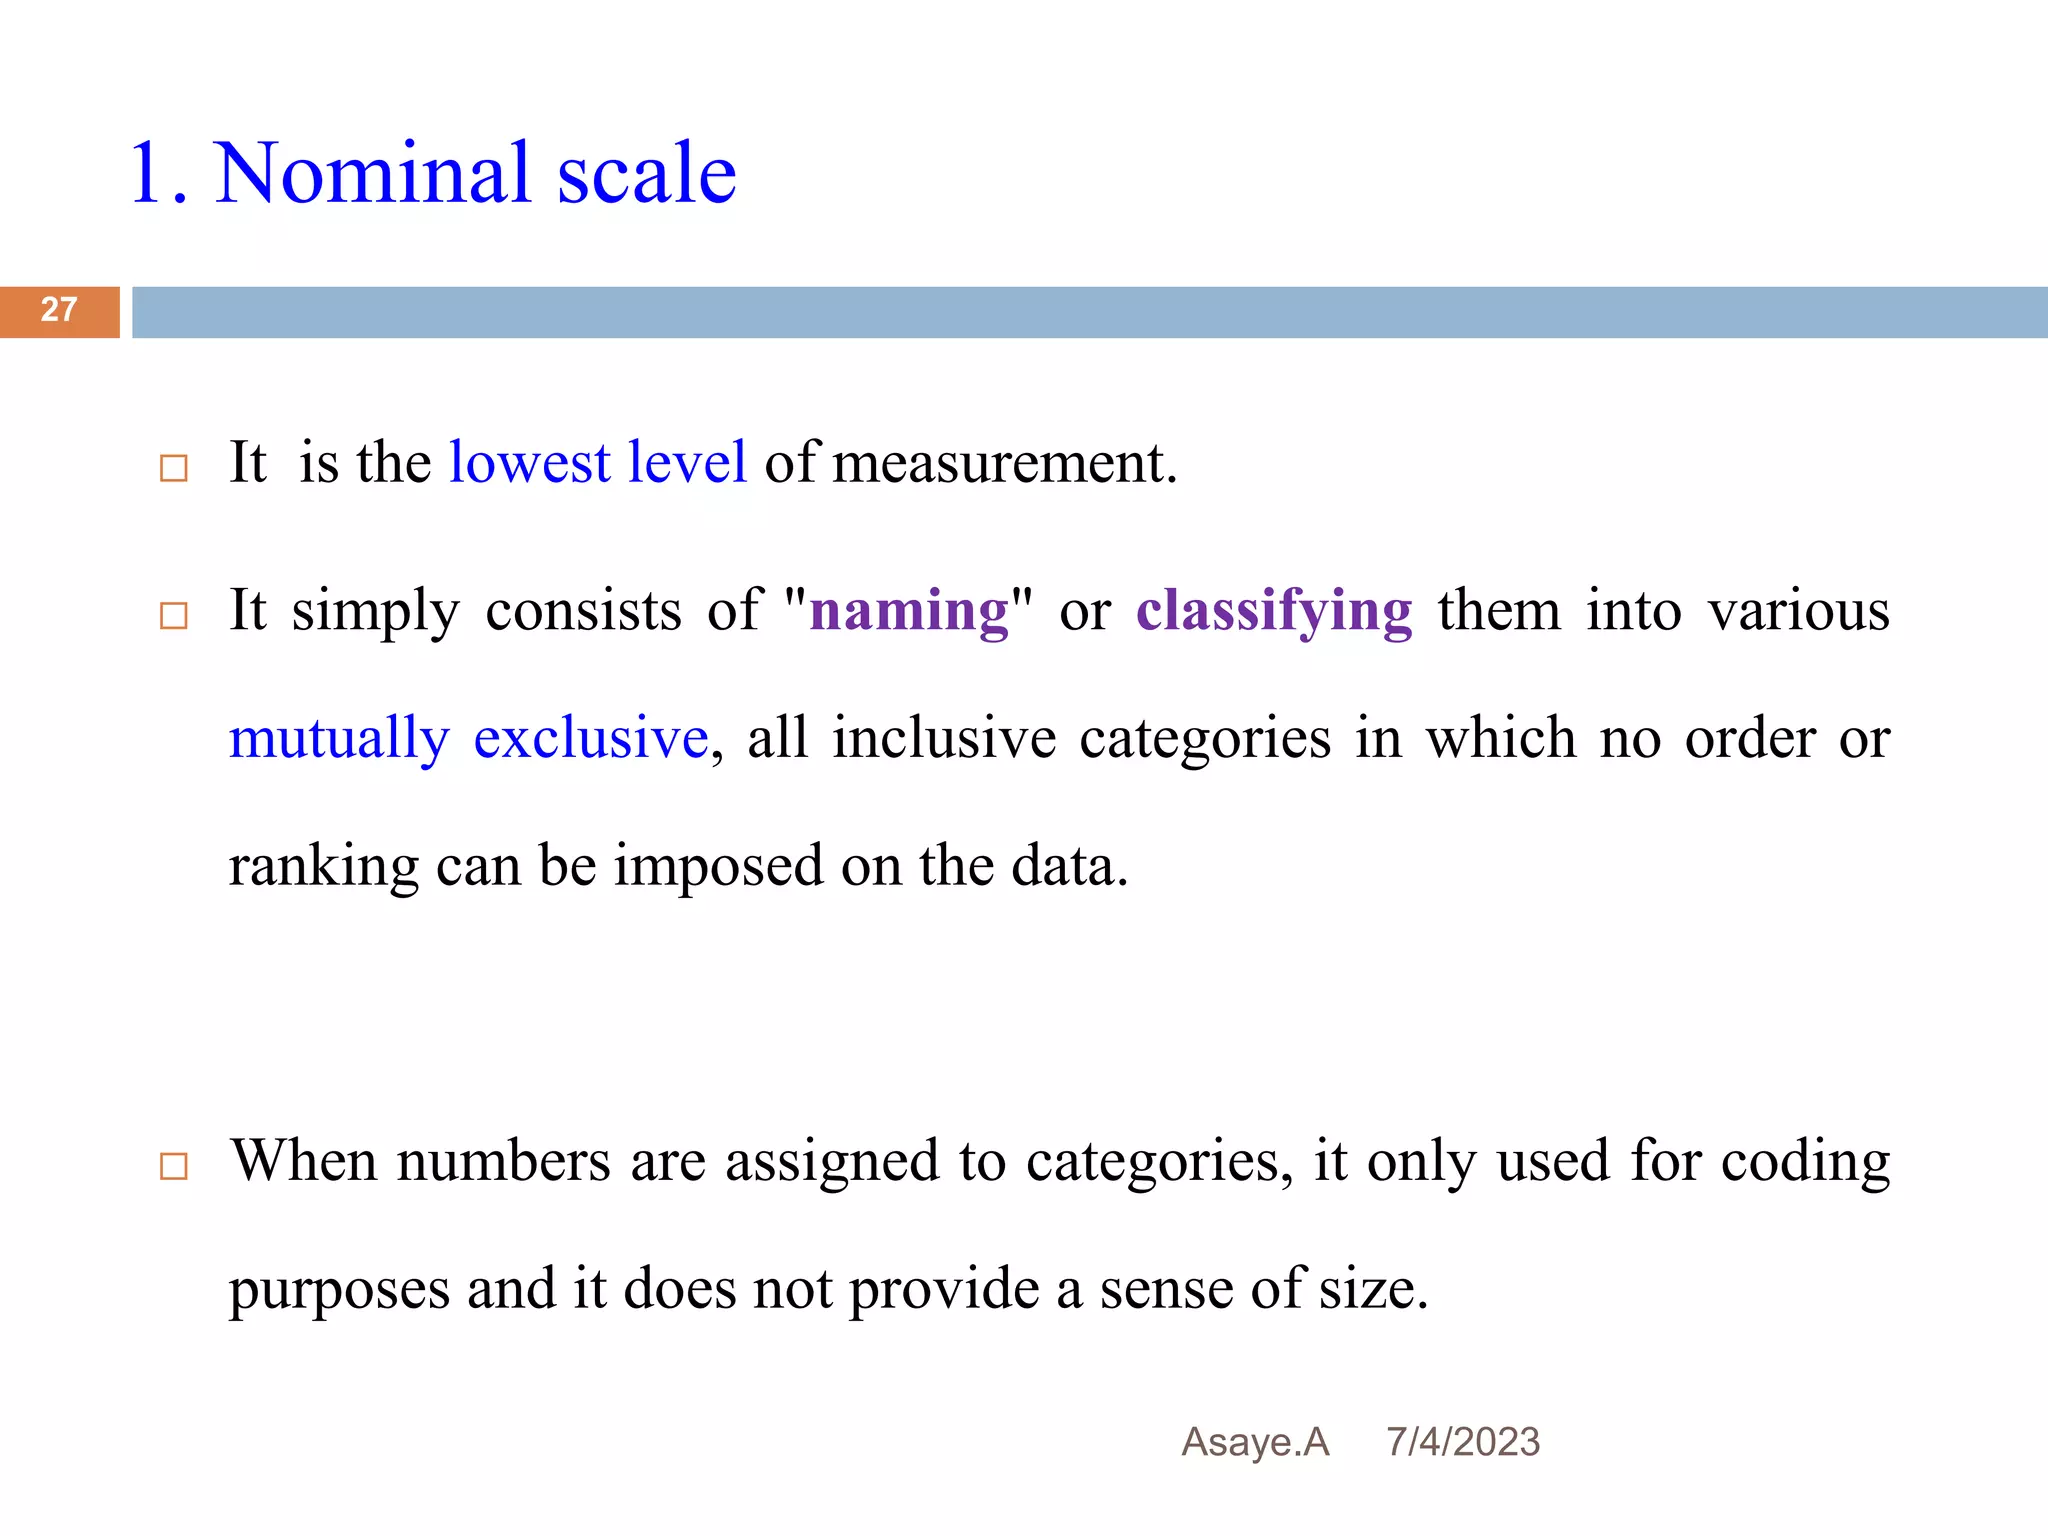
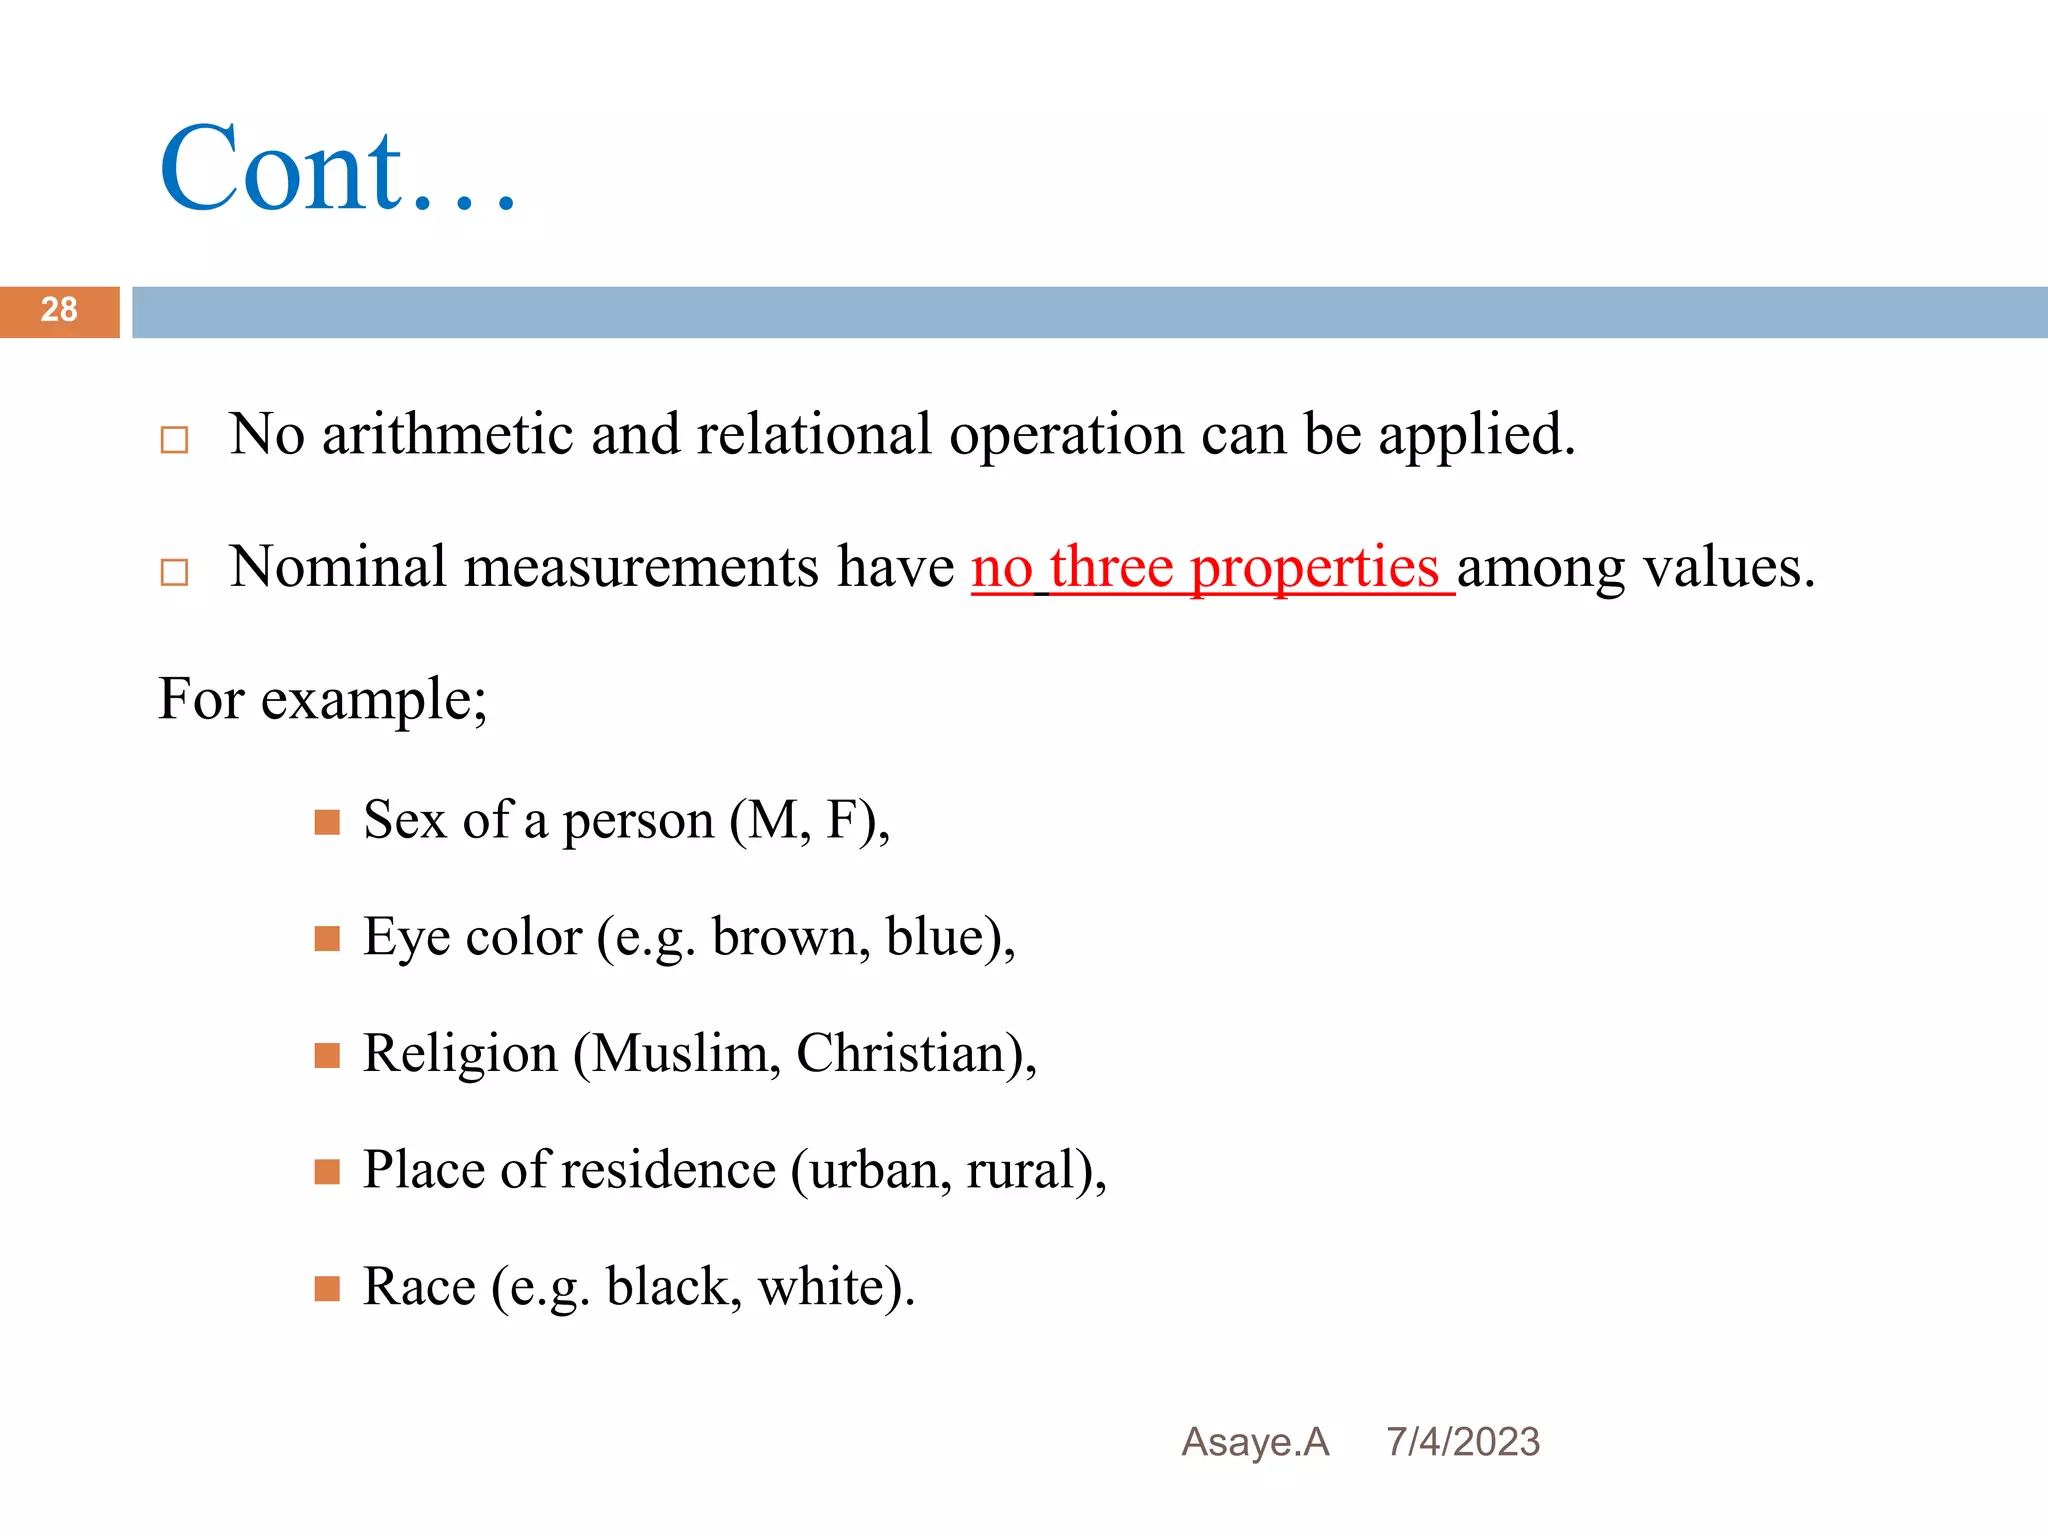
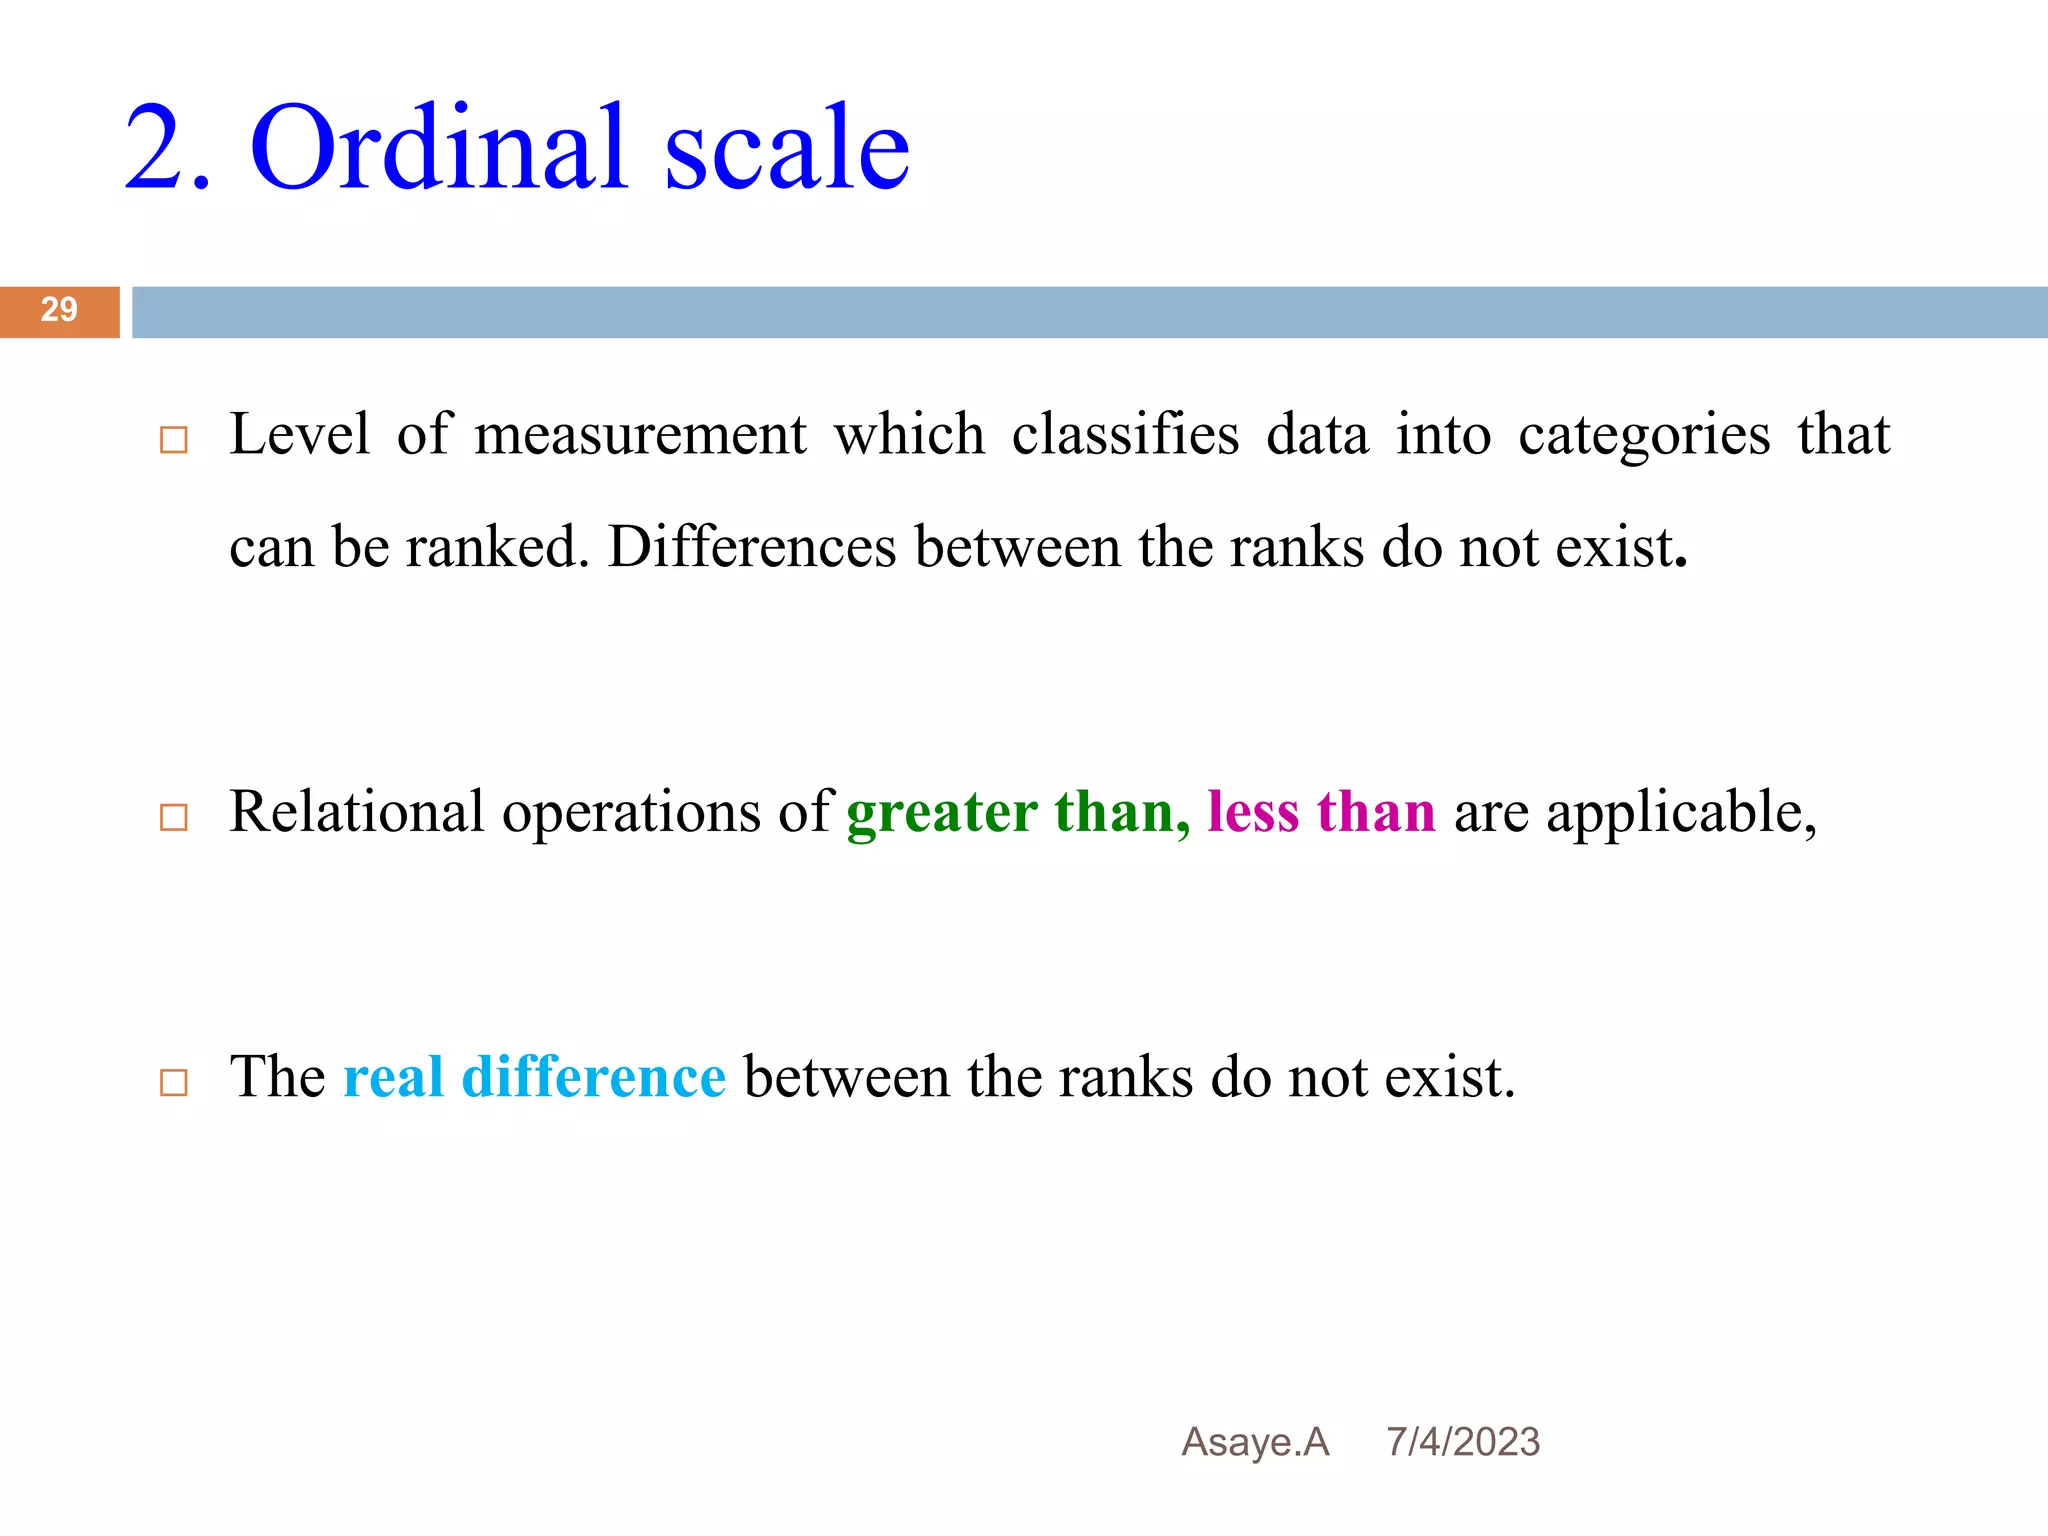
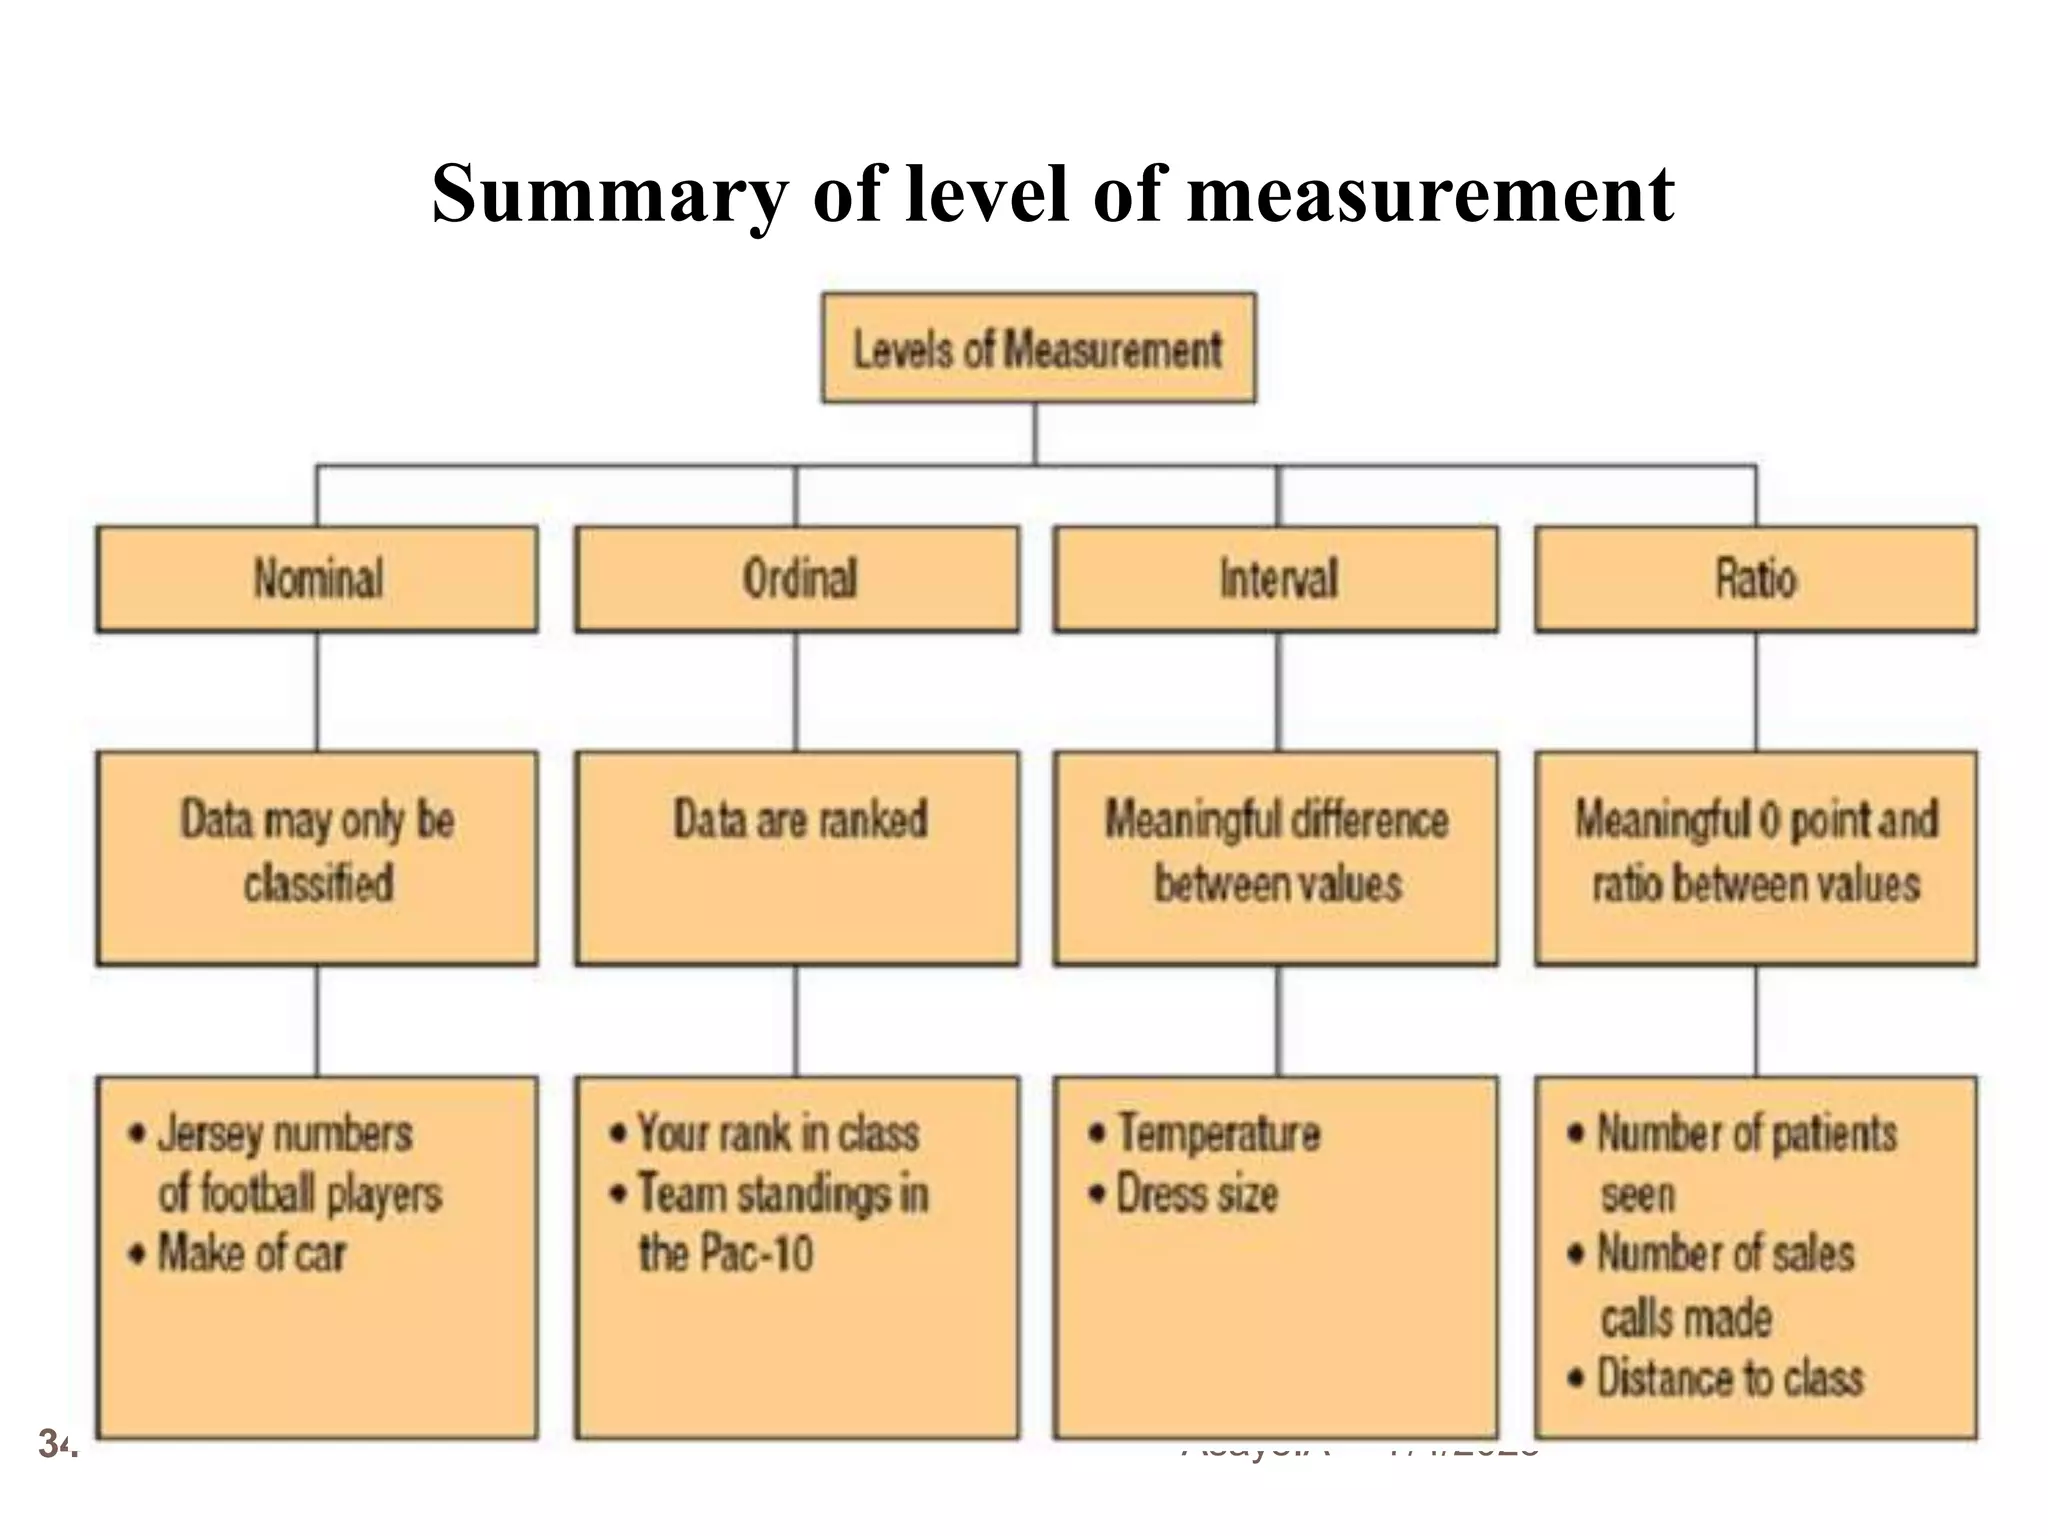
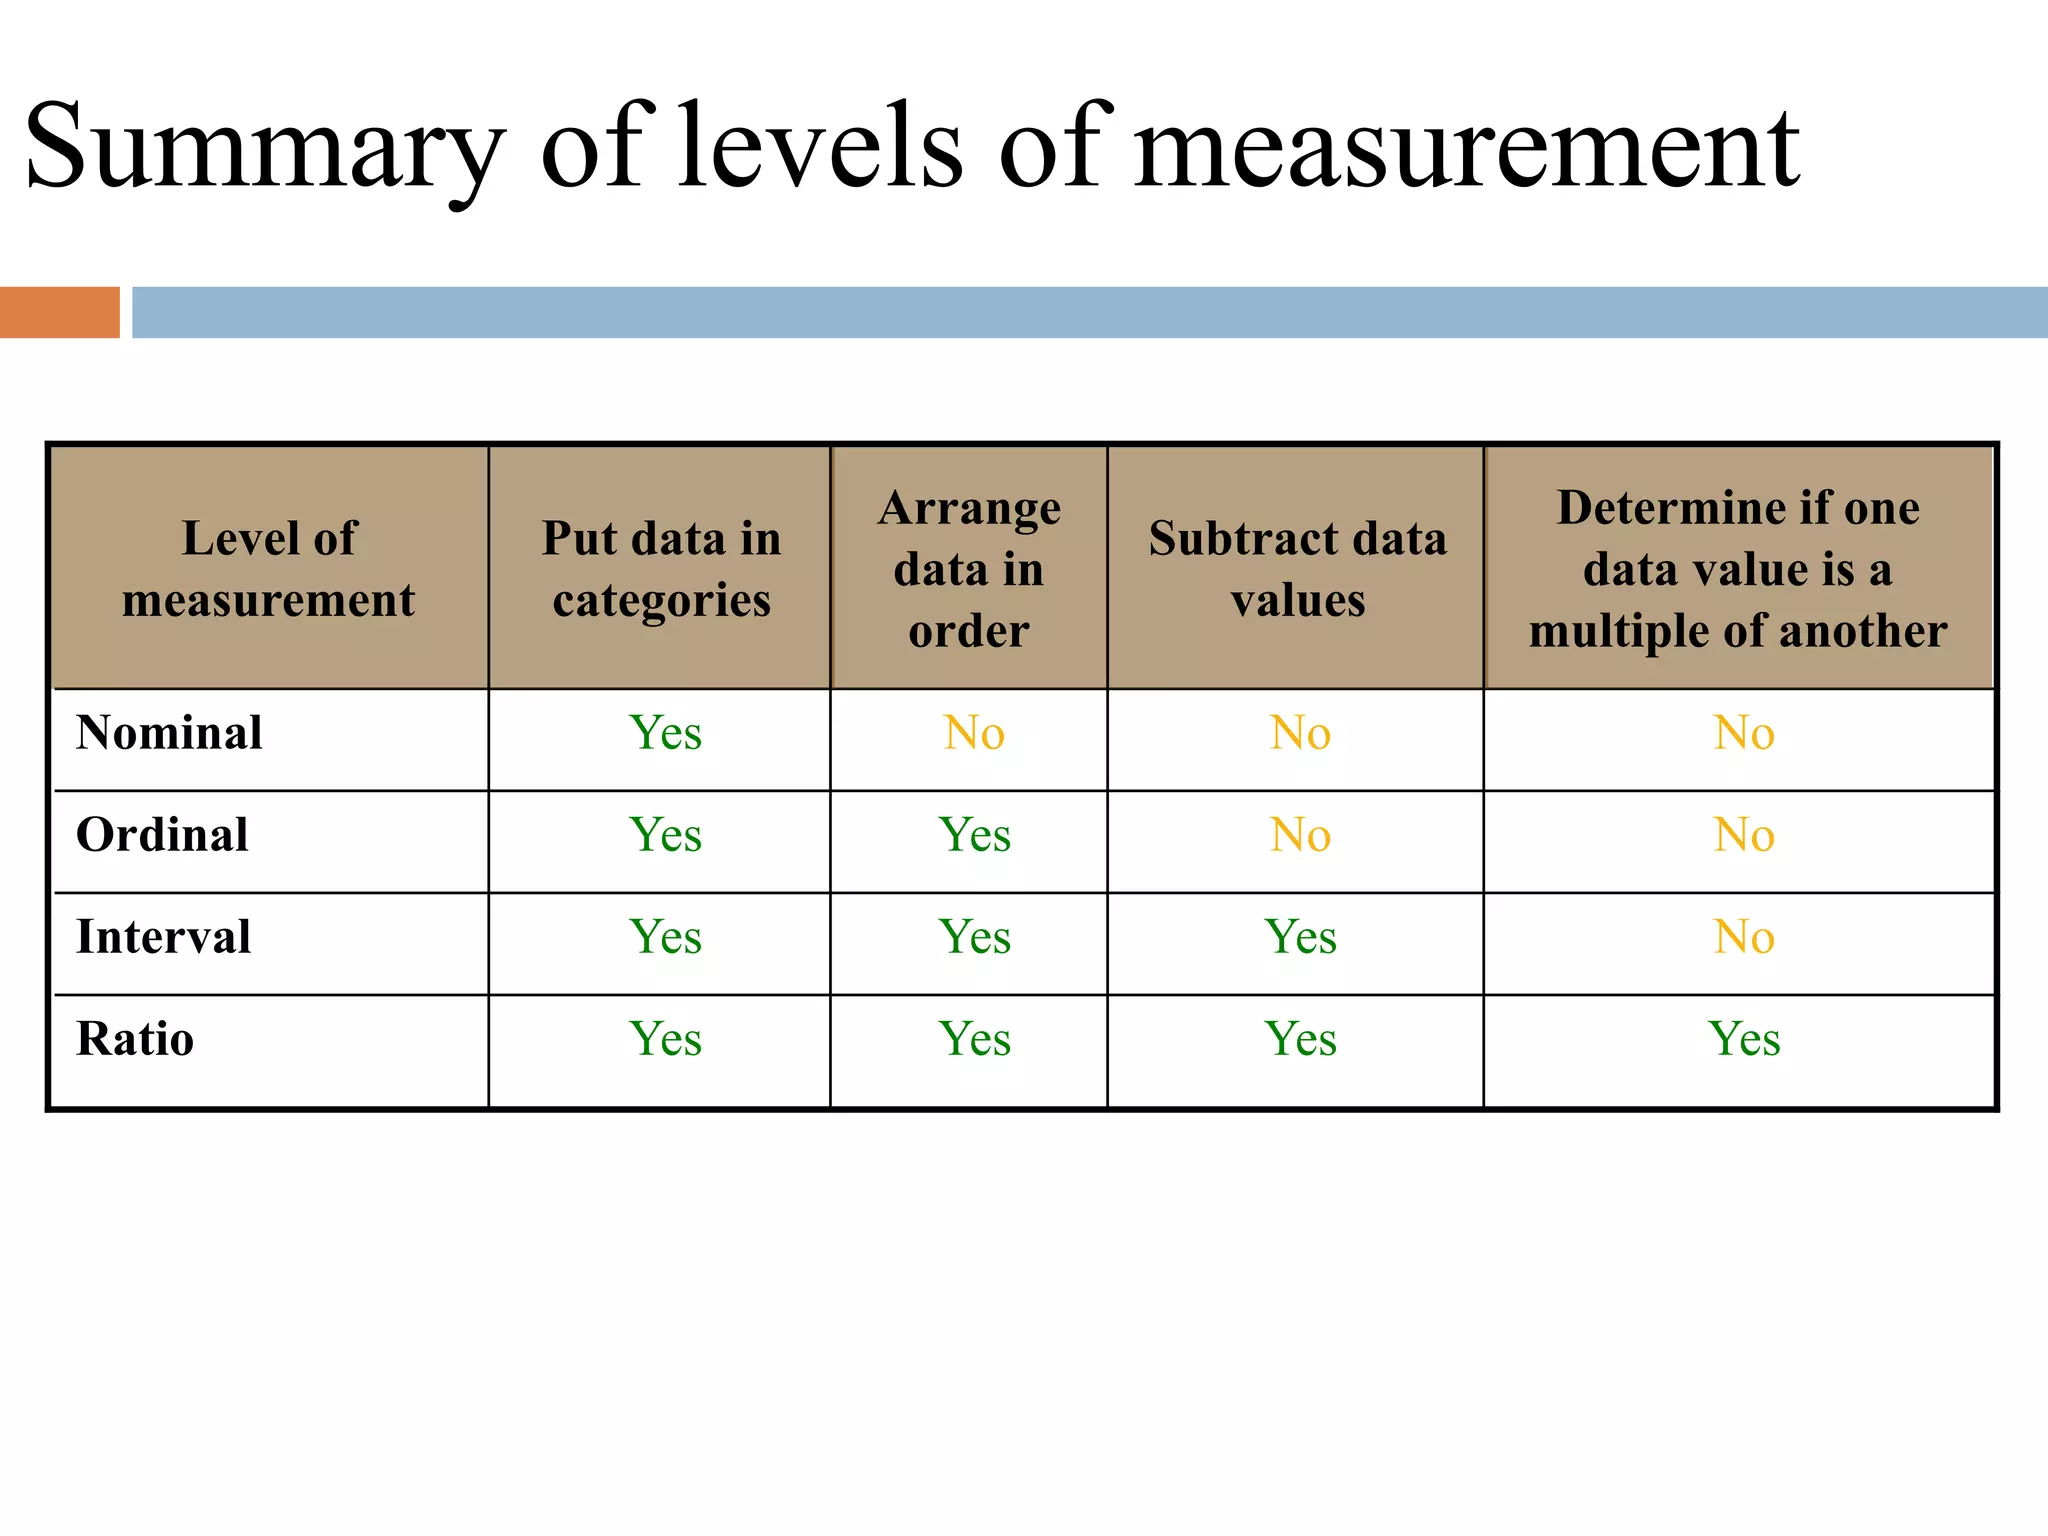
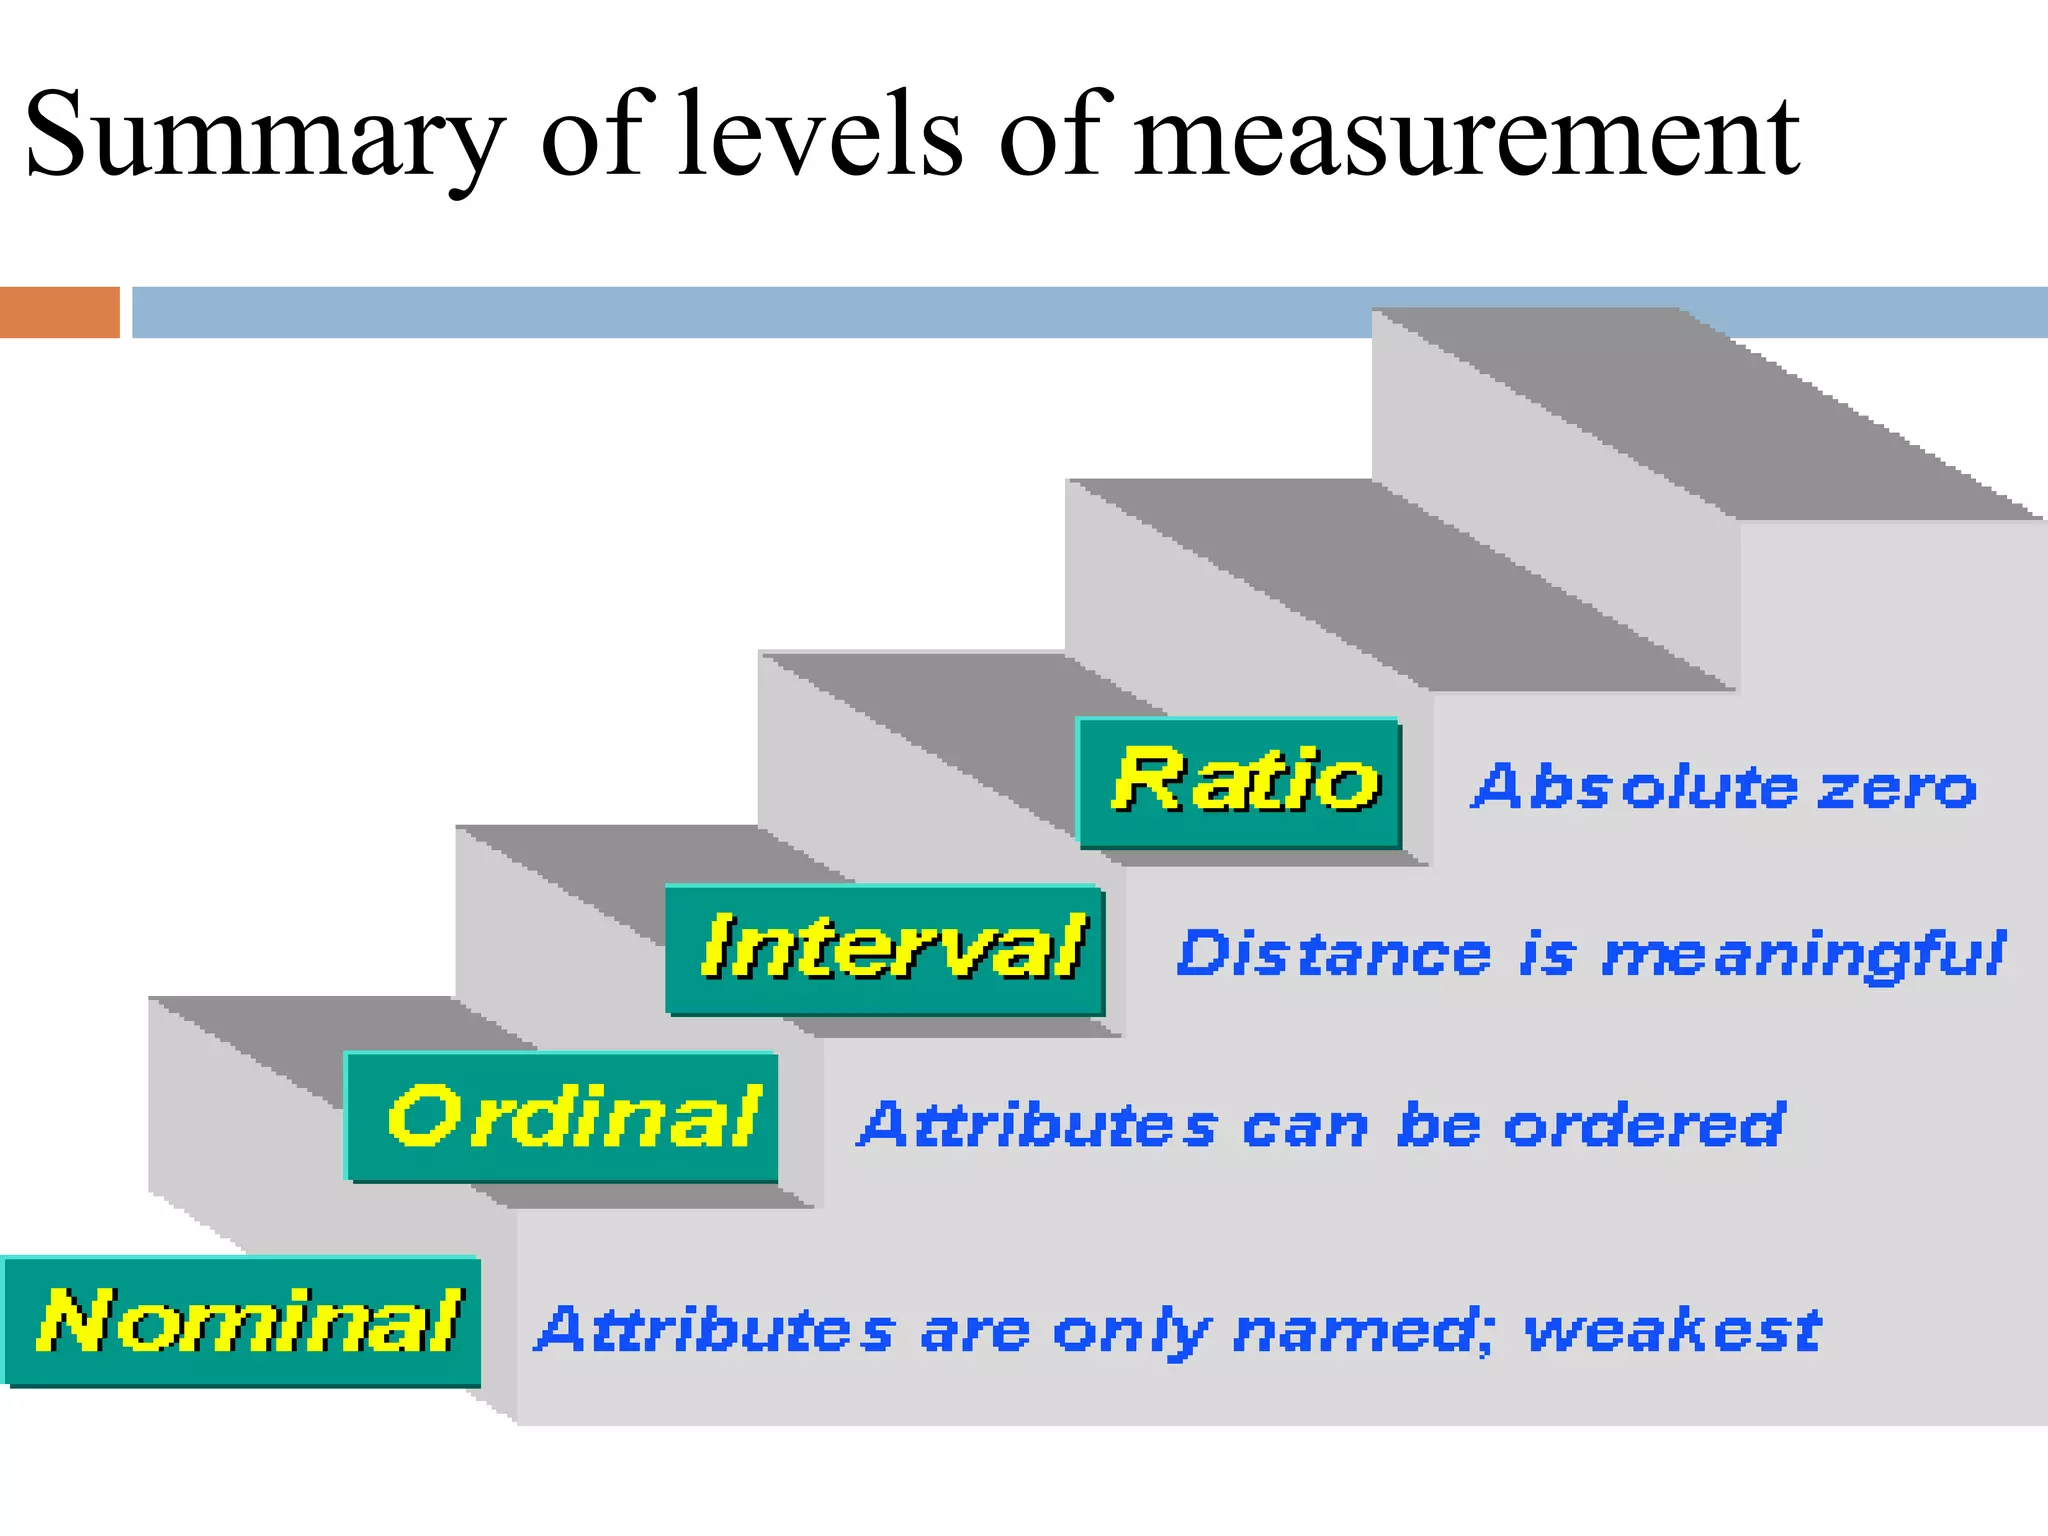
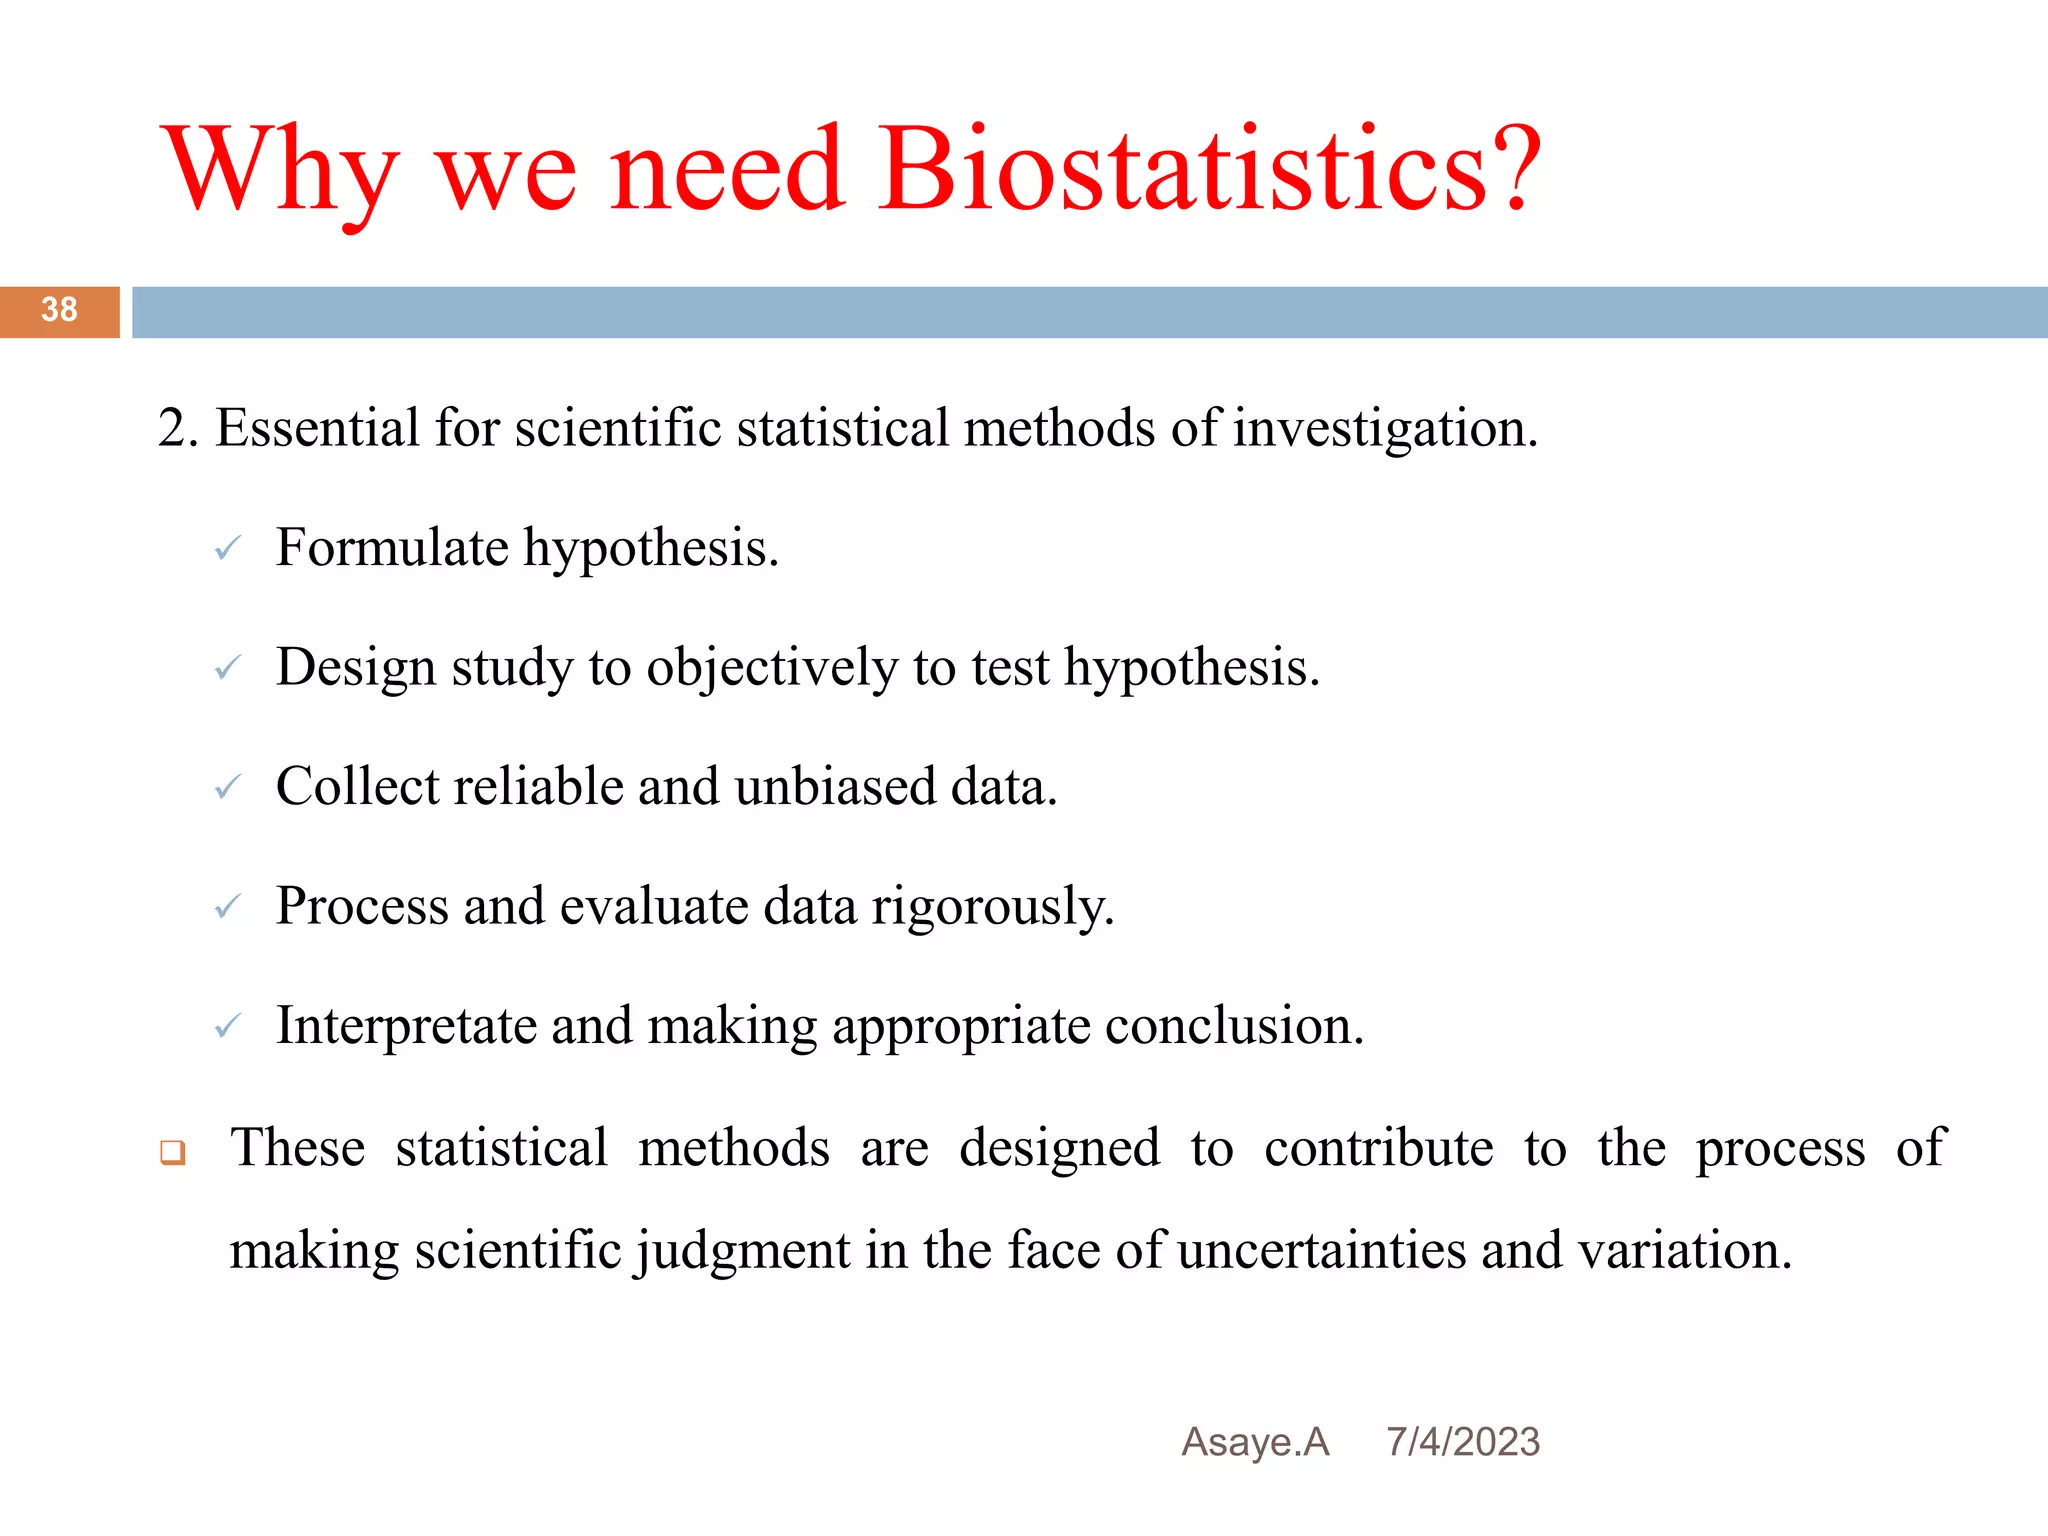
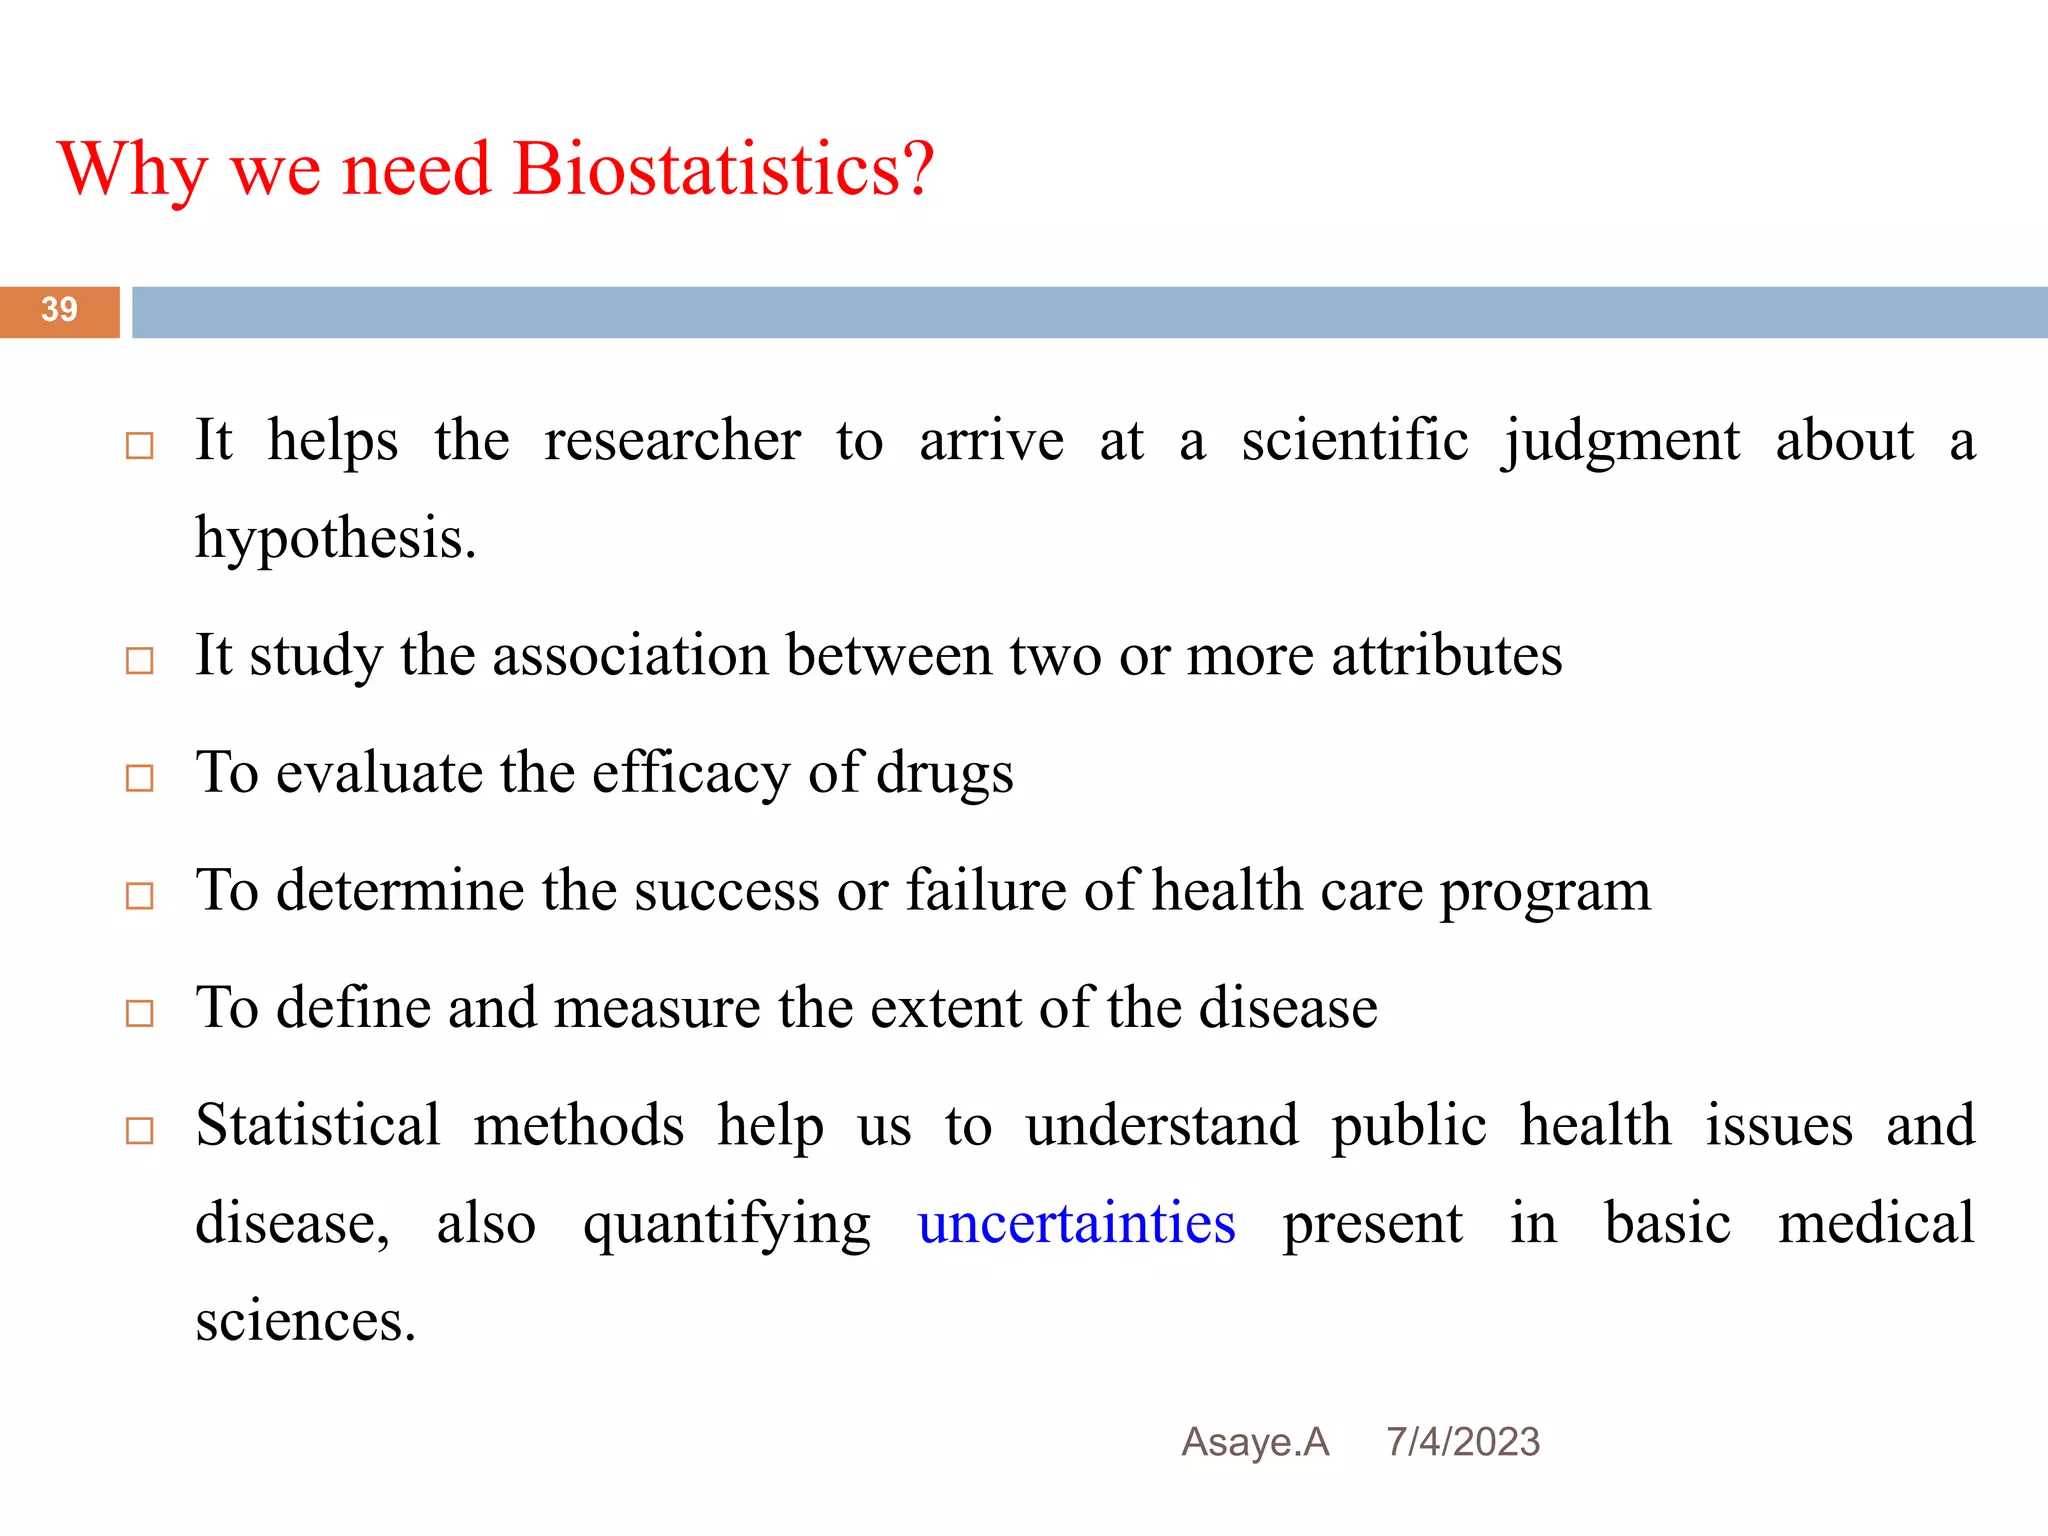
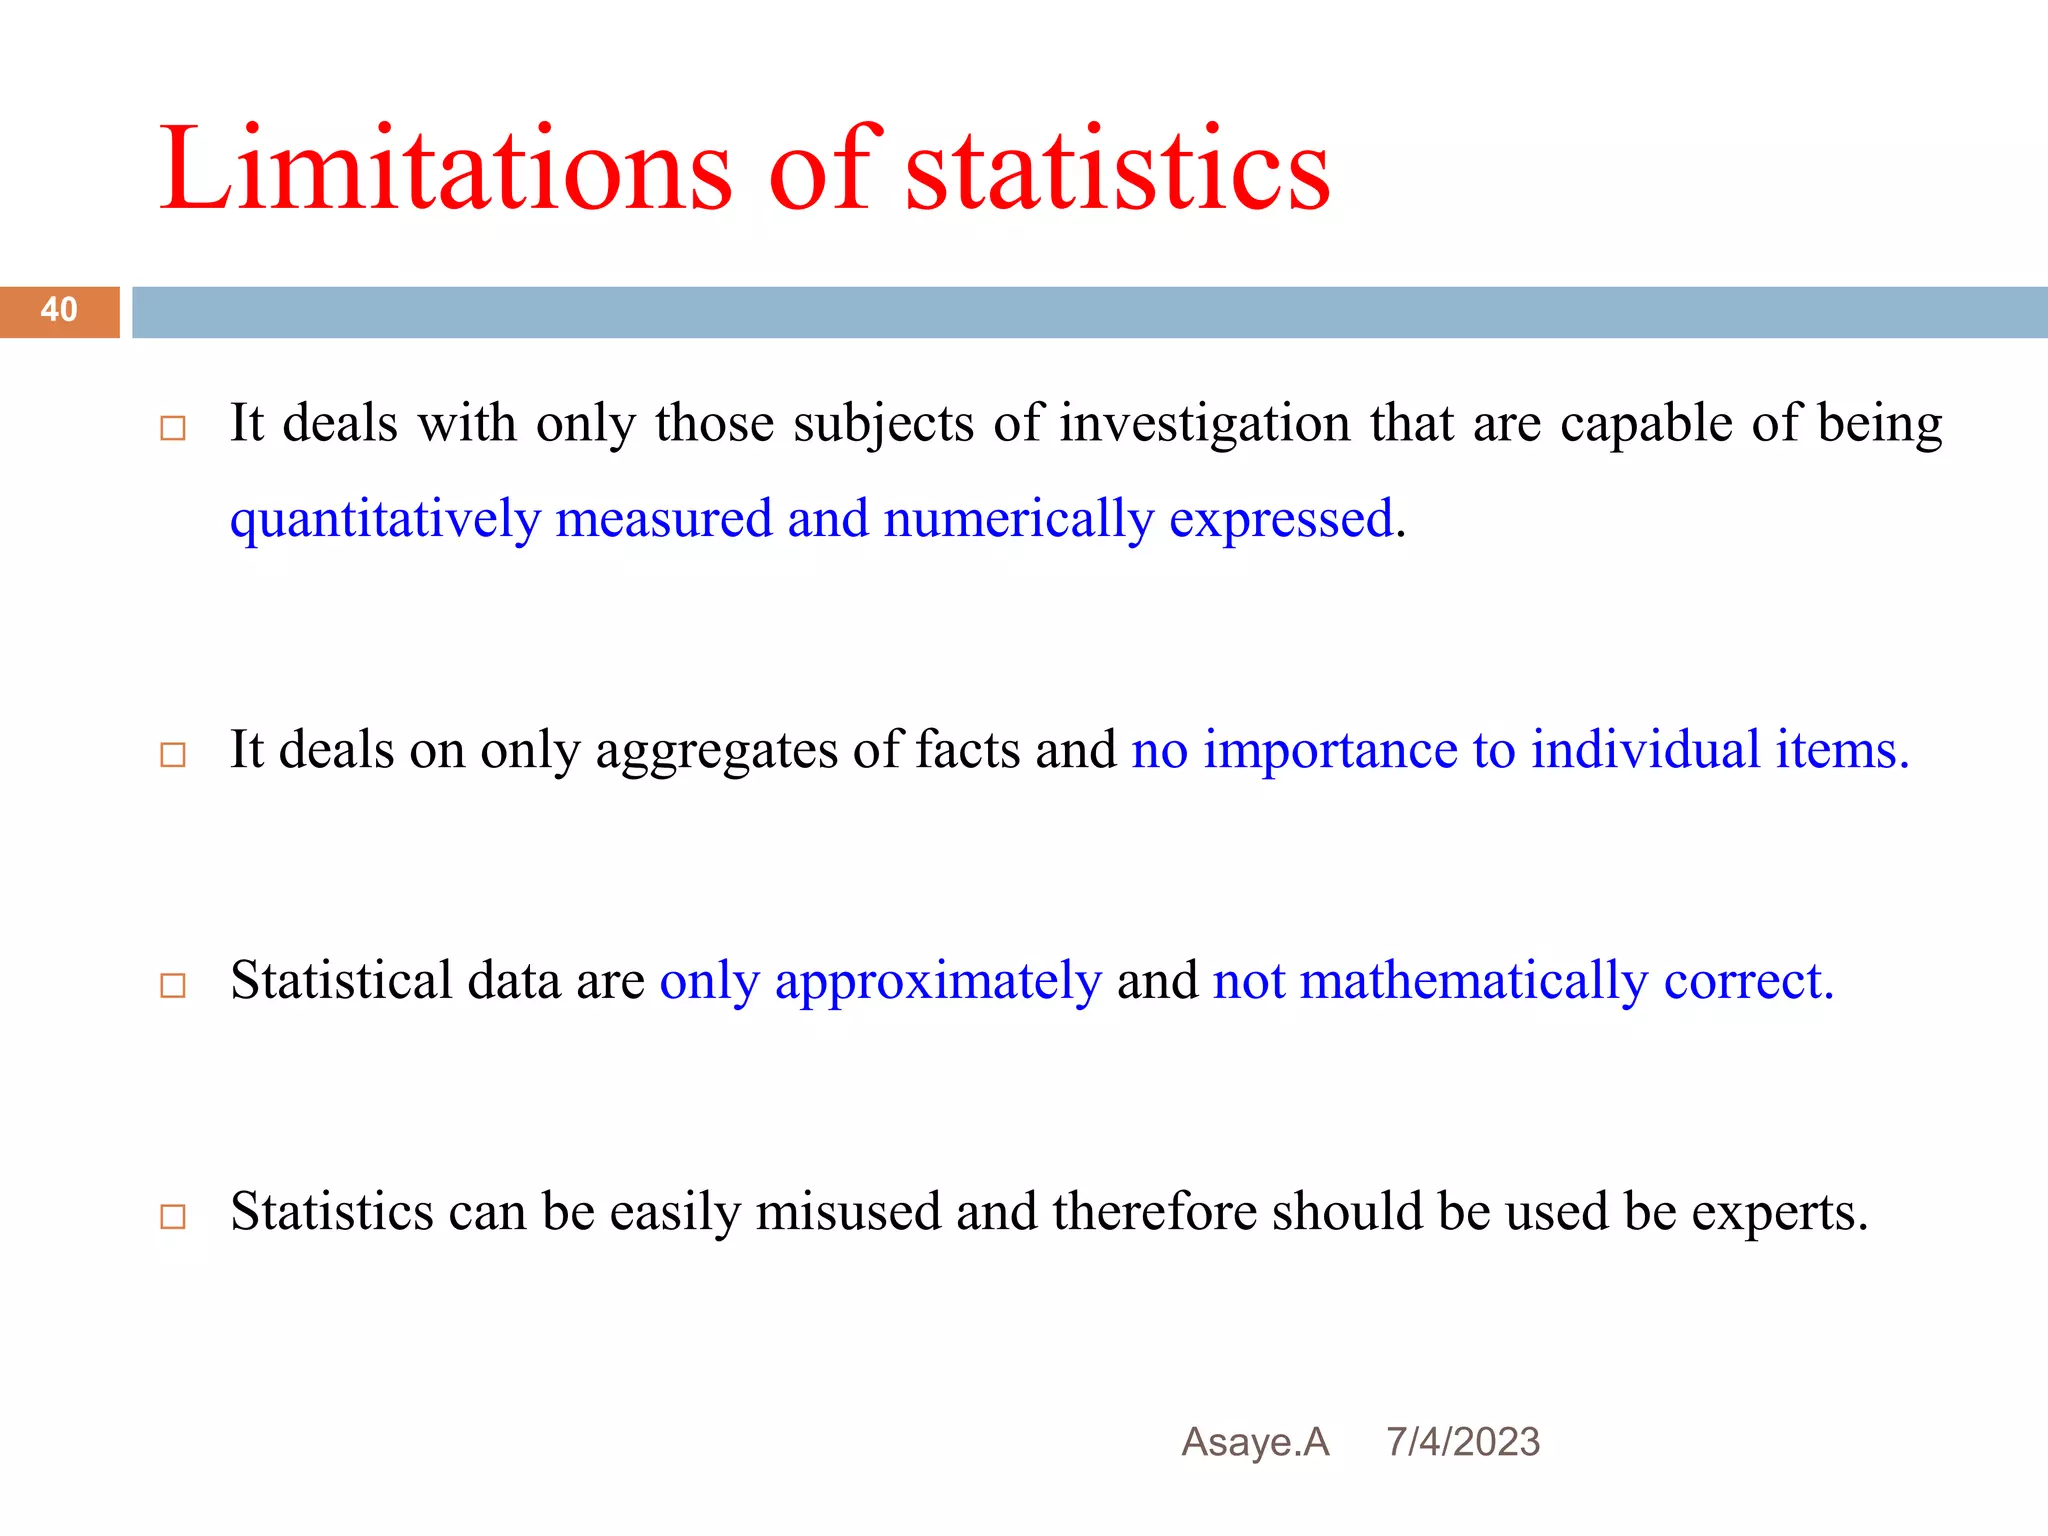
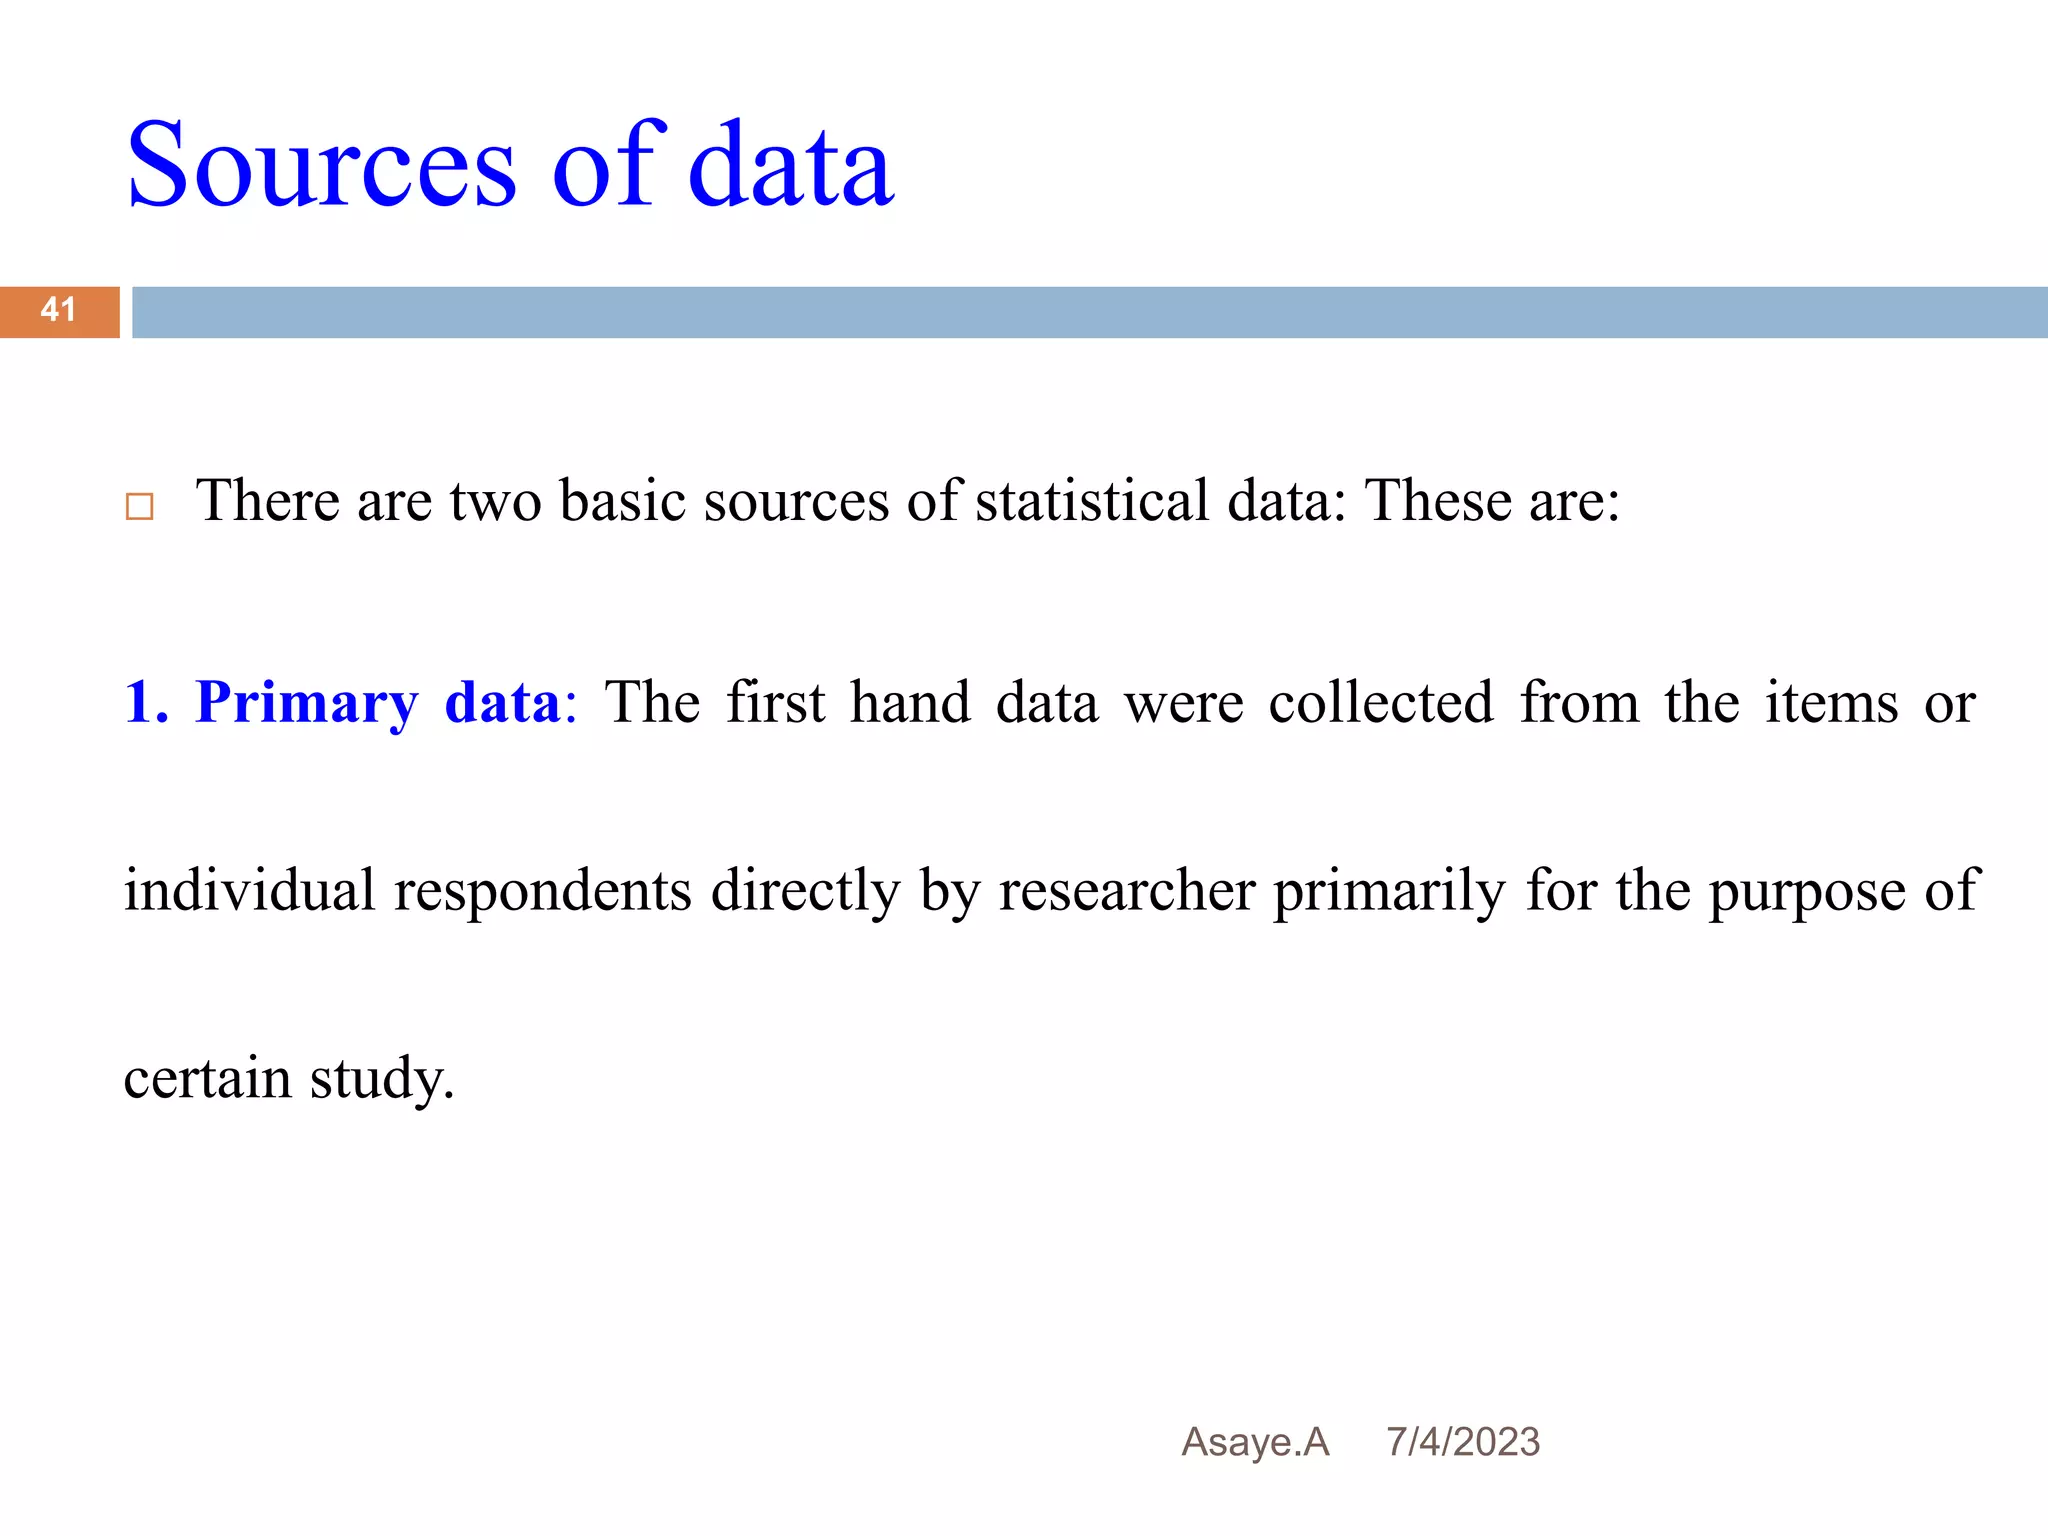
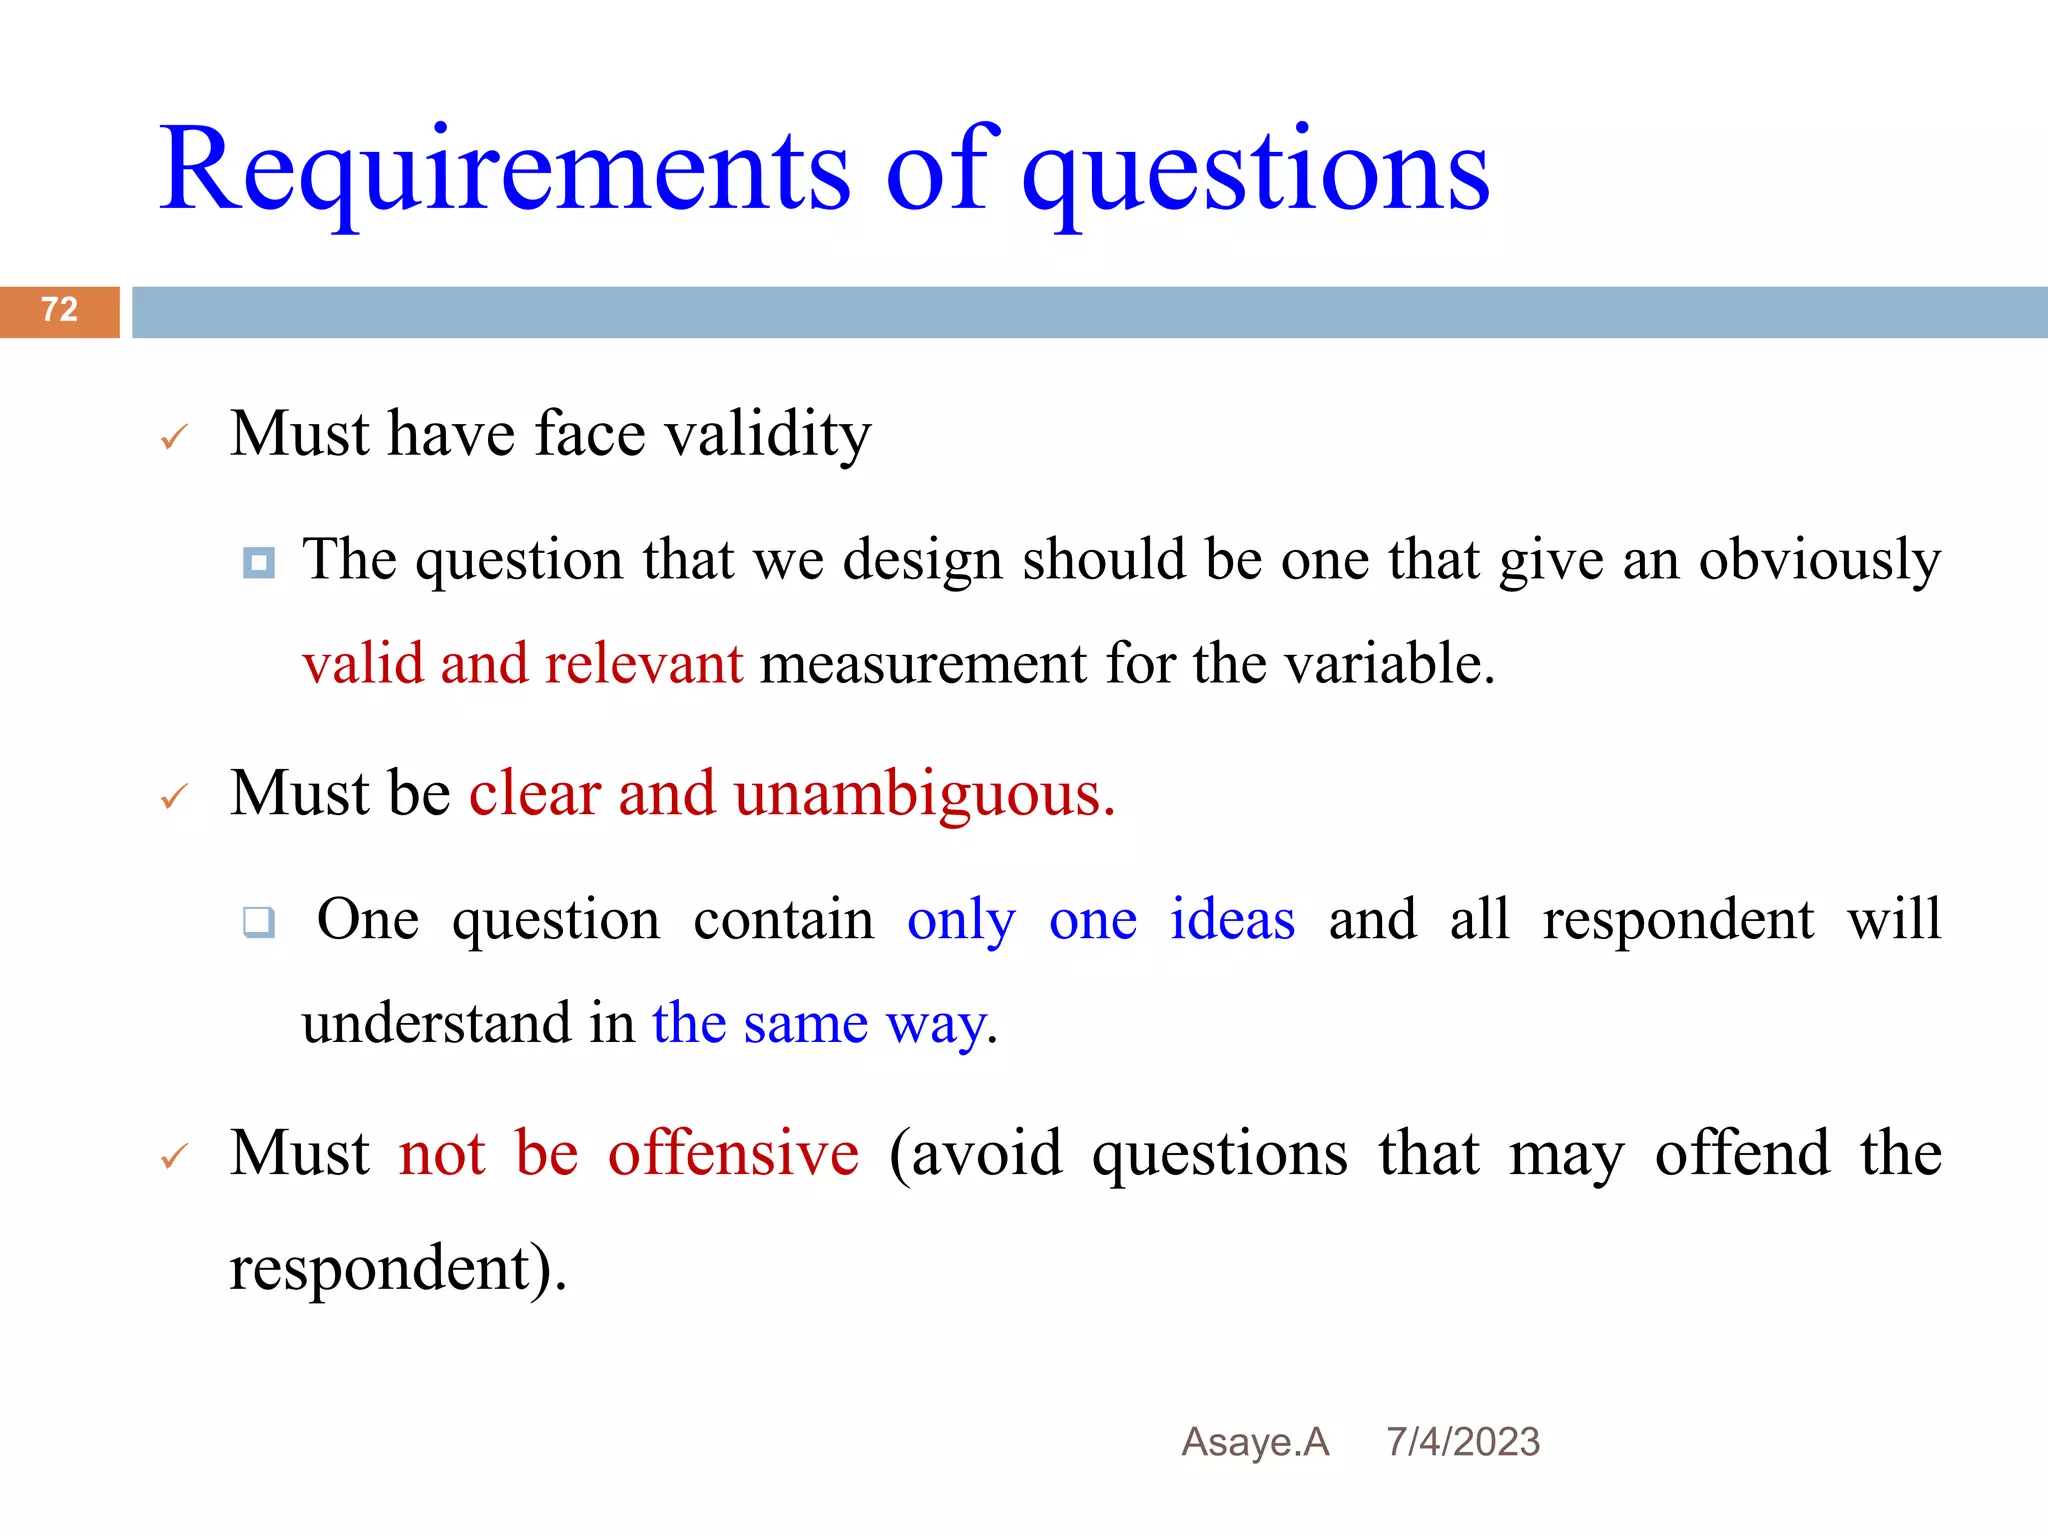
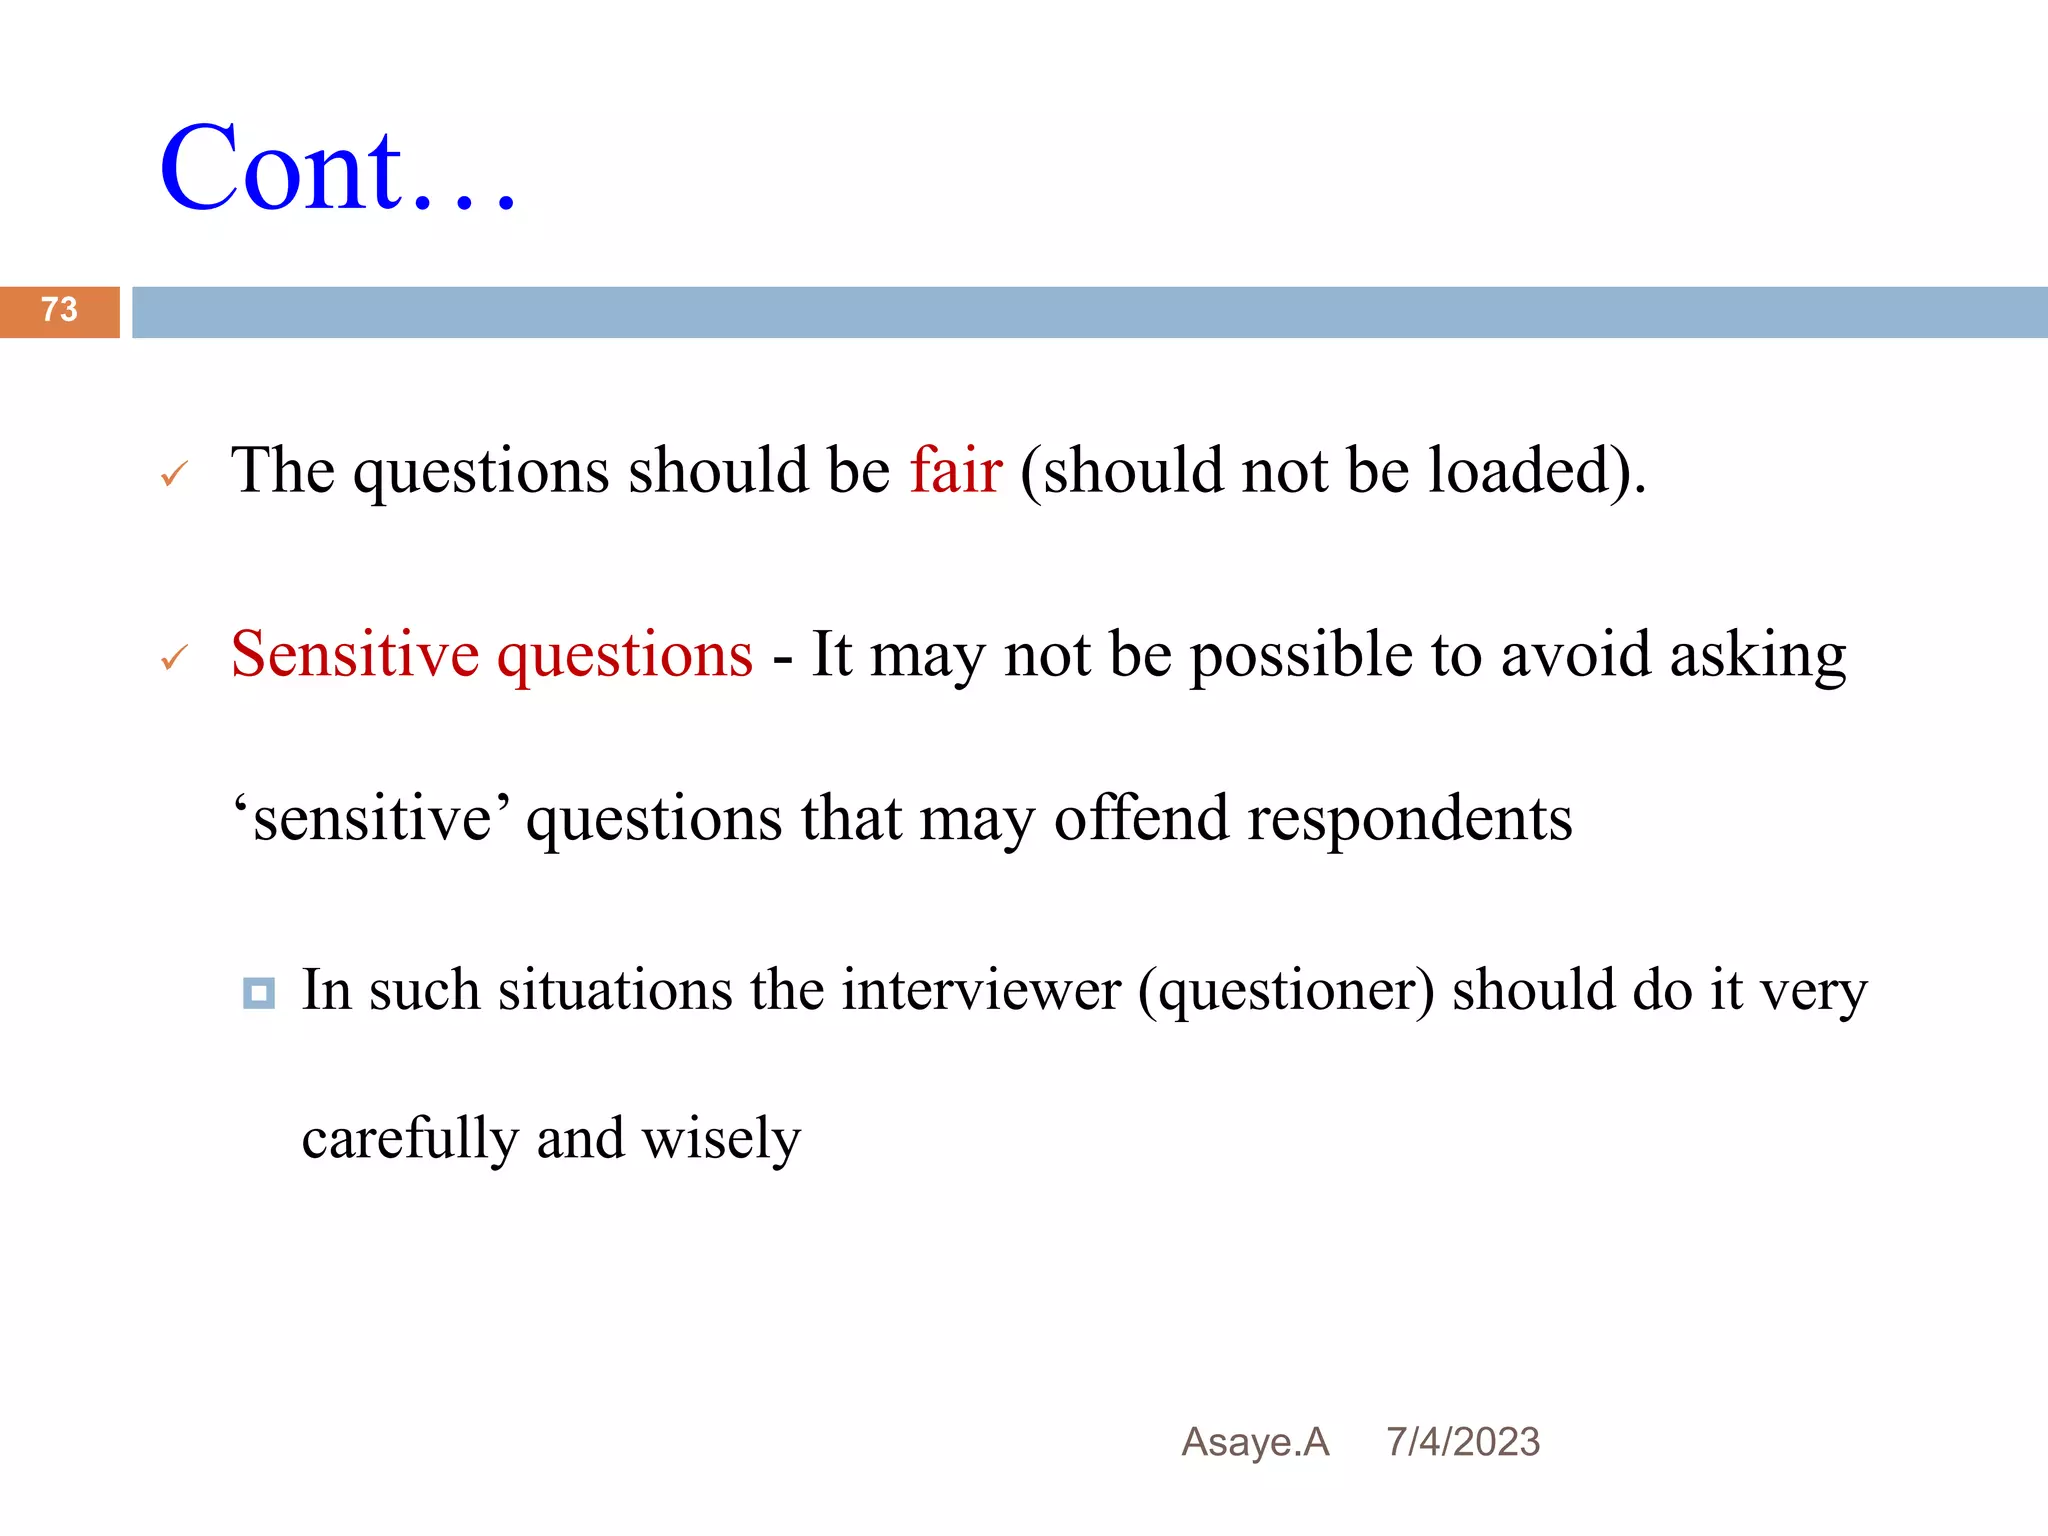
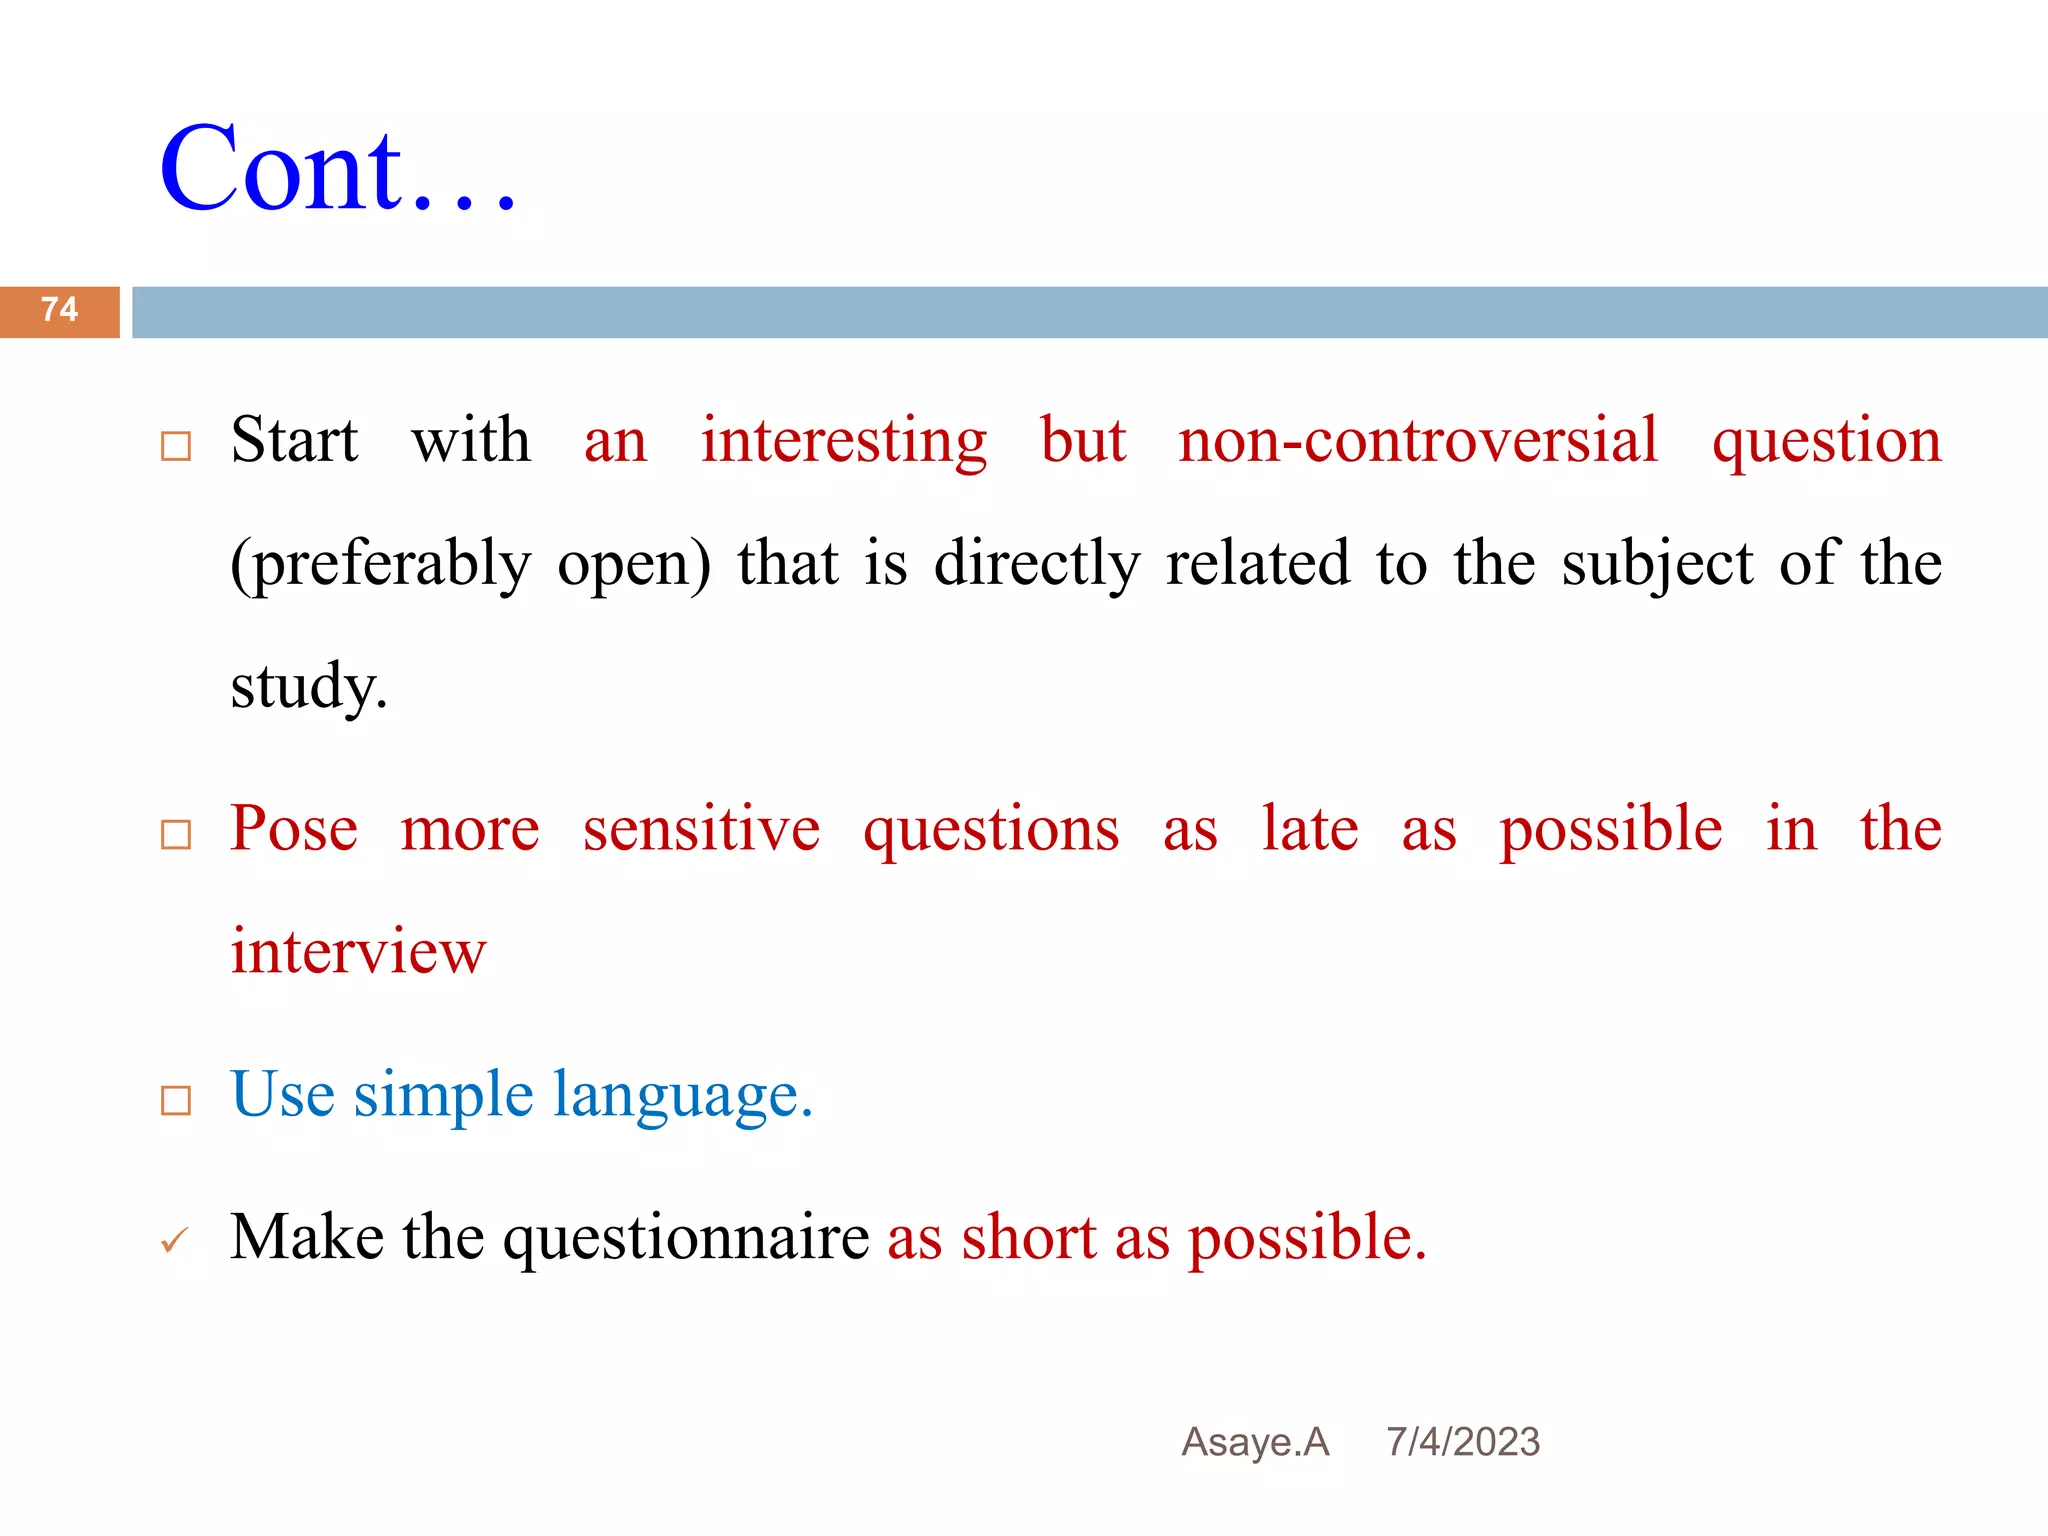
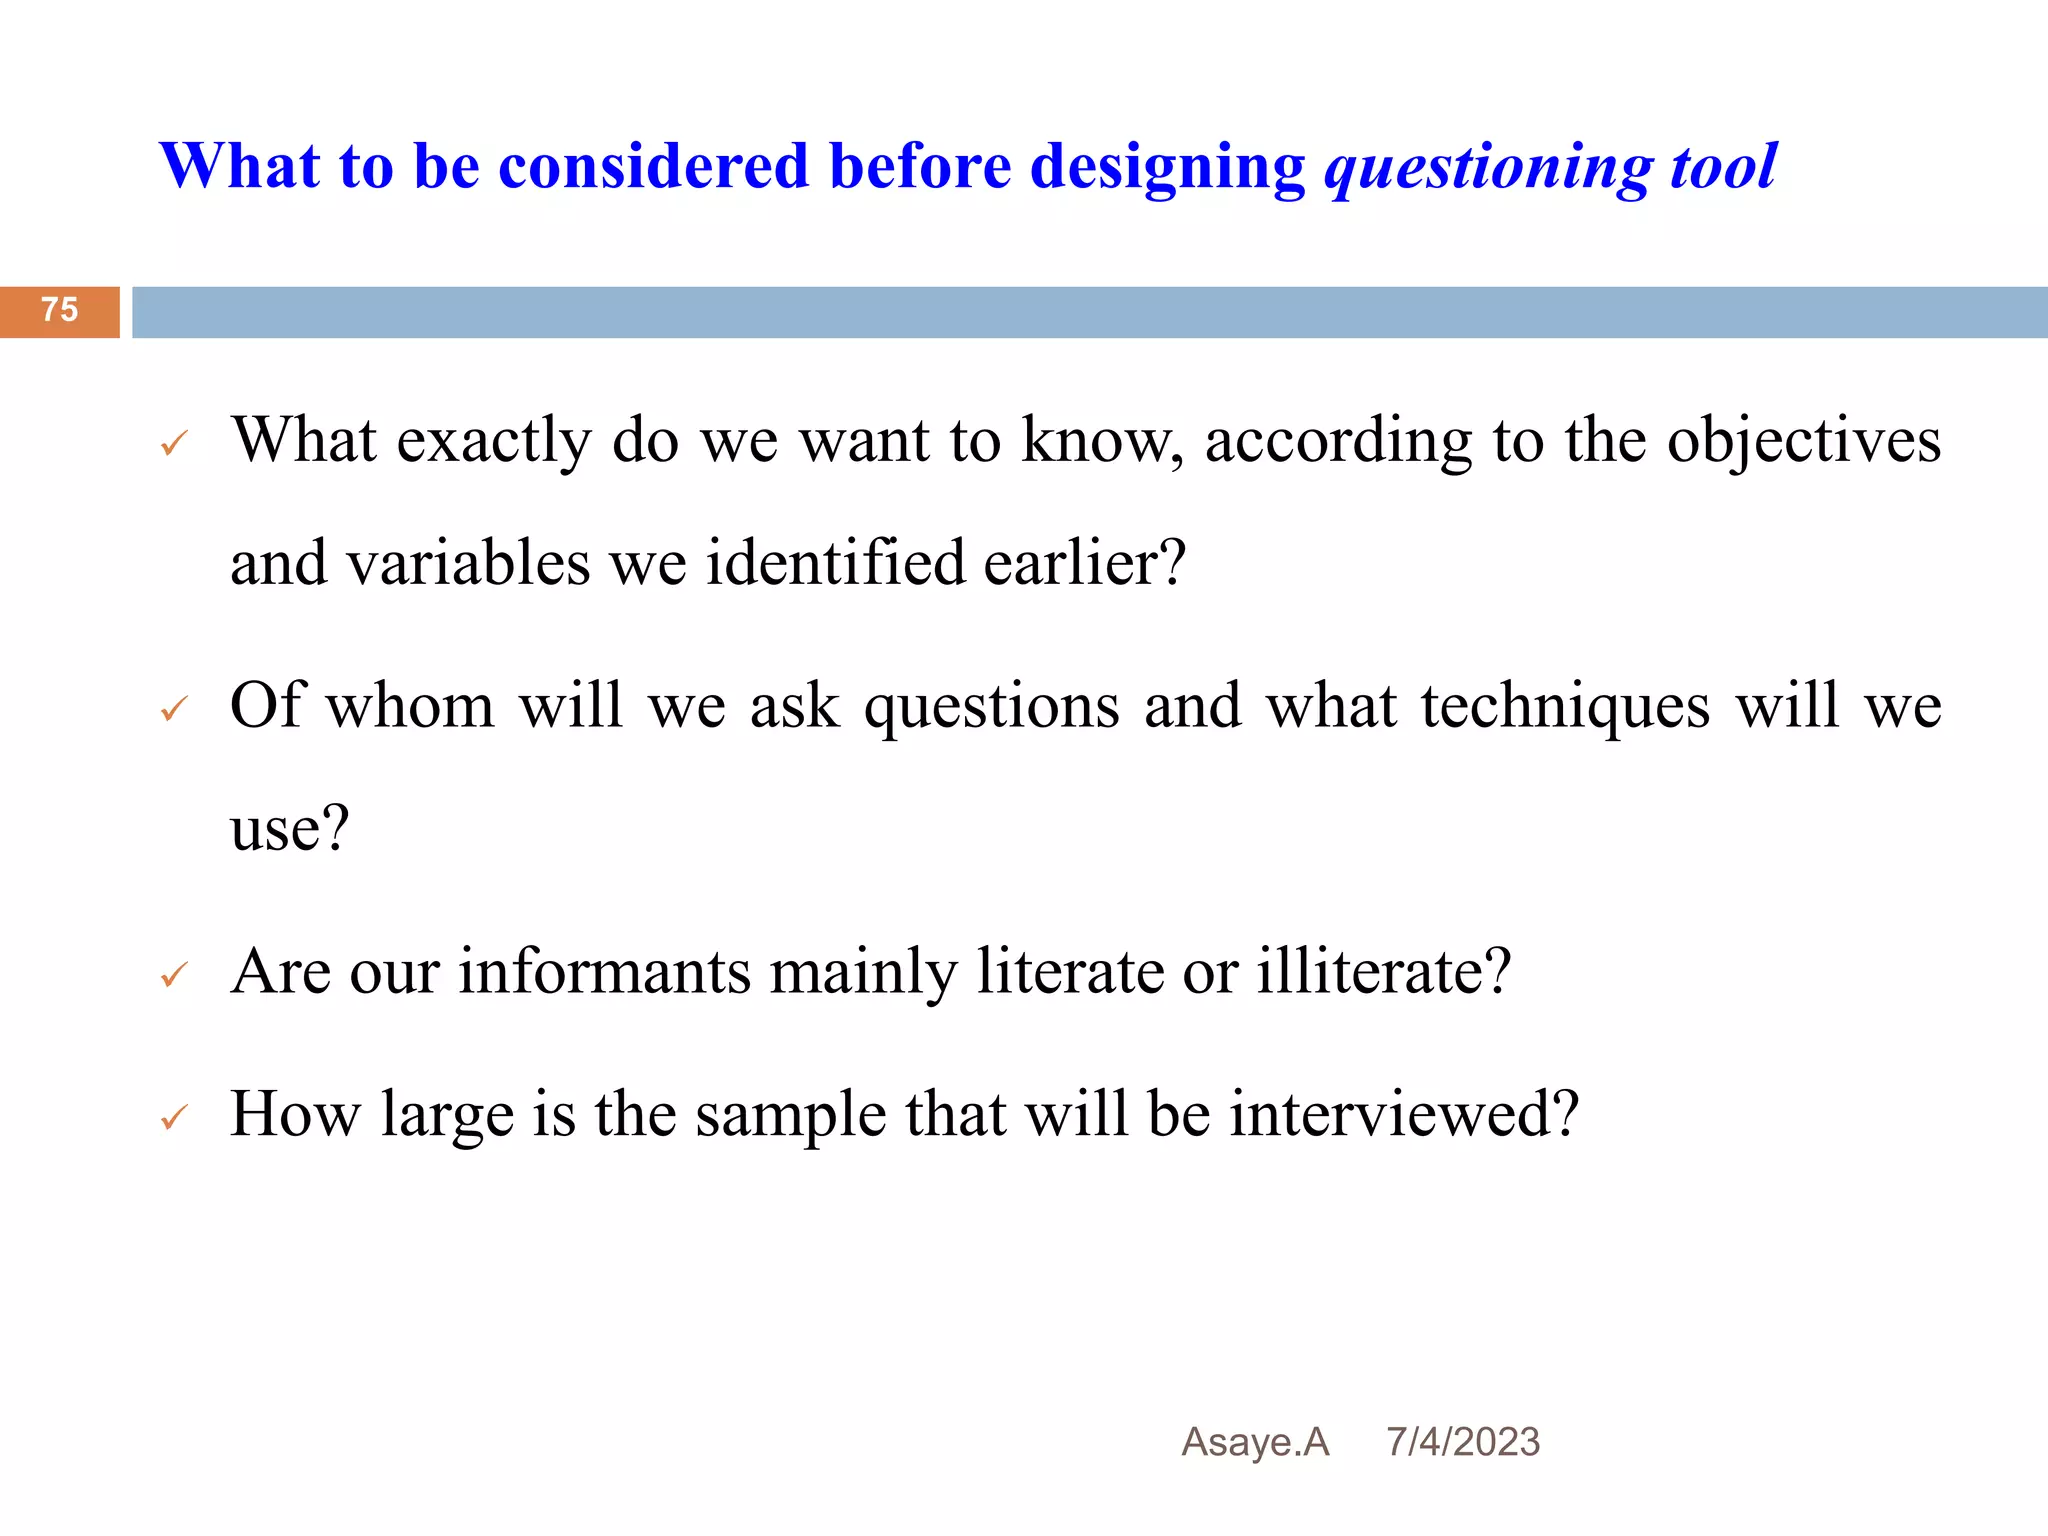
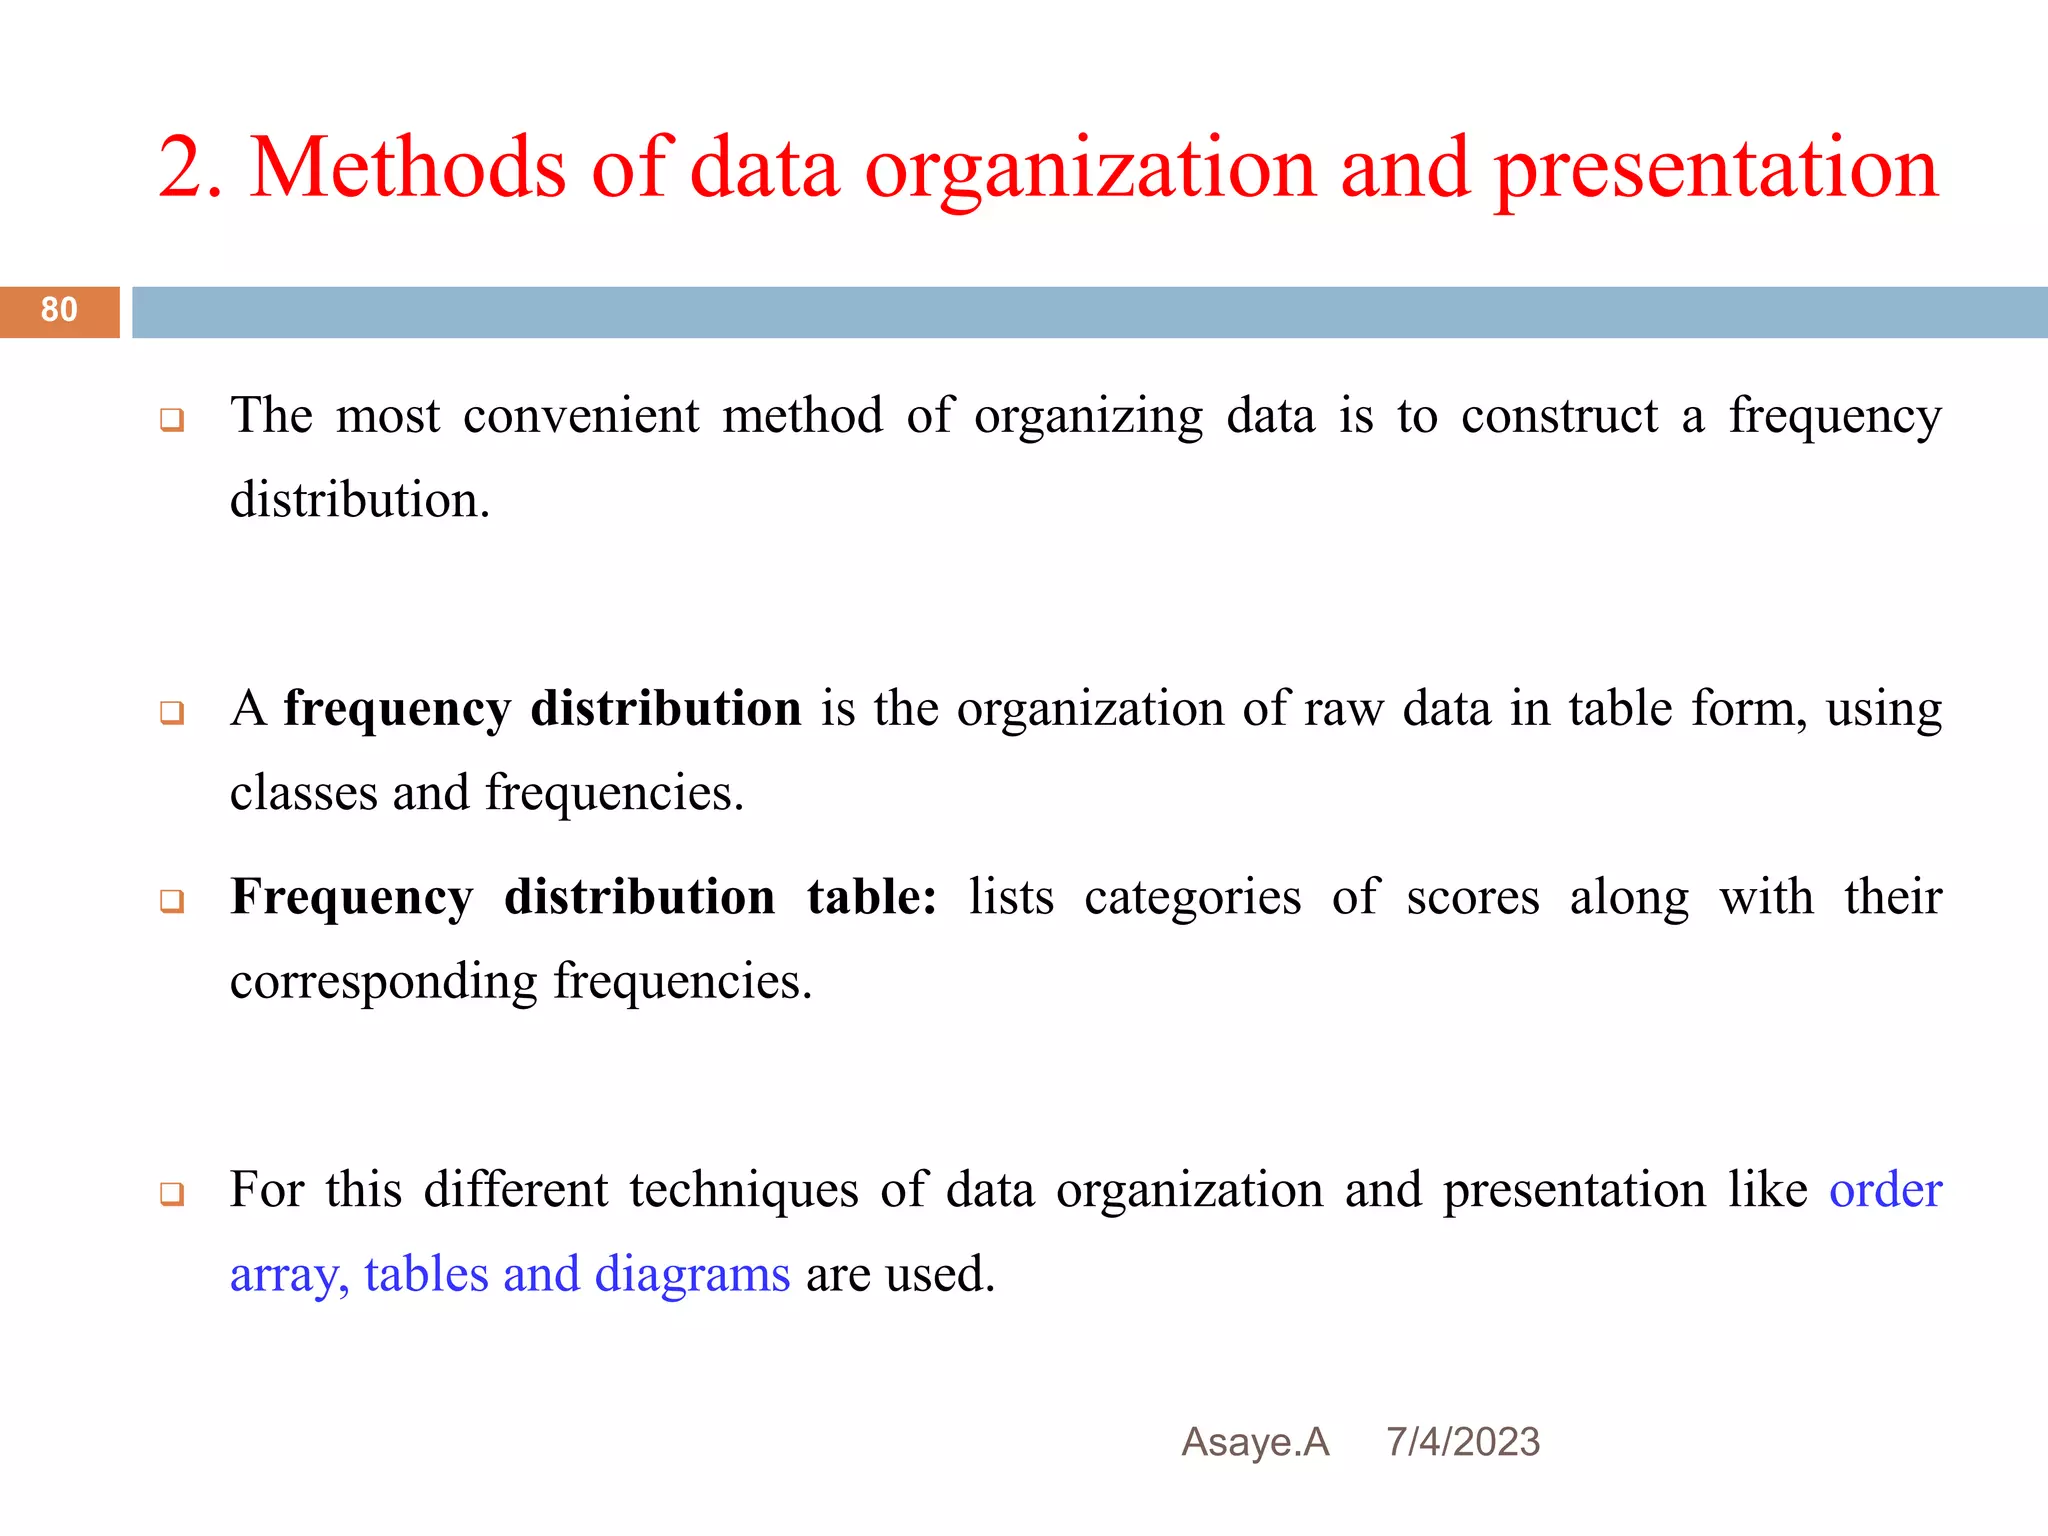
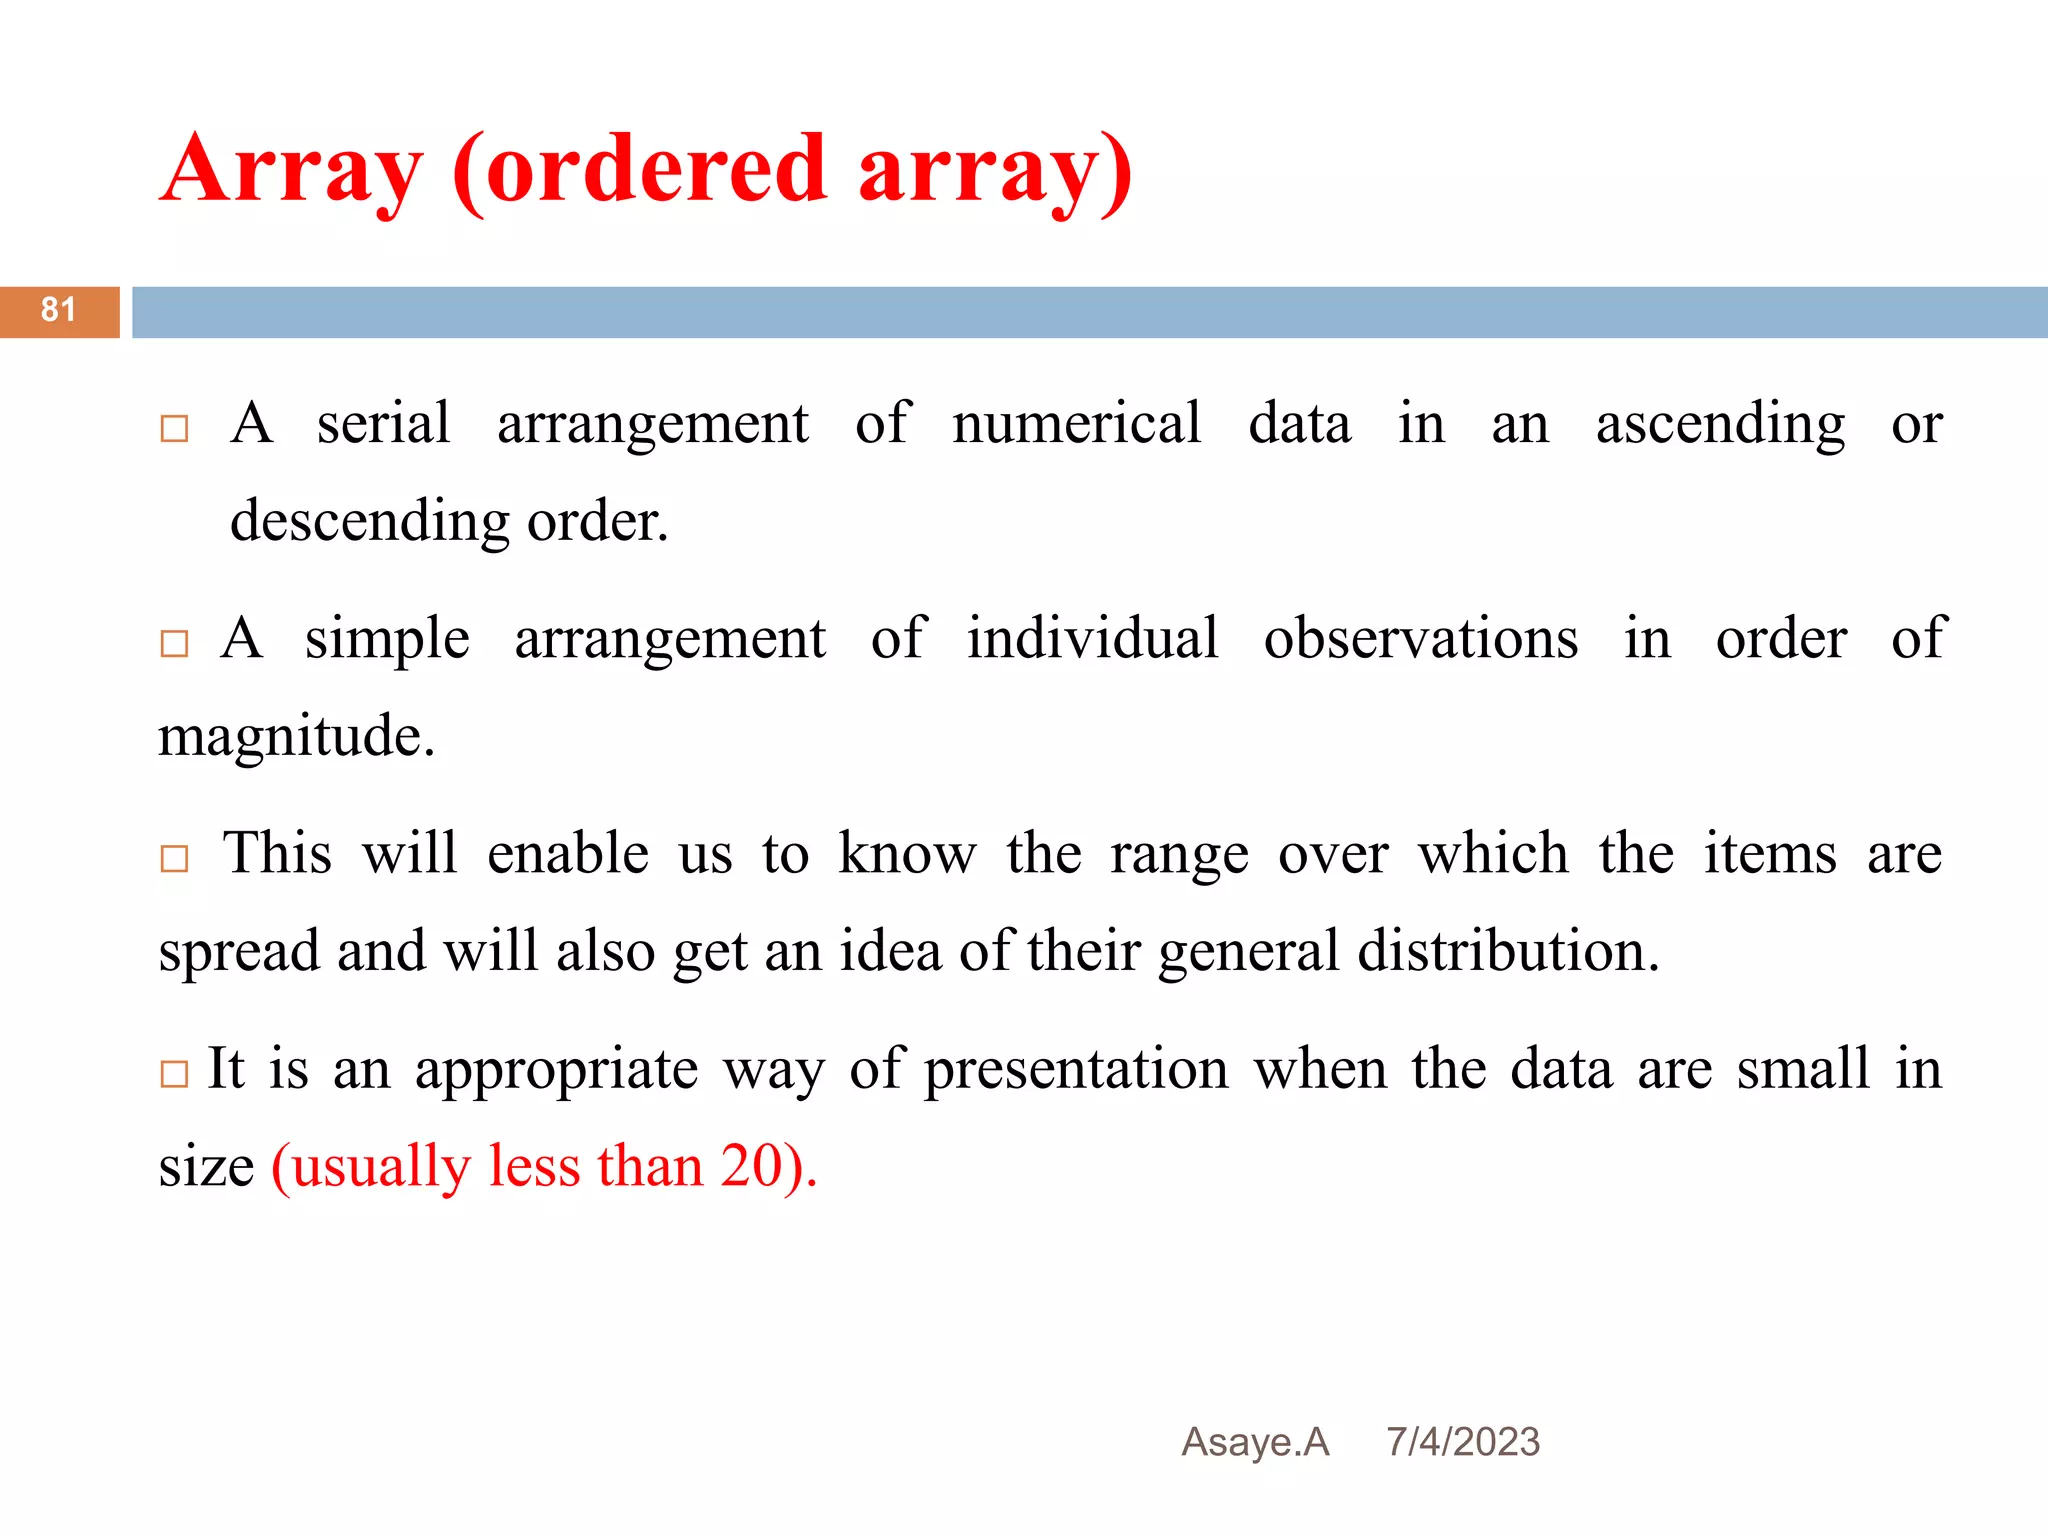
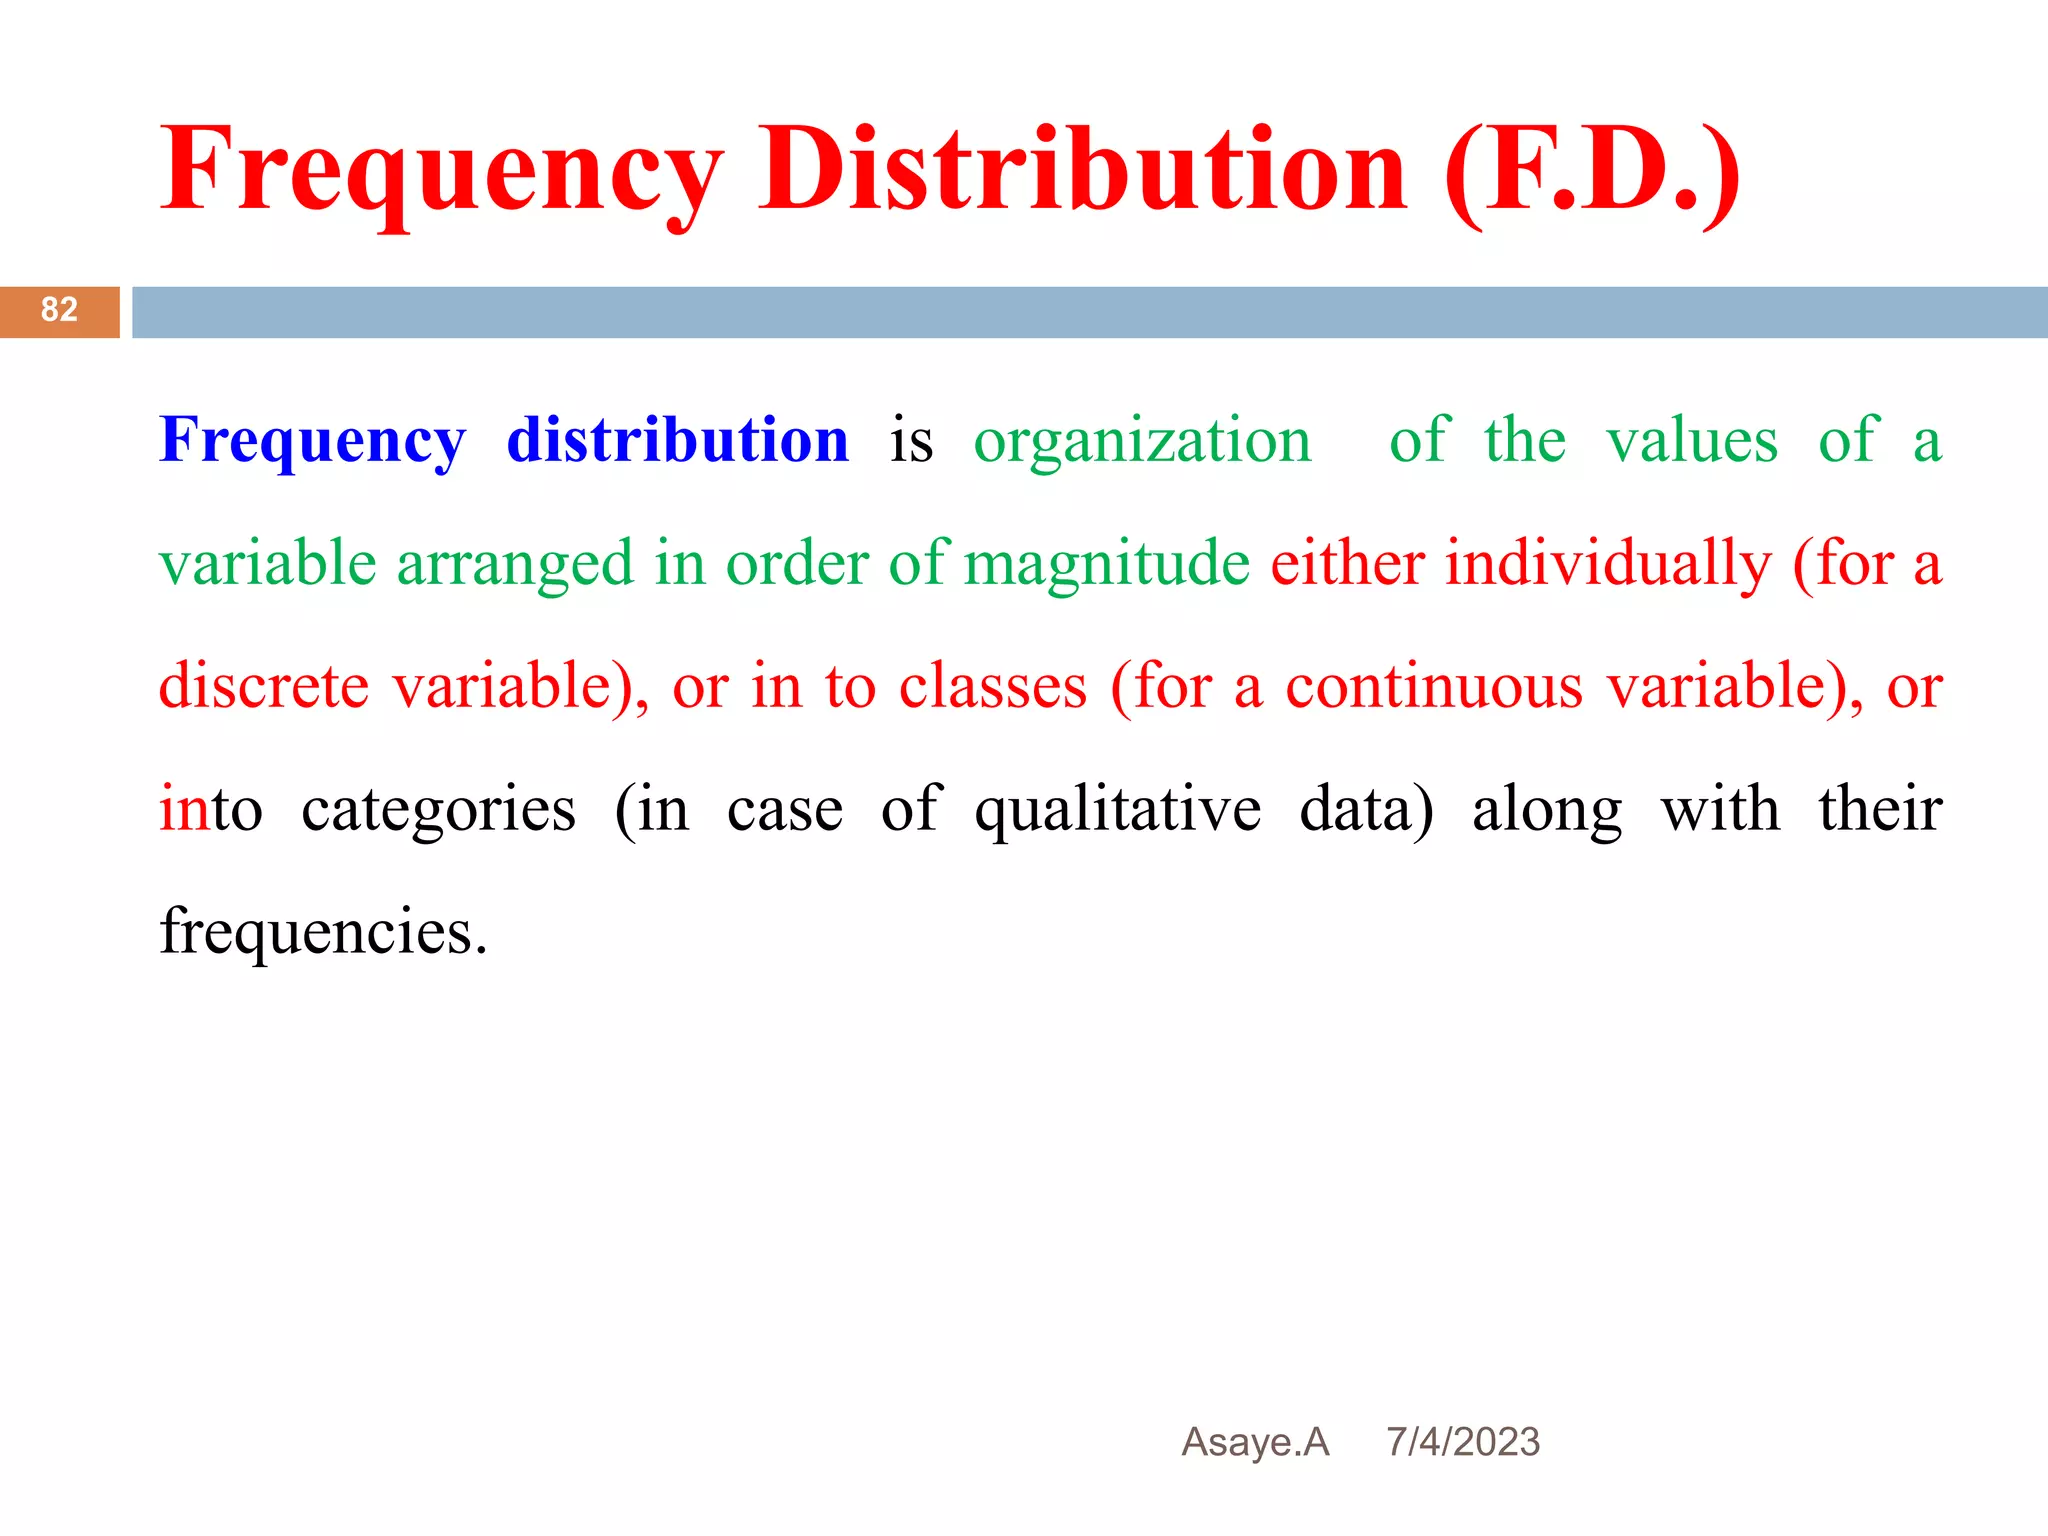
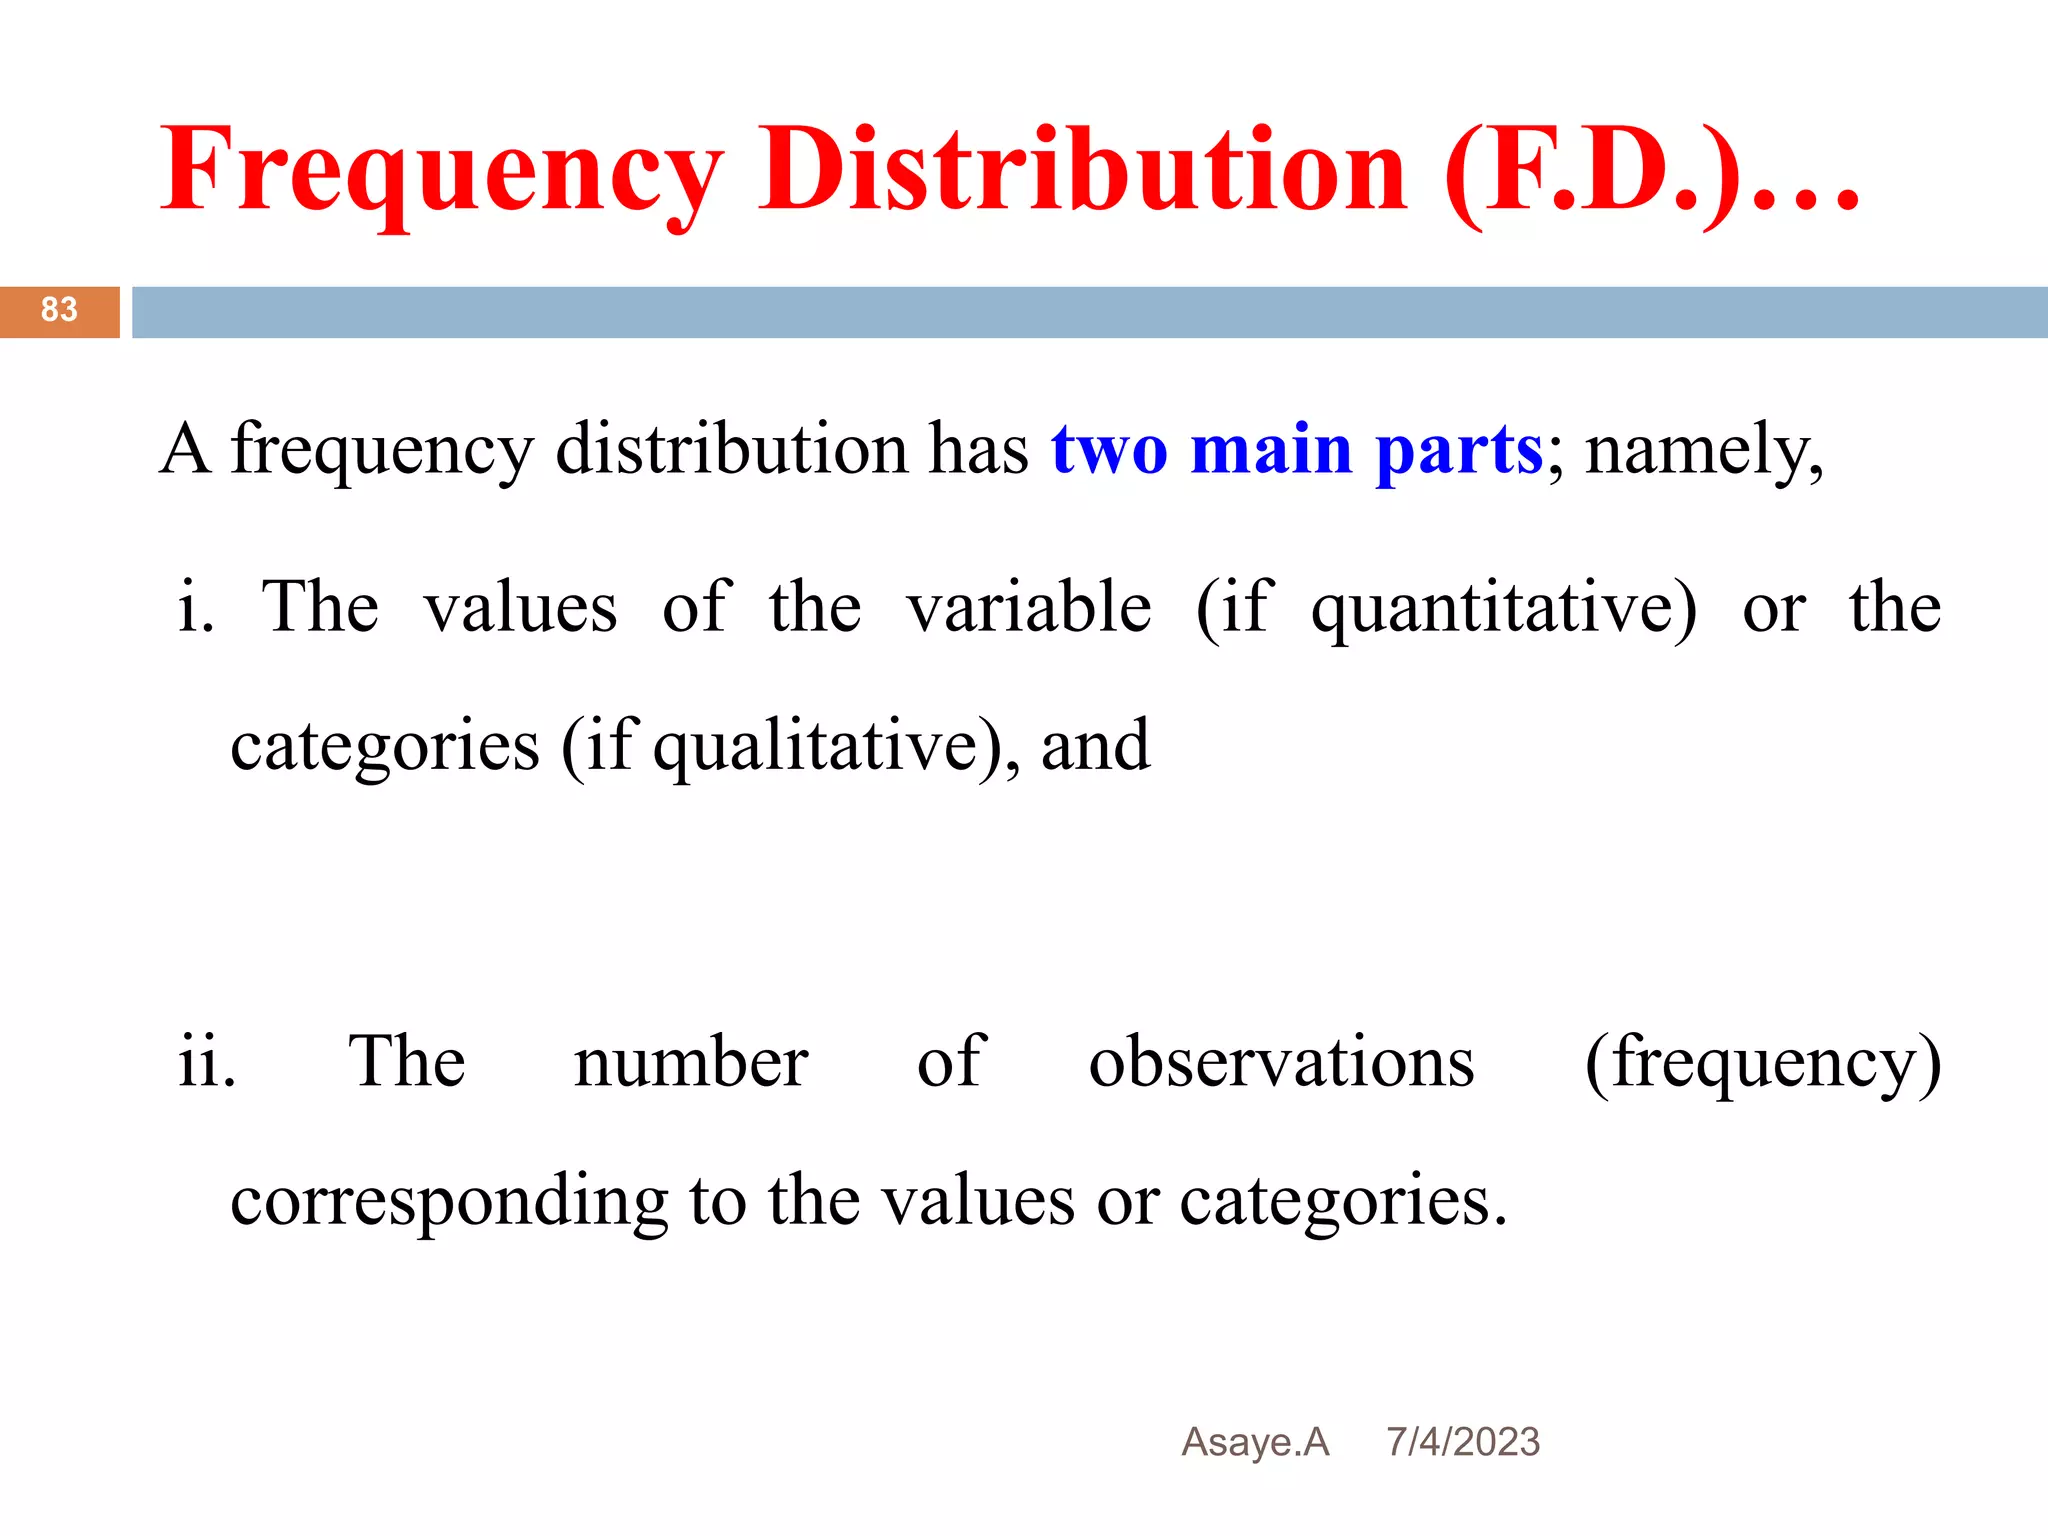
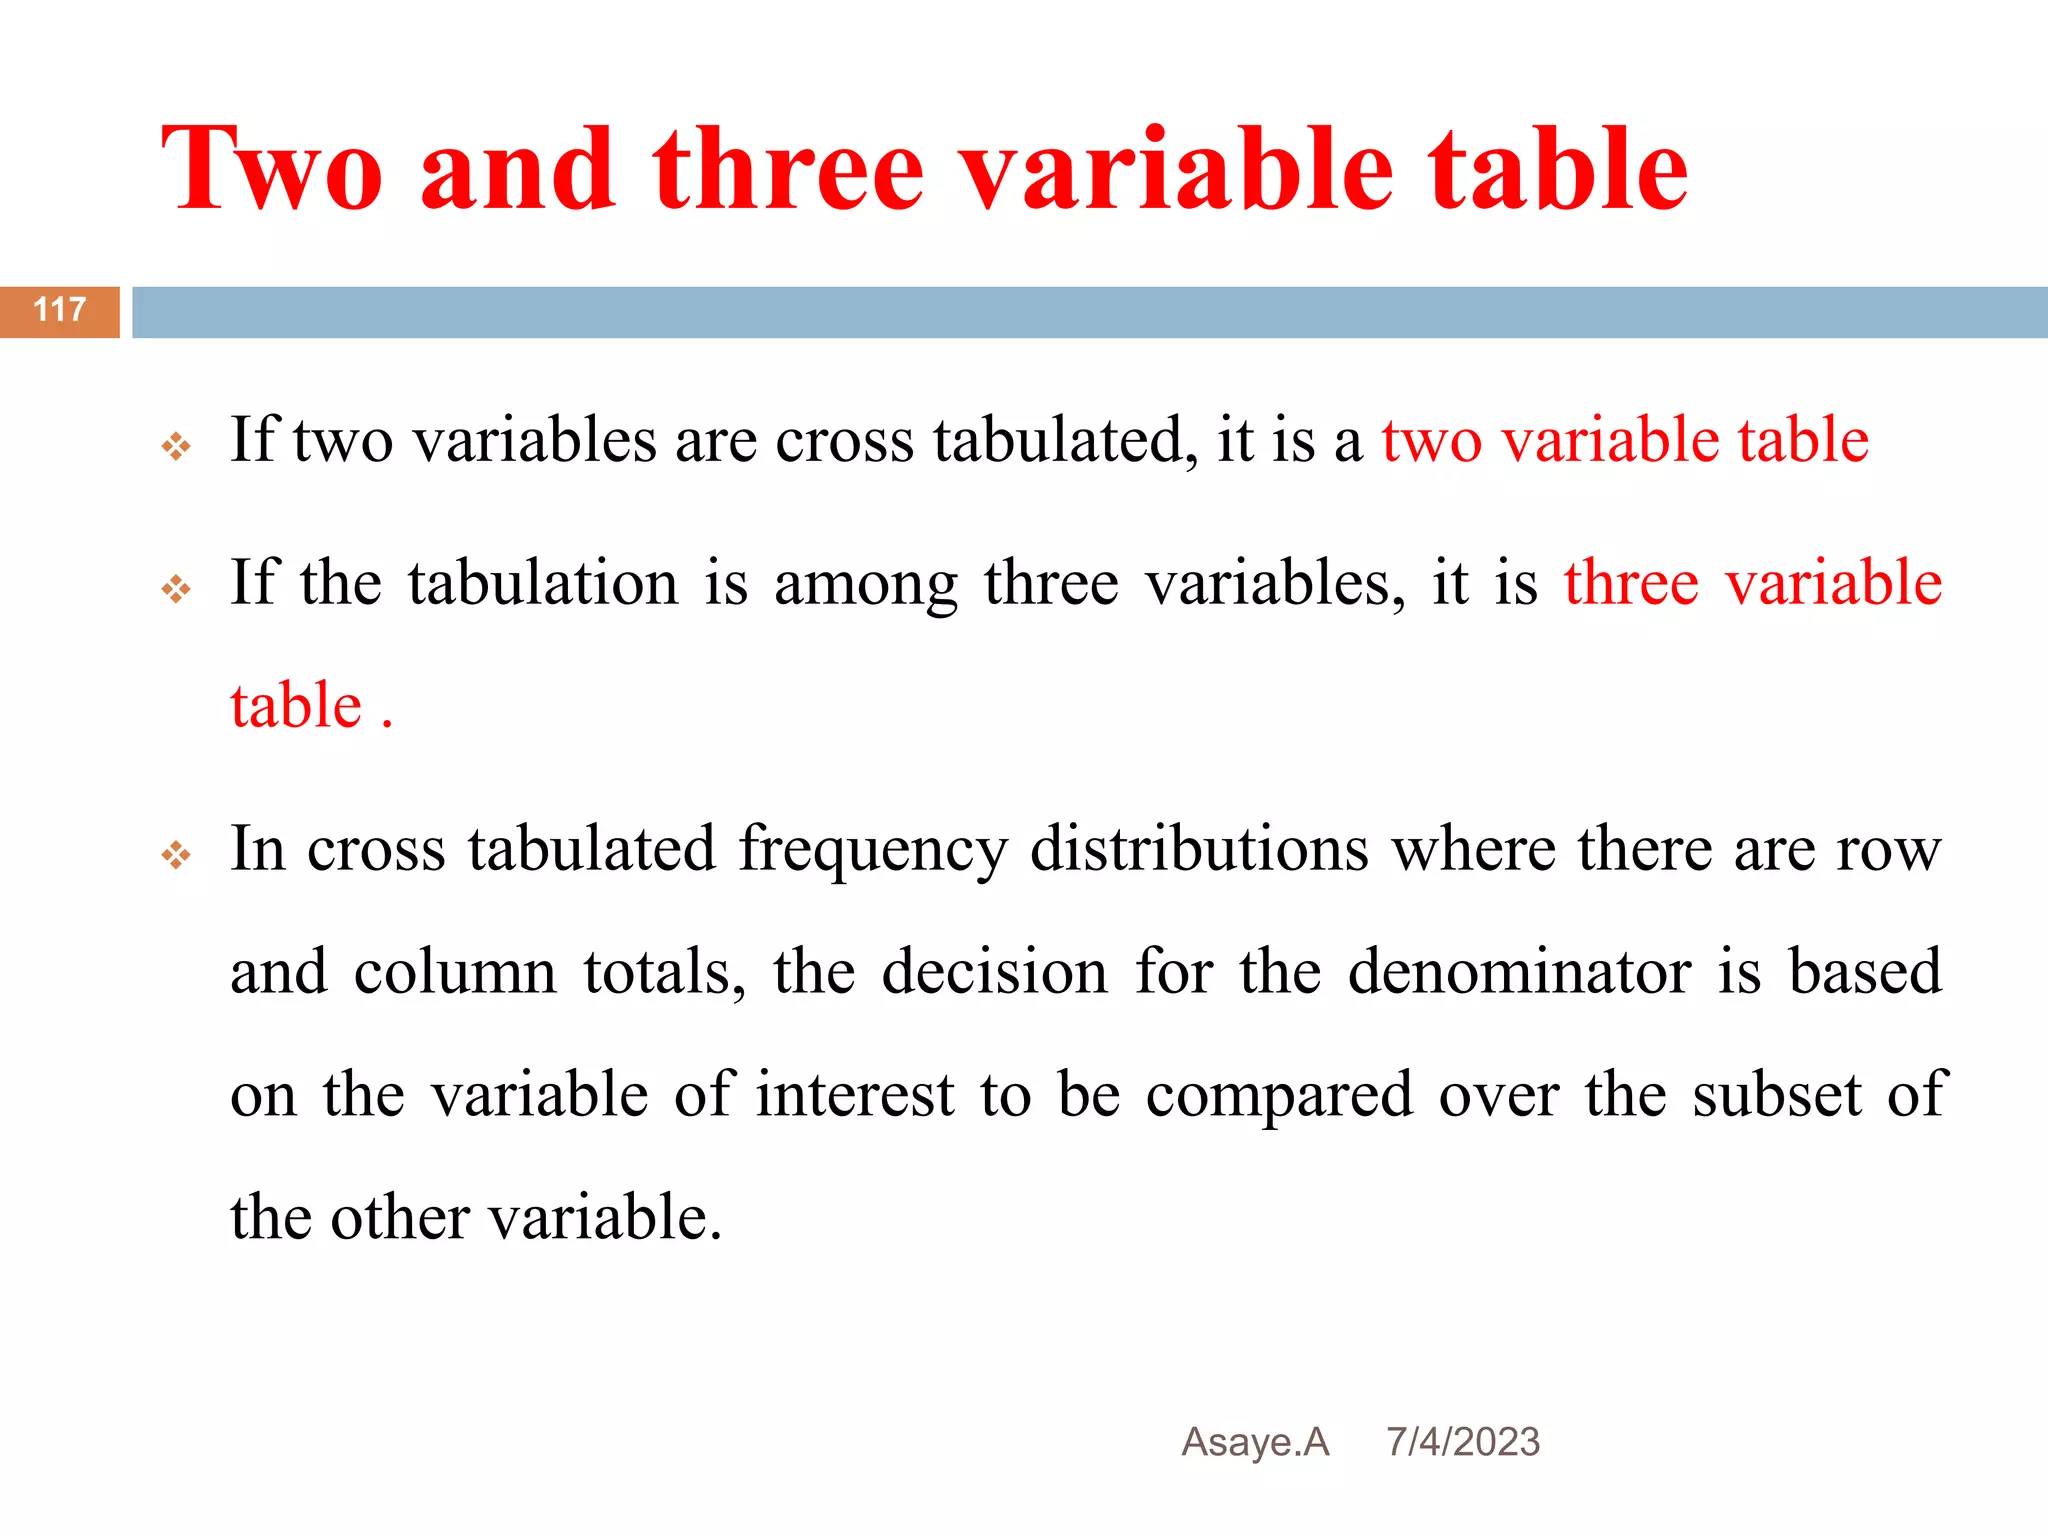
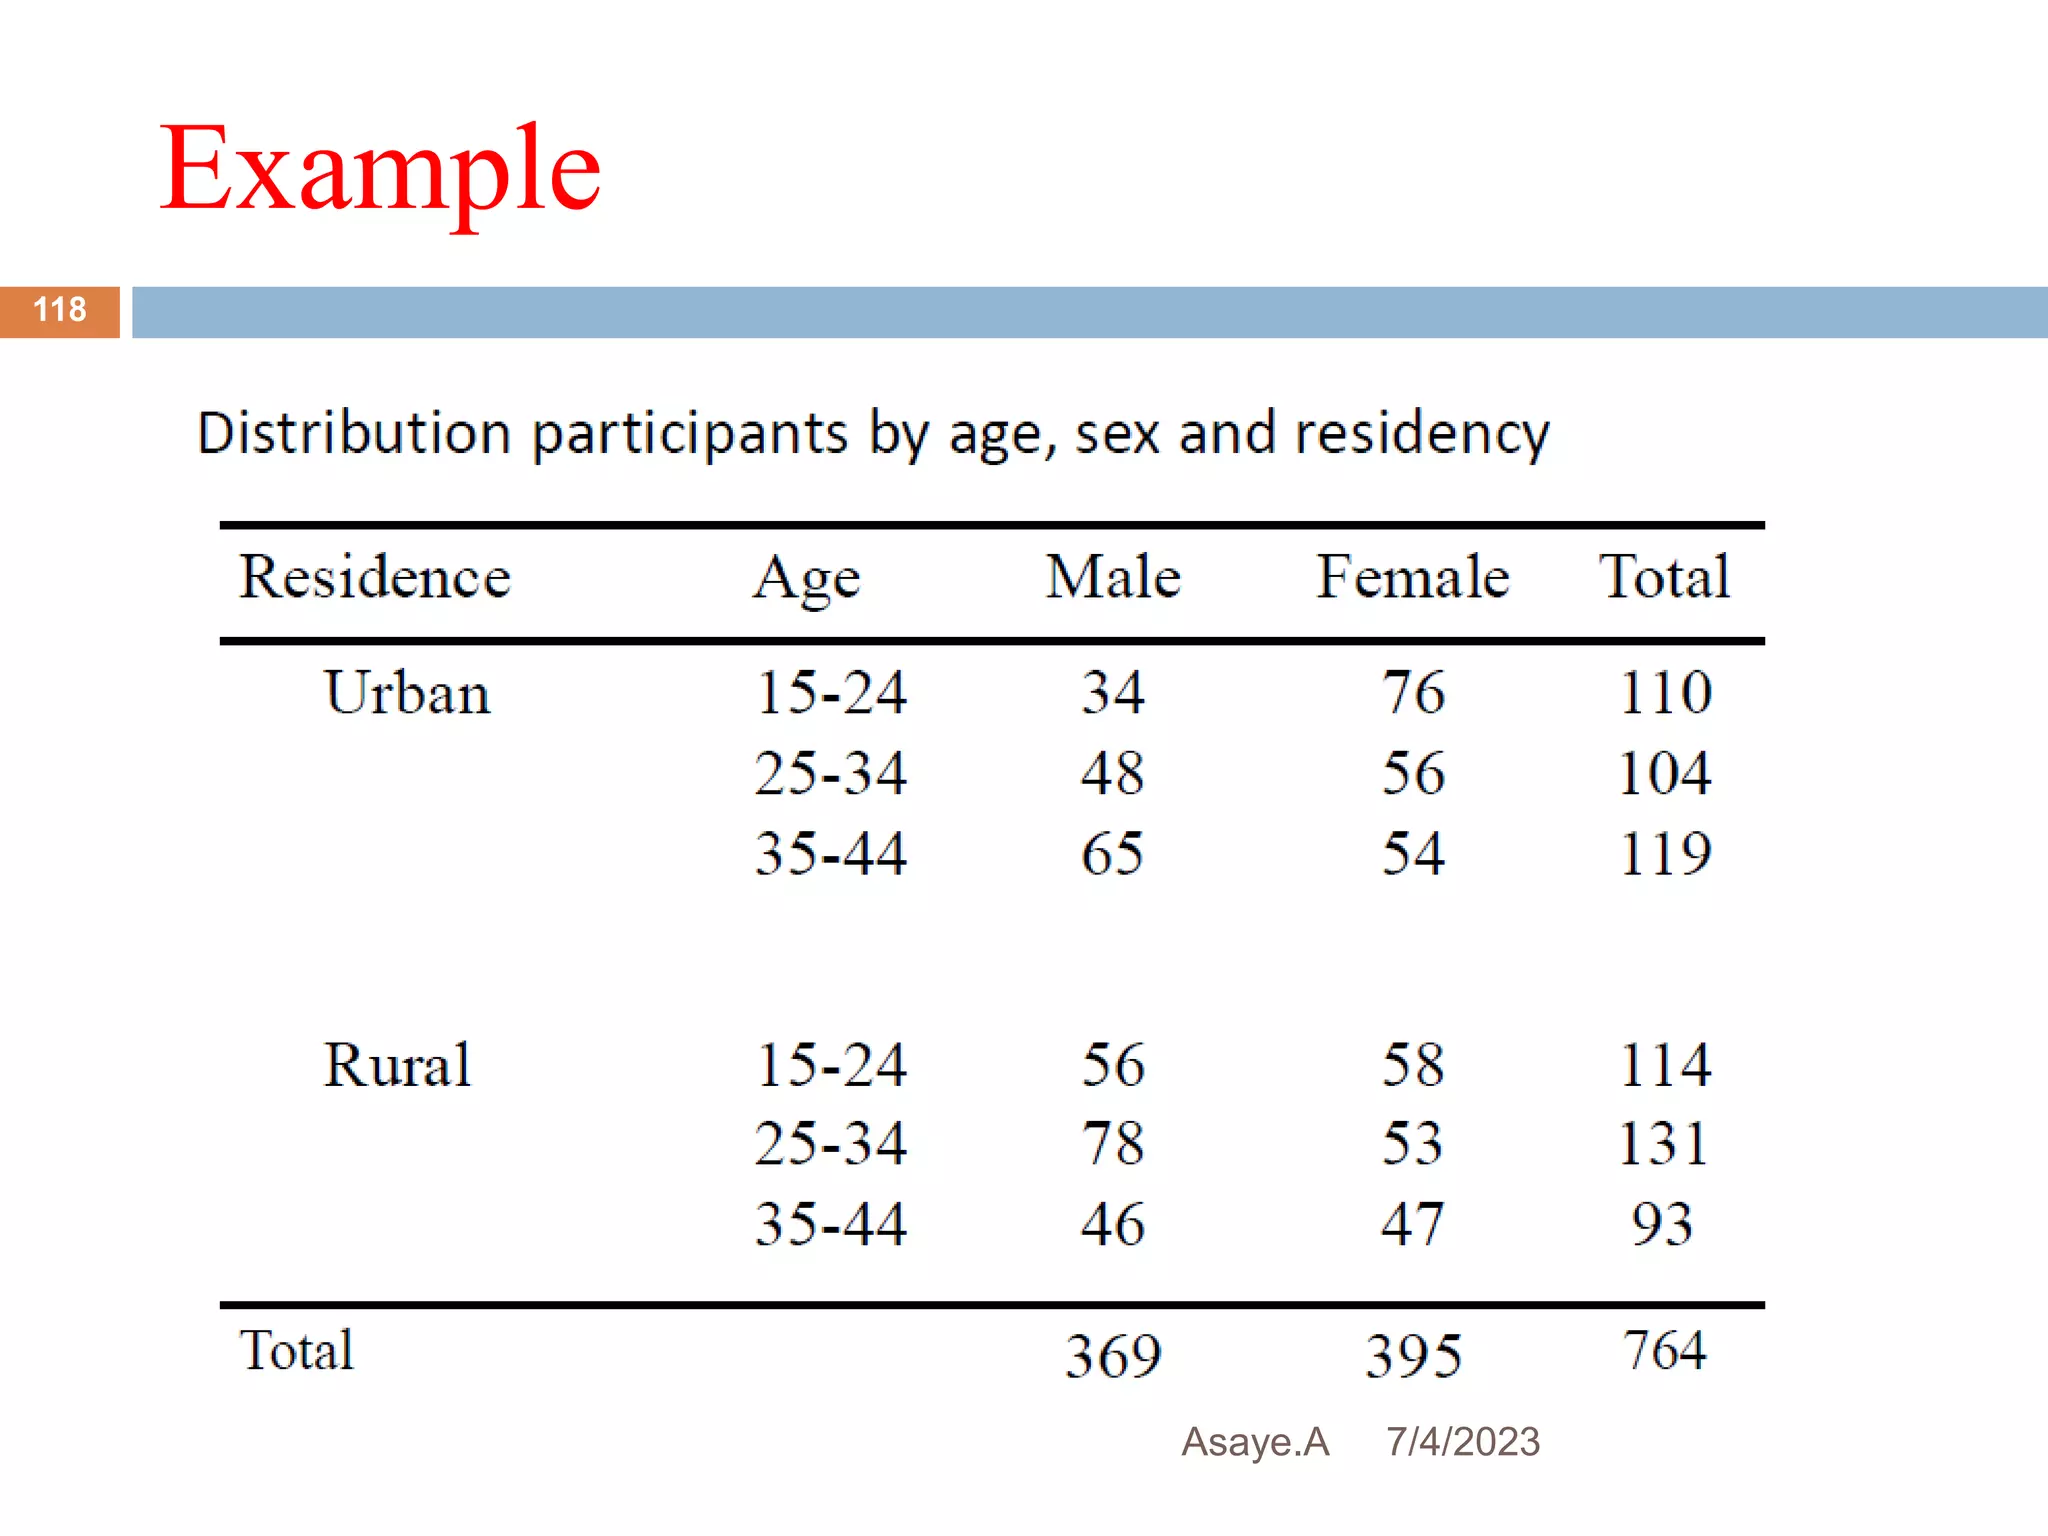
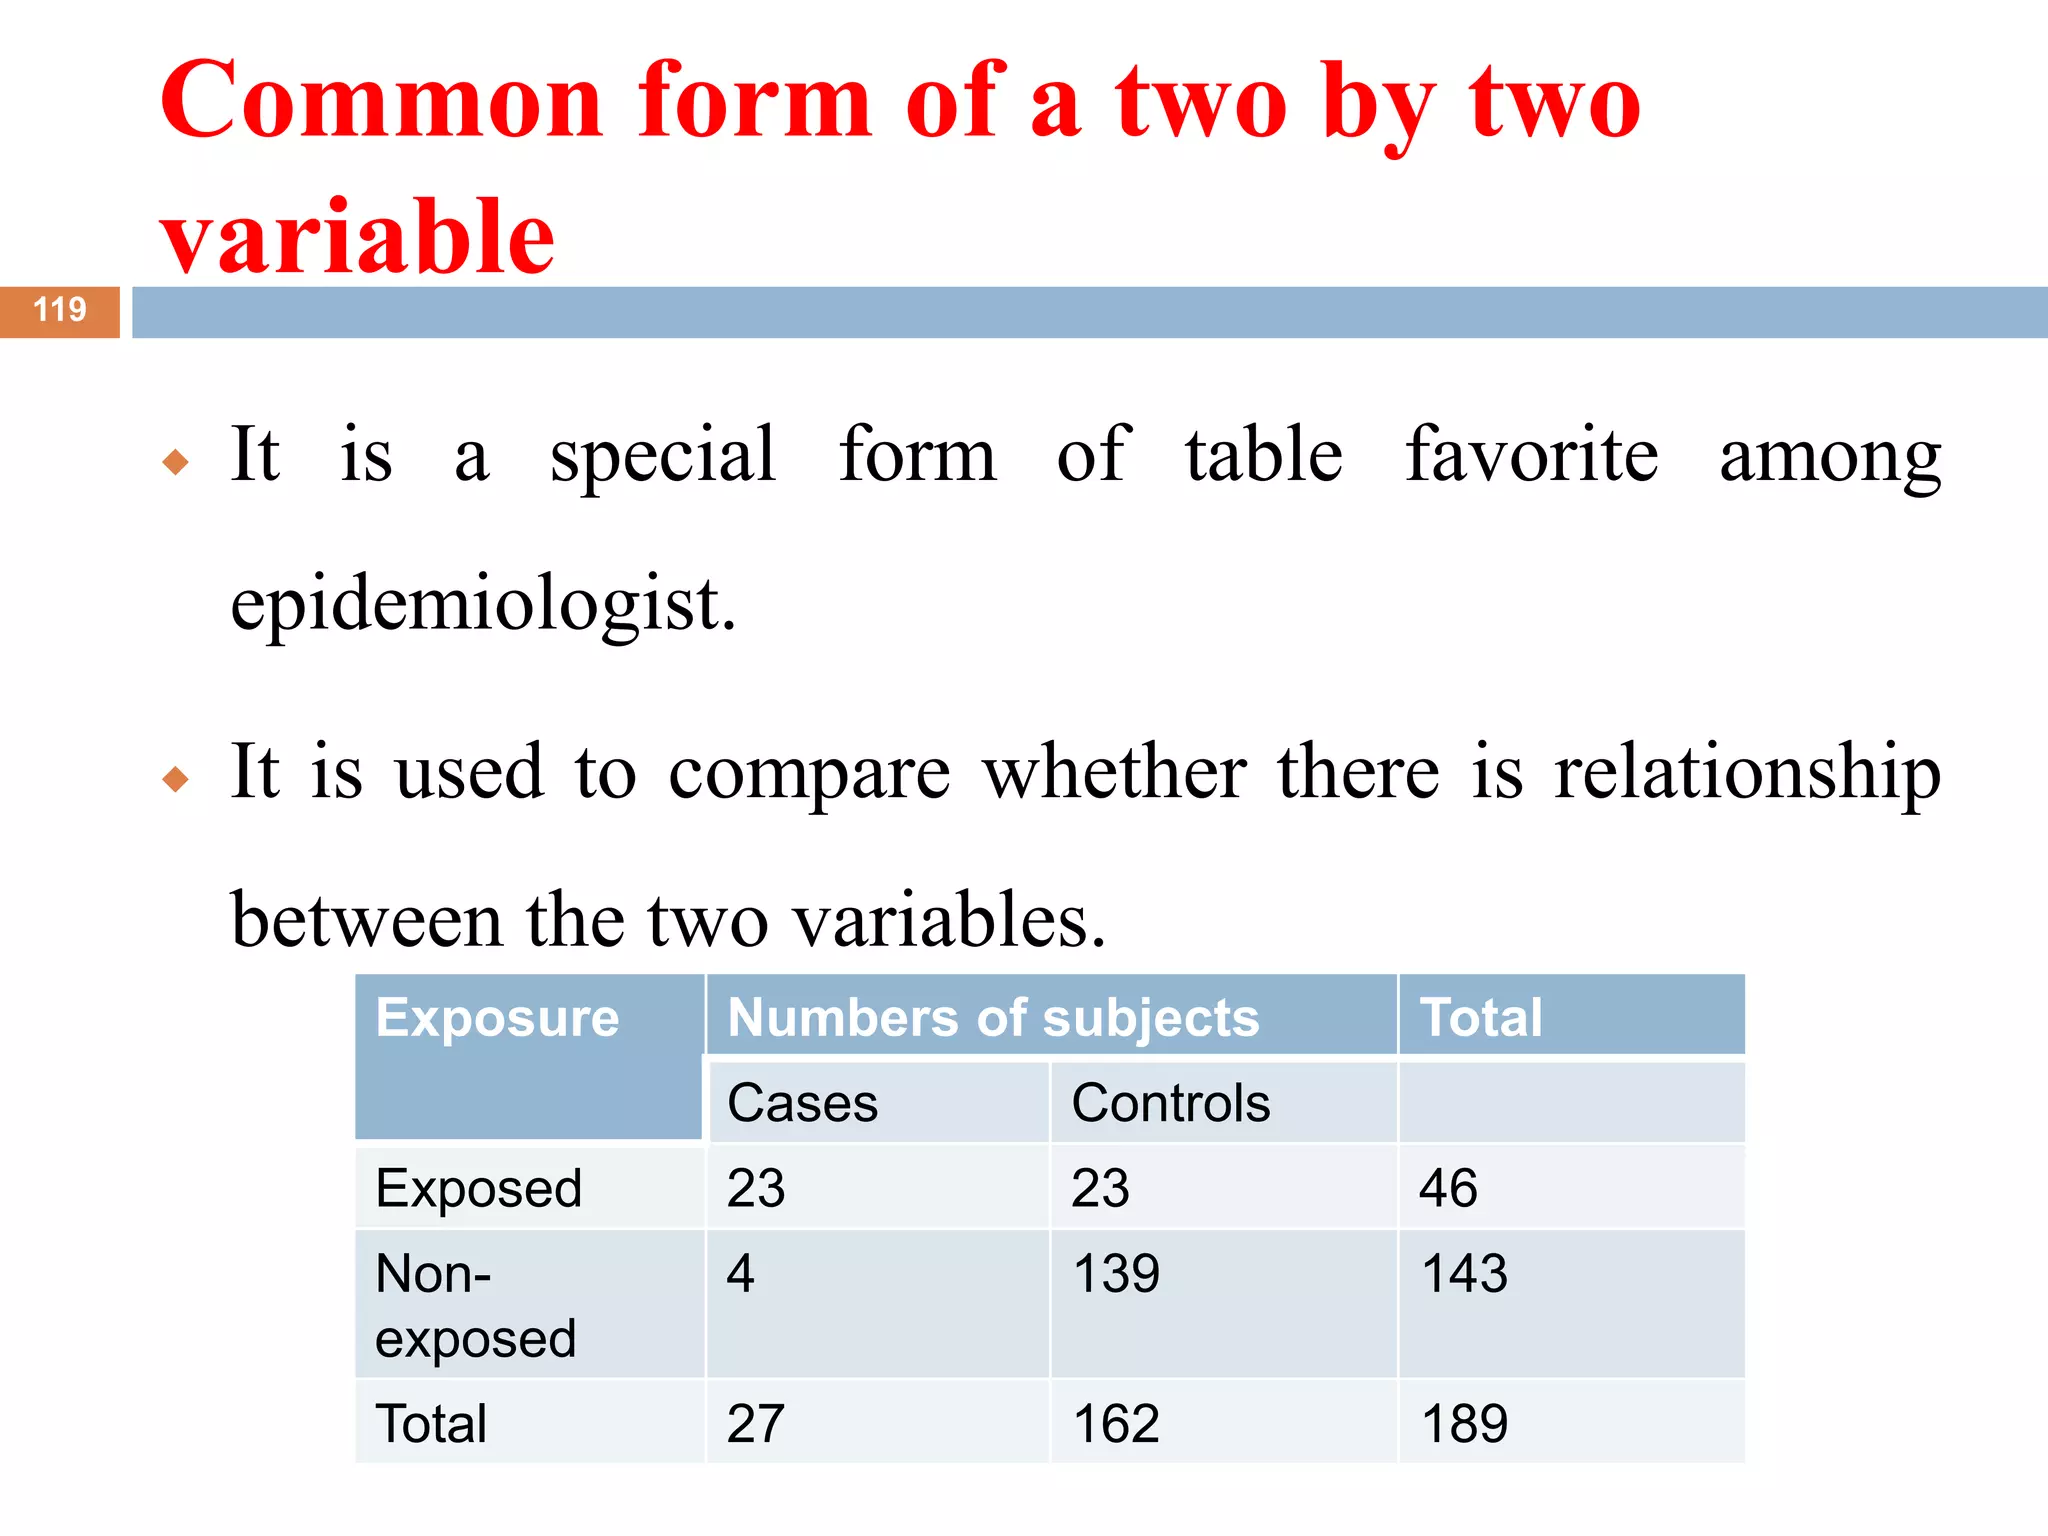
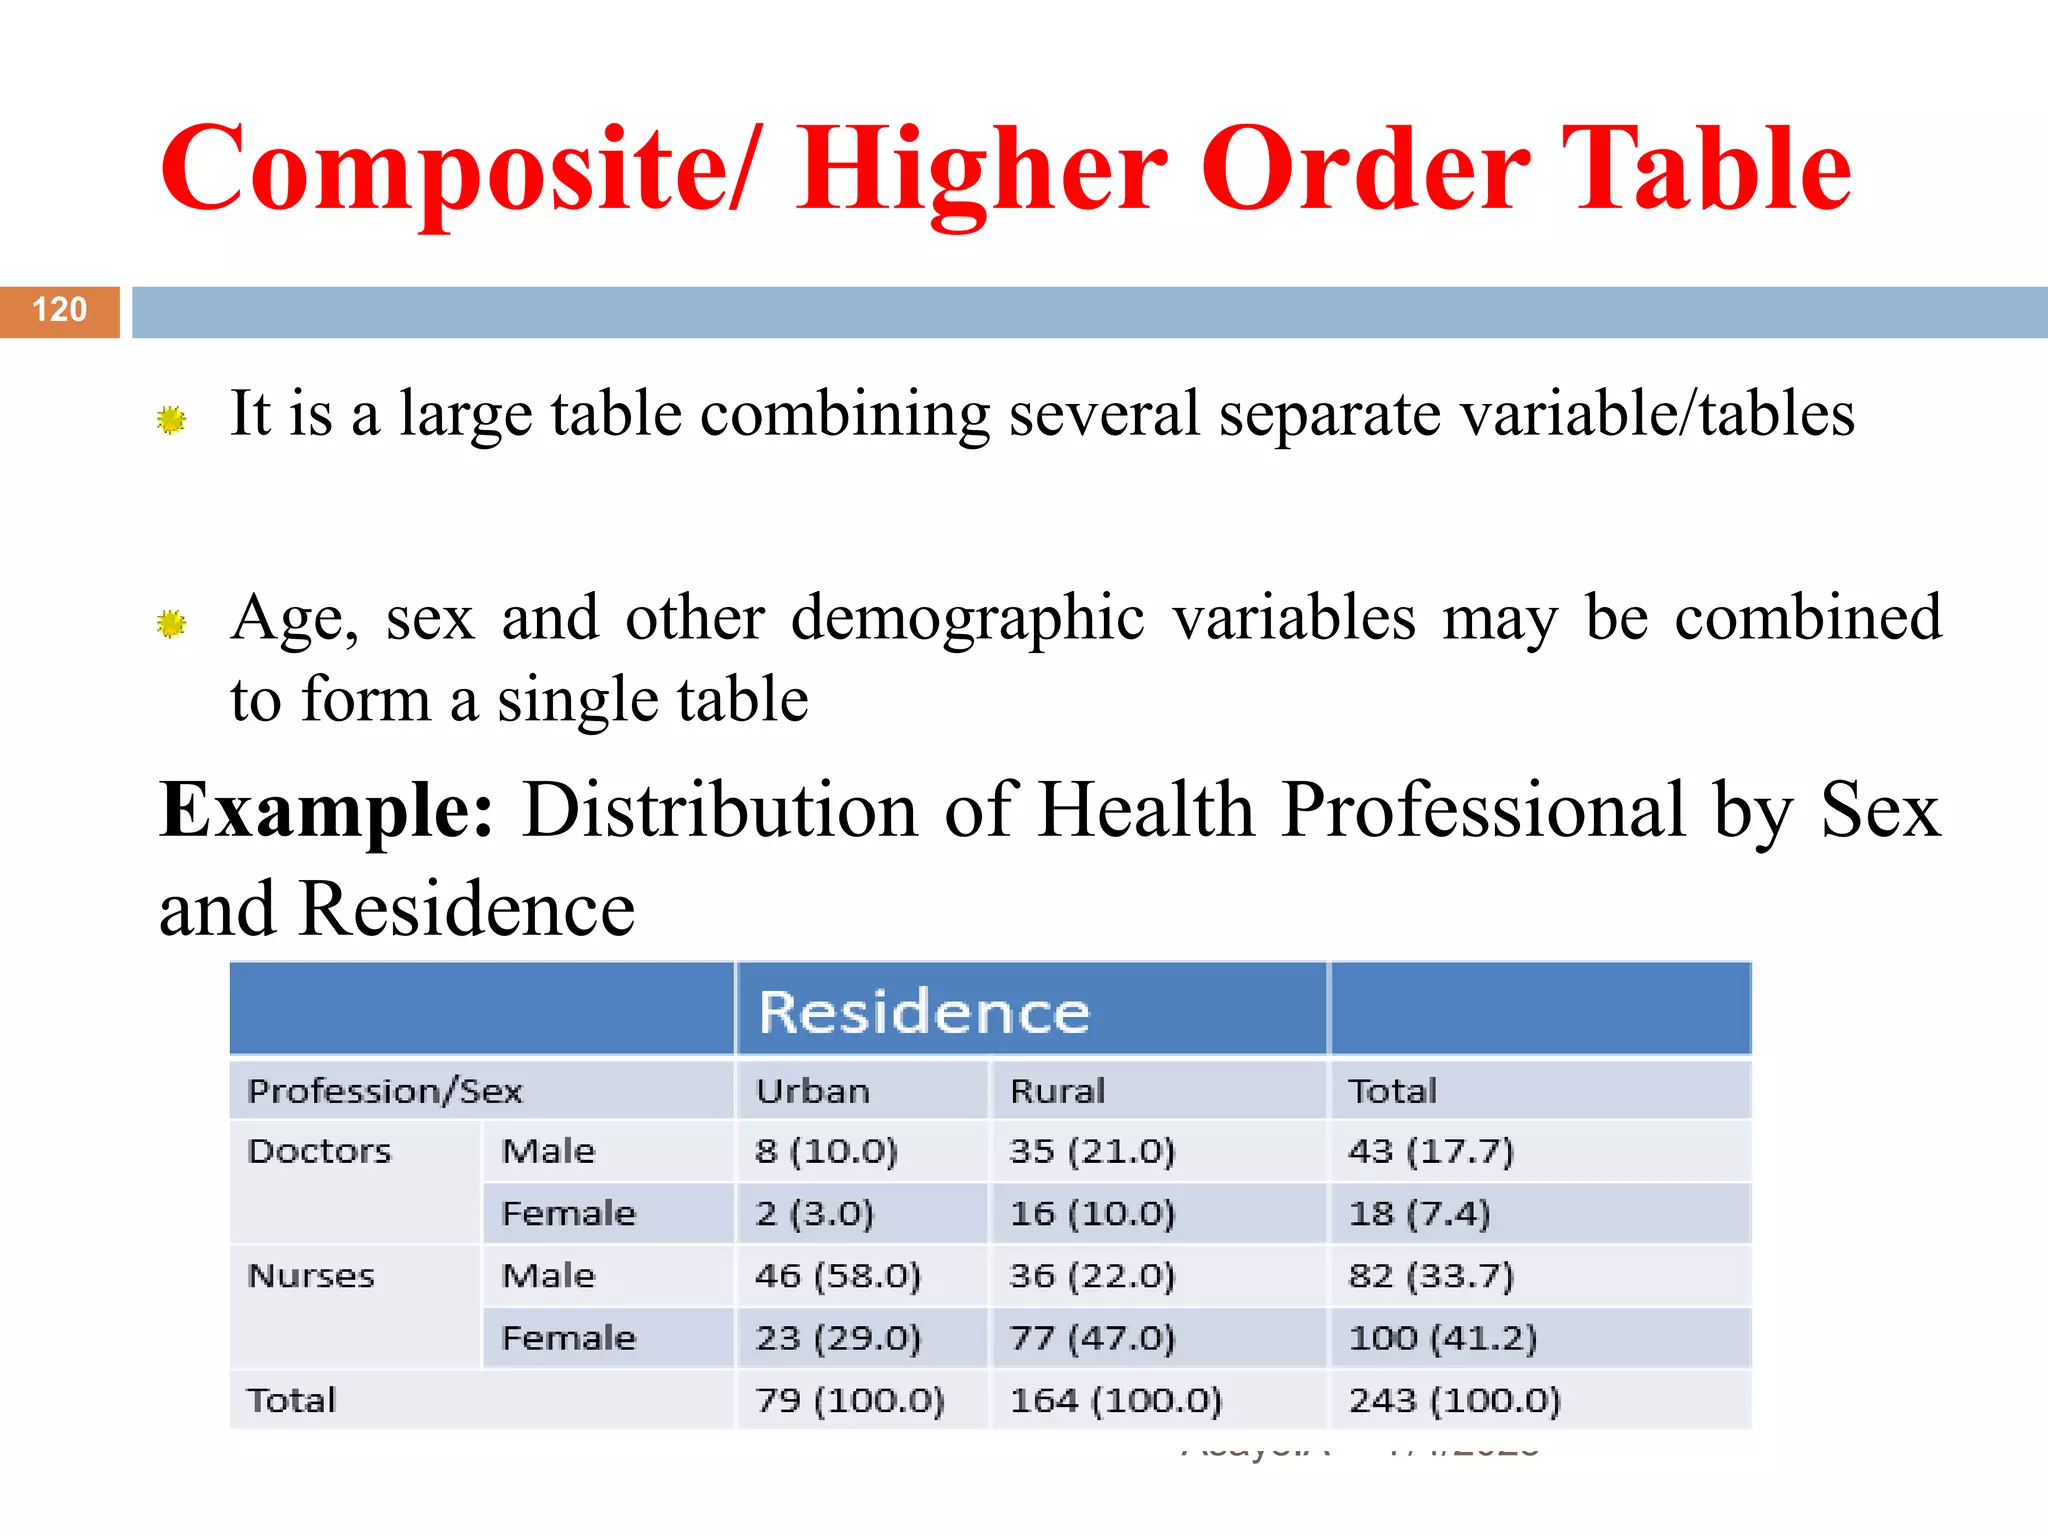
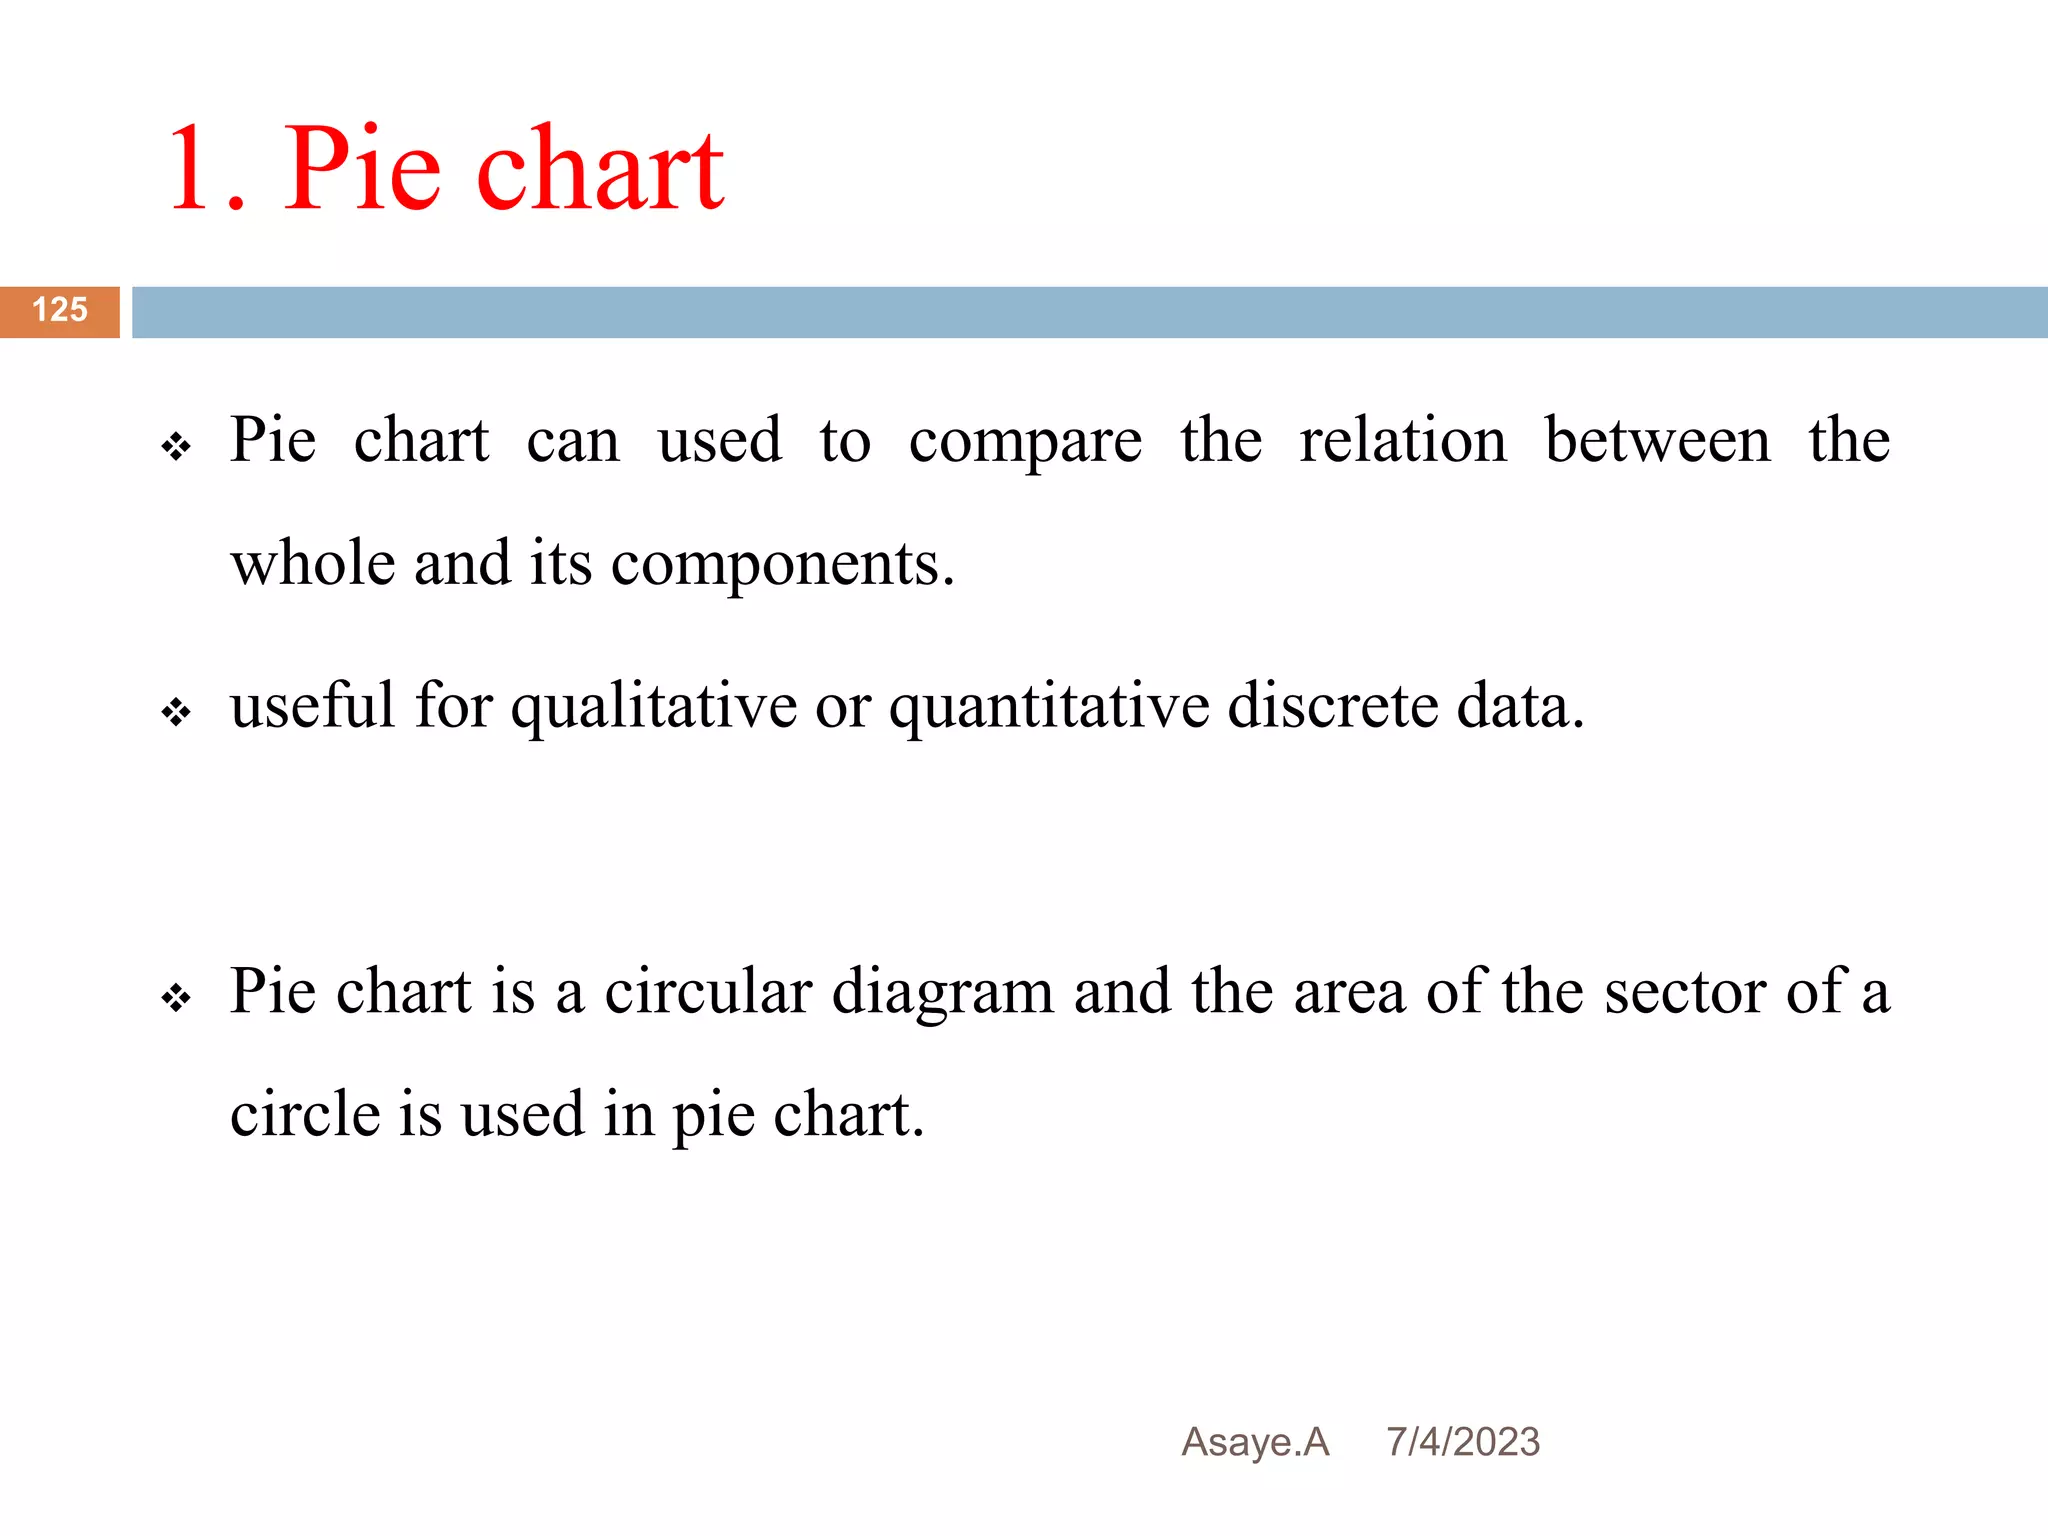
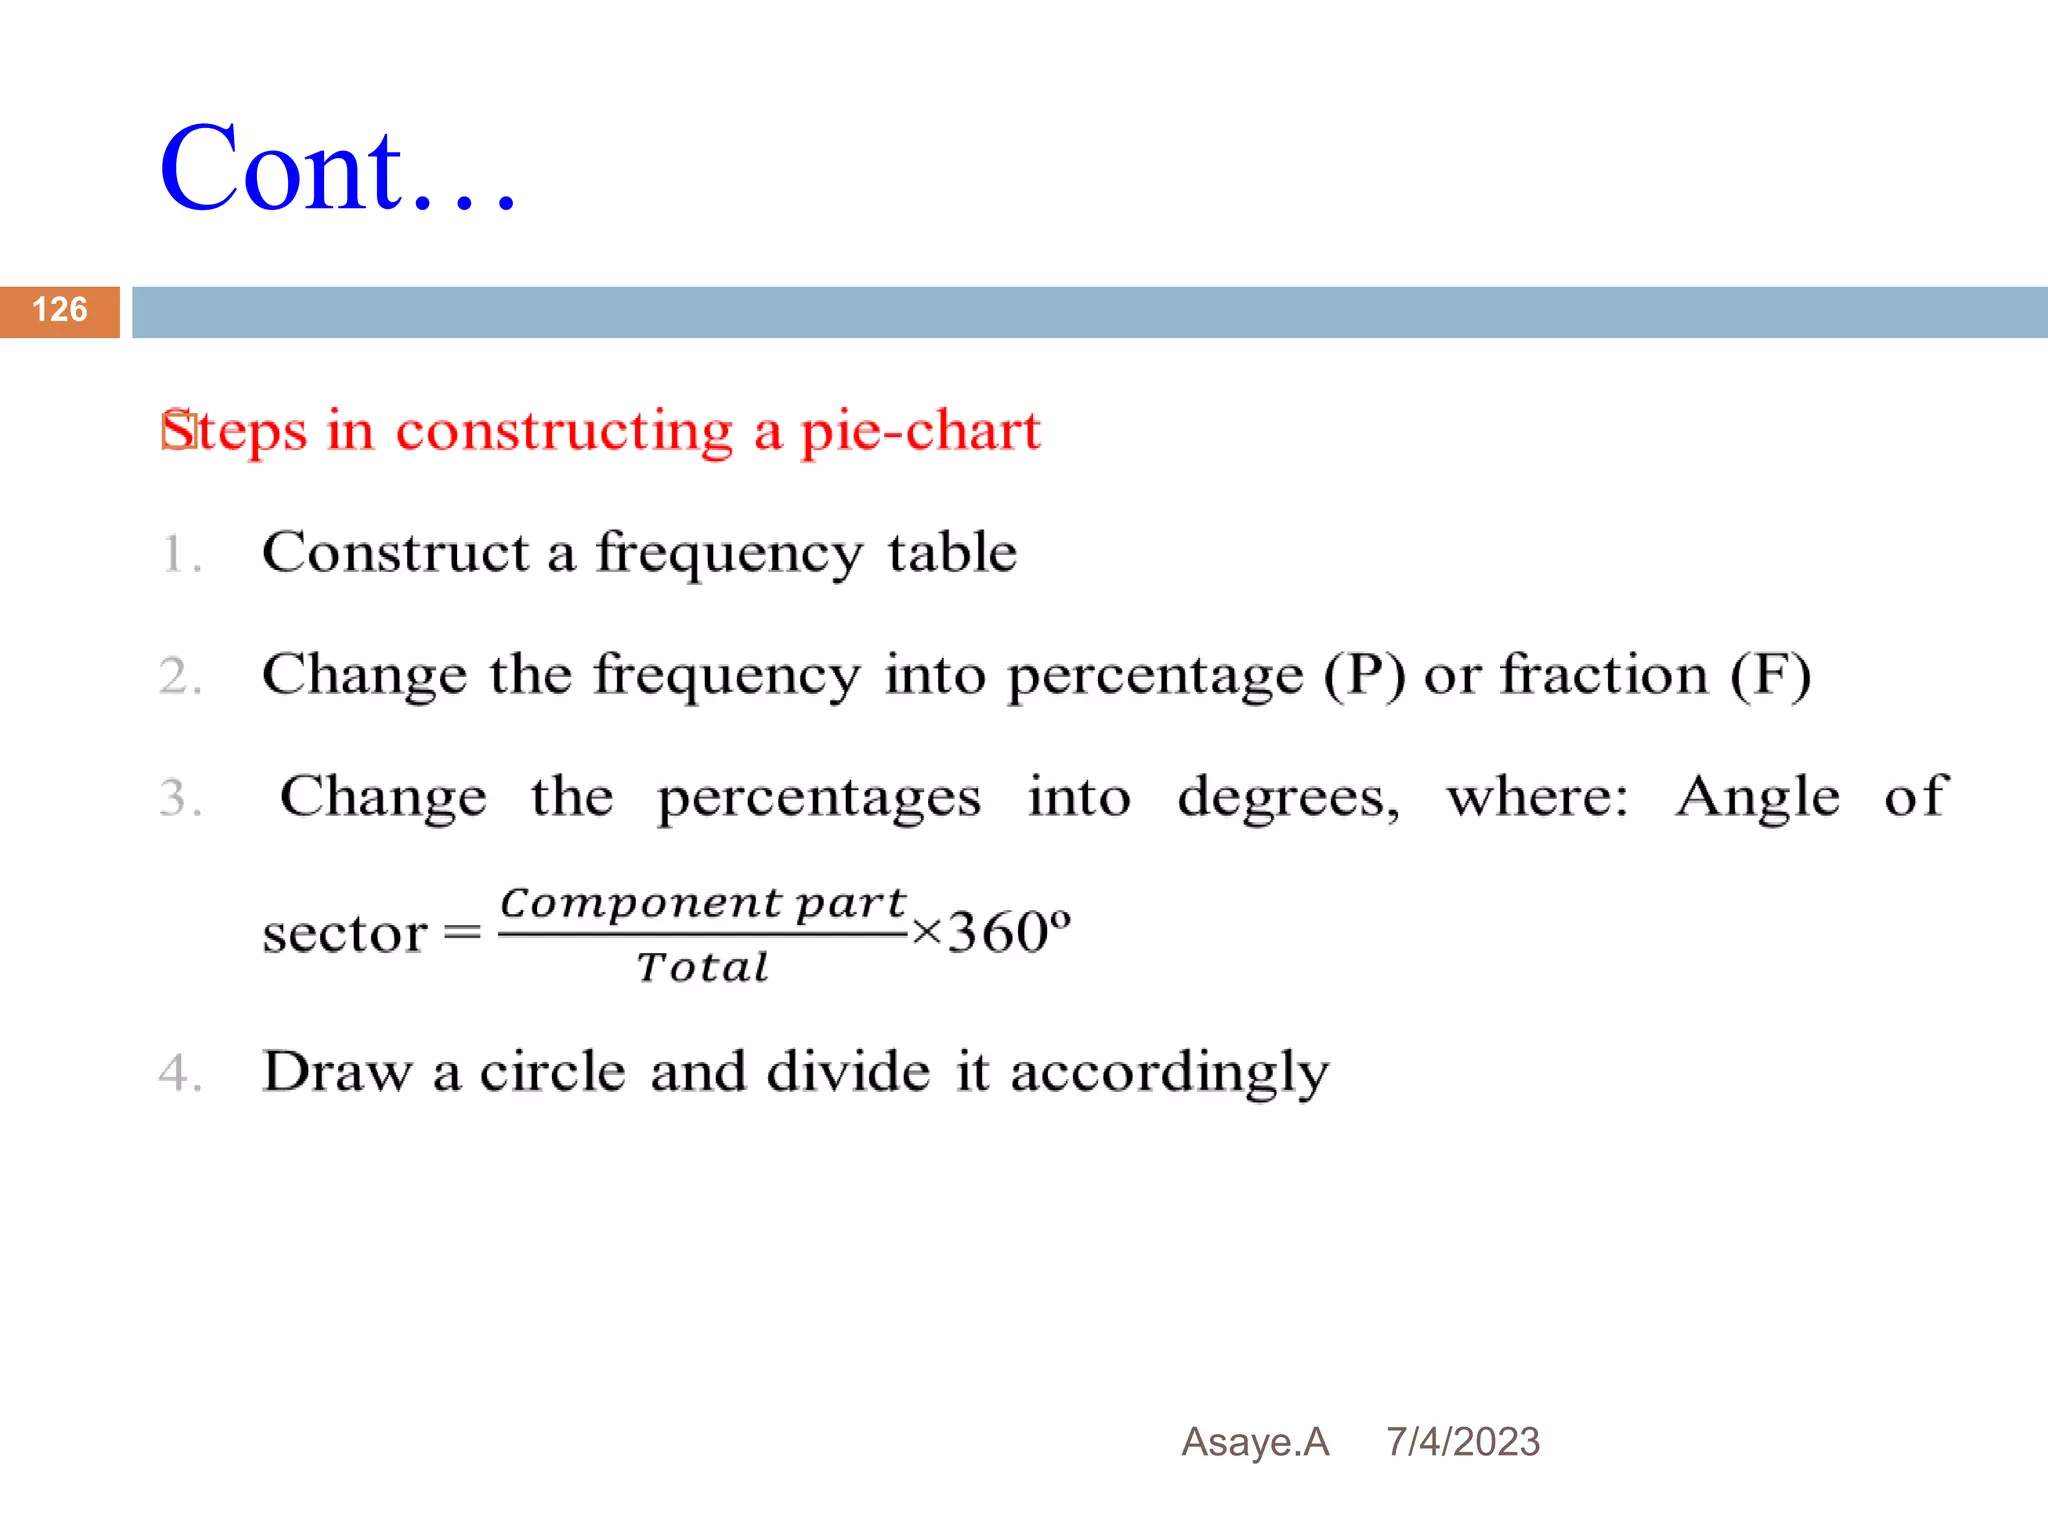
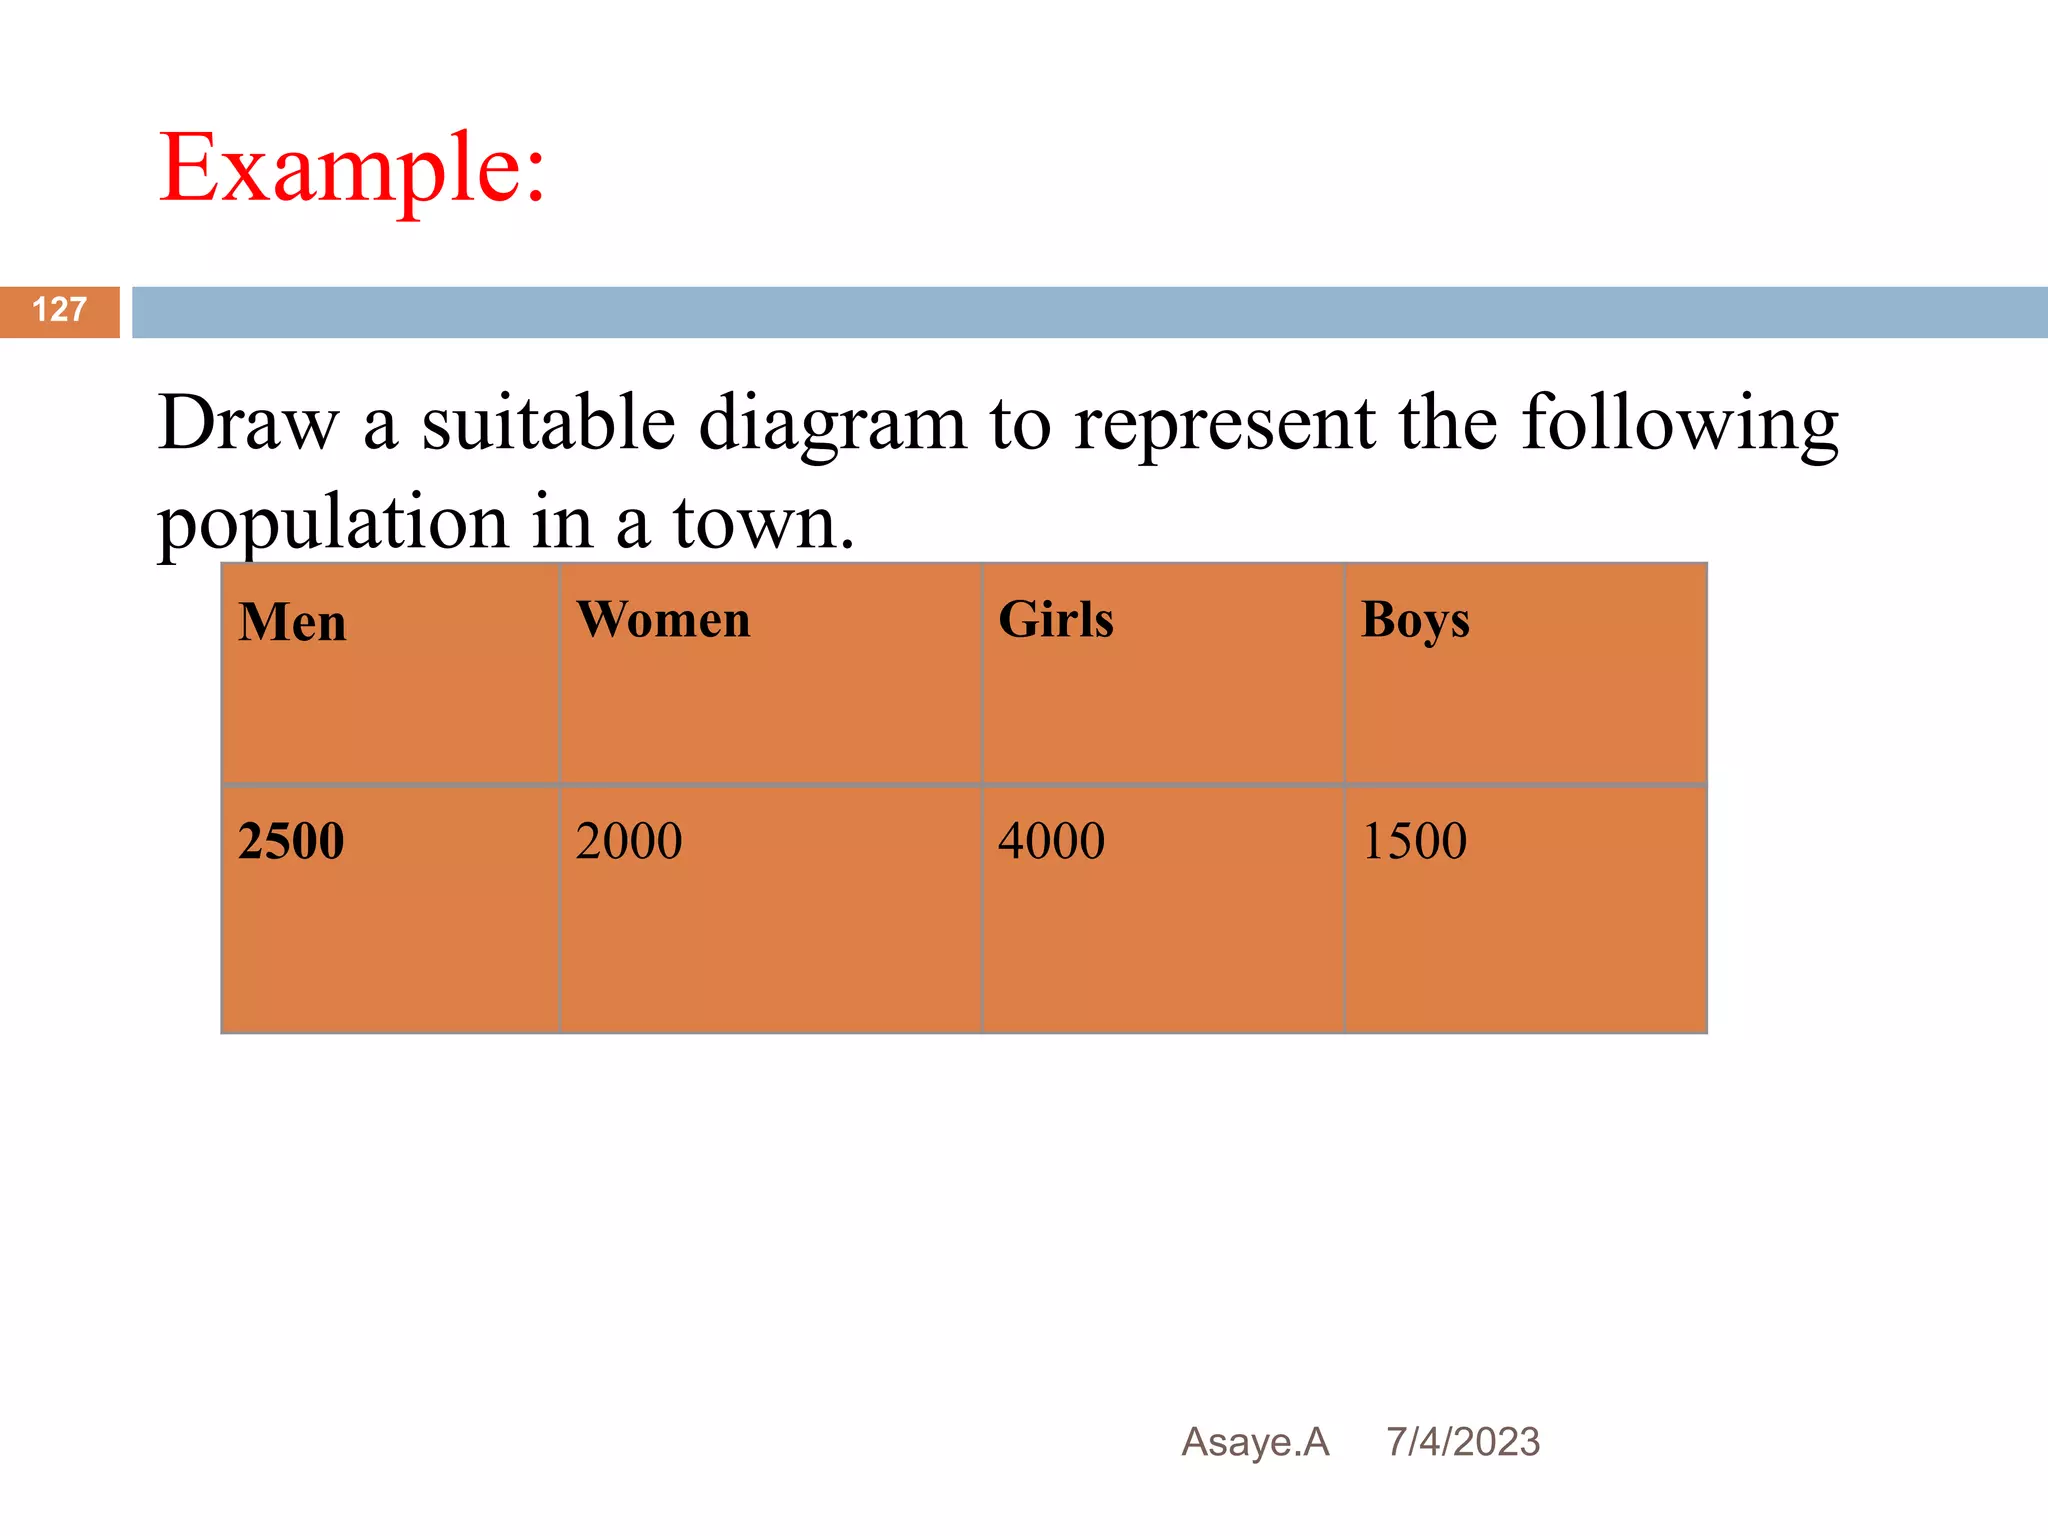
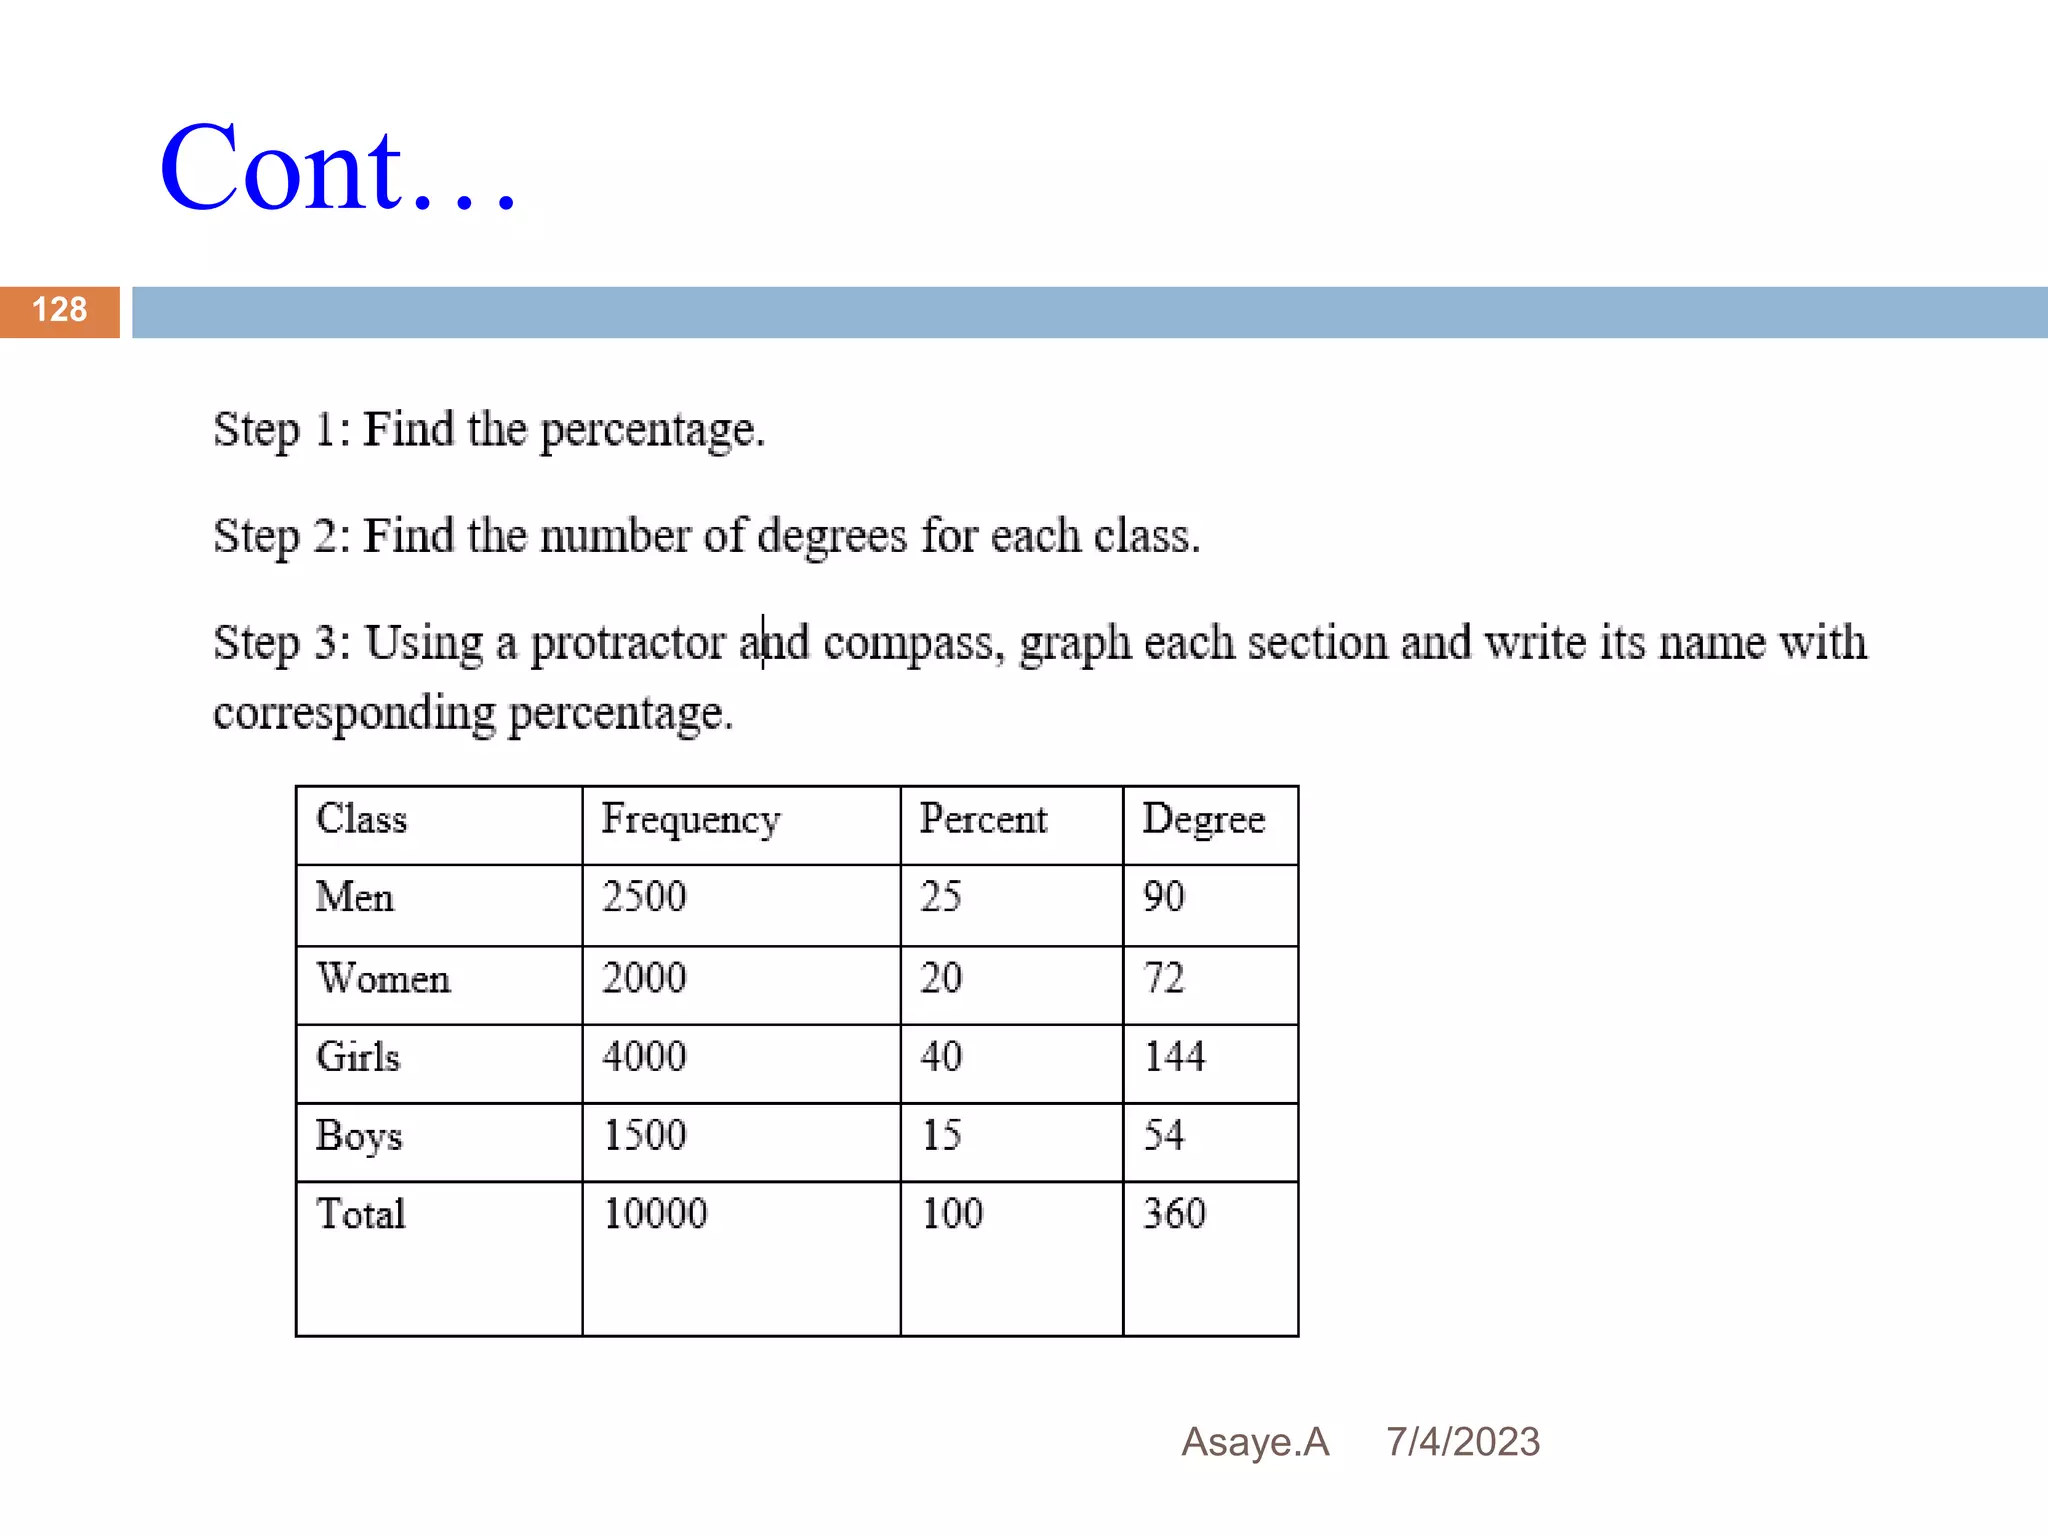
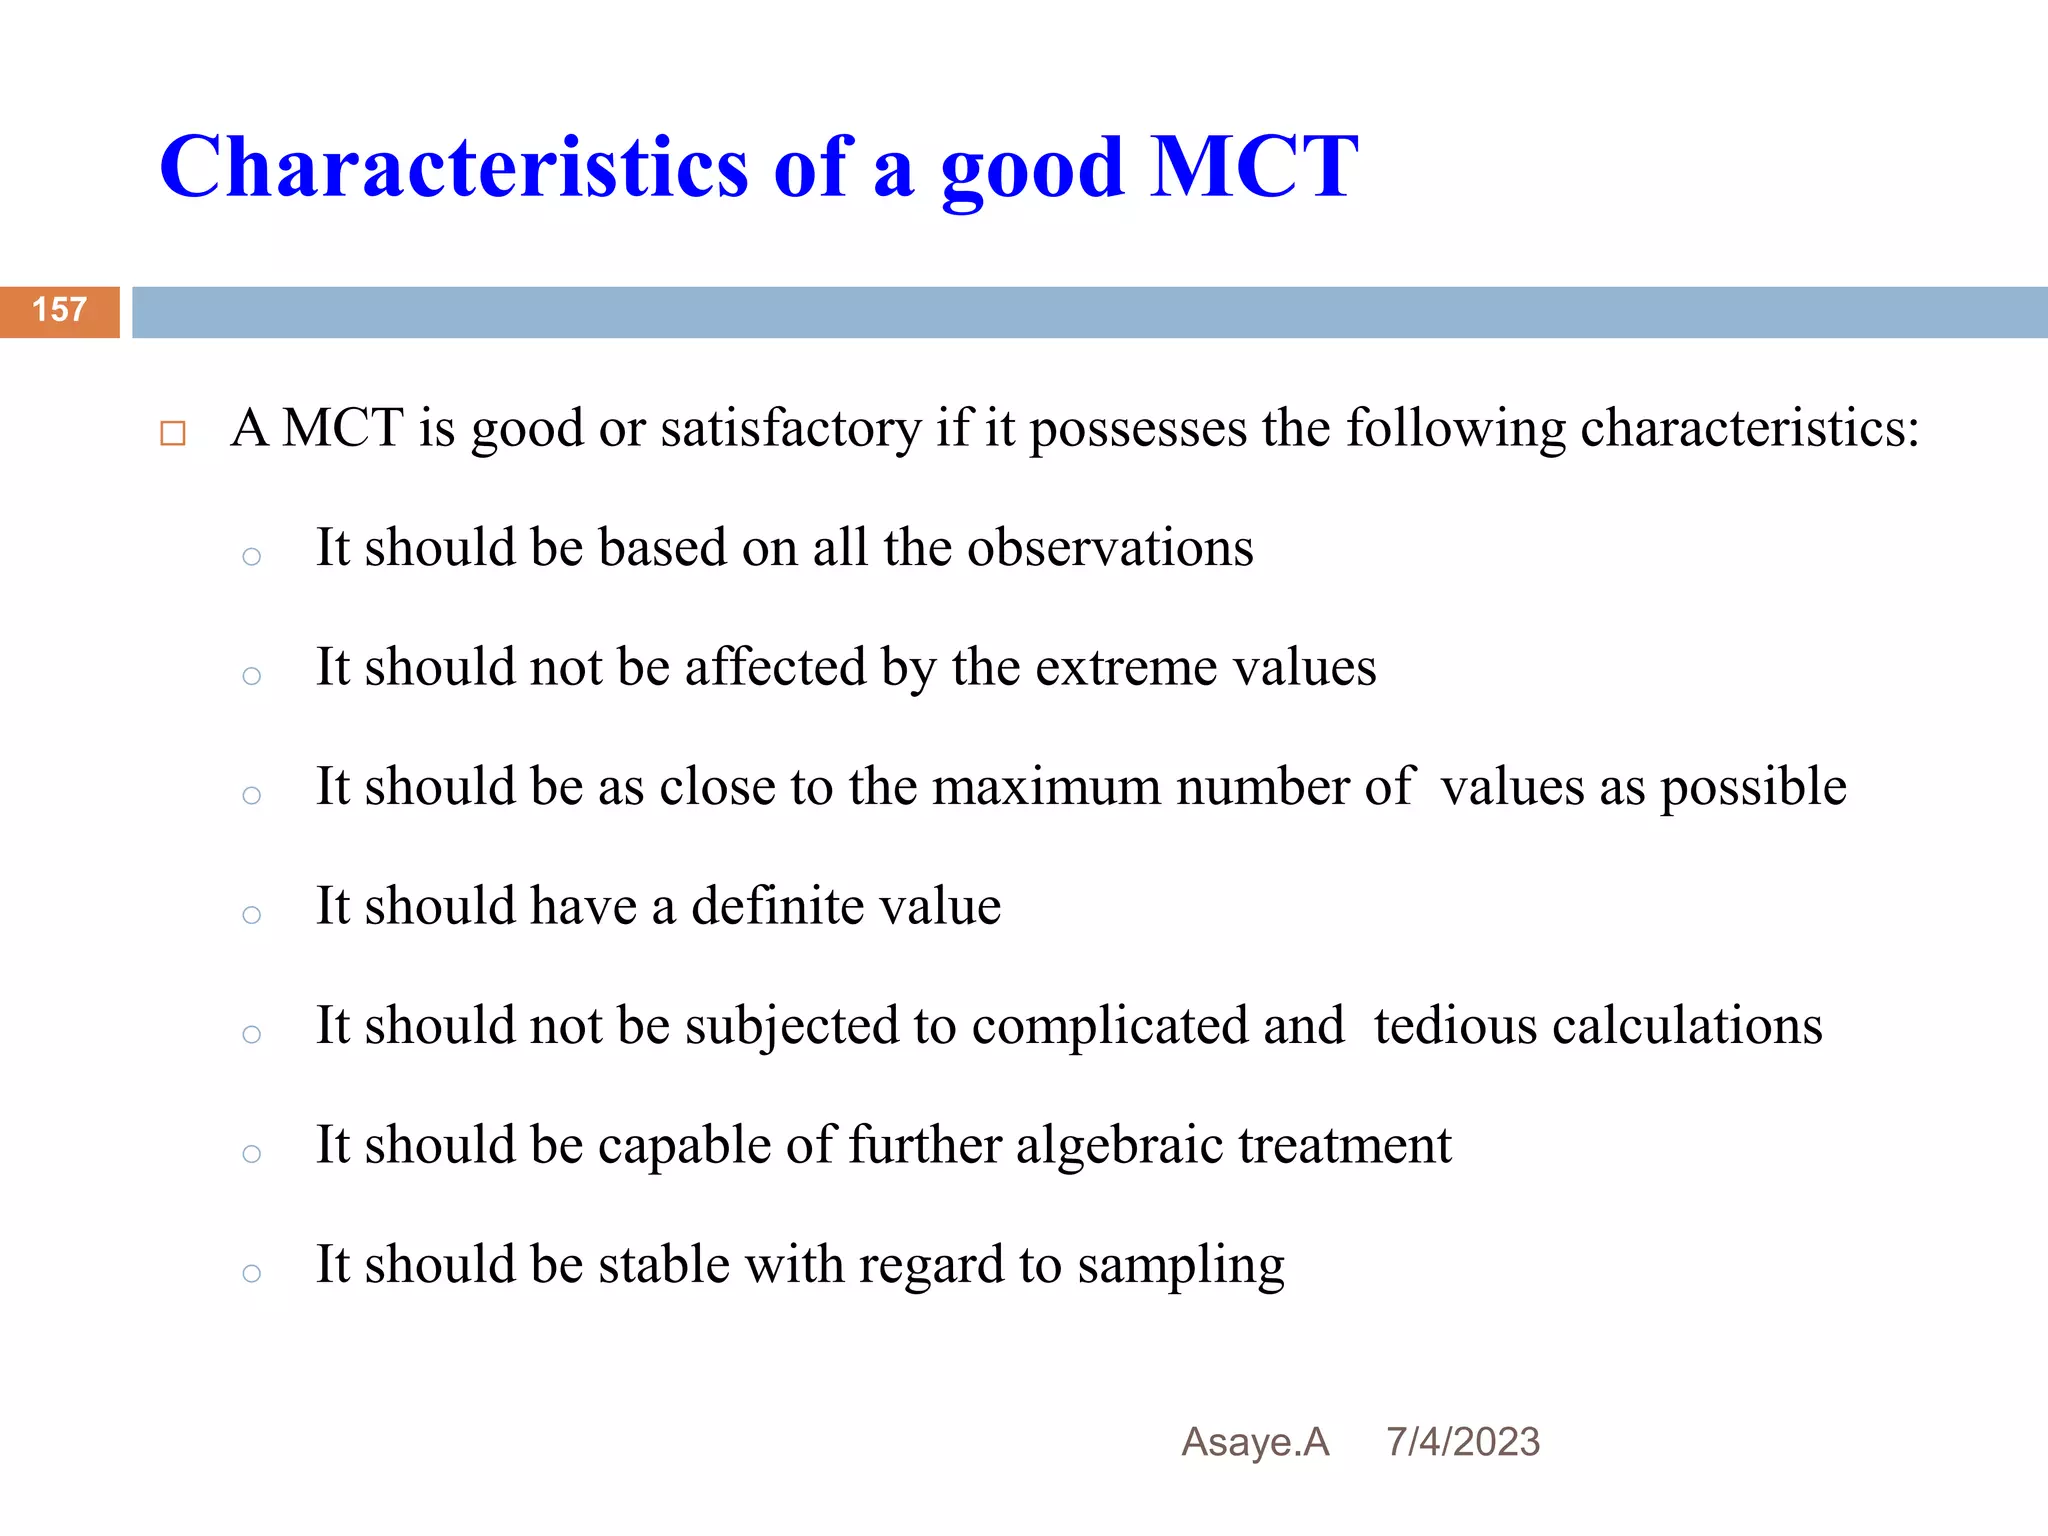
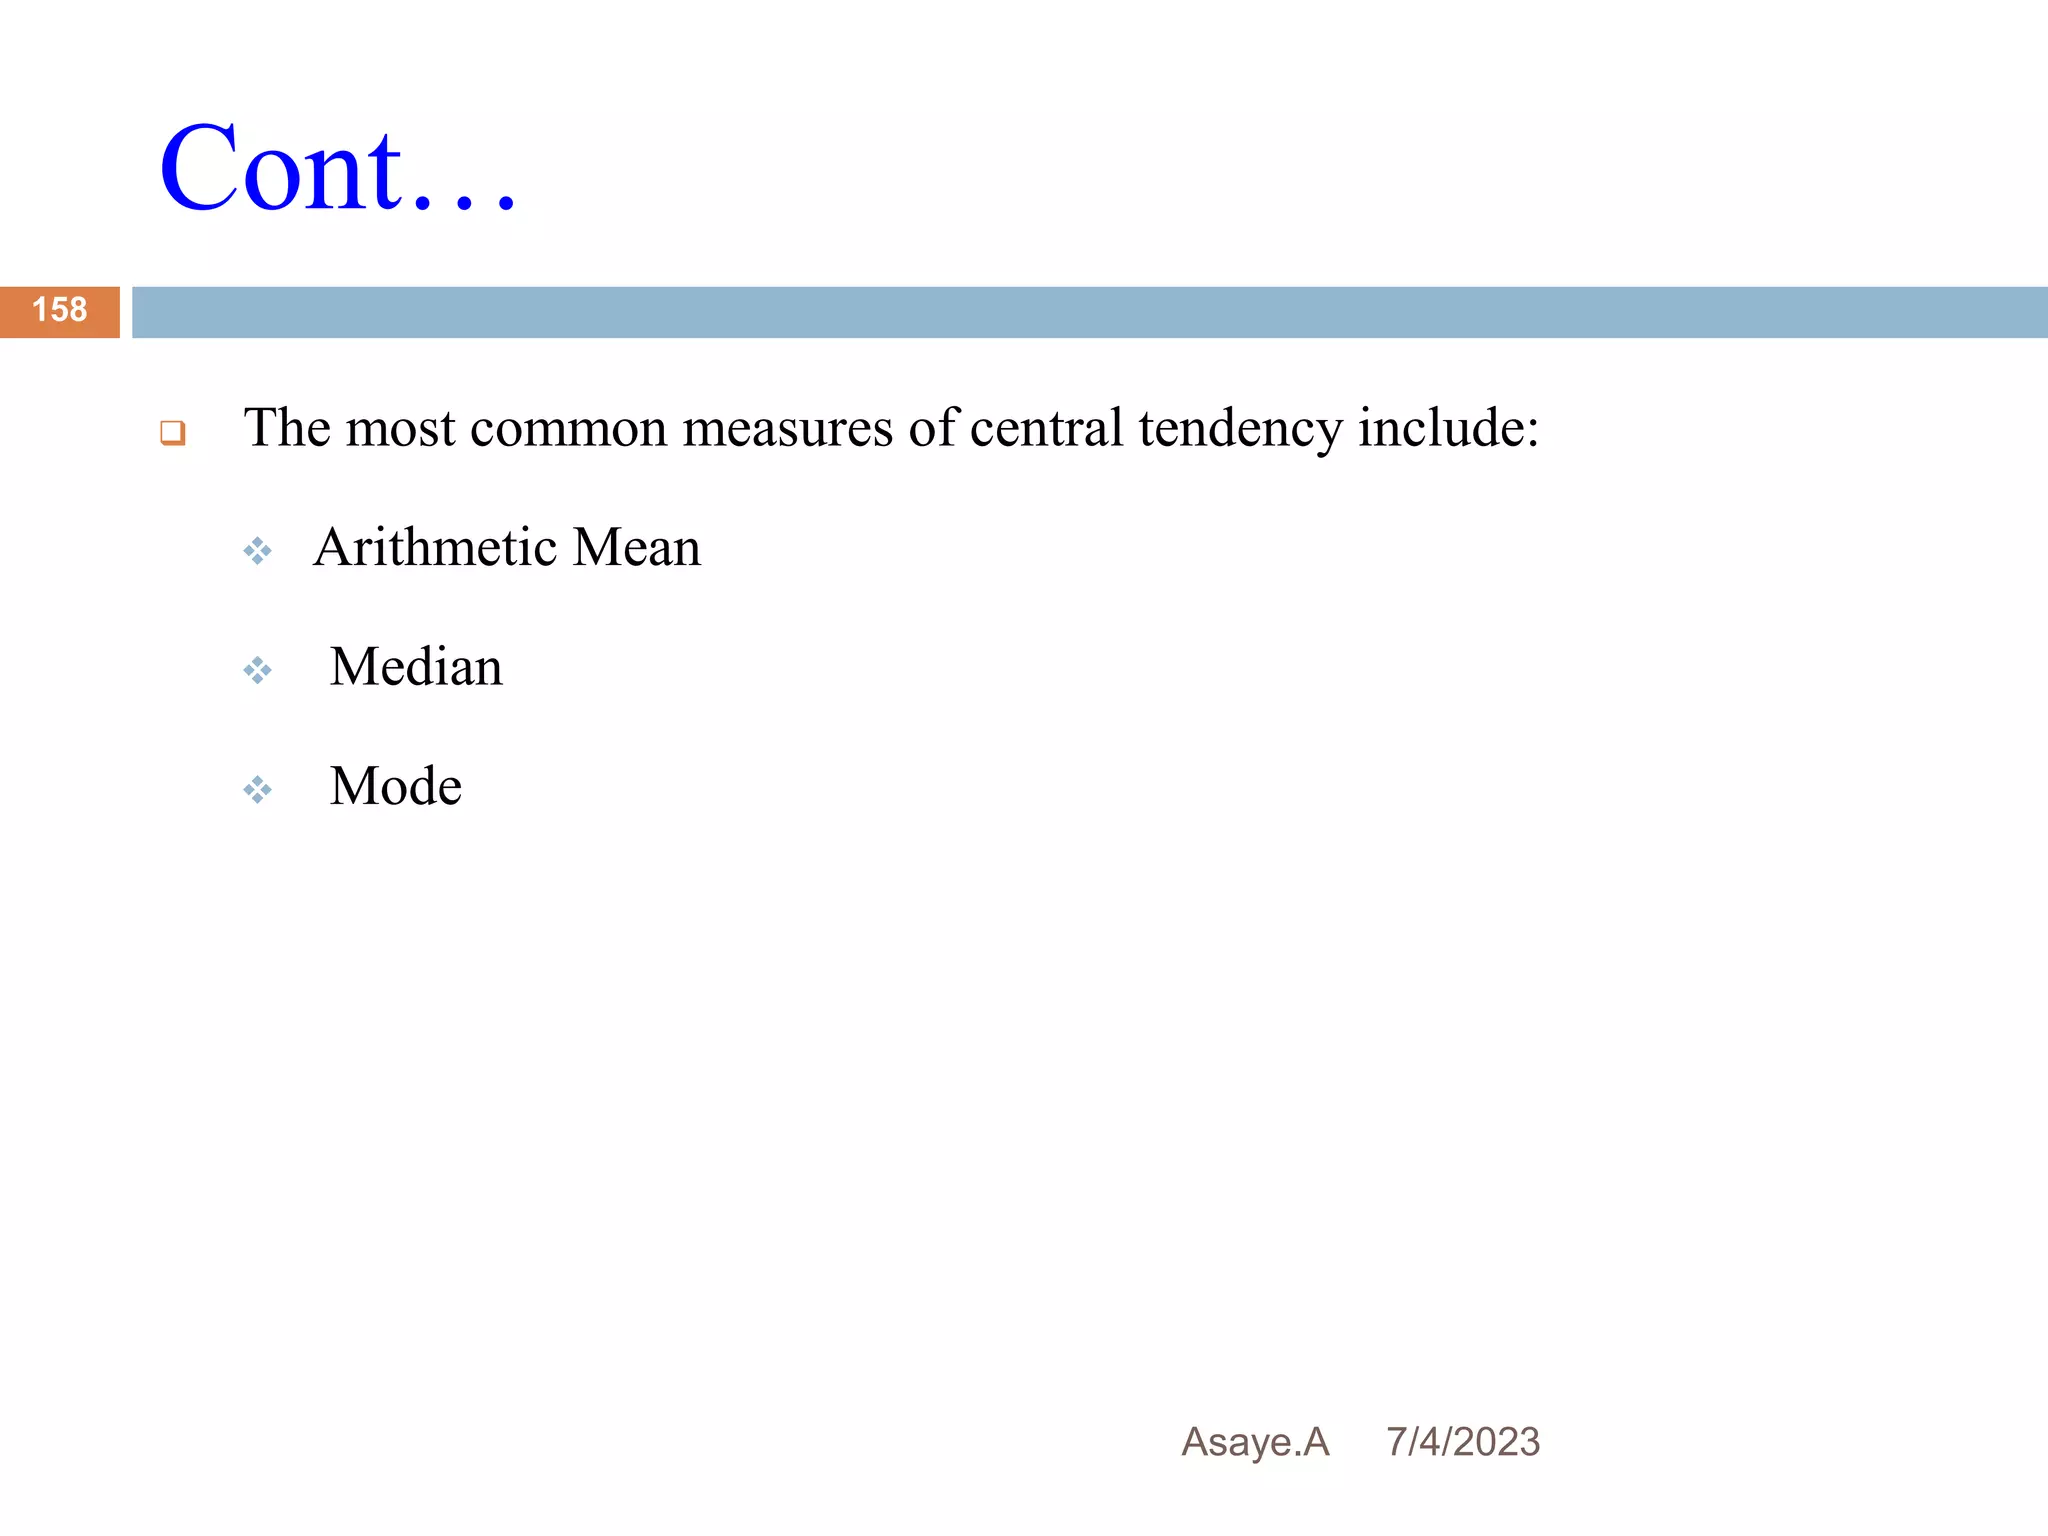
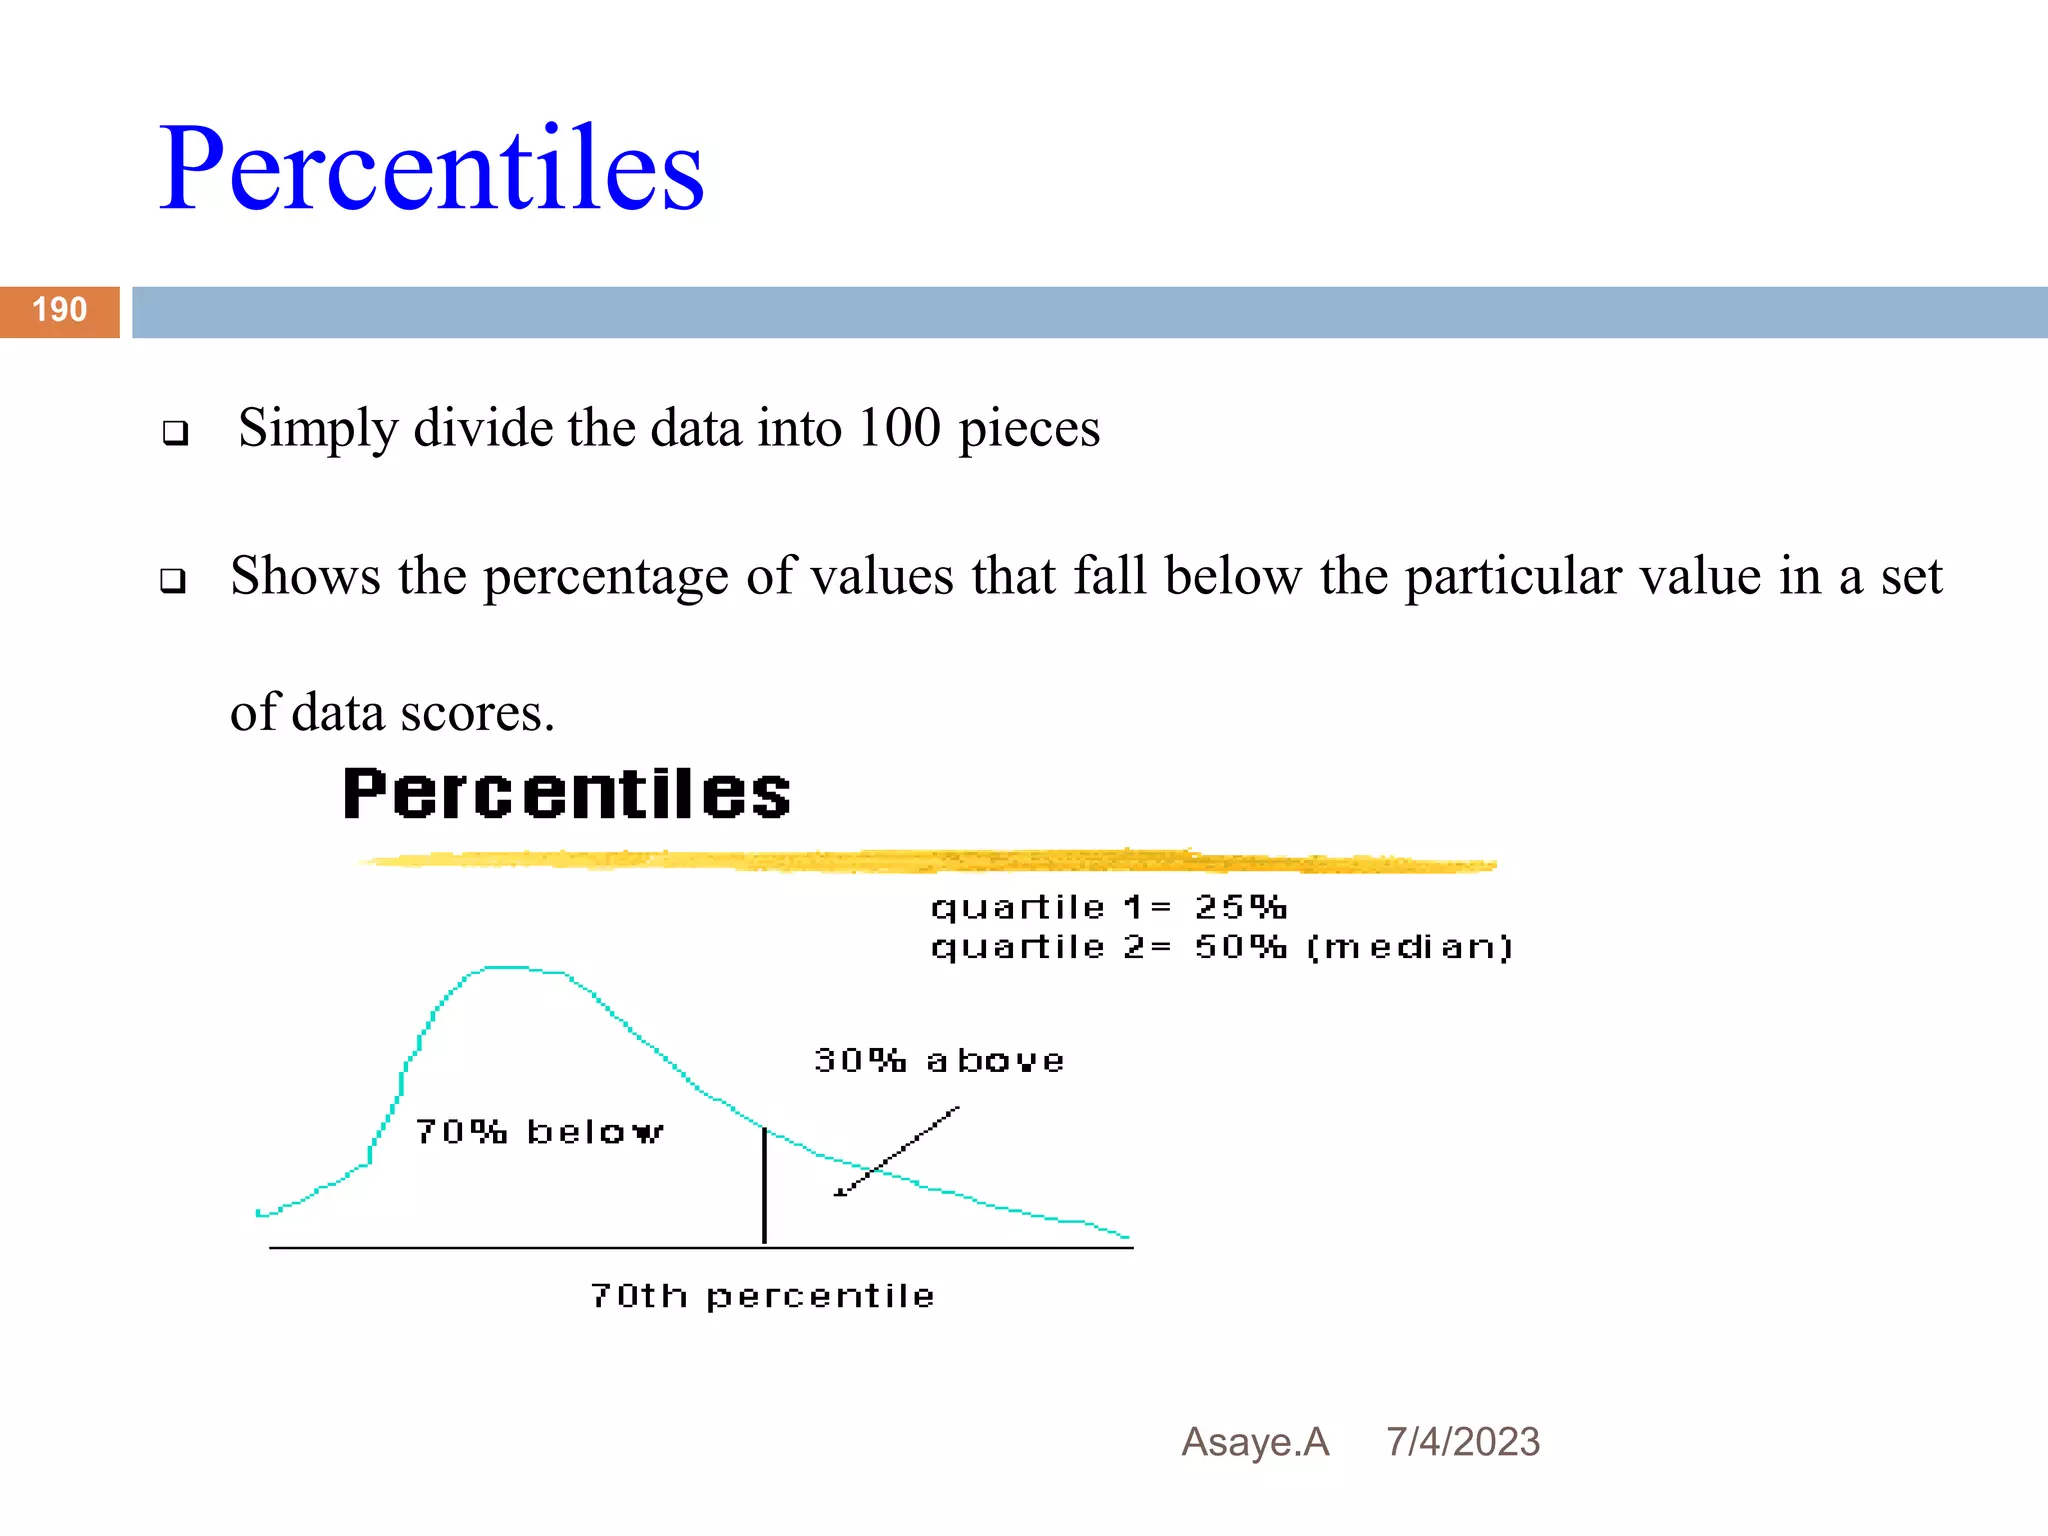
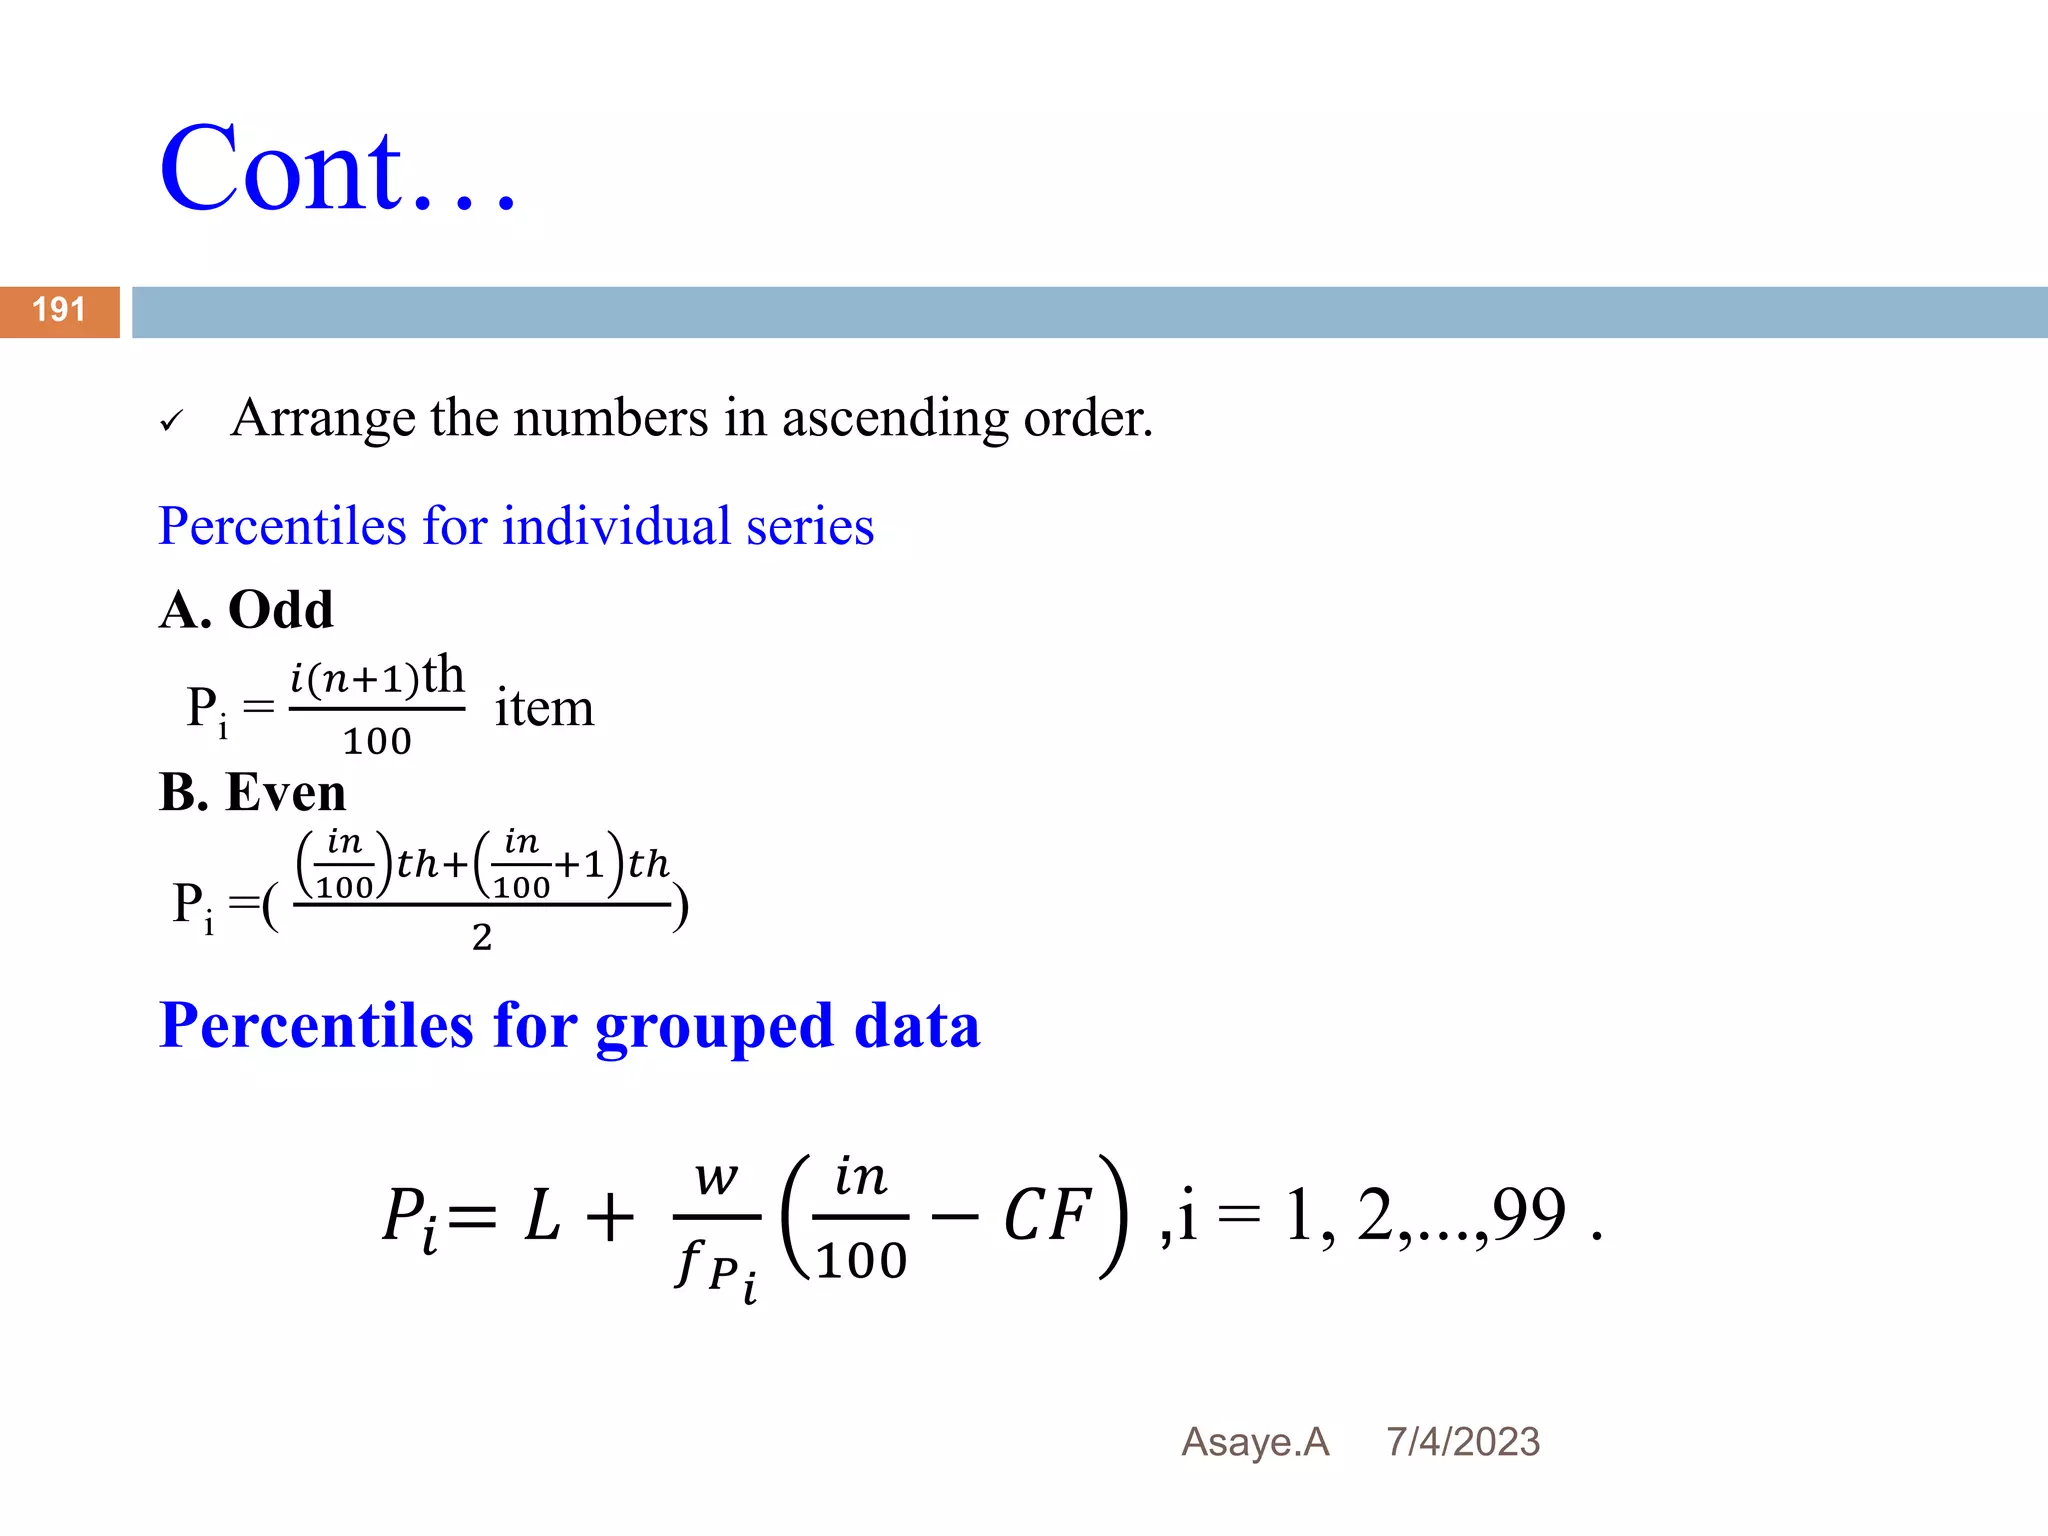
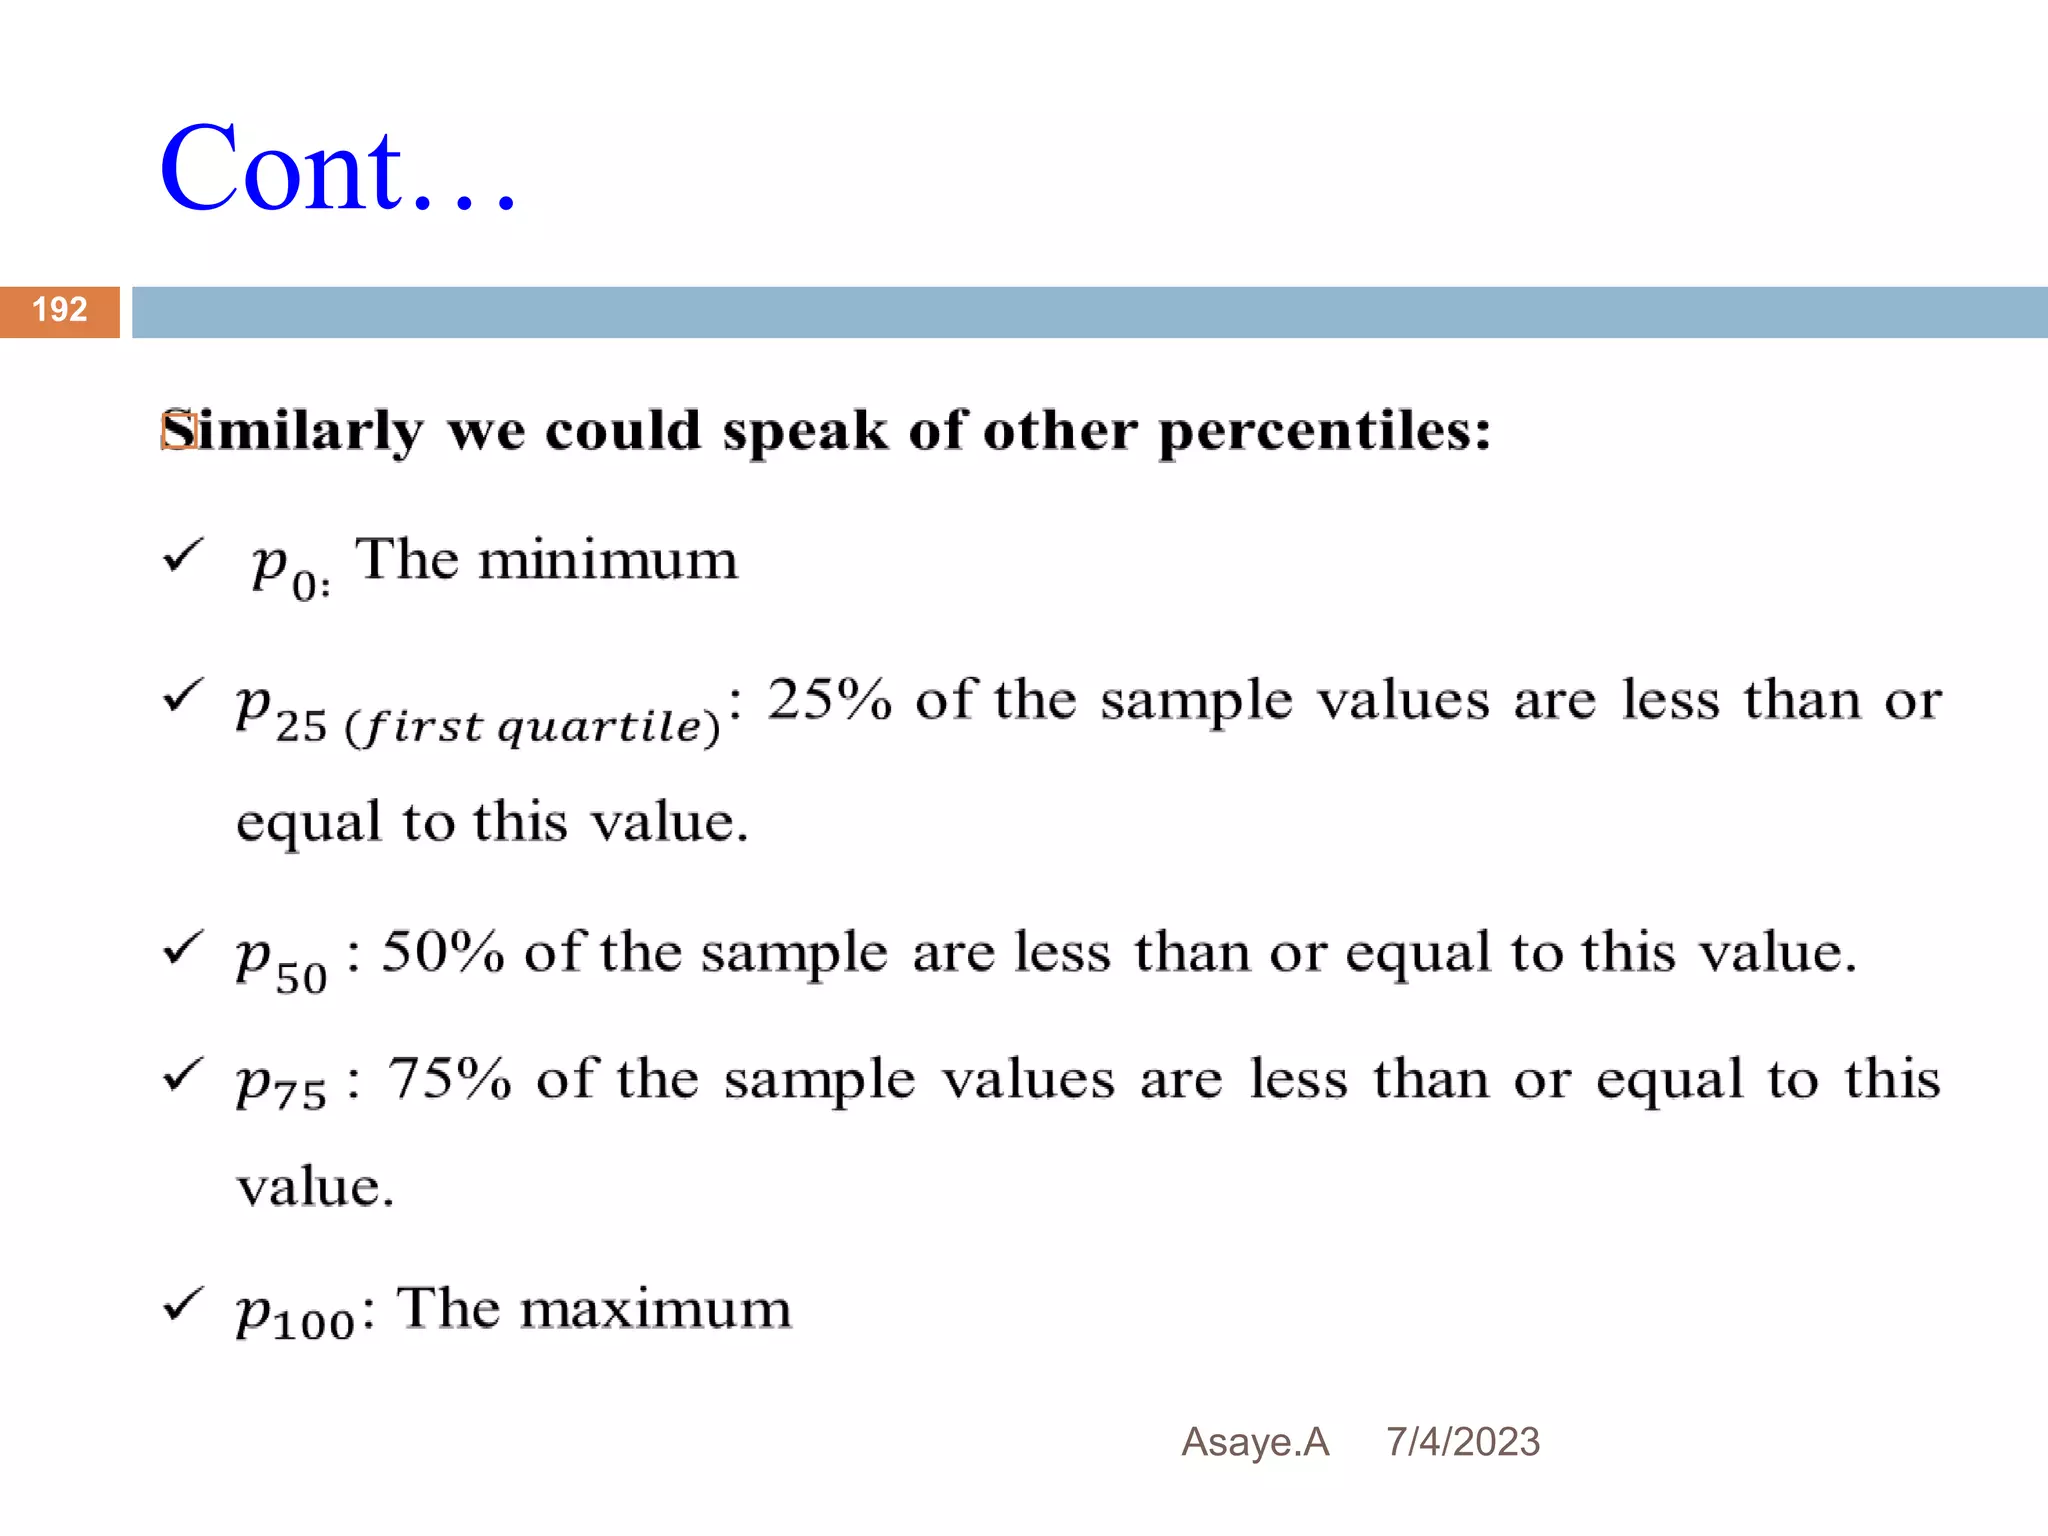
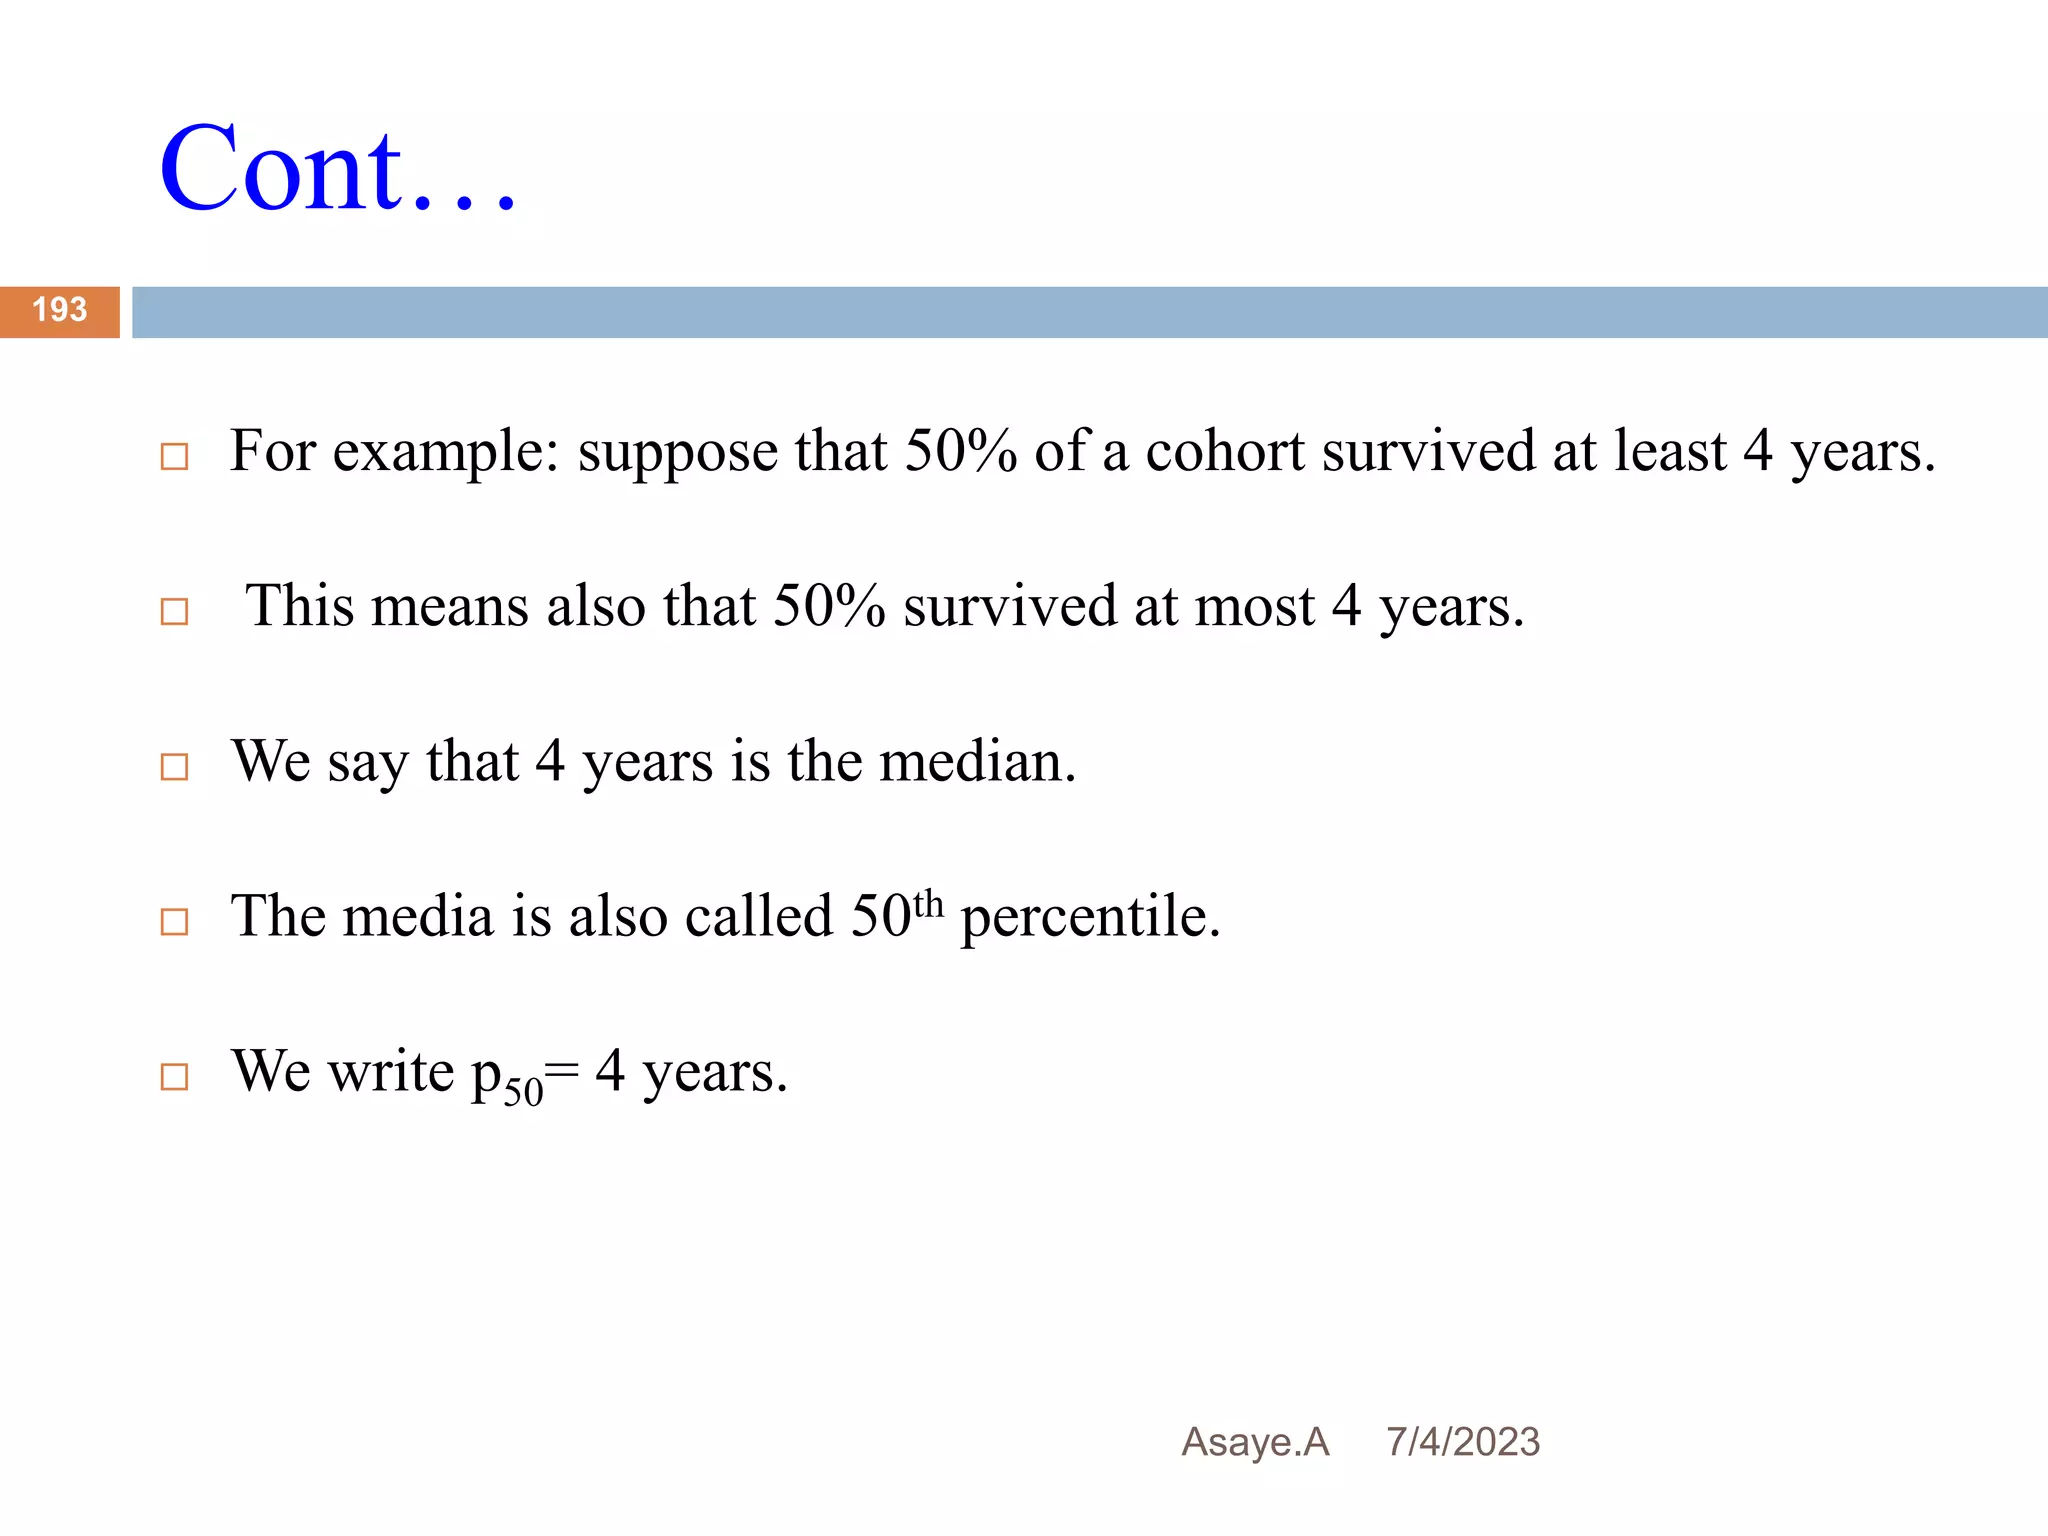
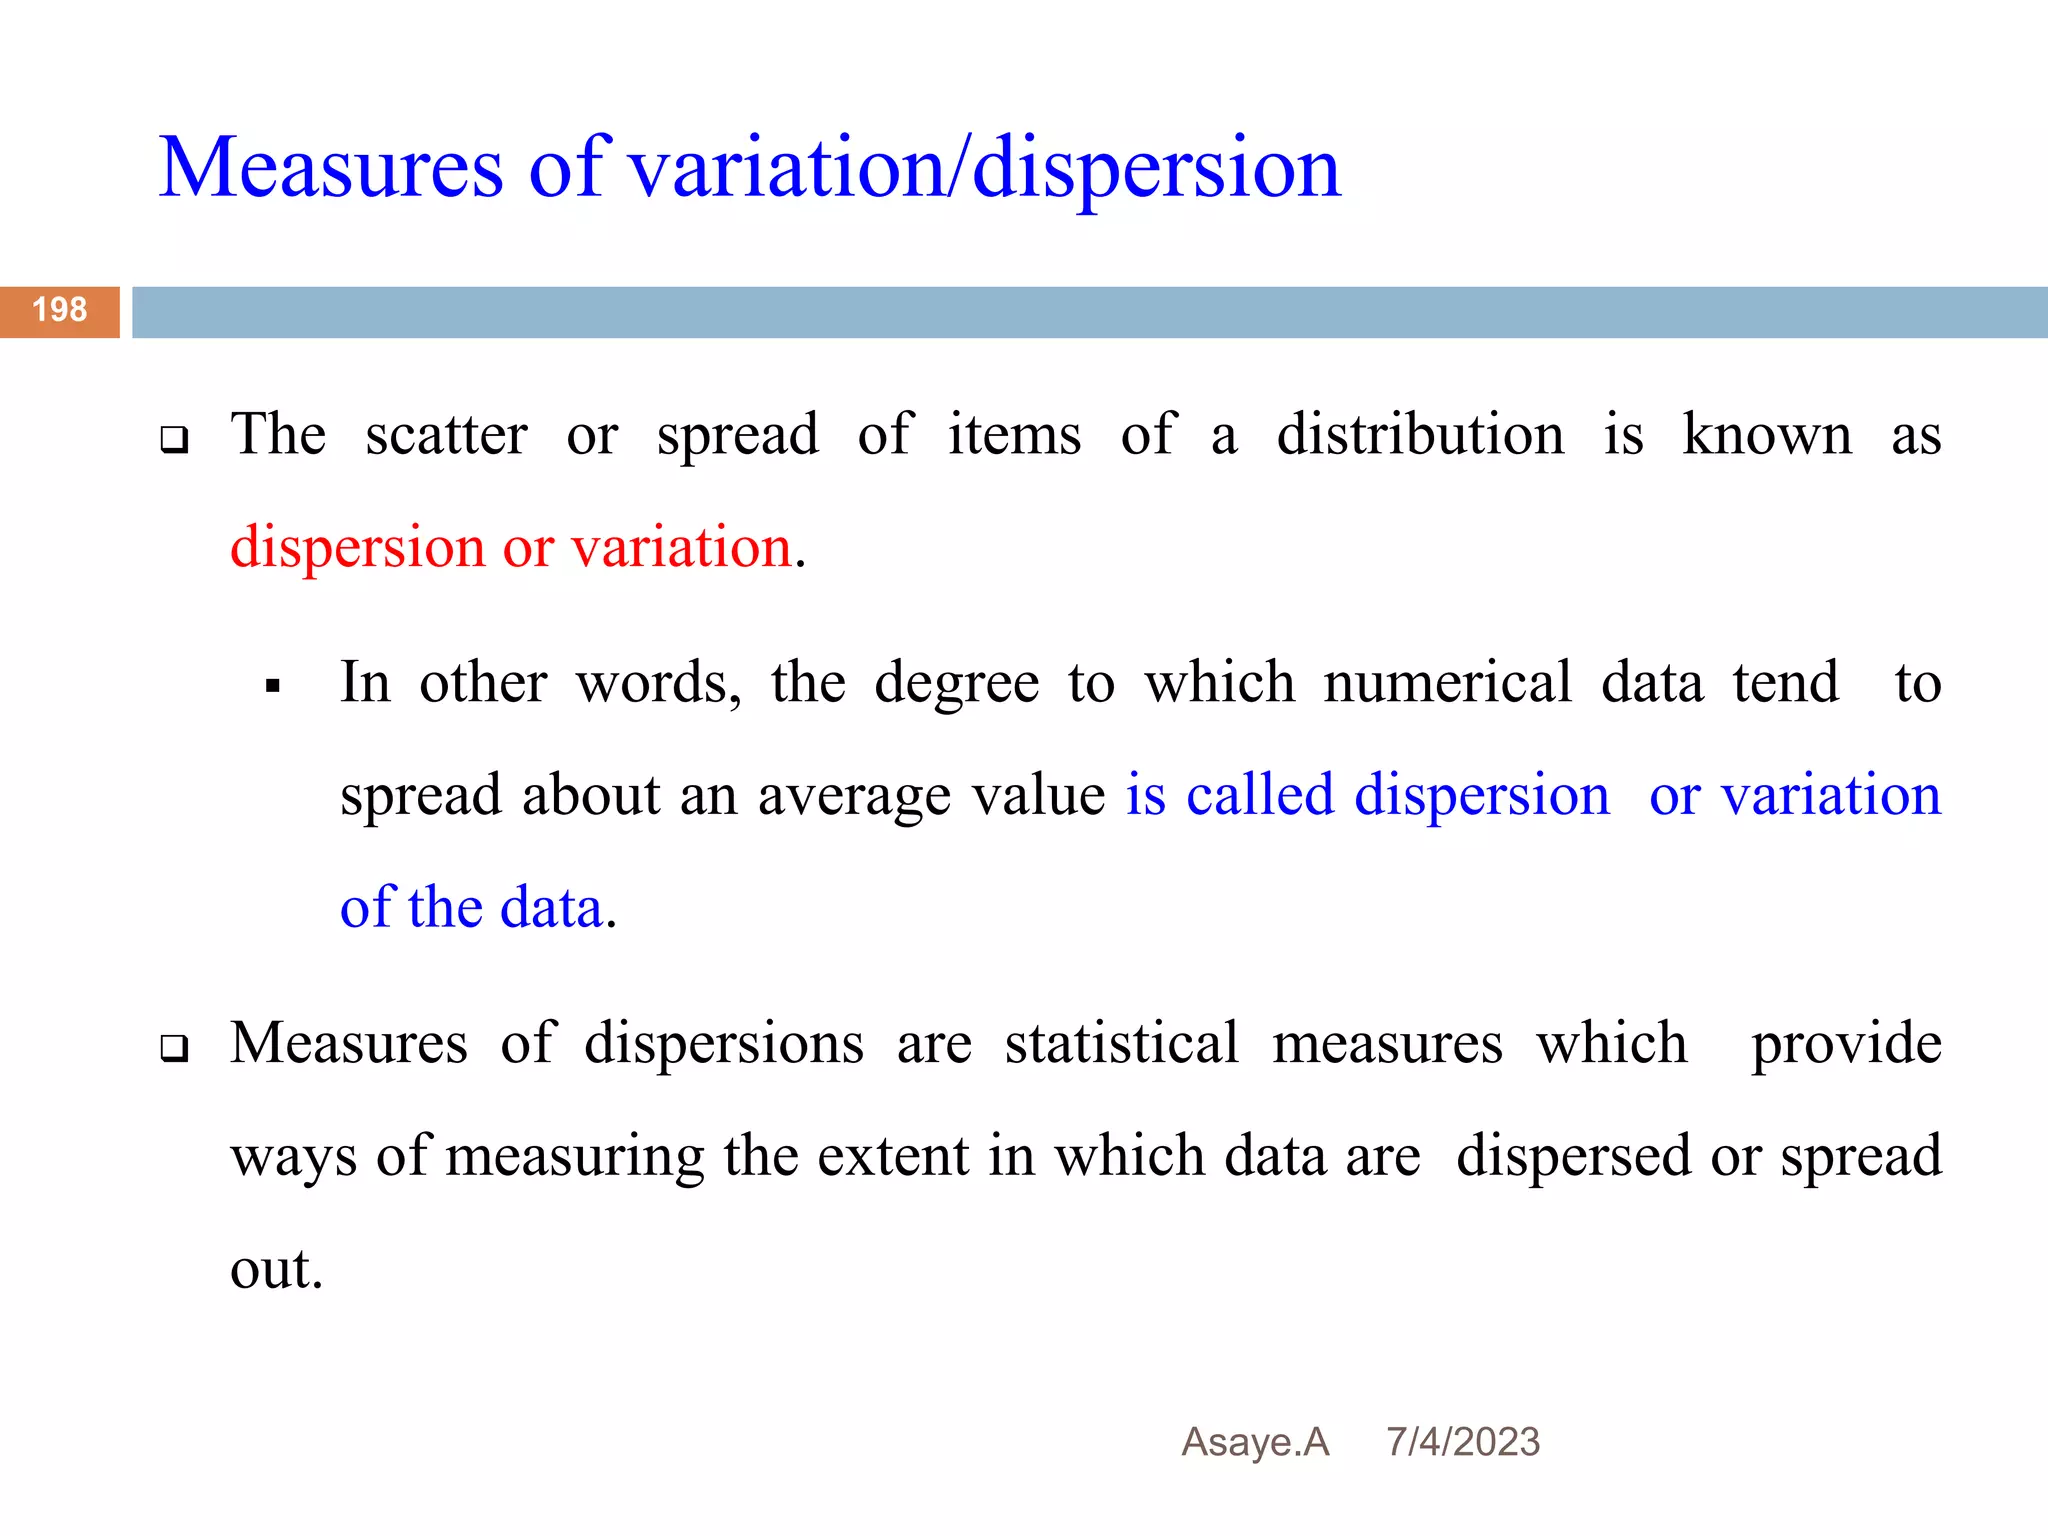
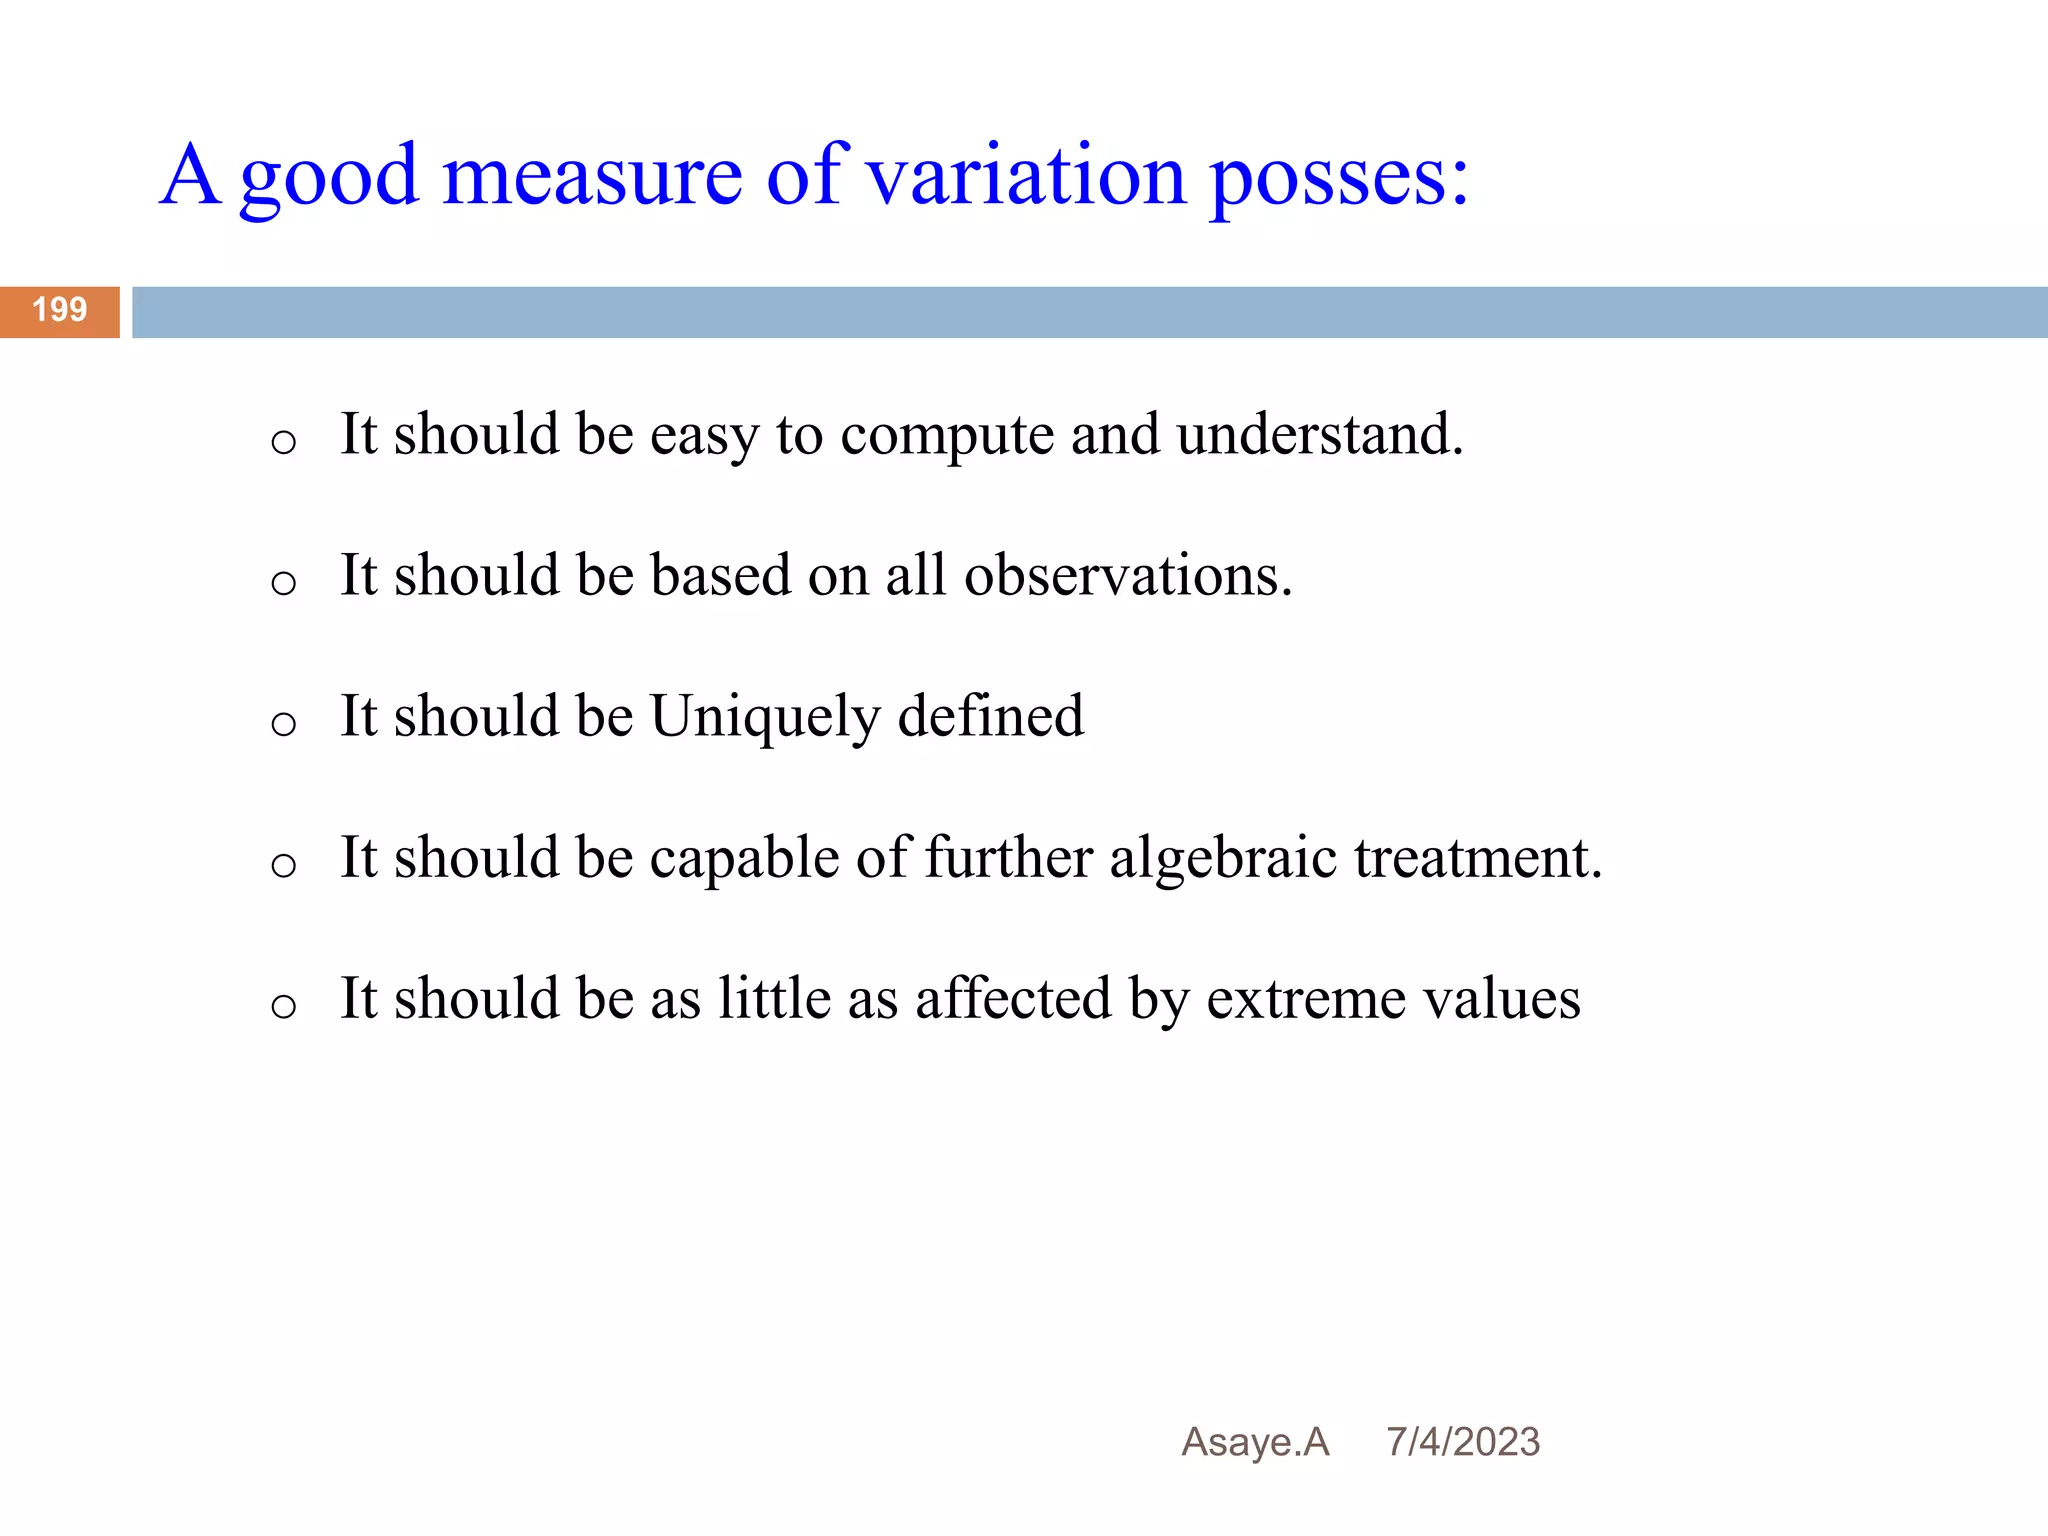
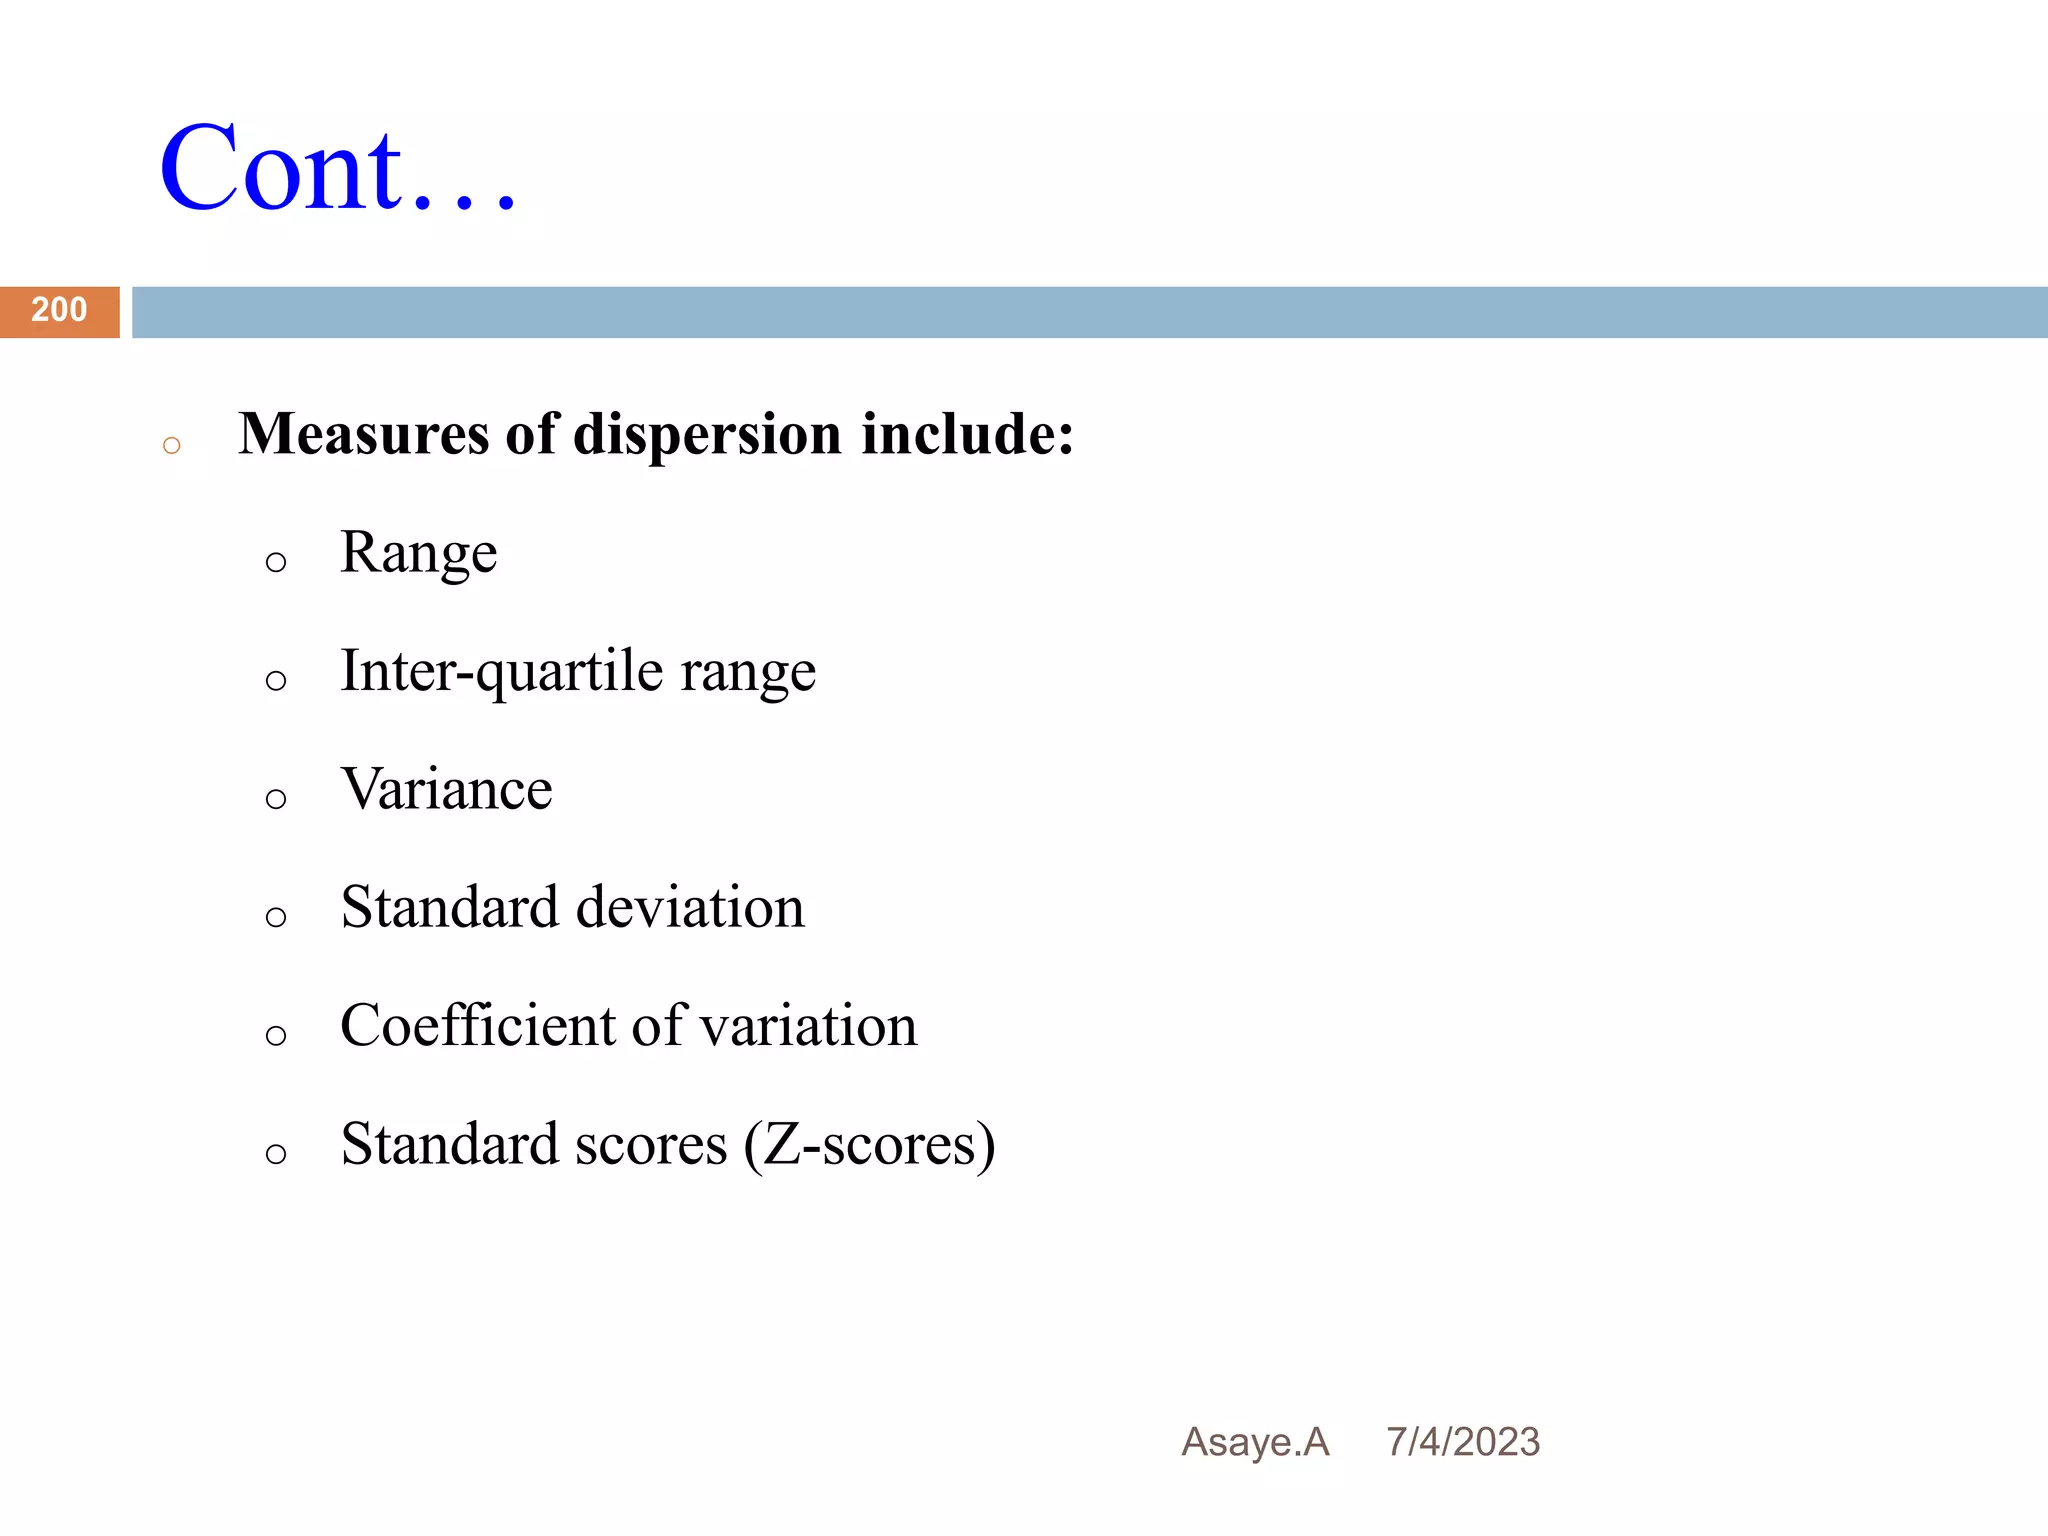
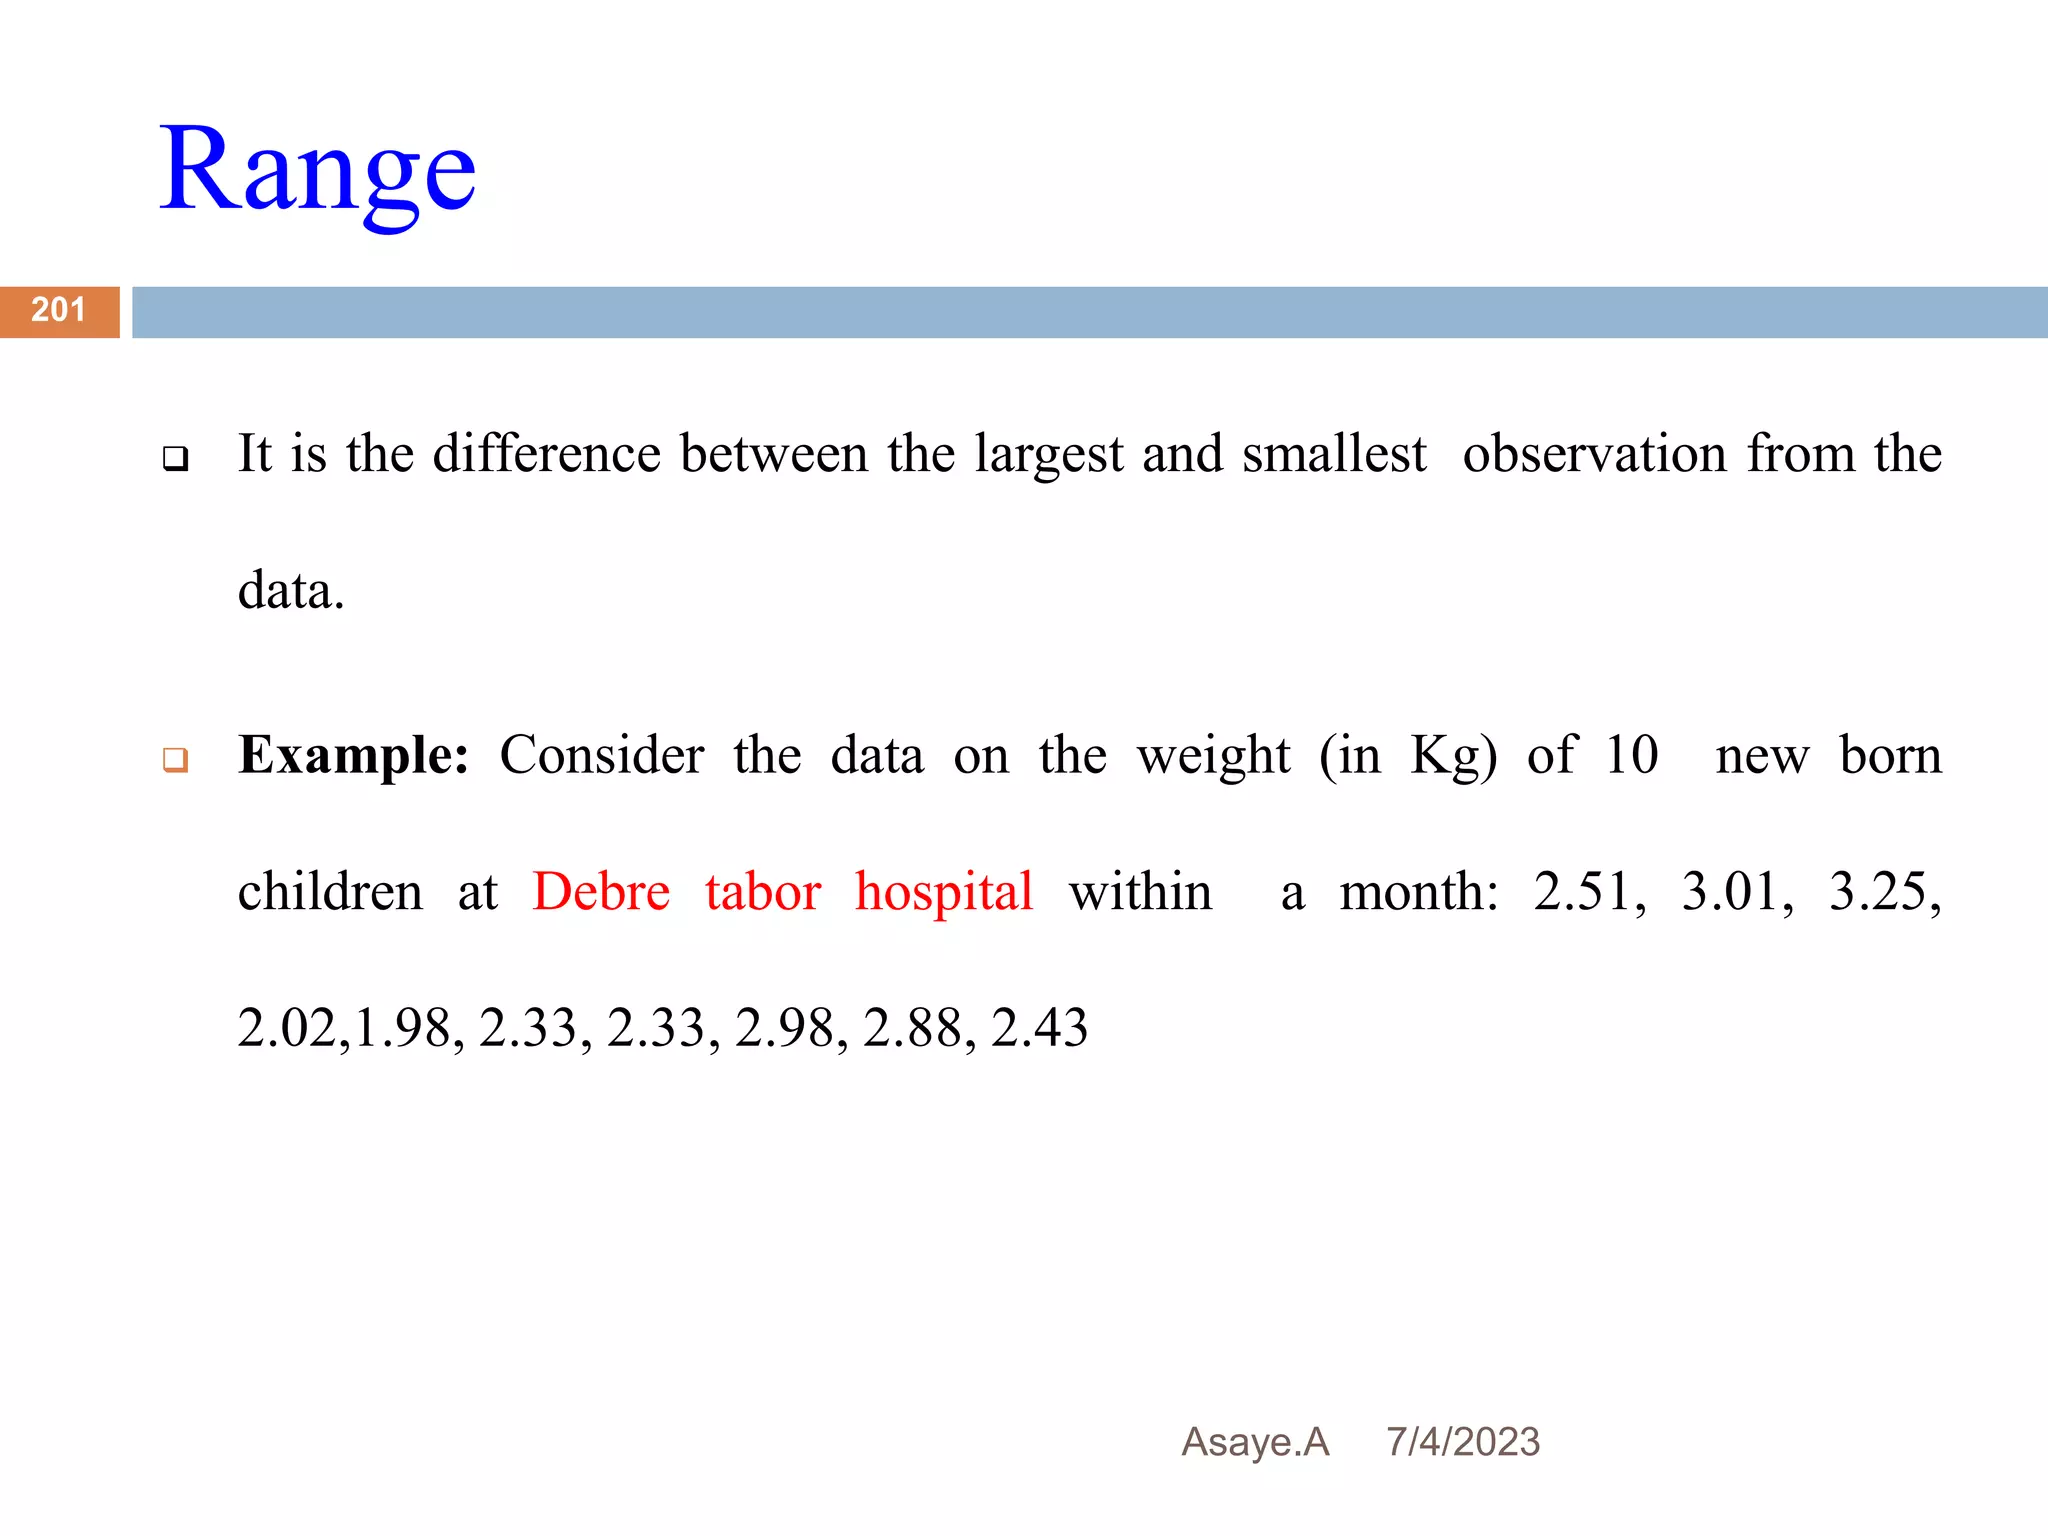
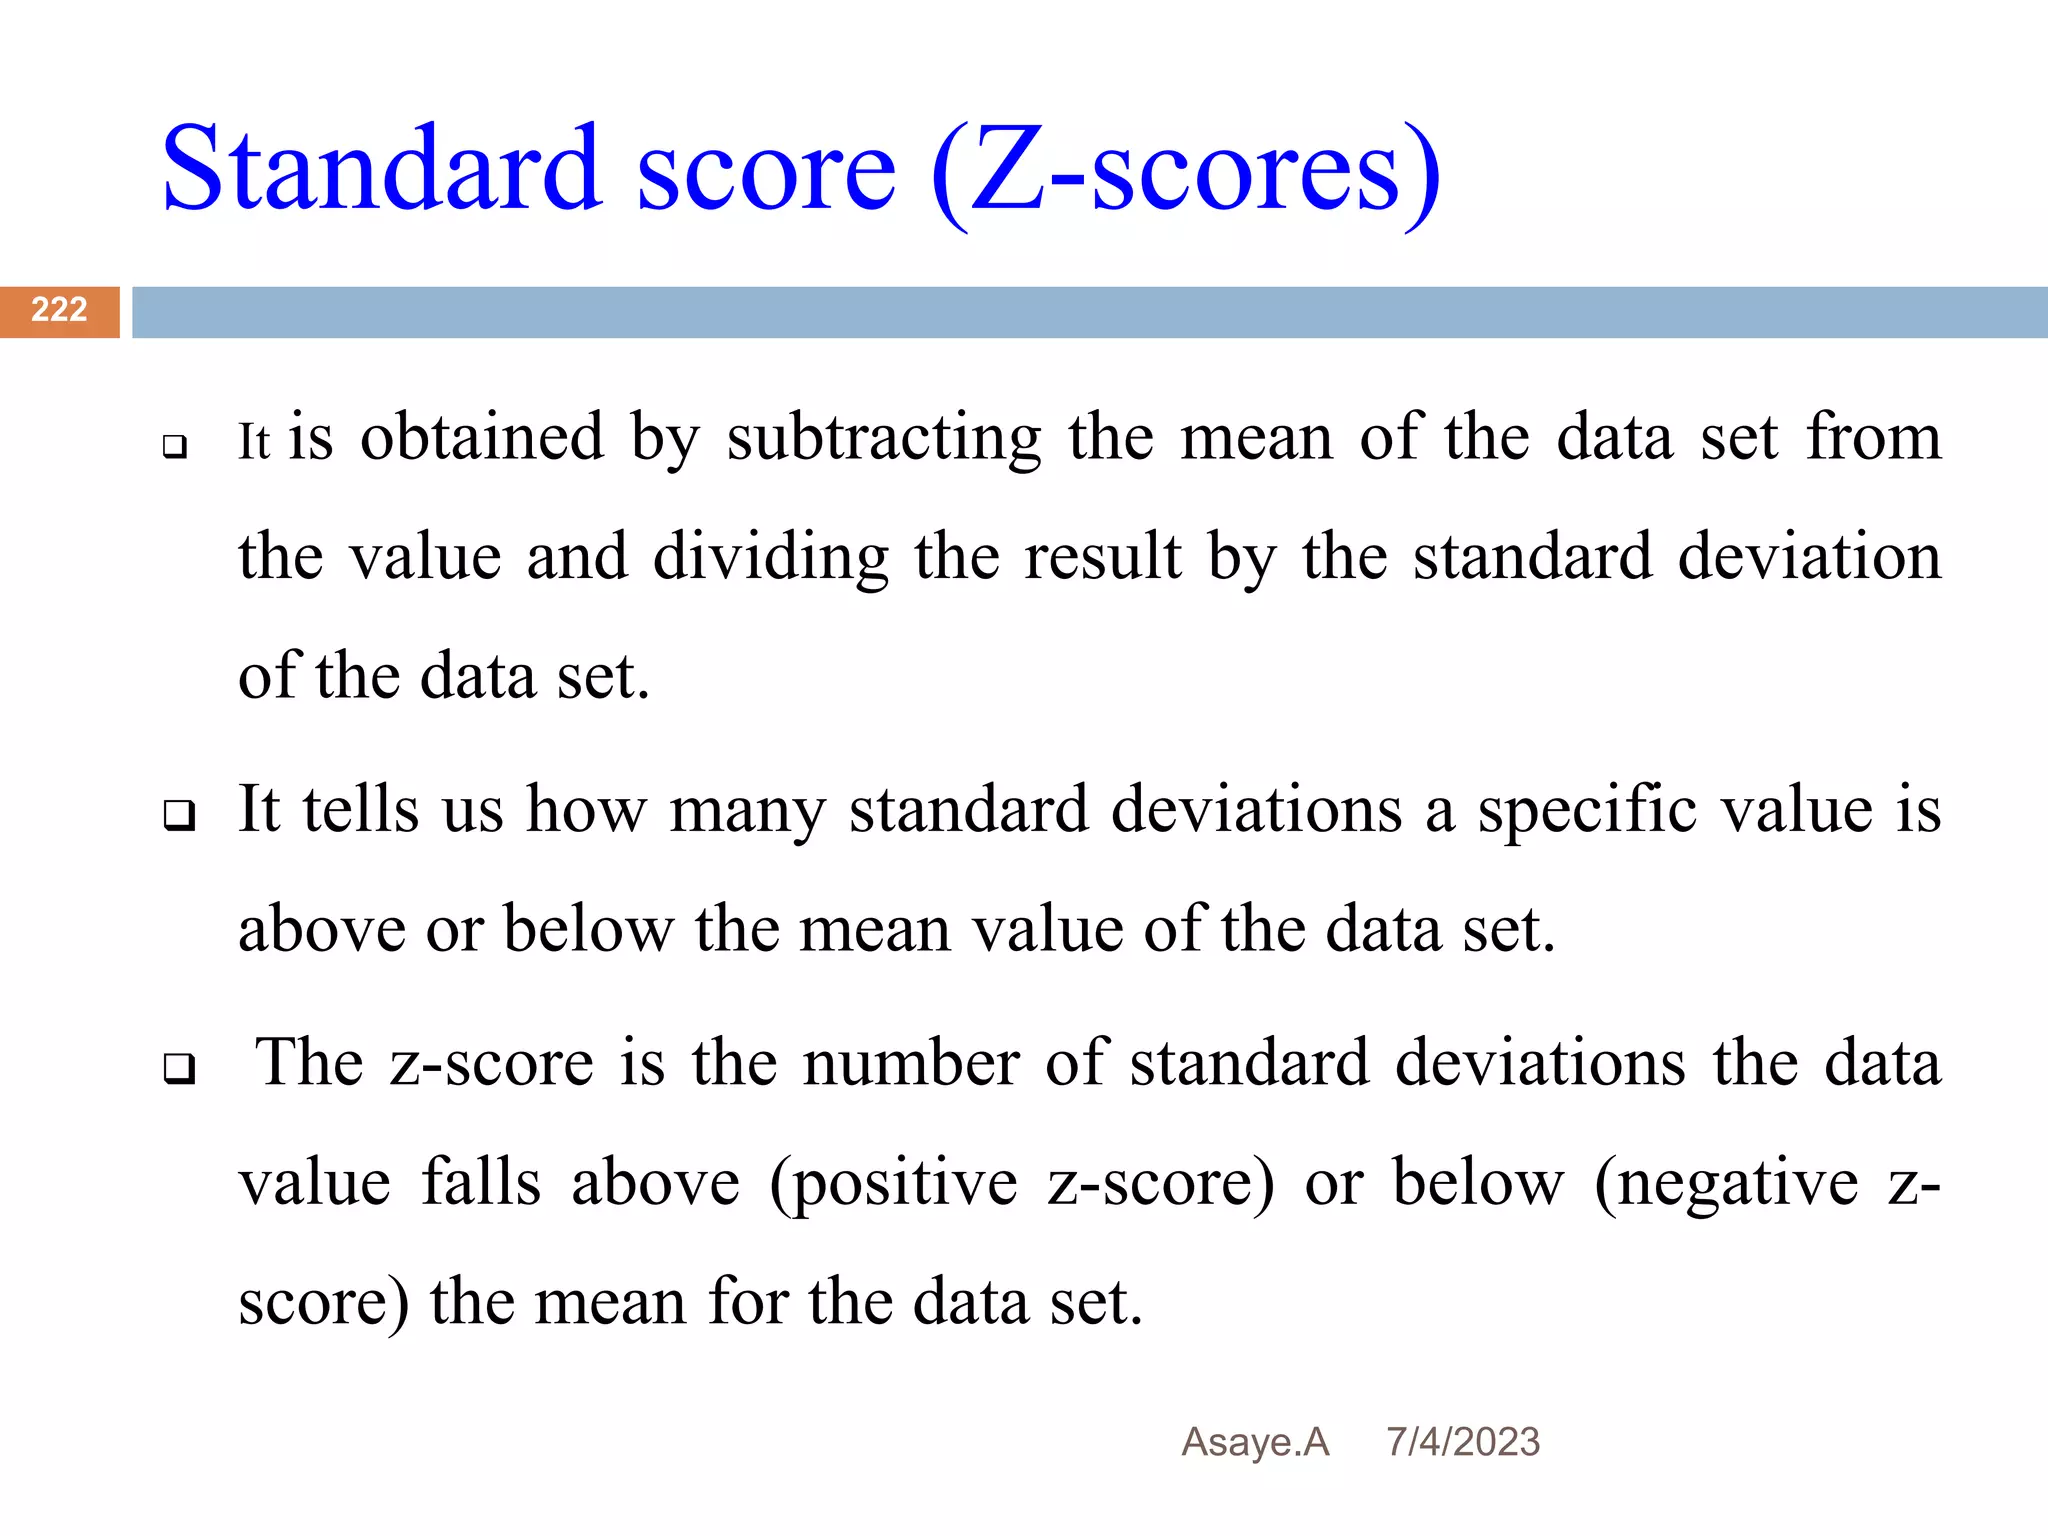
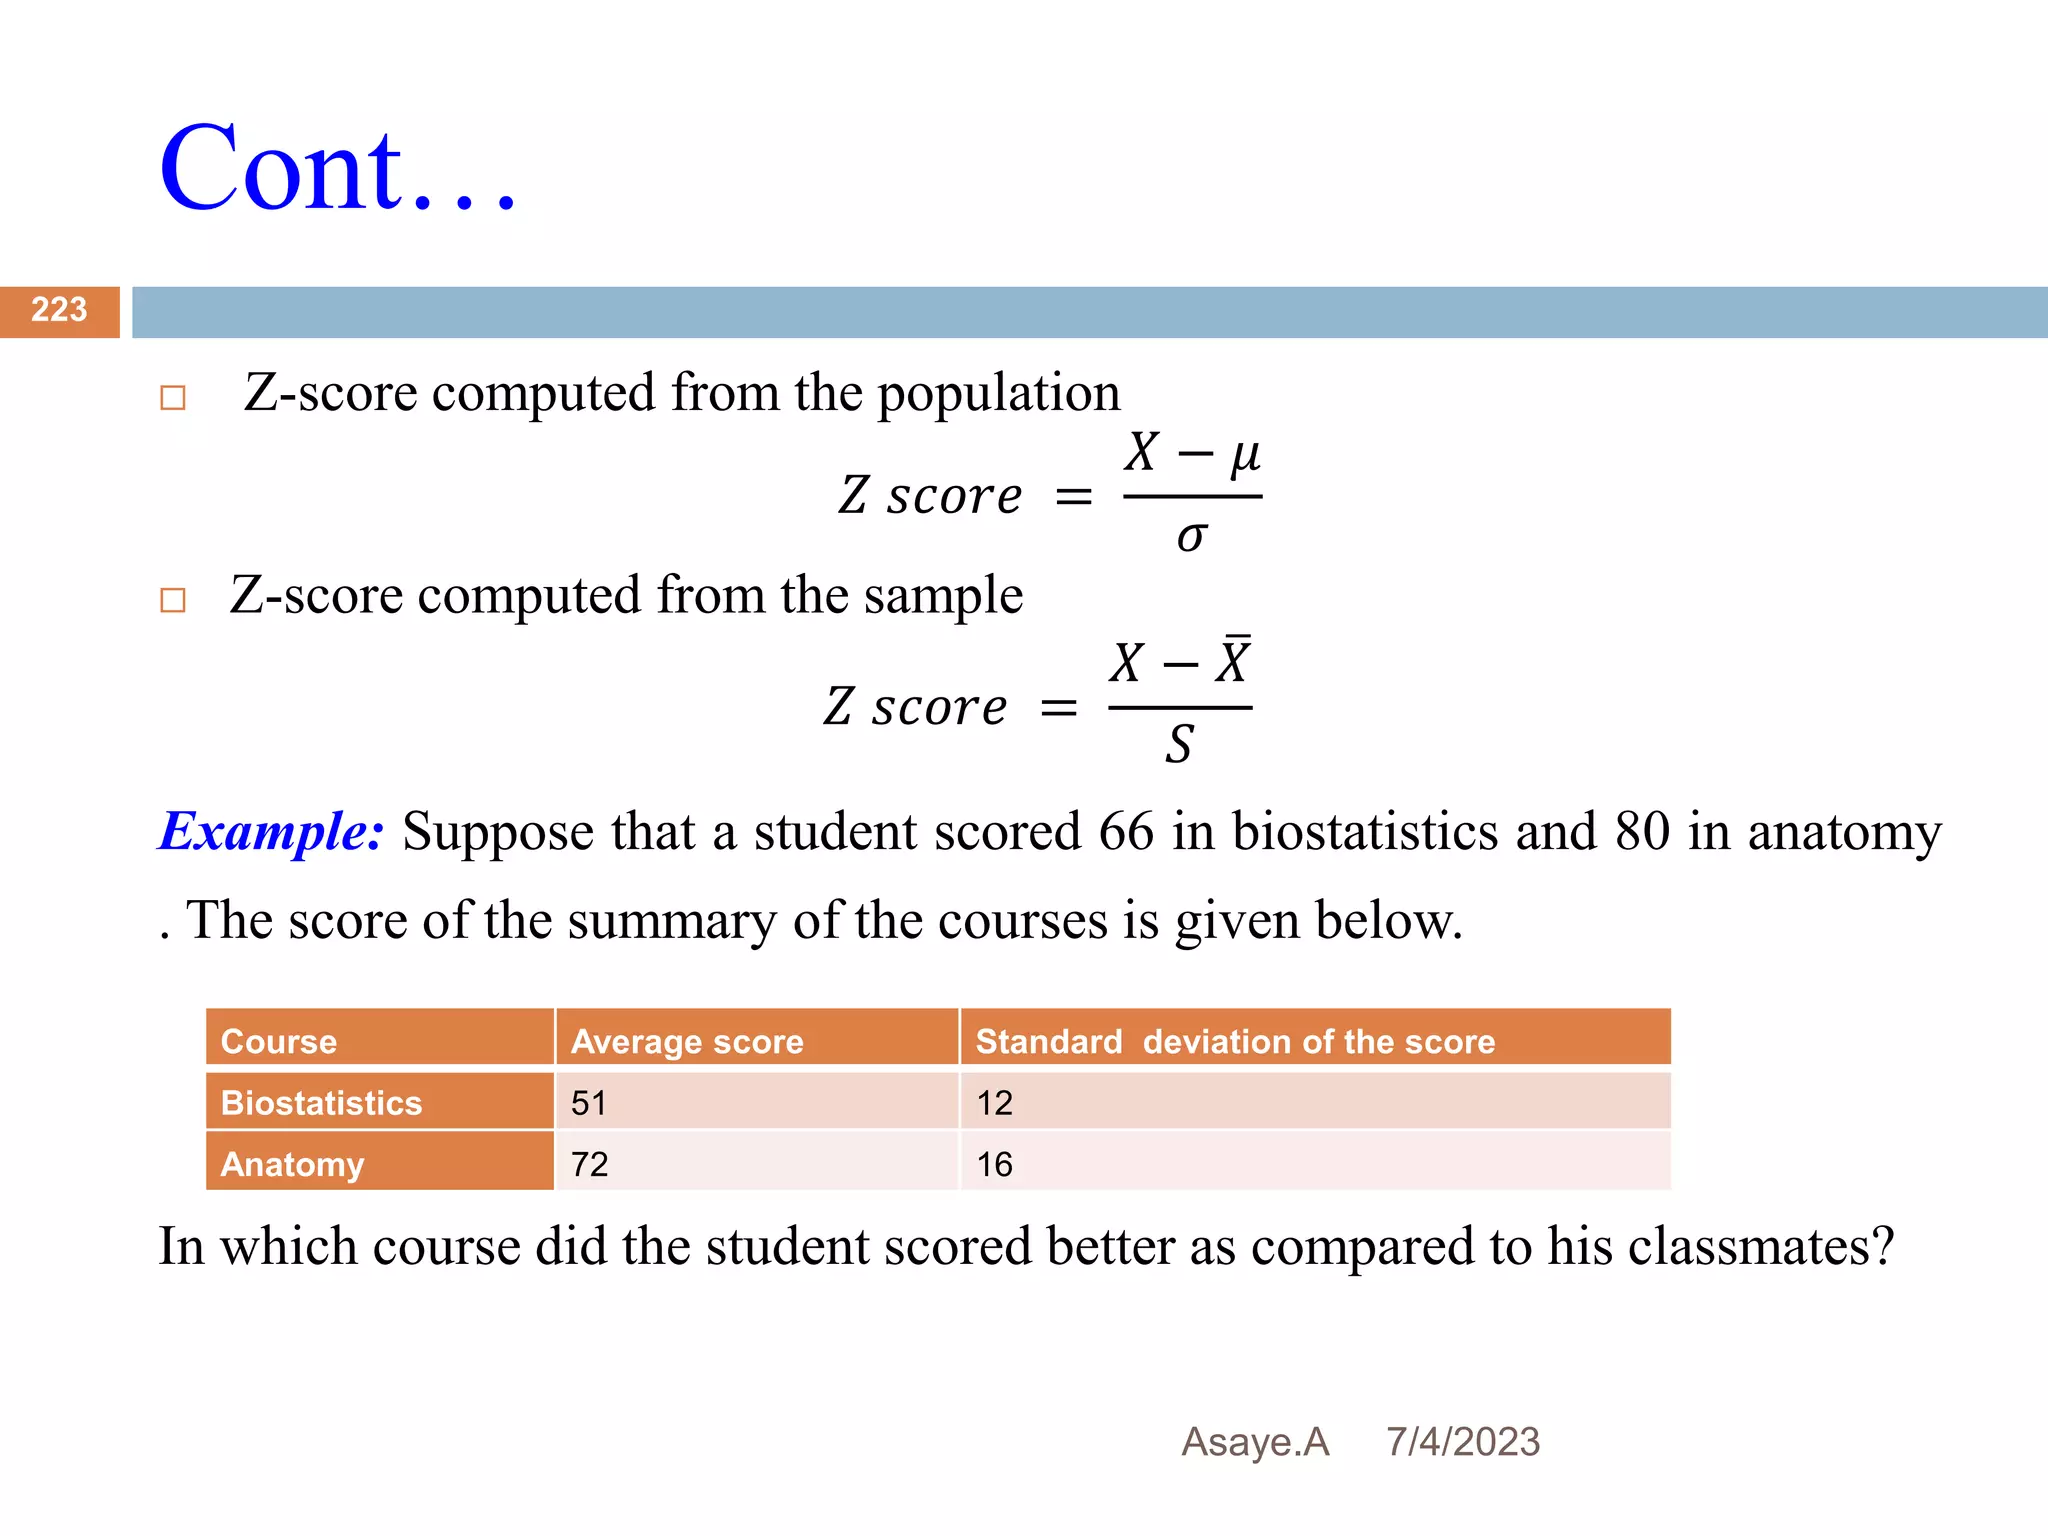
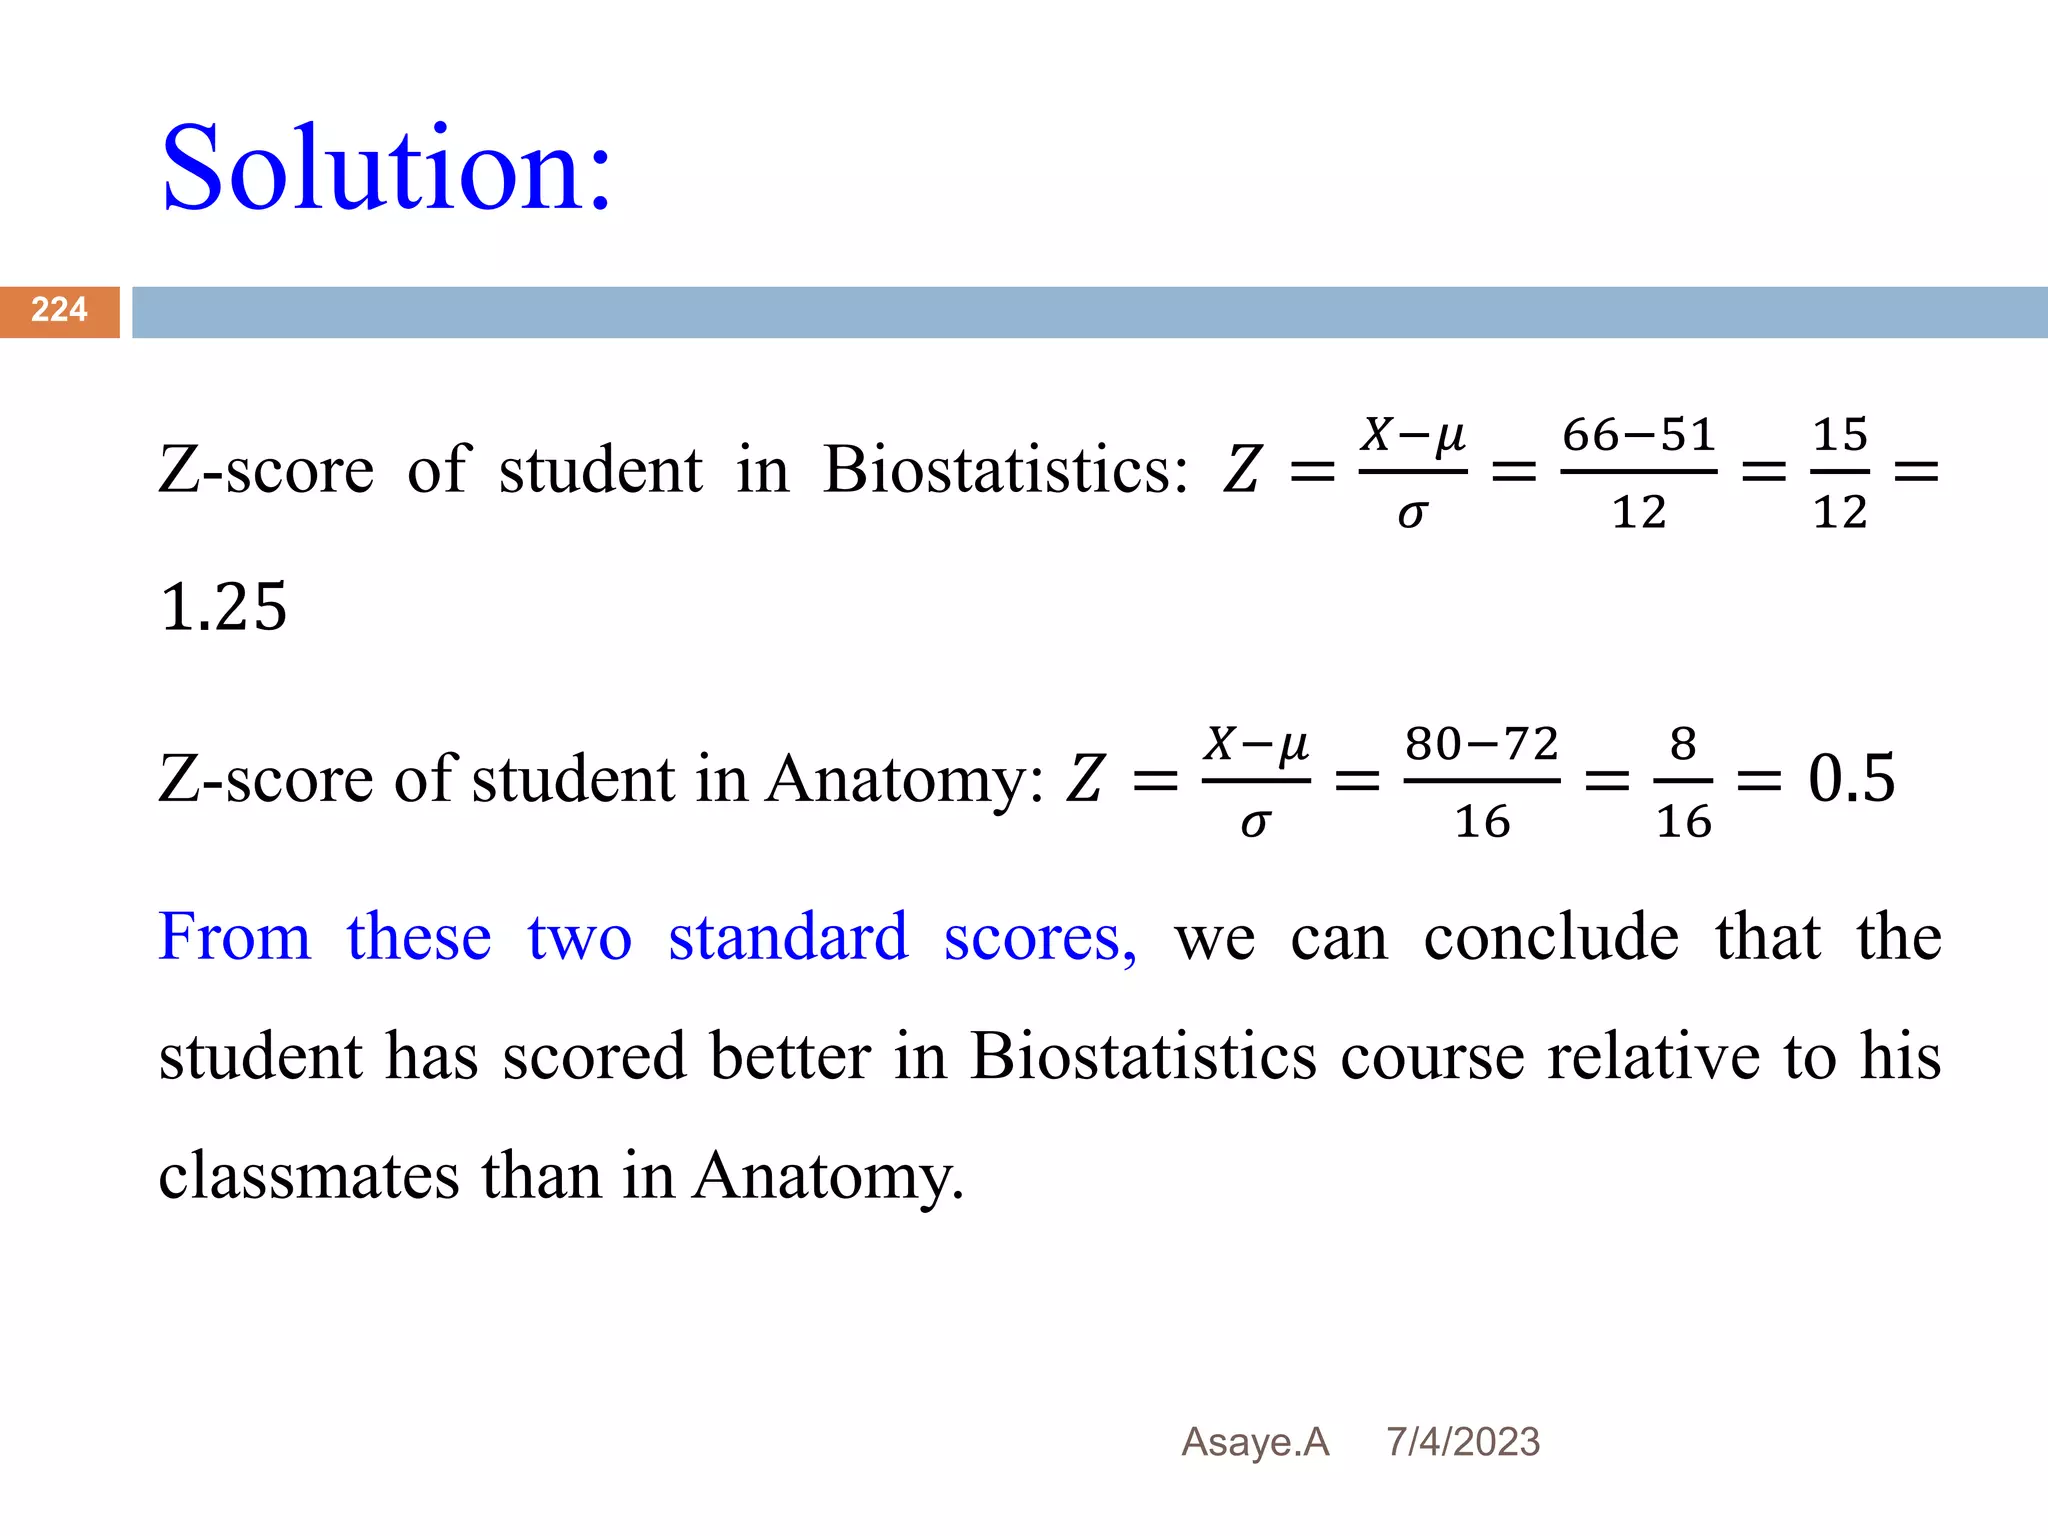
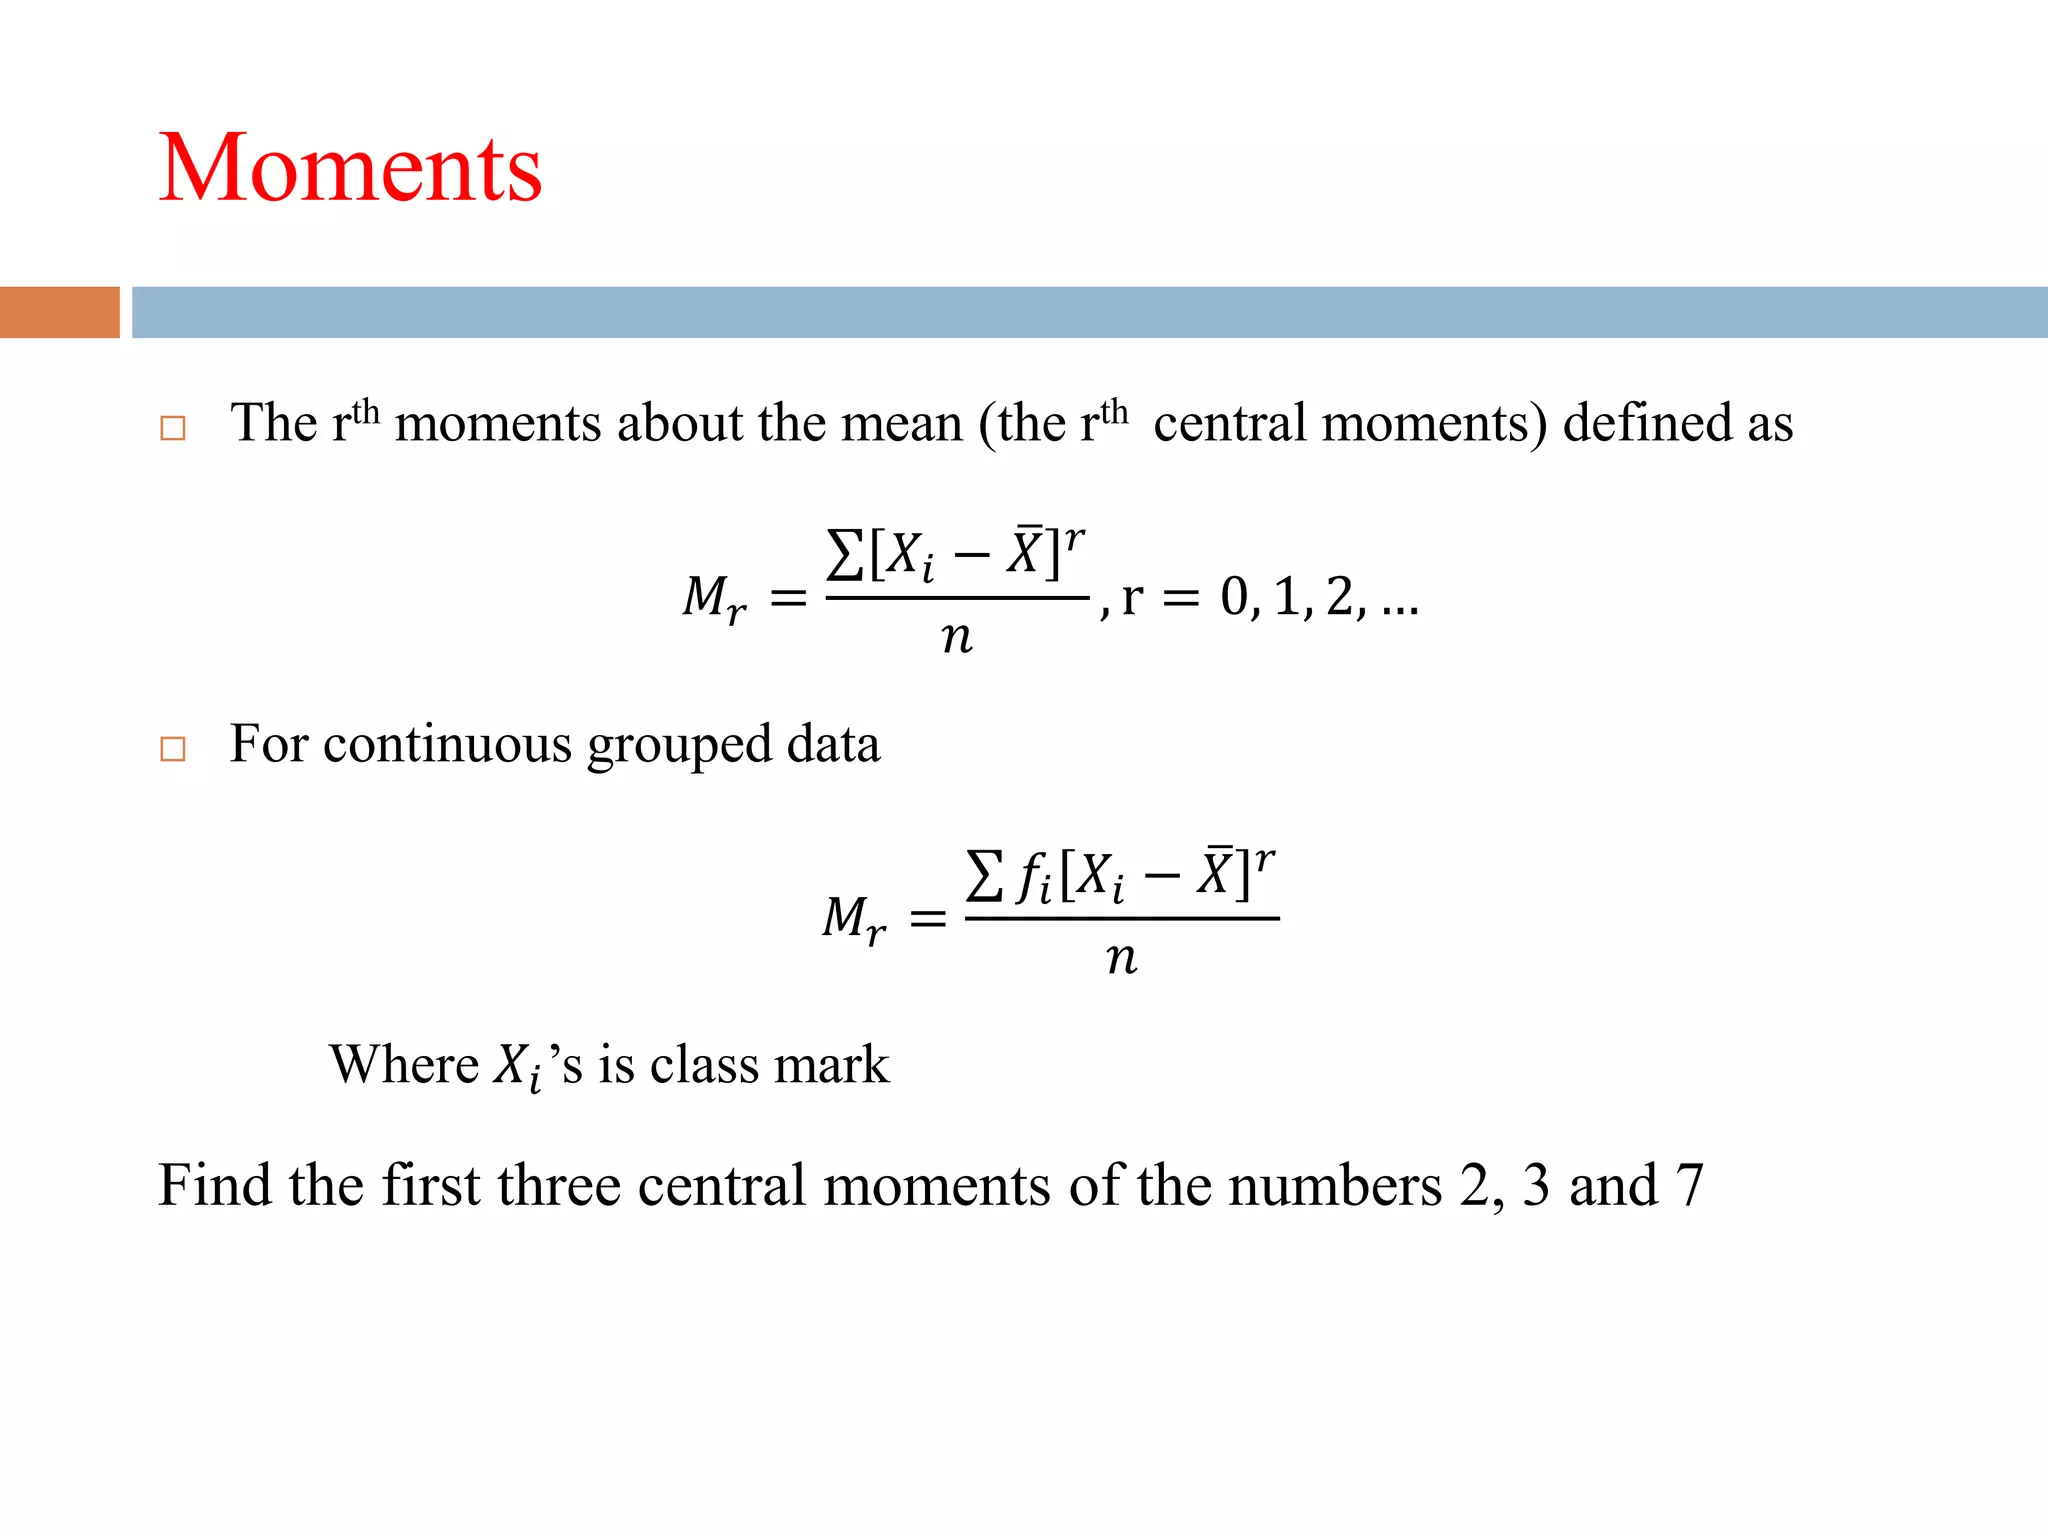
This document provides an introduction to biostatistics for health science students at Debre Tabor University in Ethiopia. It defines biostatistics as the application of statistical methods to medical and public health problems. The introduction outlines topics that will be covered, including defining key statistical concepts, classifying variables, and discussing the importance and limitations of biostatistics. Contact information is provided for the lecturer, Asaye Alamneh.


![Cont…
7/4/2023
Asaye.A
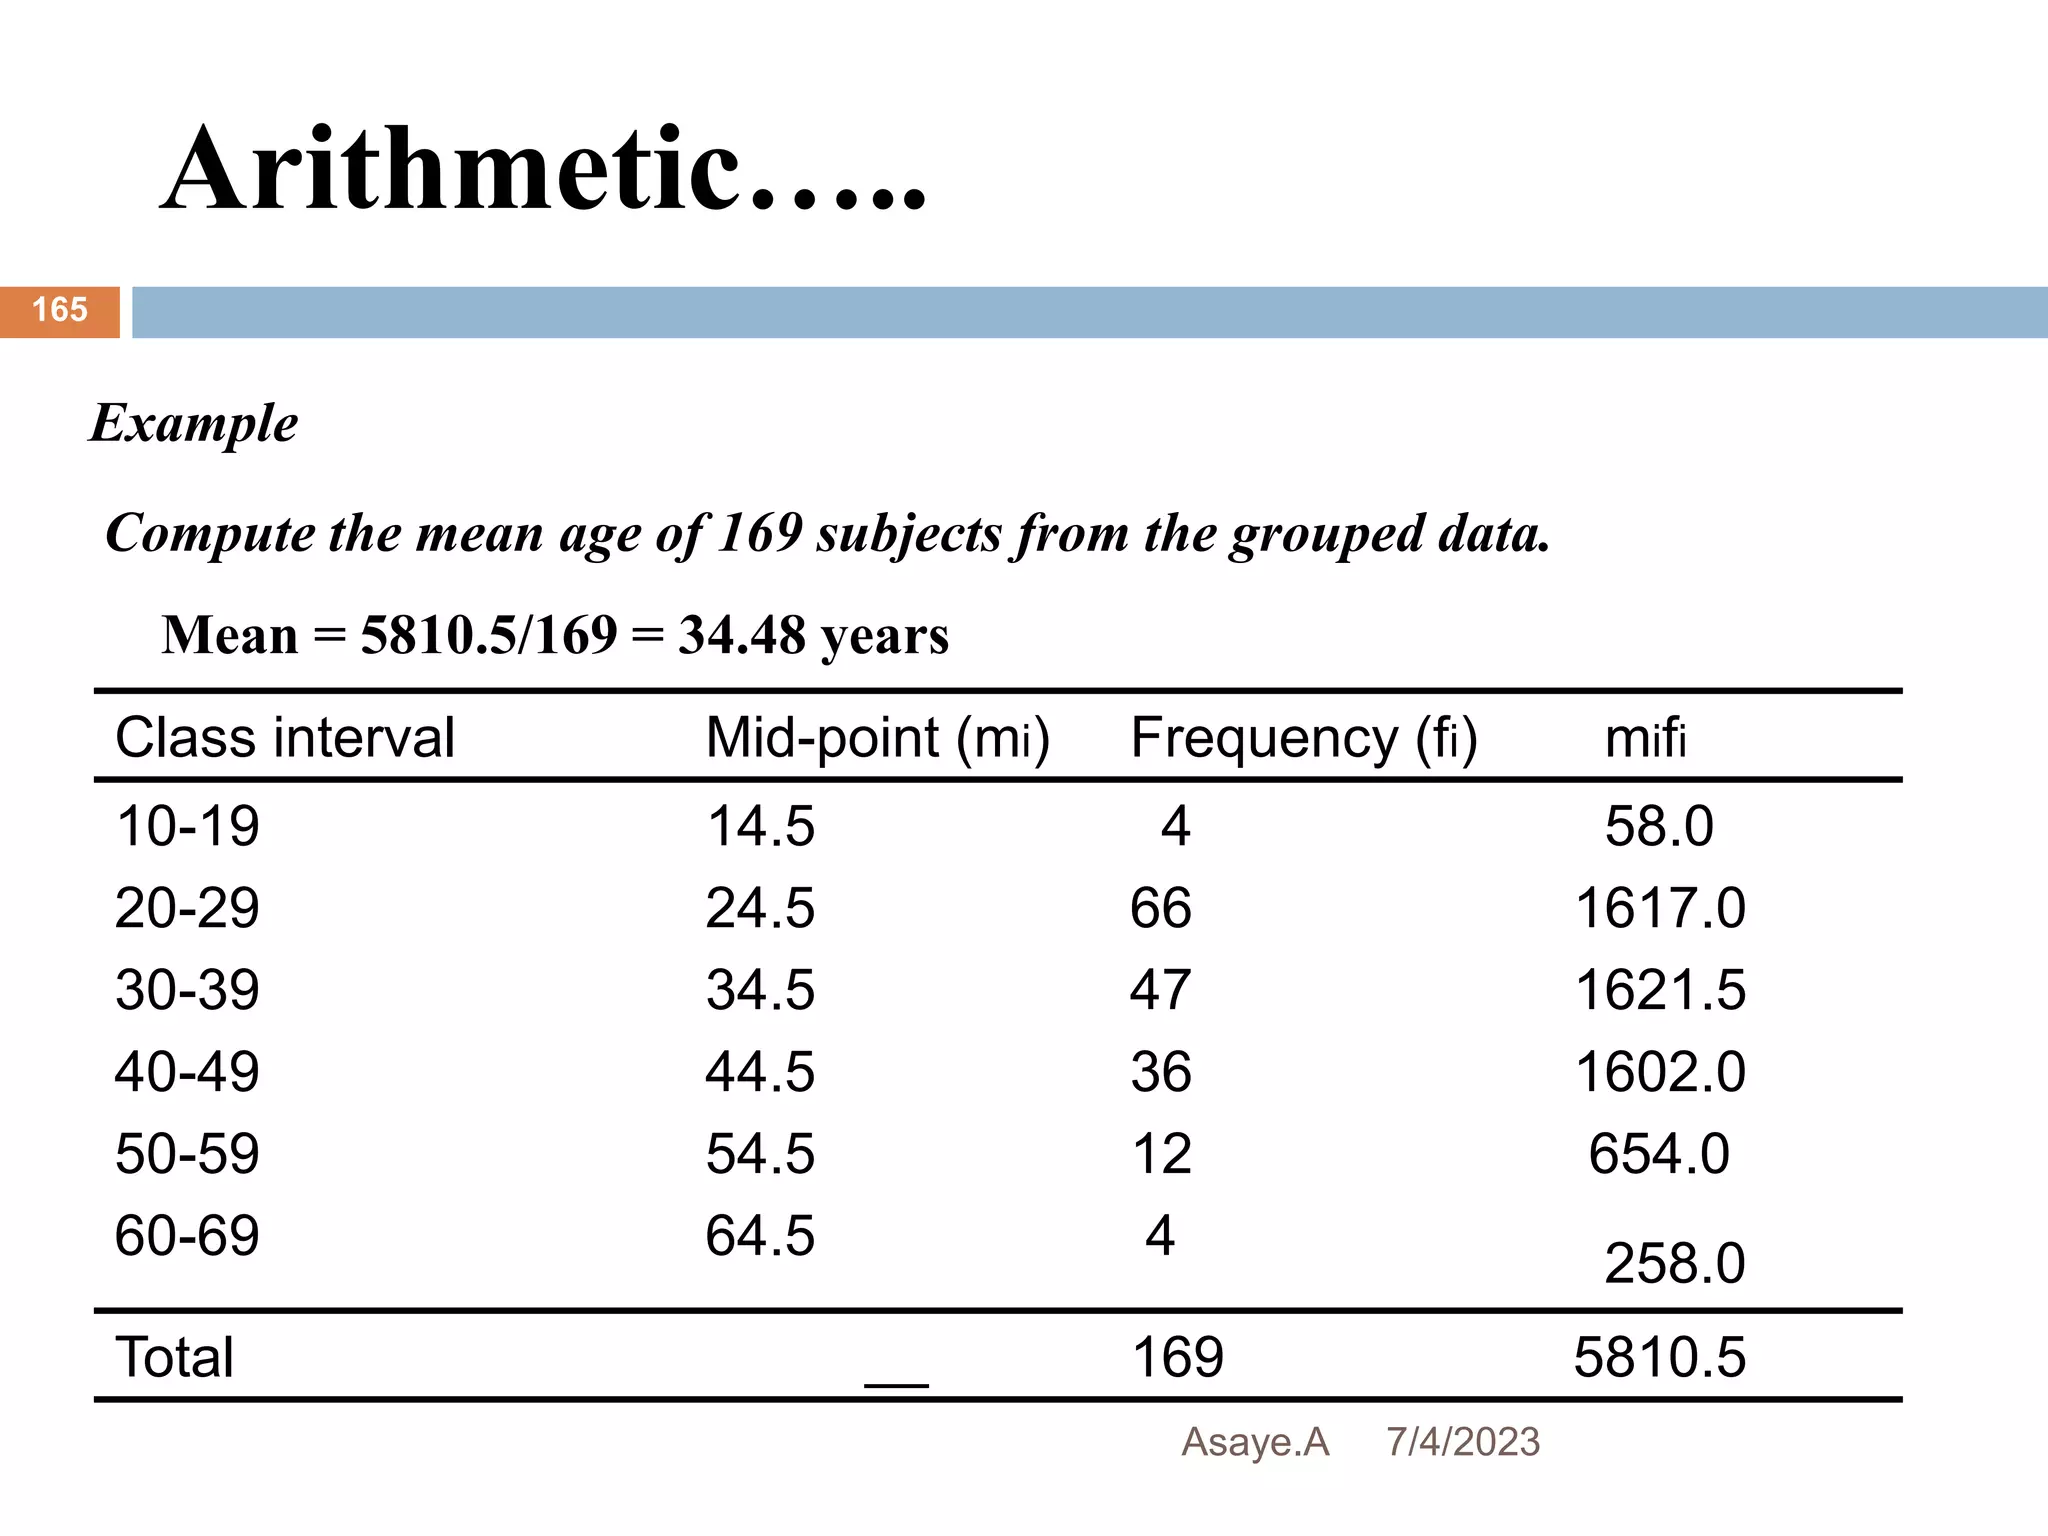
170
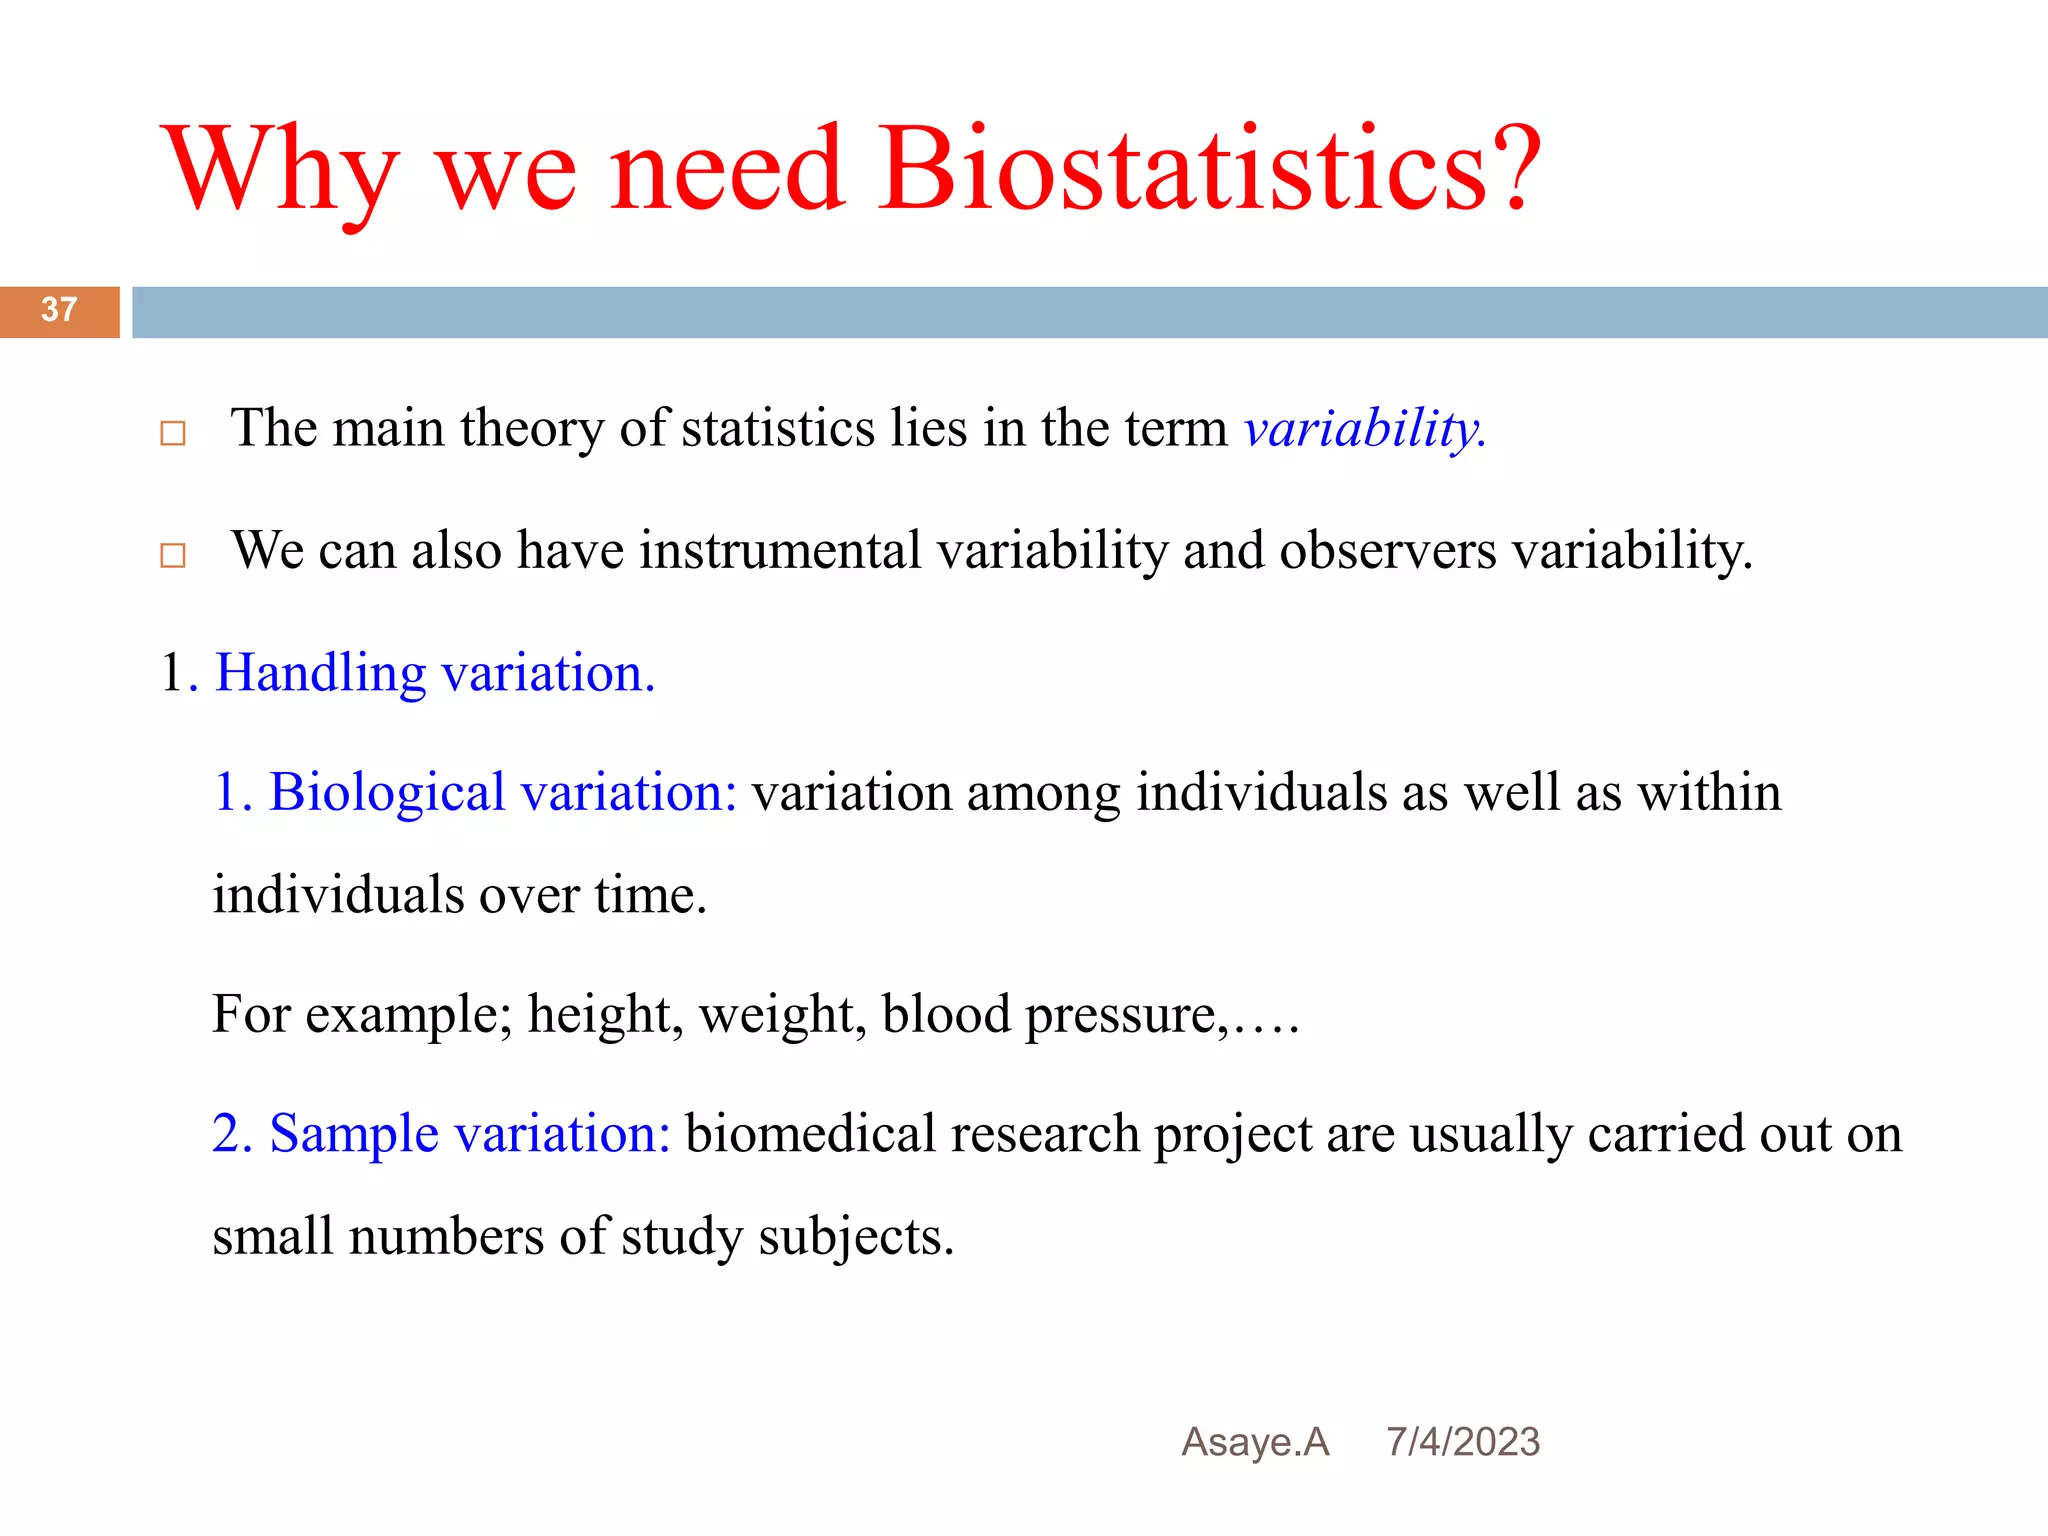
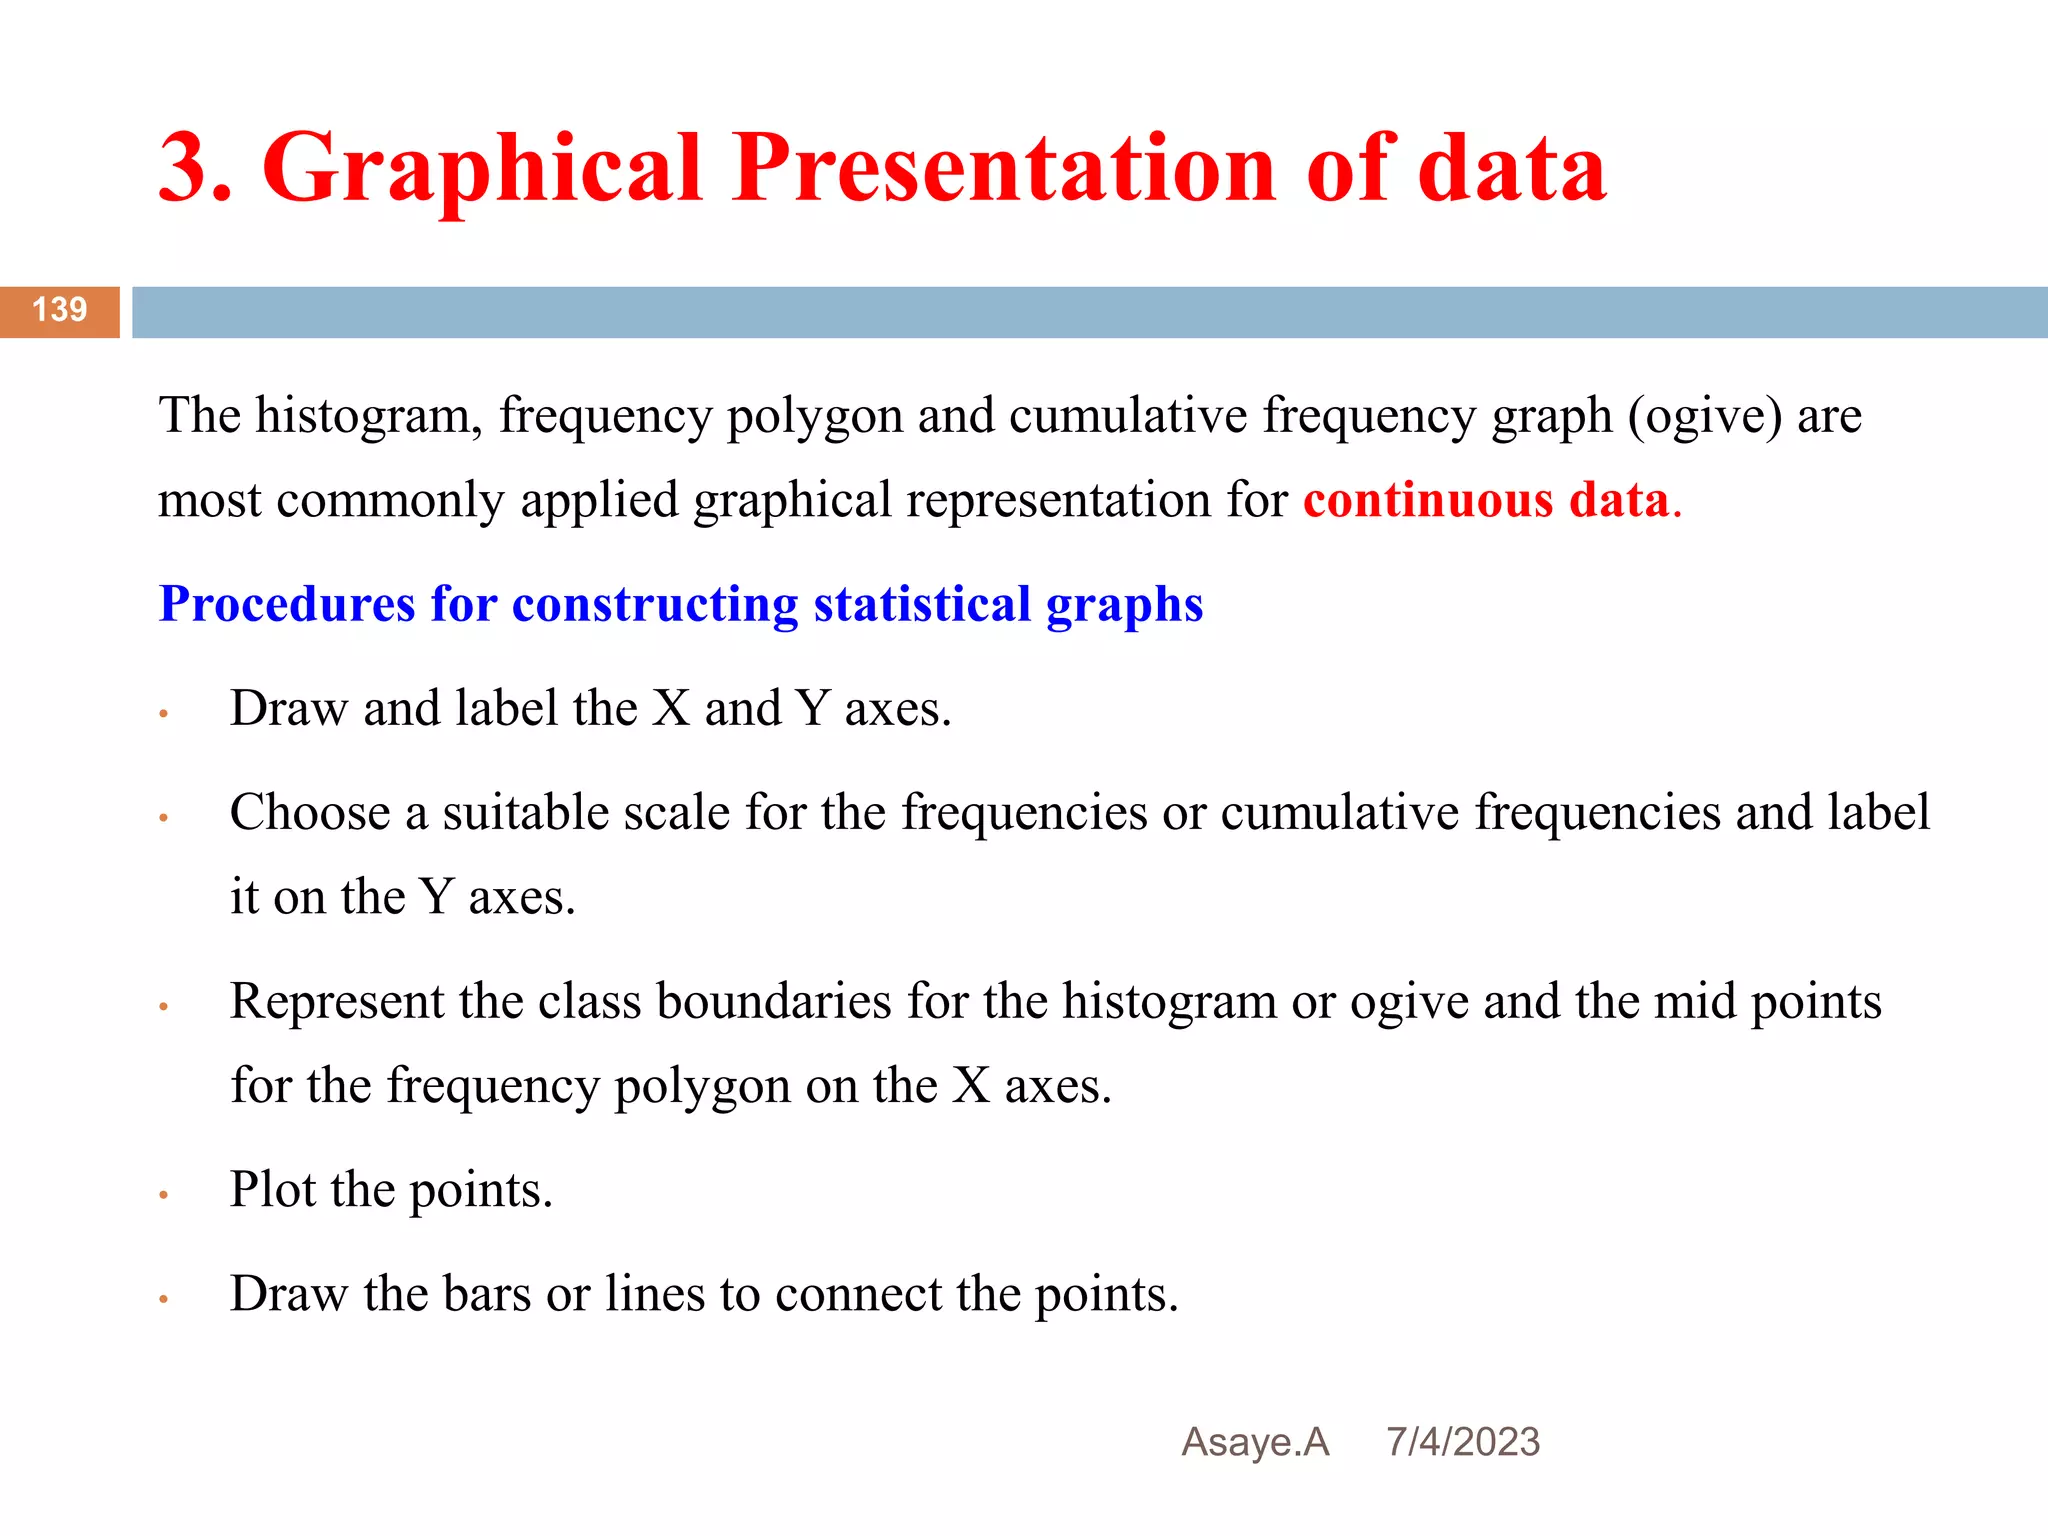
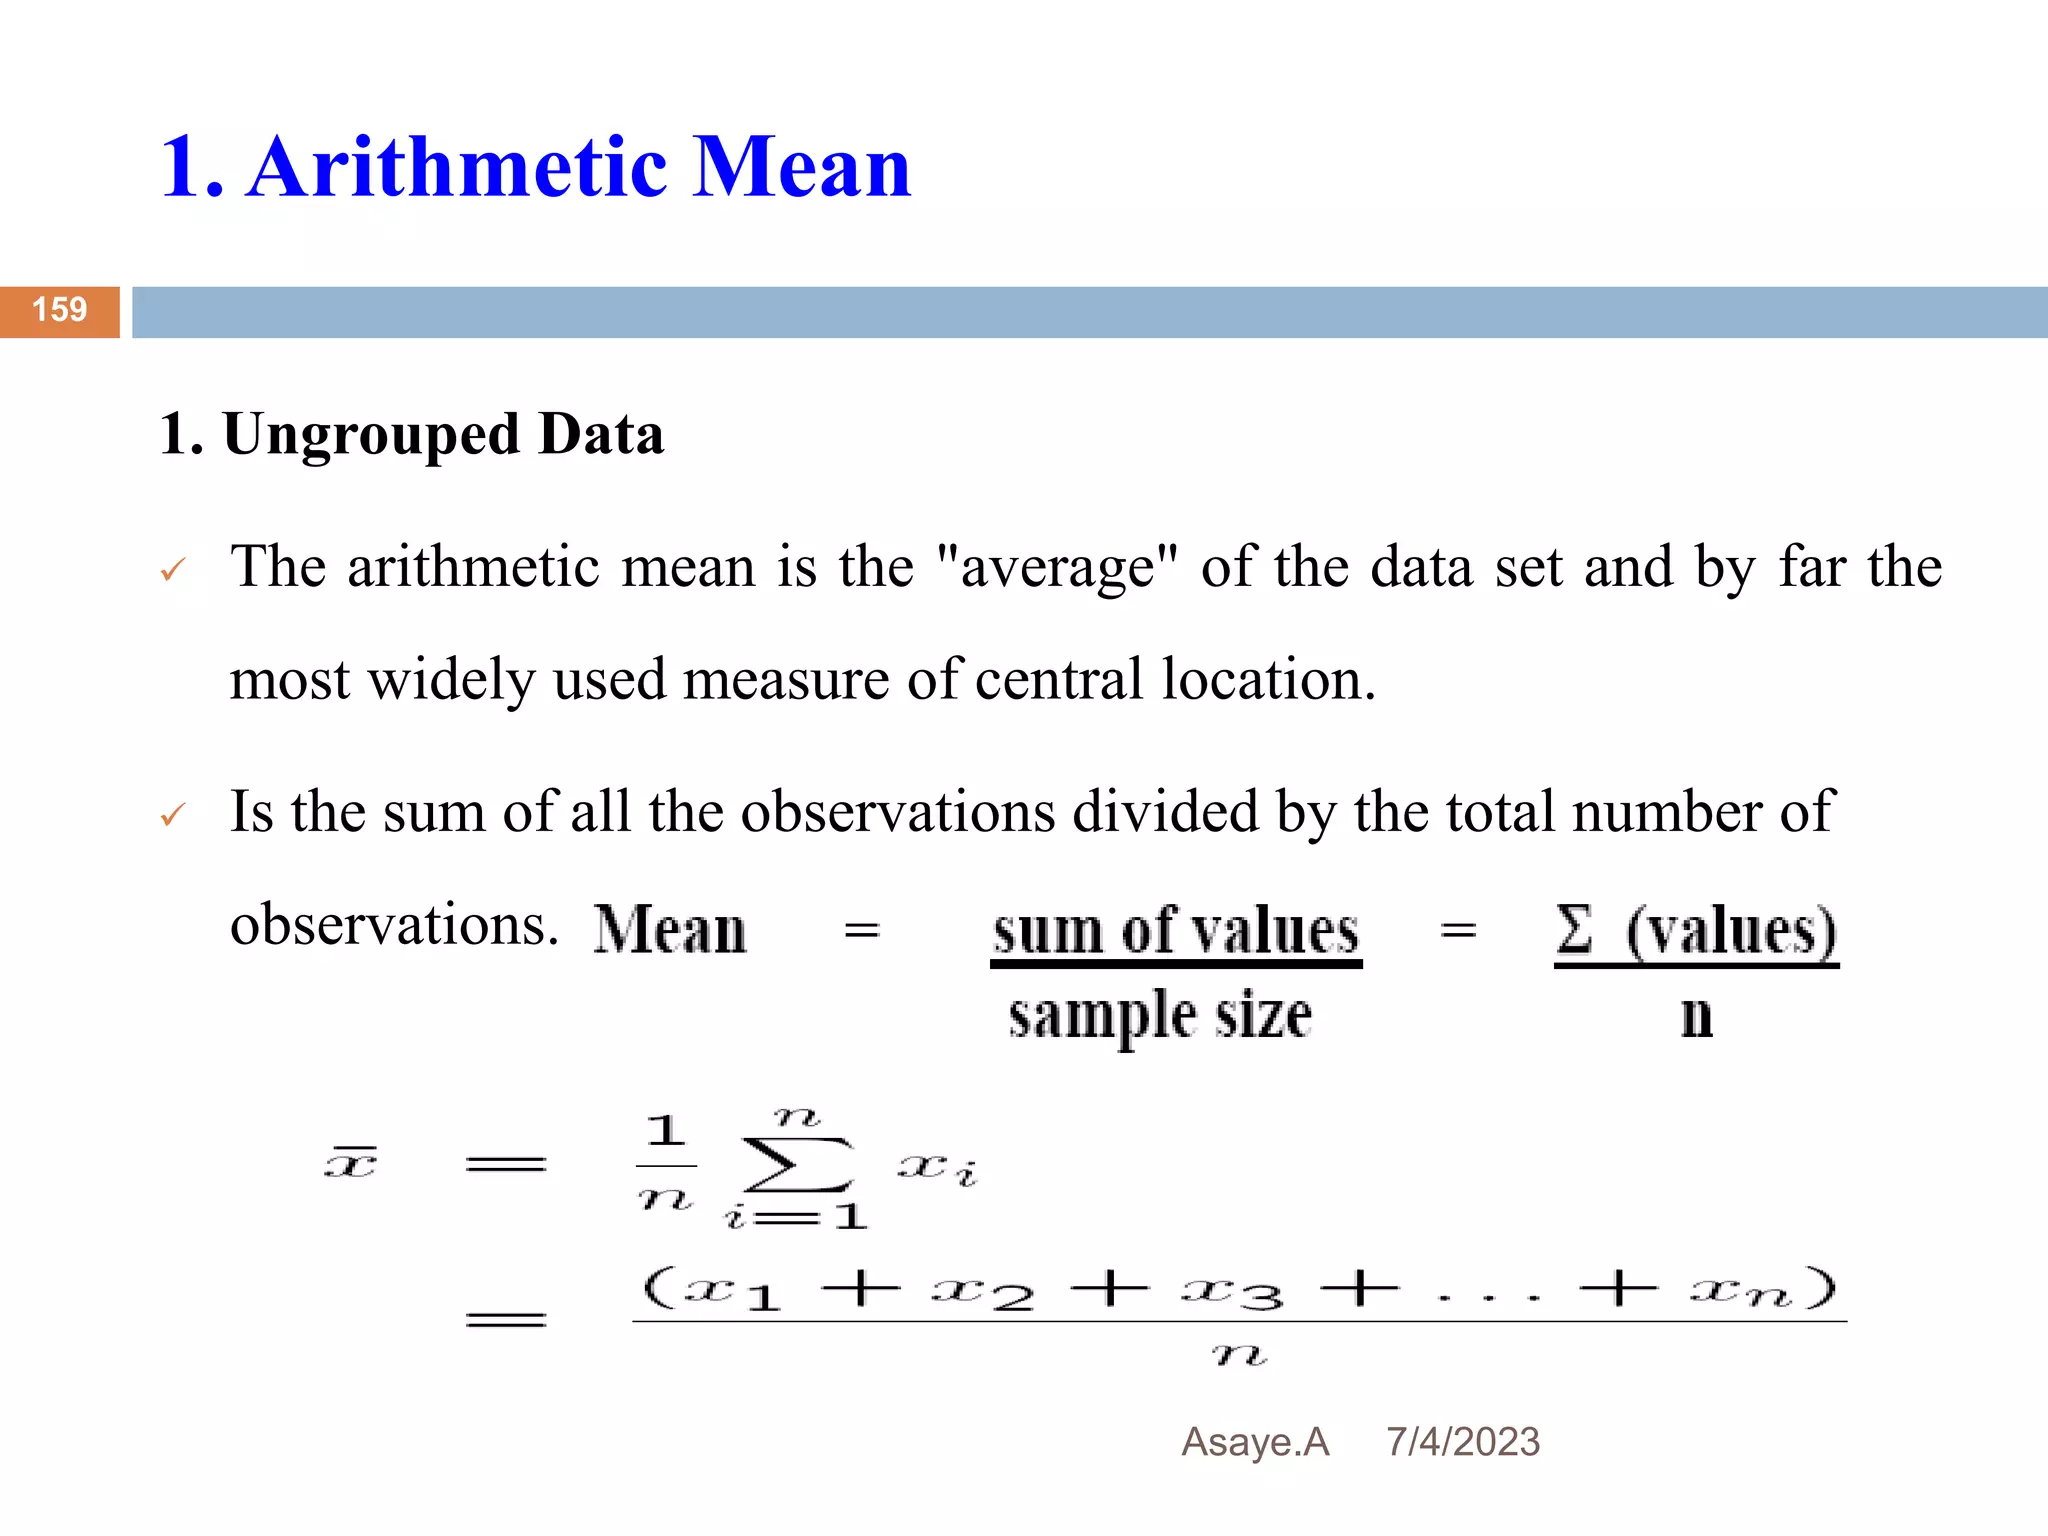
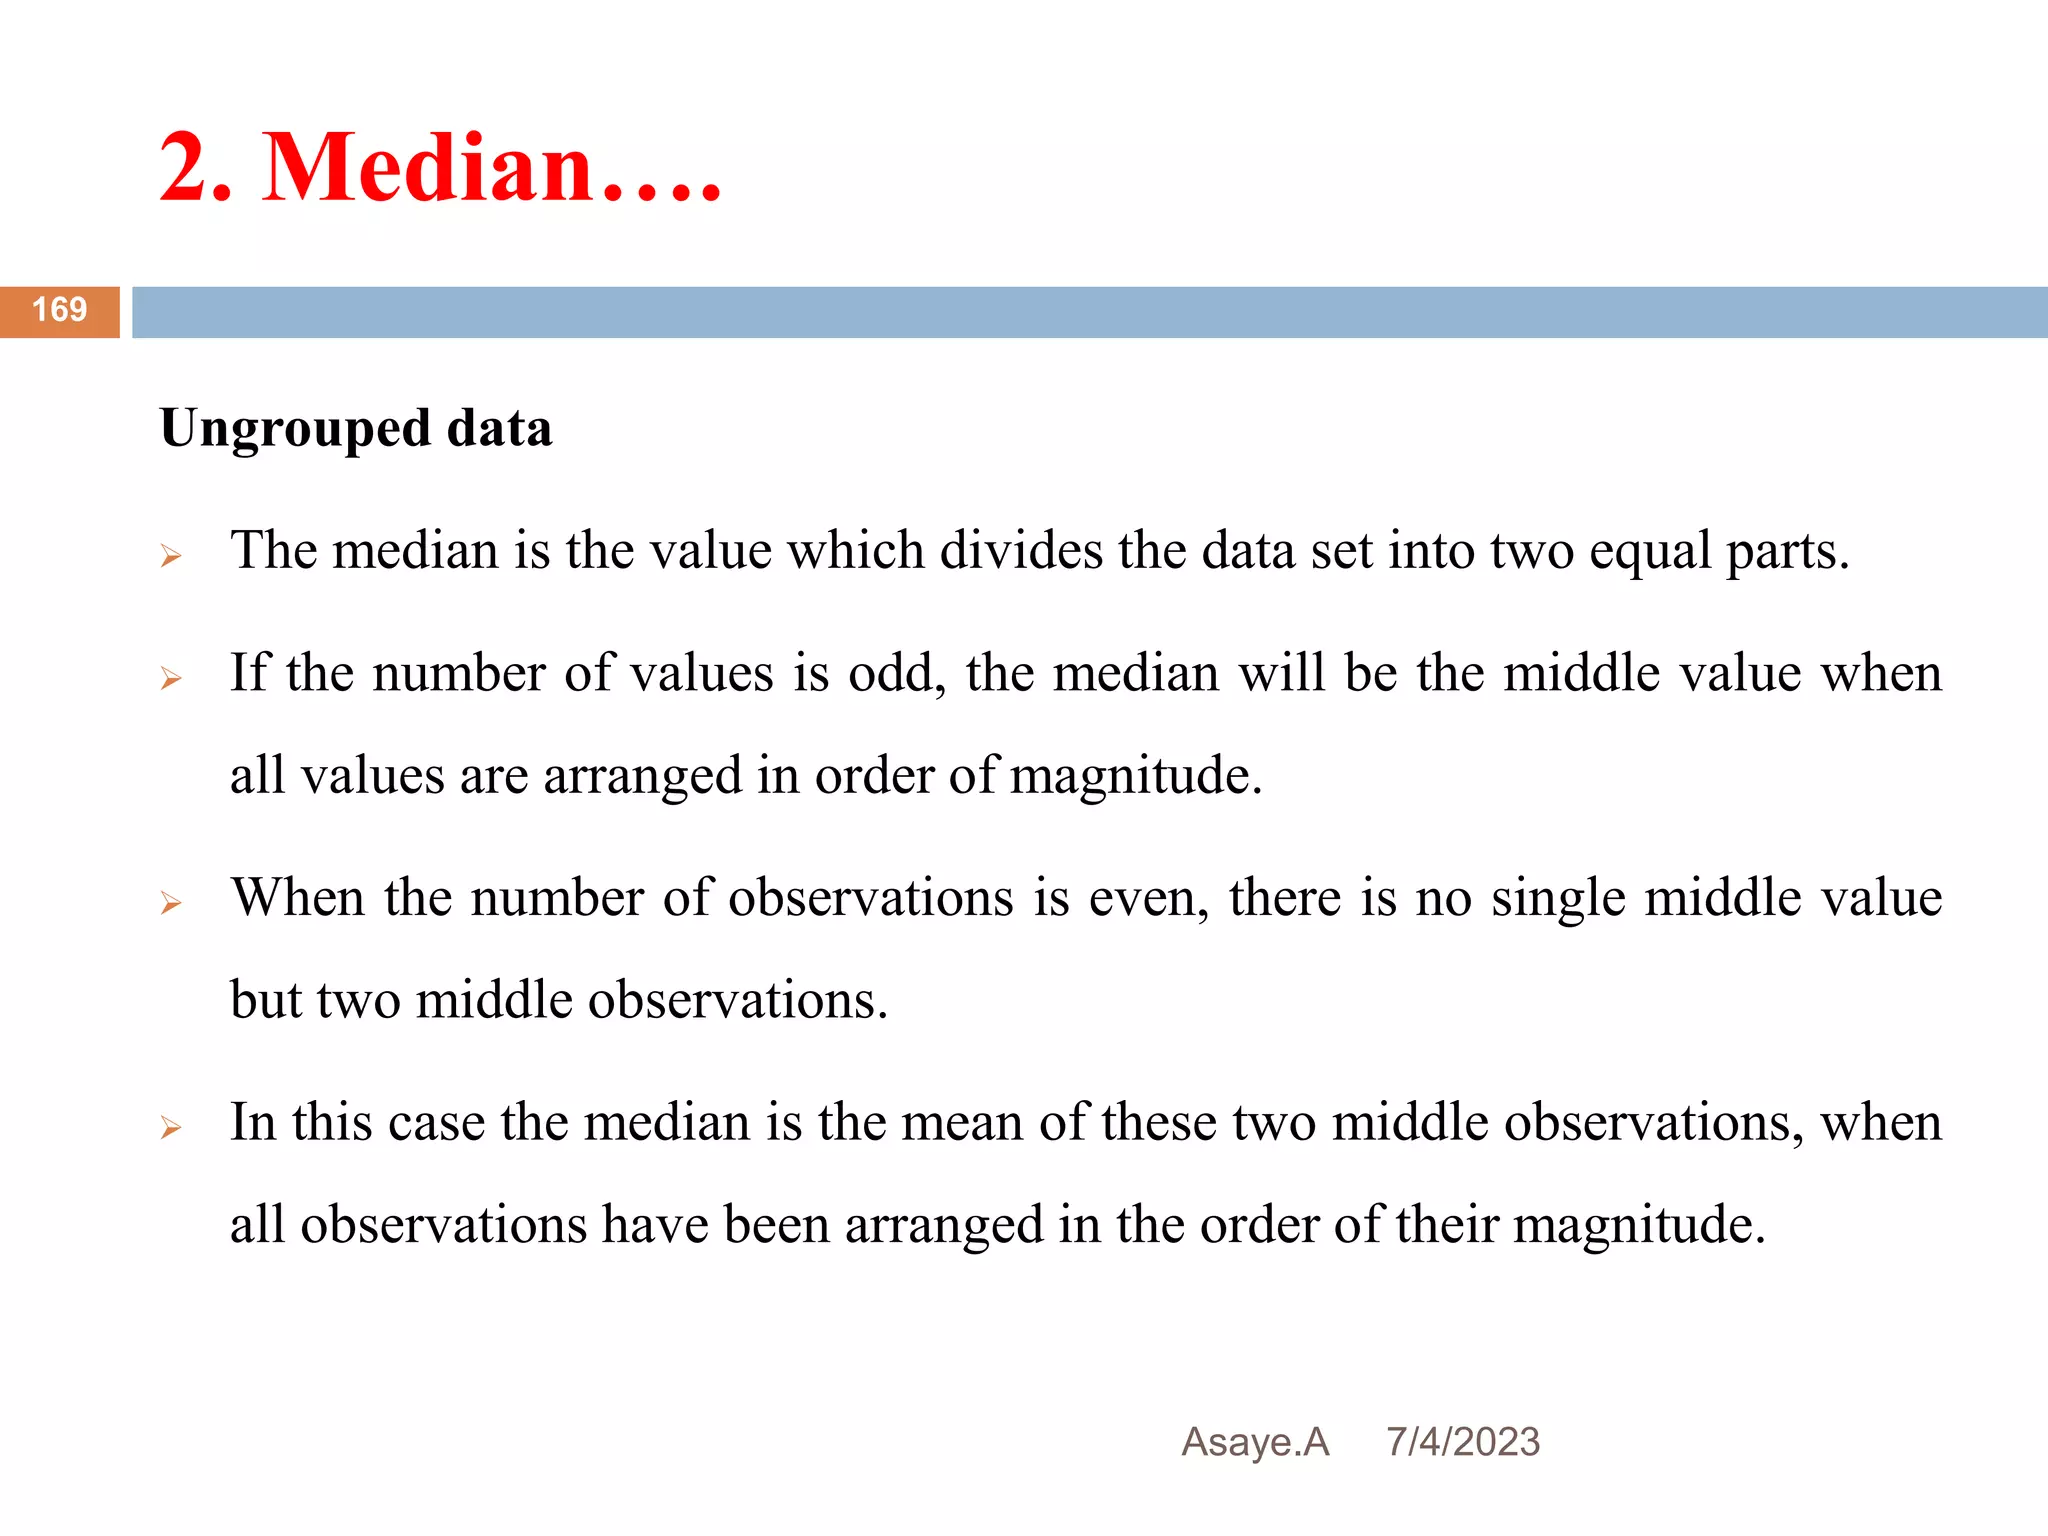
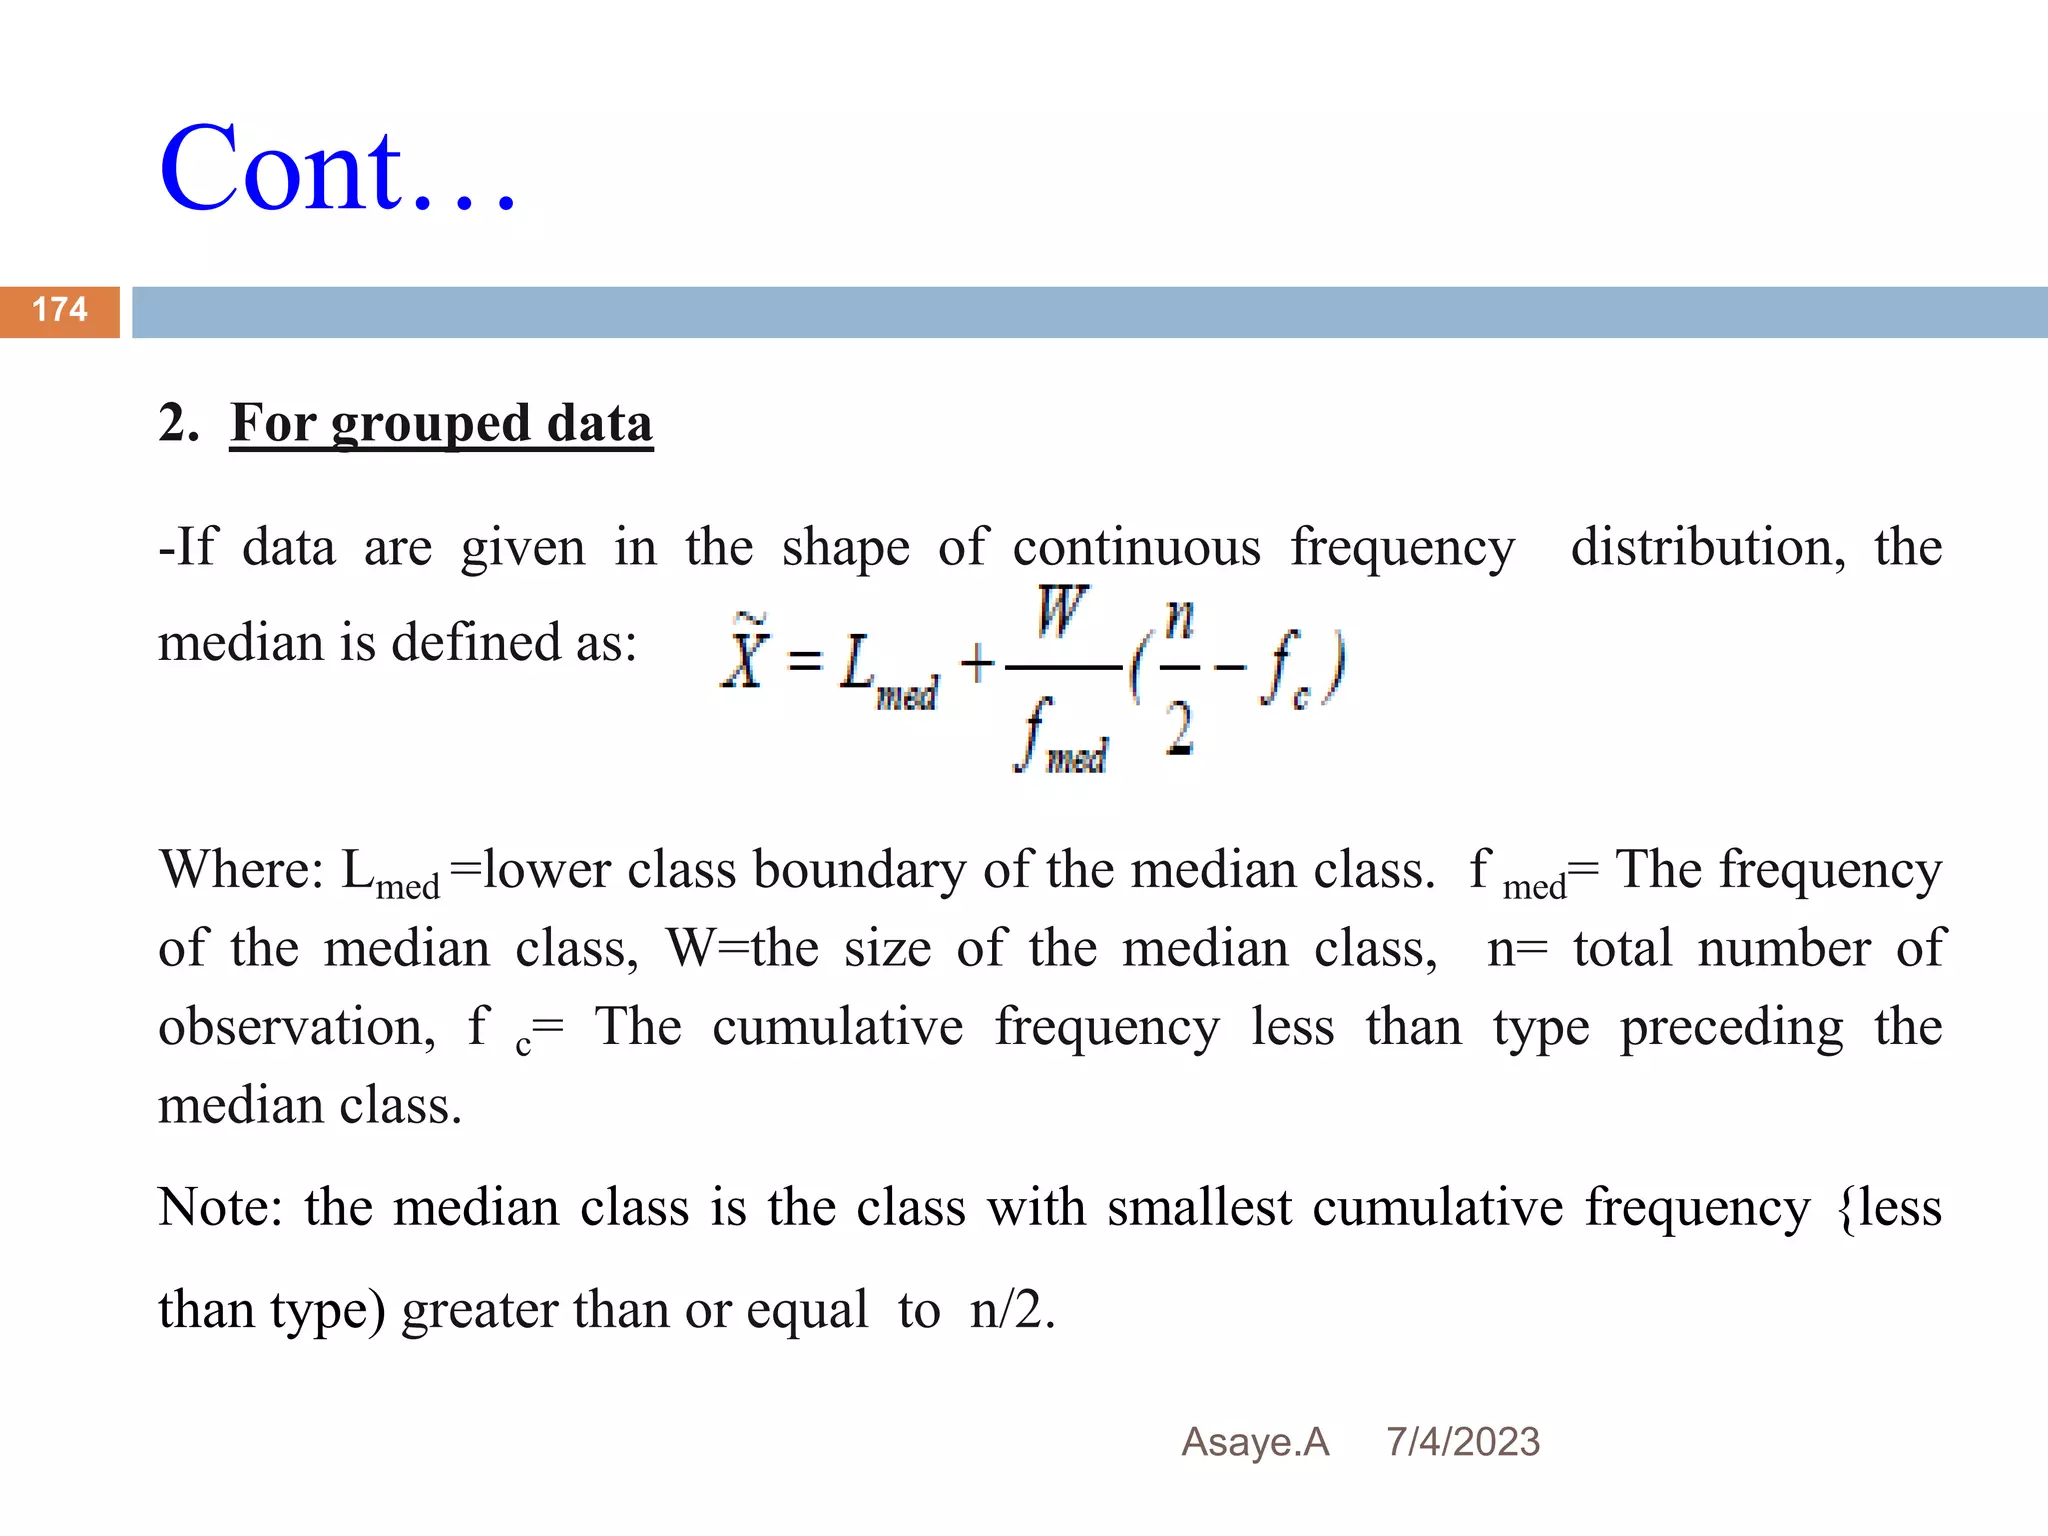
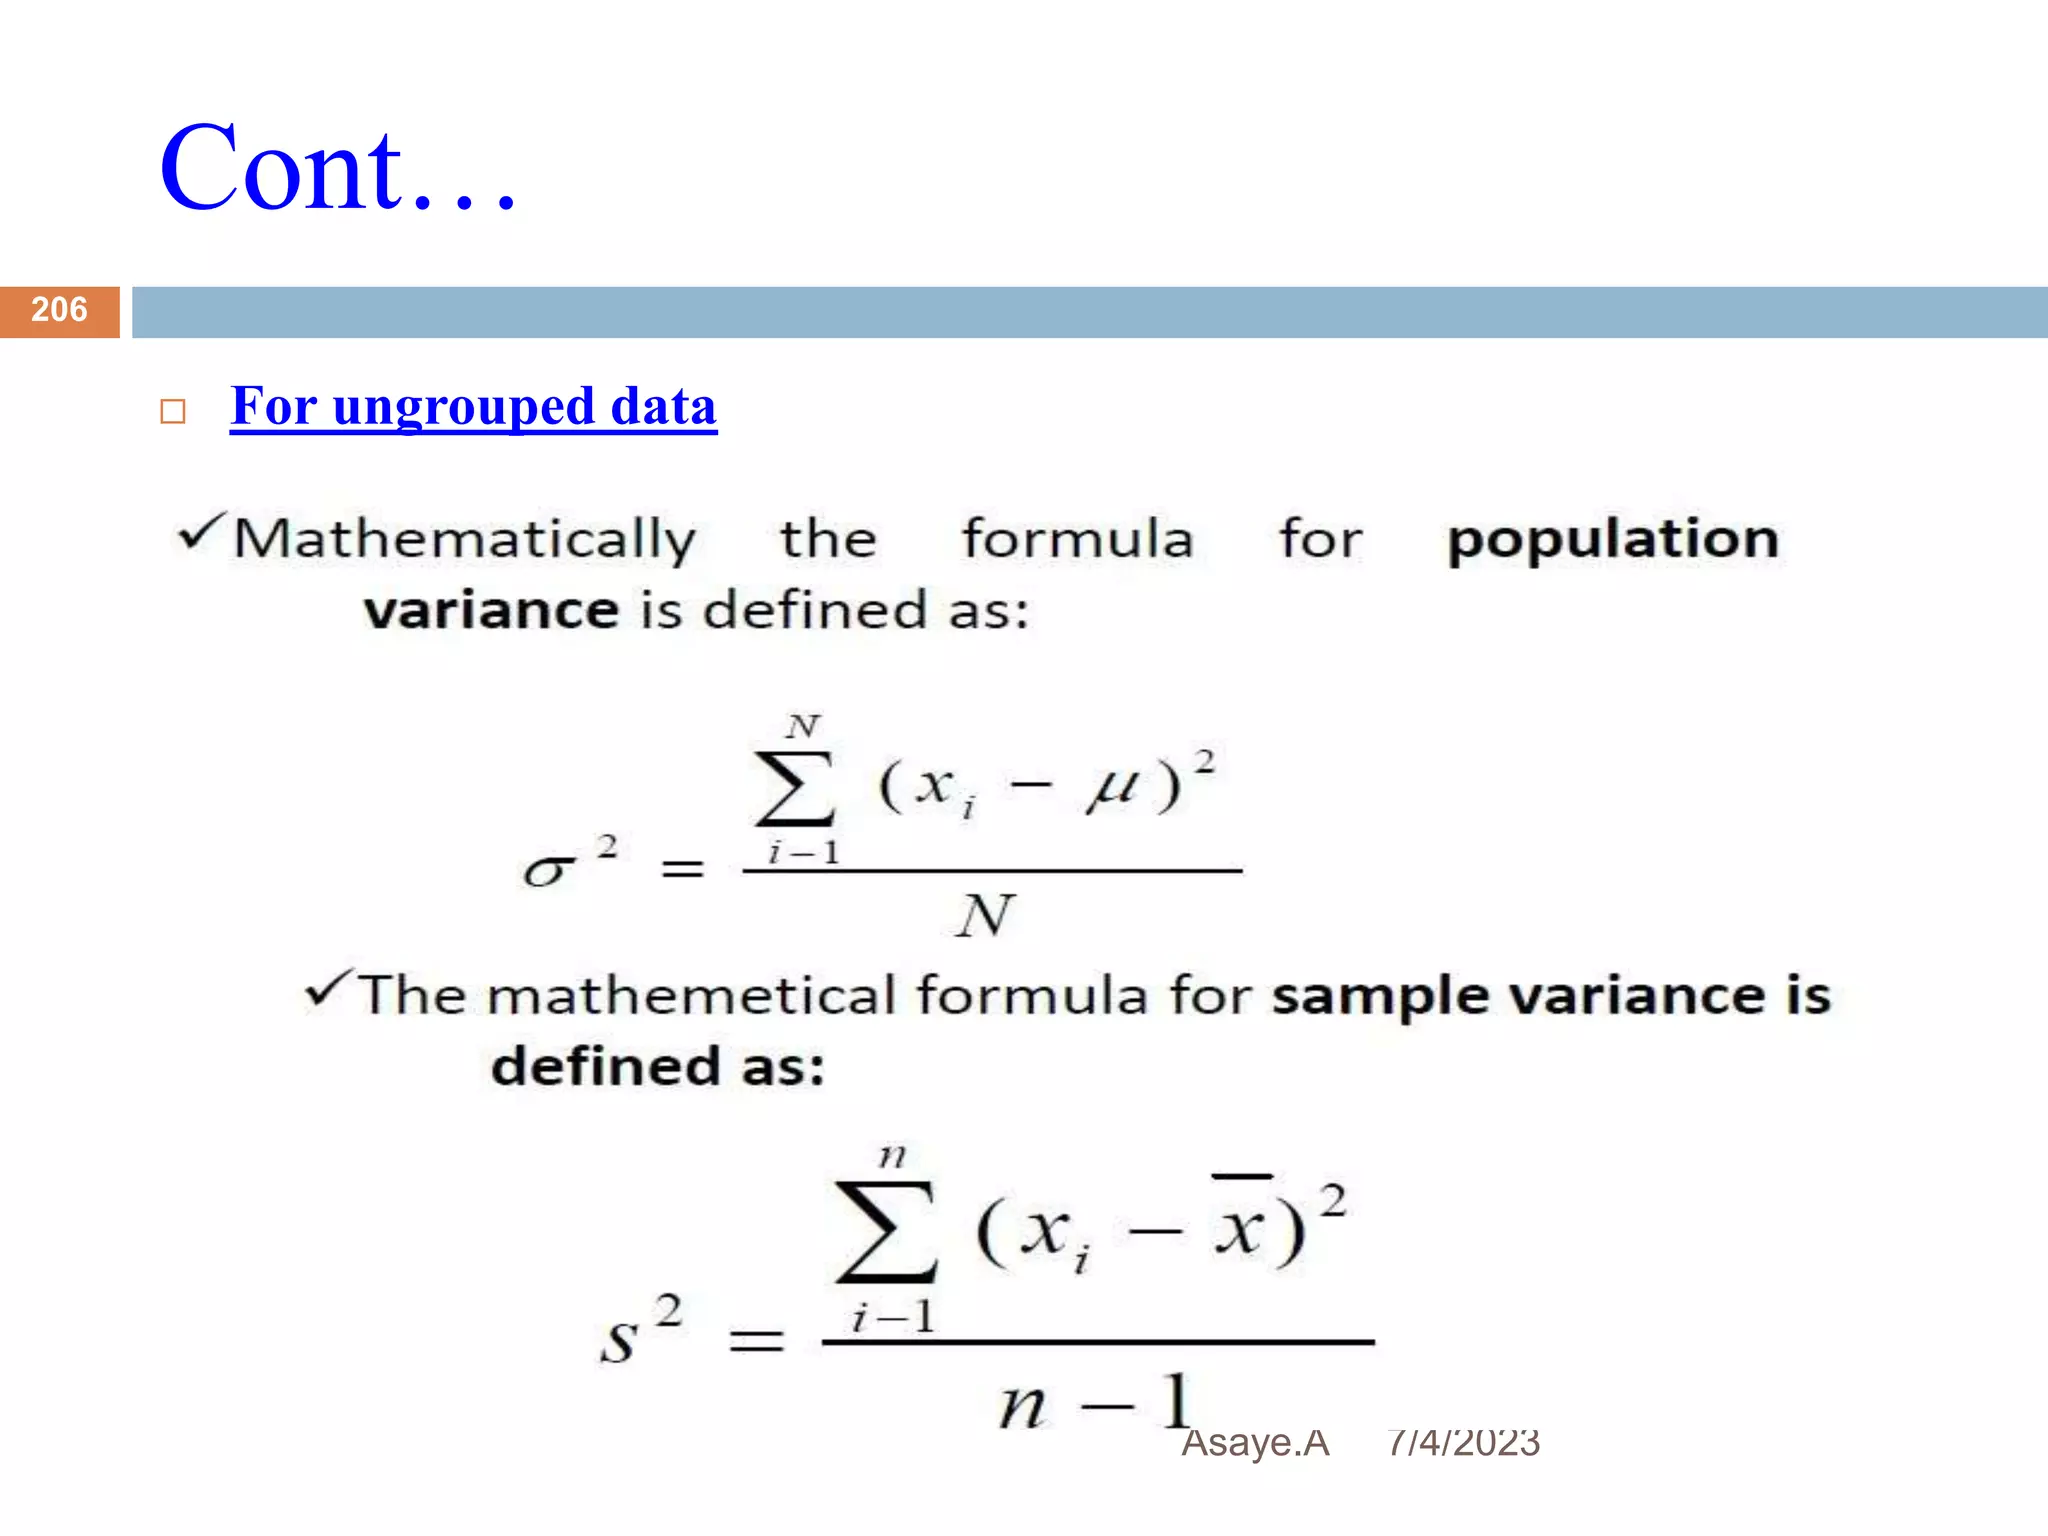
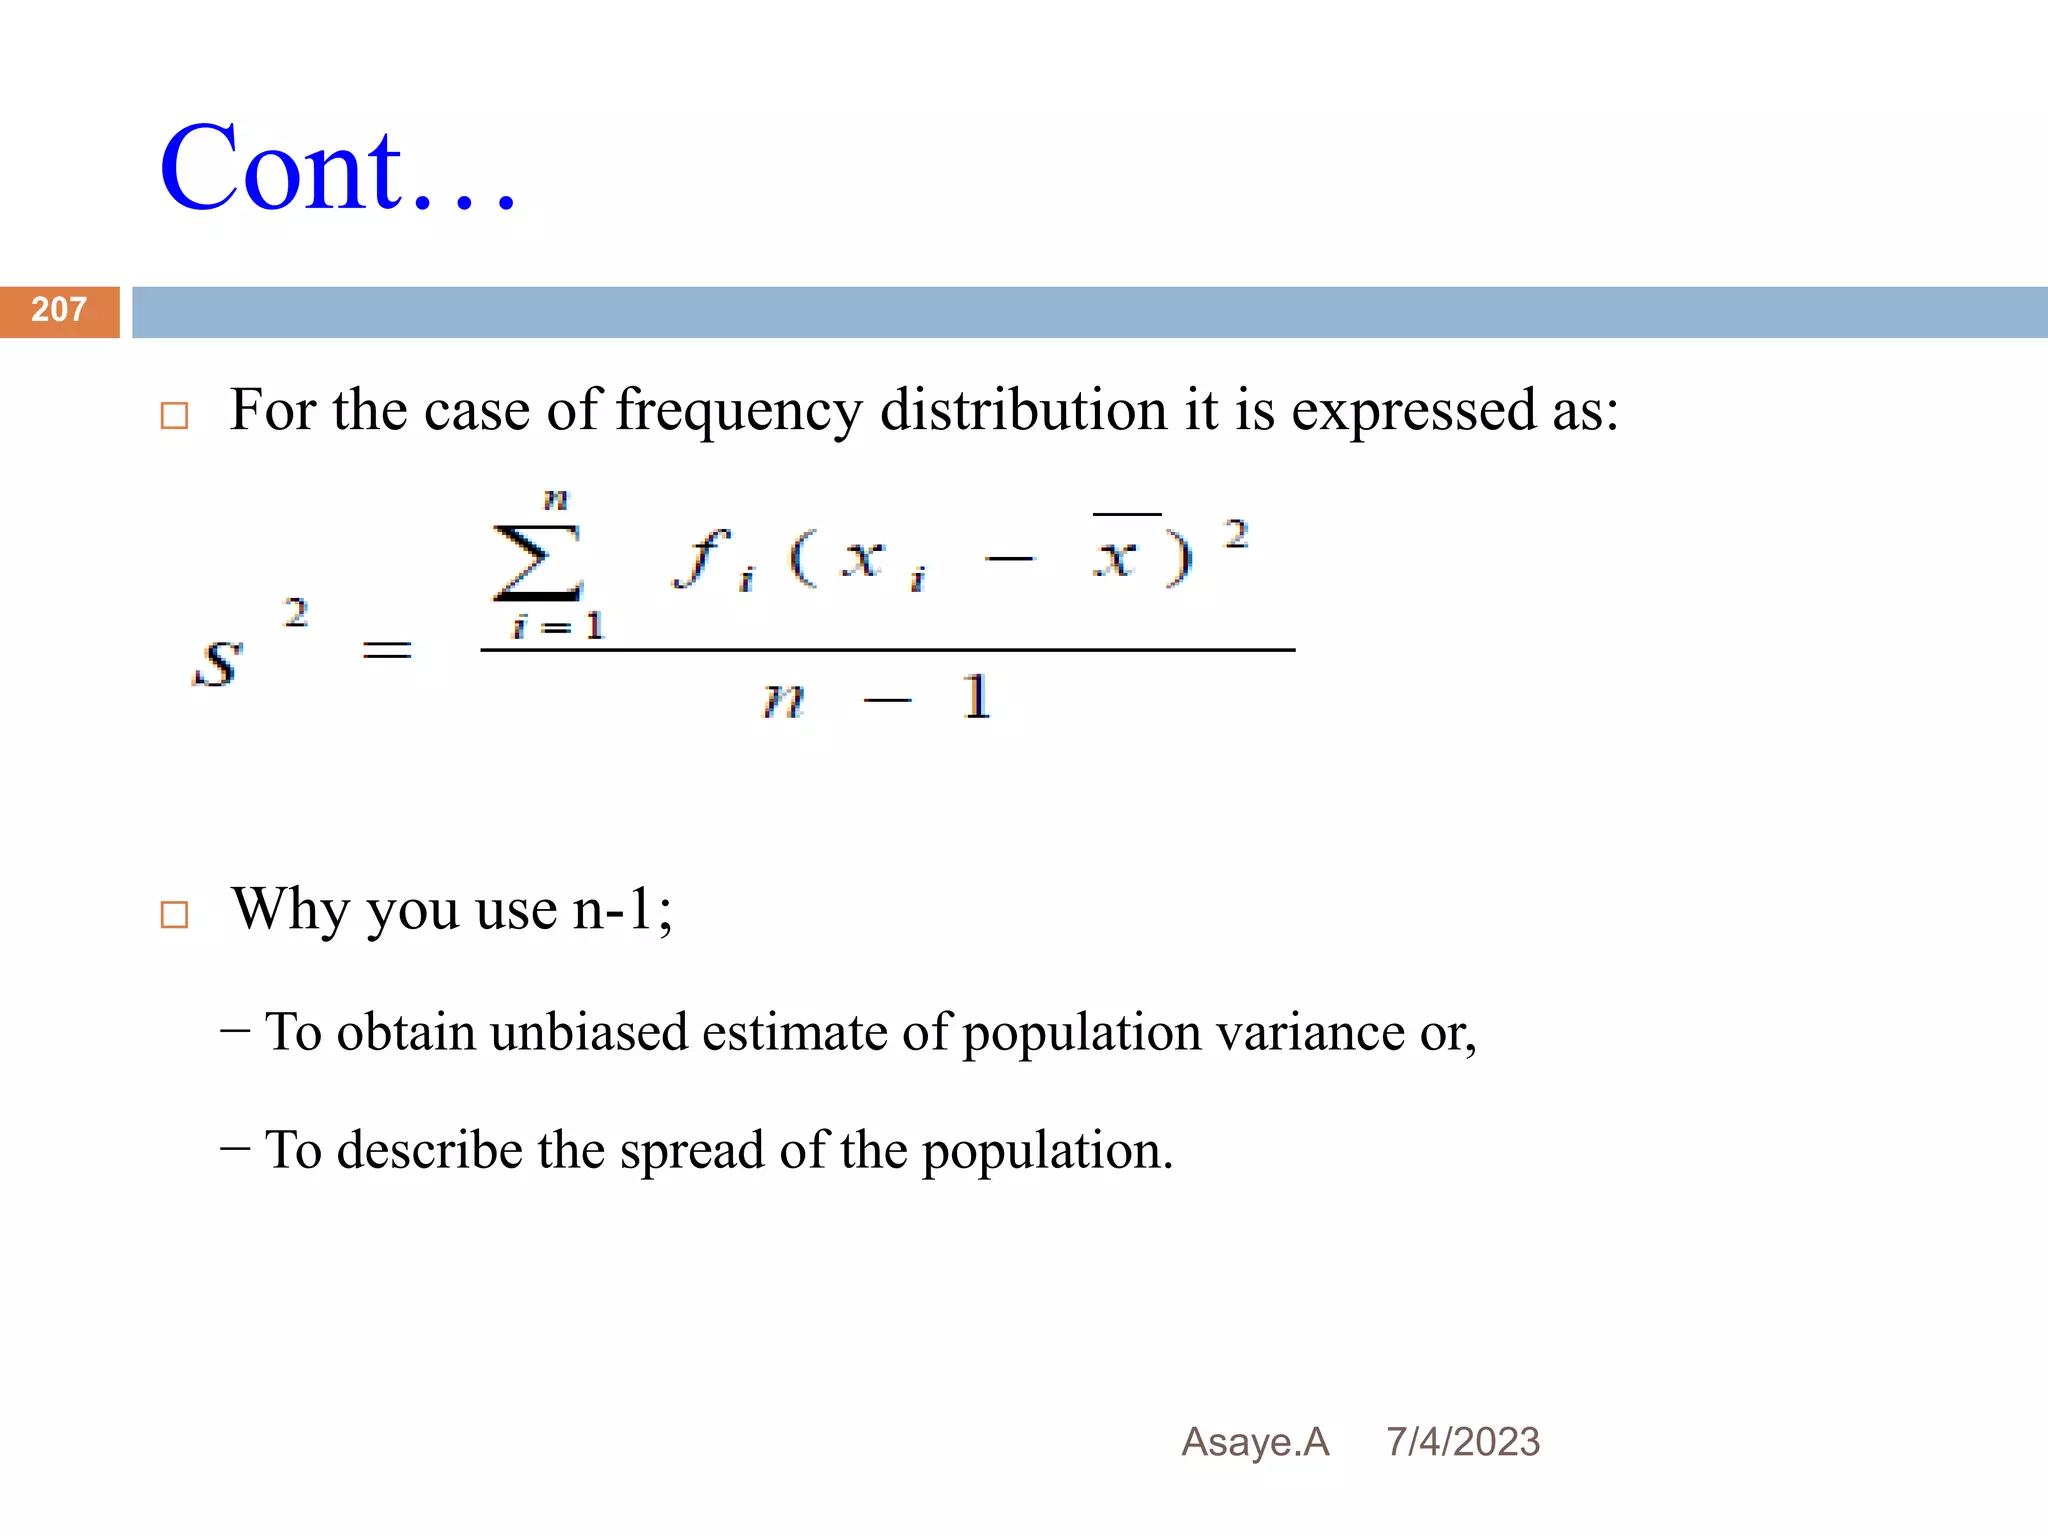
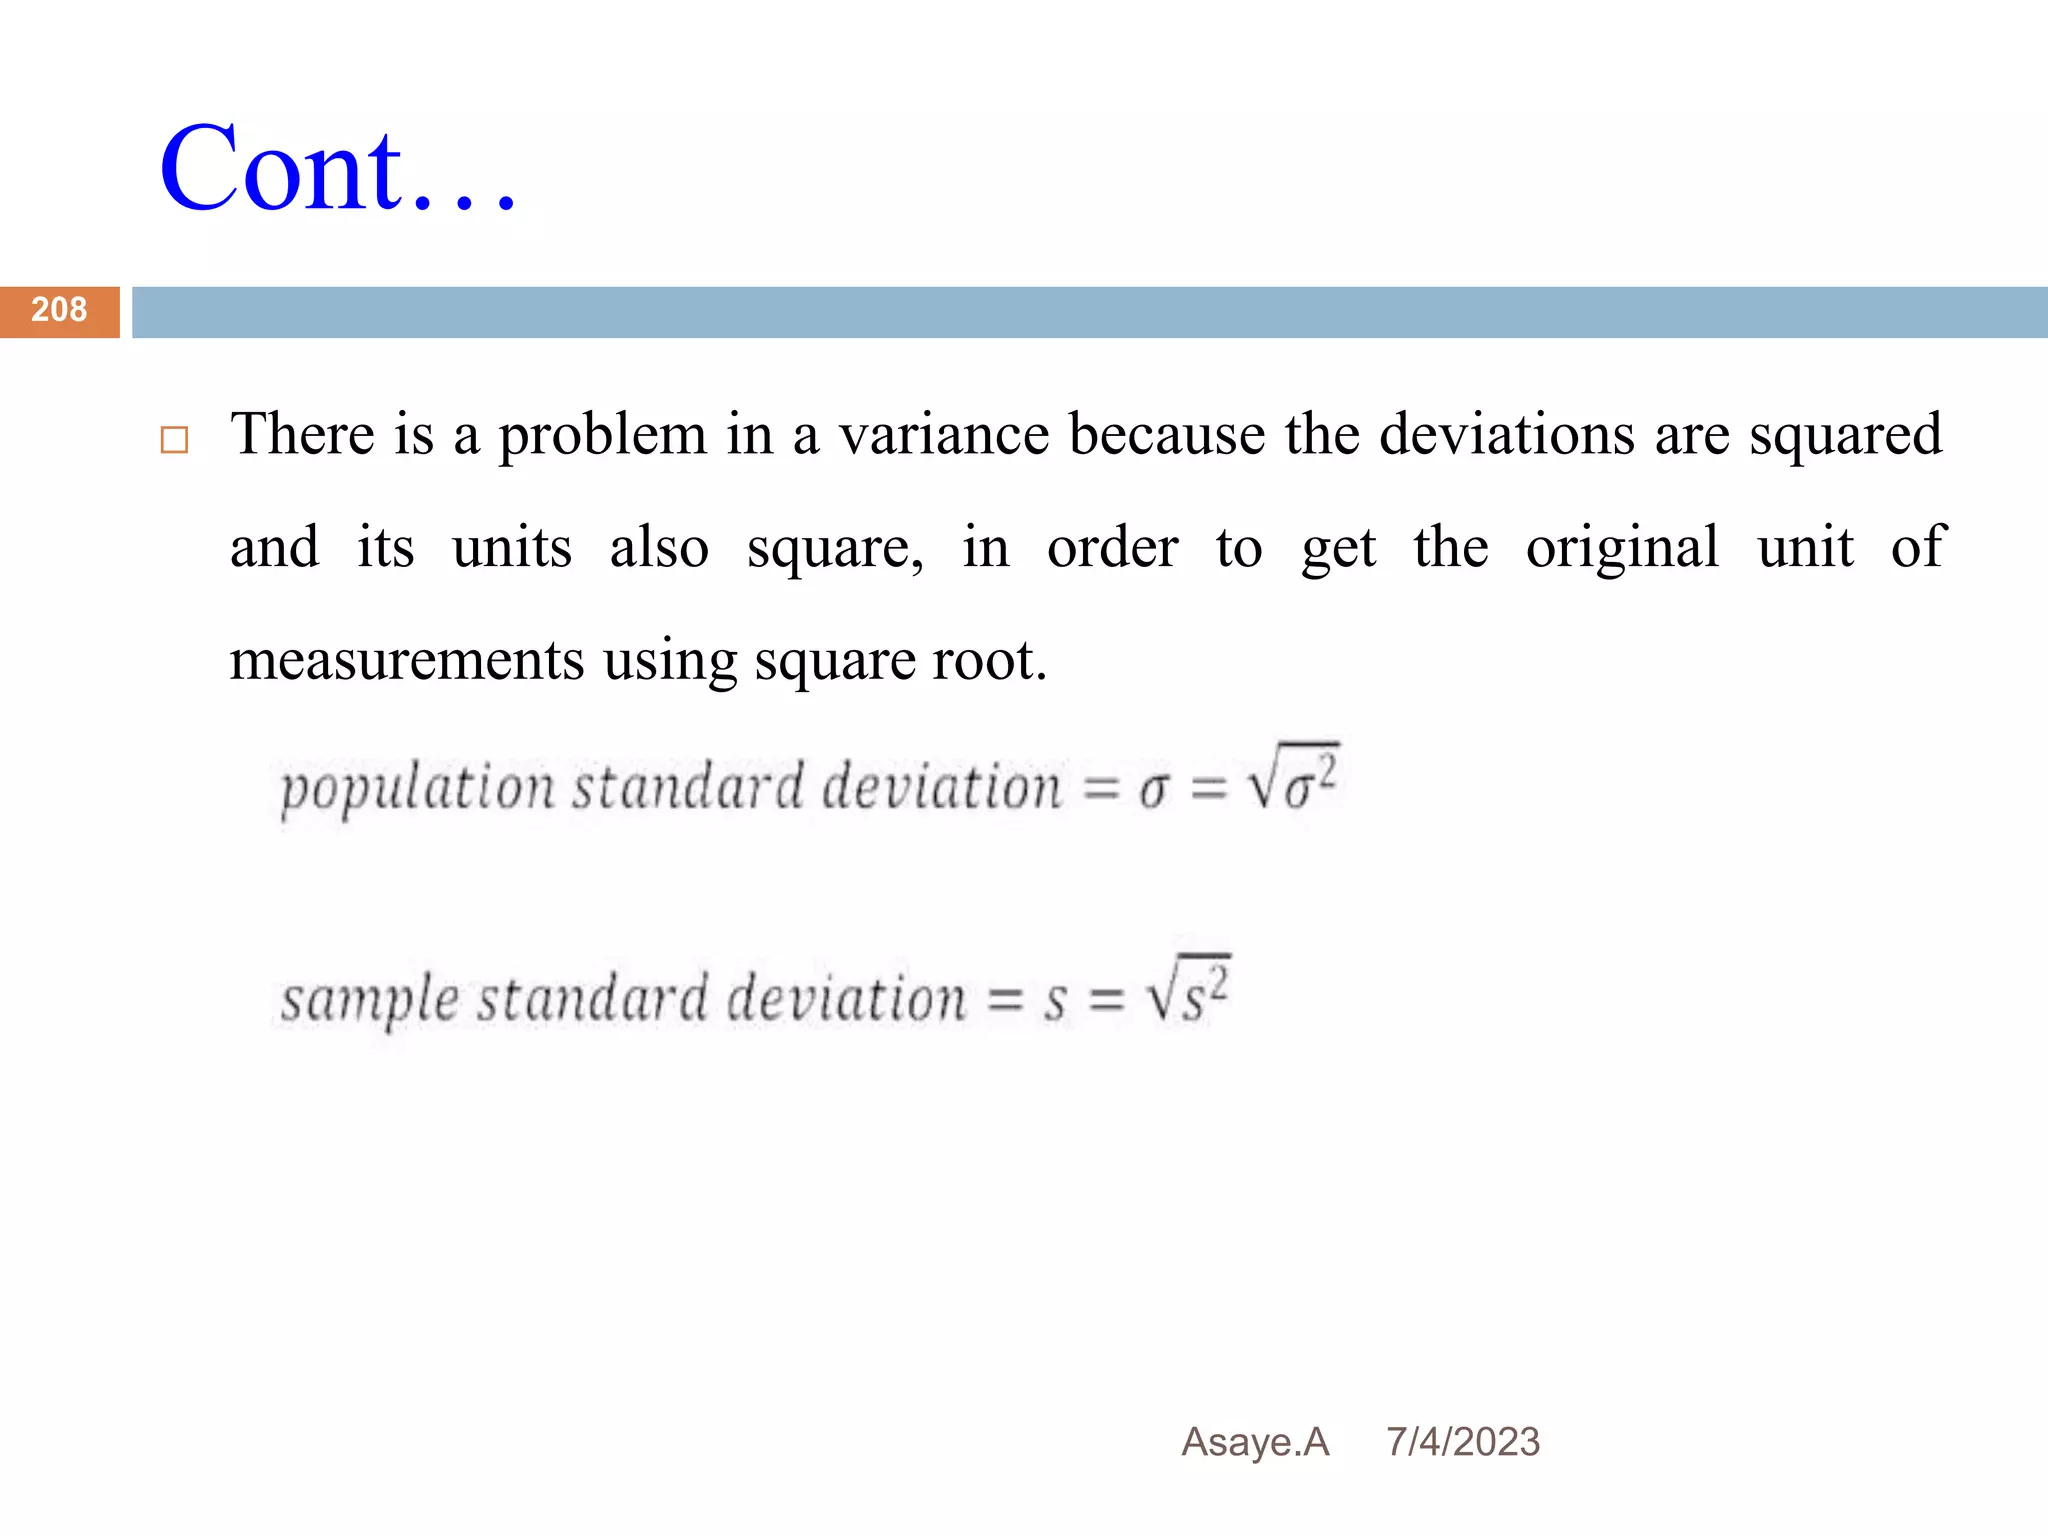
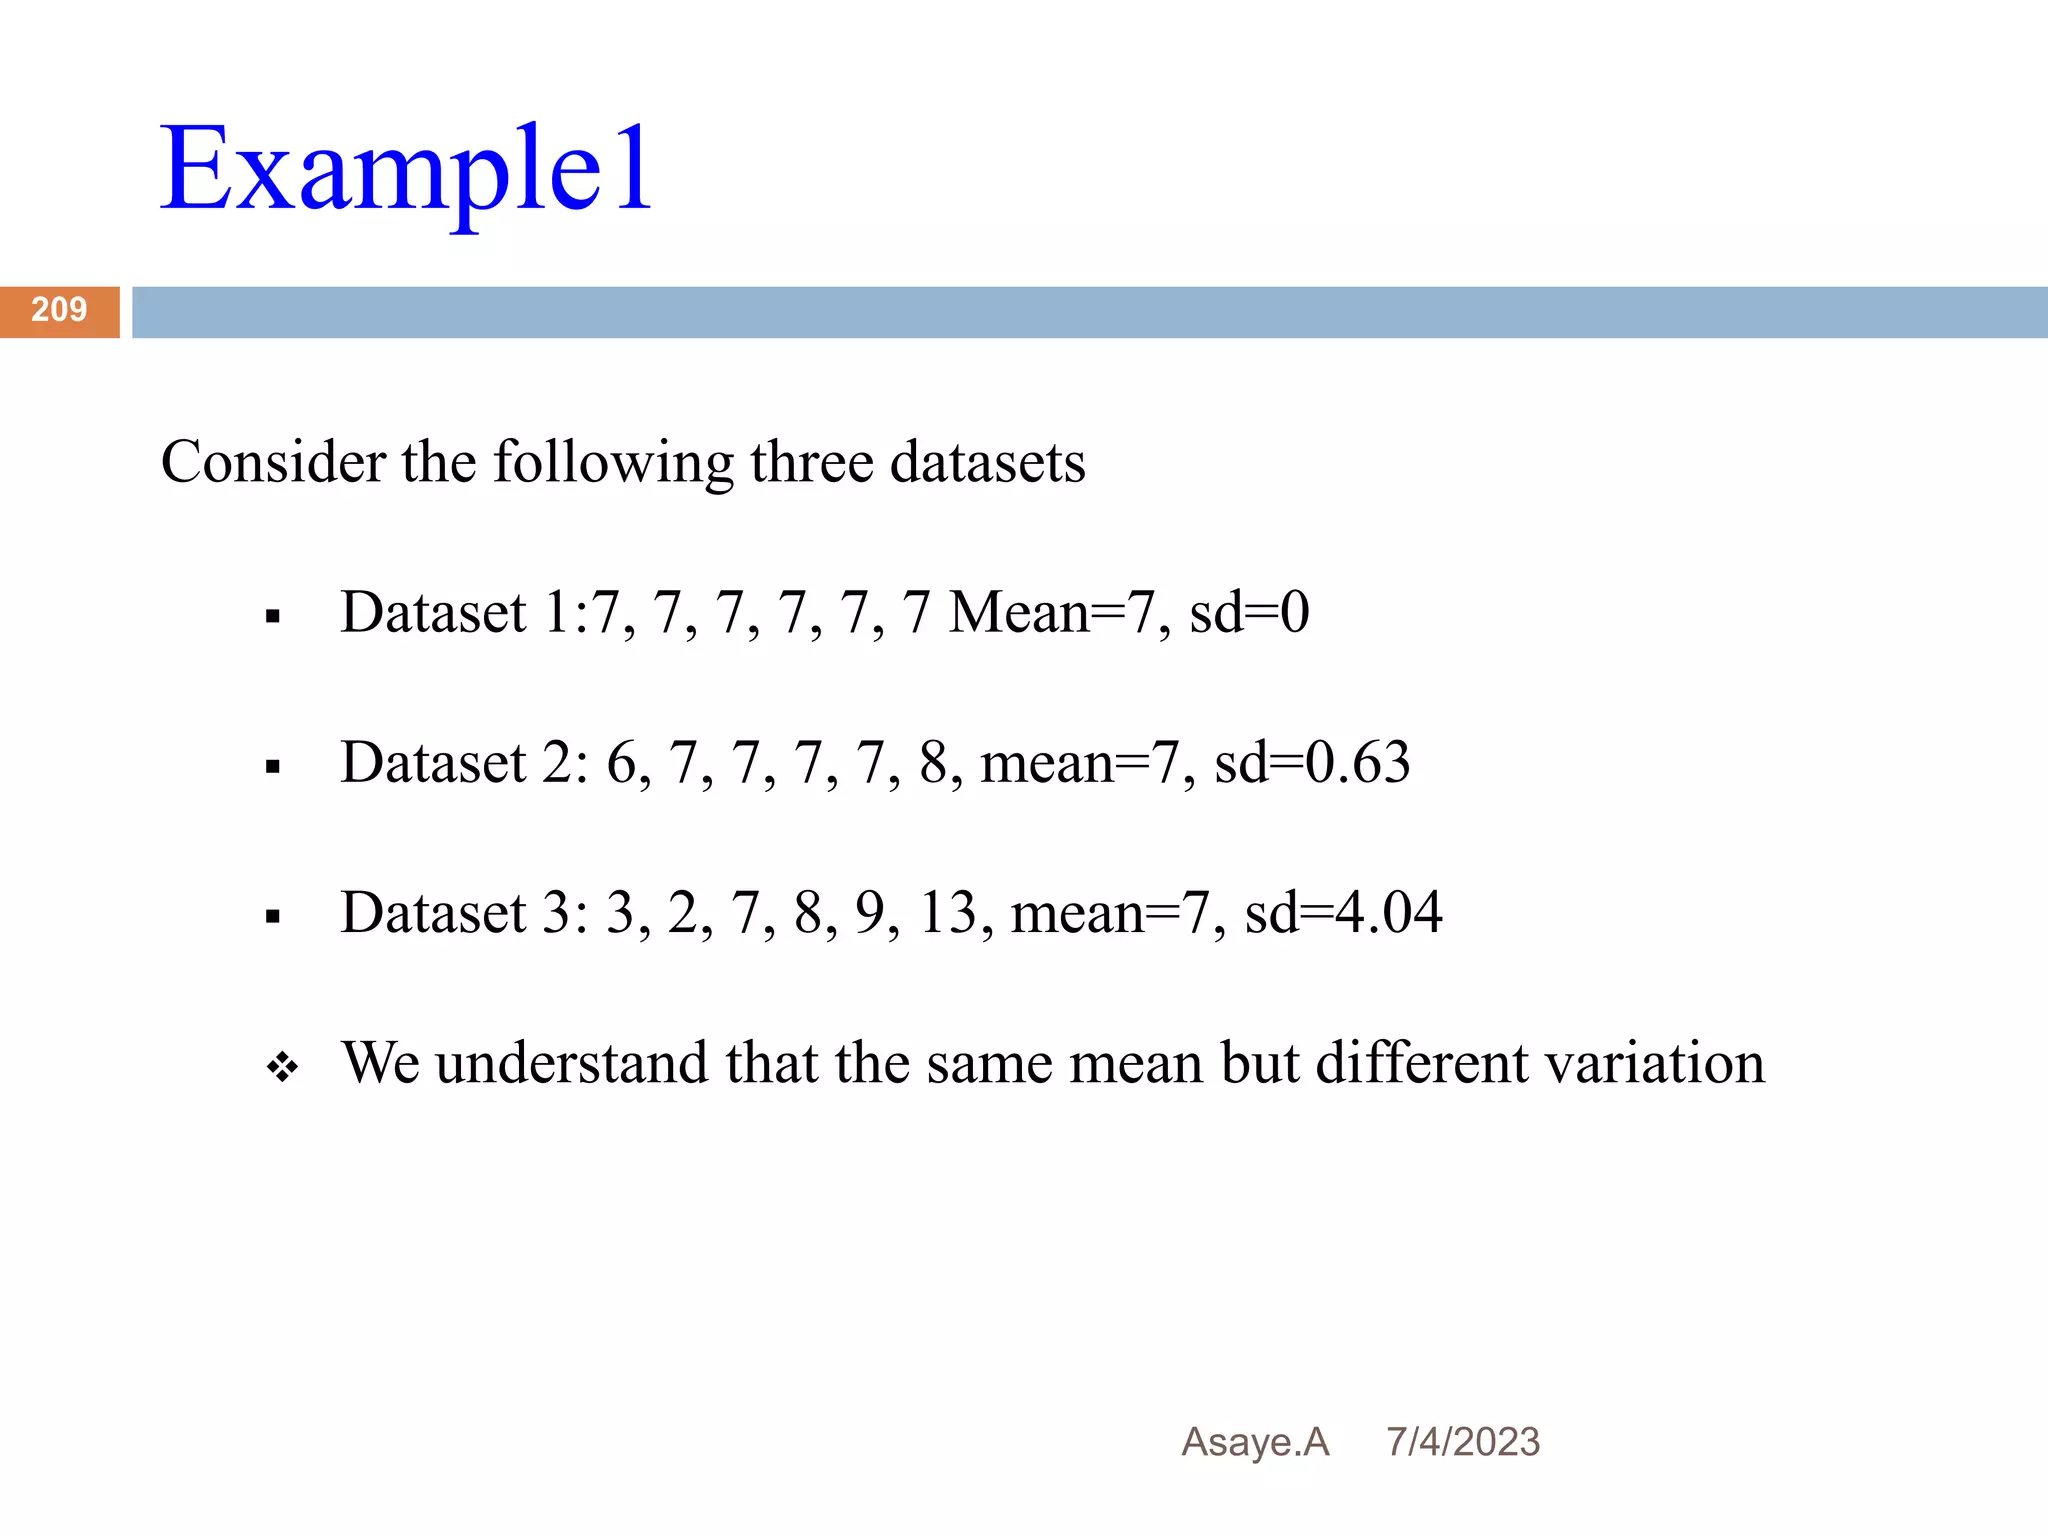
1. For ungrouped data
• If the number of observations is odd, the median is defined as the
[(n+1)/2]th observation.
• If the number of observations is even the median is the average of
the two middle (n/2)th and [(n/2)+1]th values.
• To find the median of a data set:
• Arrange the data in ascending order.
• Find the middle observation of this ordered data.](https://image.slidesharecdn.com/1-230704080511-06dbb713/75/1-intro_biostatistics-pptx-170-2048.jpg)


![ppt1221[1][1].pptx](https://cdn.slidesharecdn.com/ss_thumbnails/ppt122111-230603111304-030afe29-thumbnail.jpg?width=640&height=640&fit=bounds)