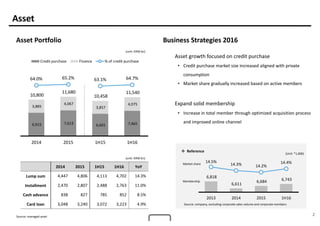
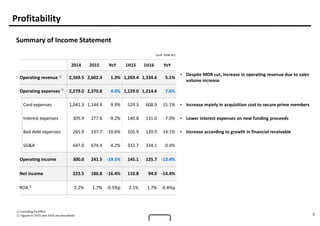
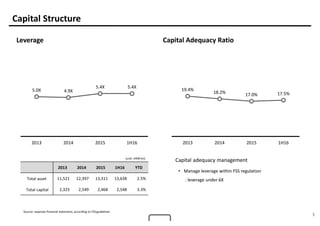
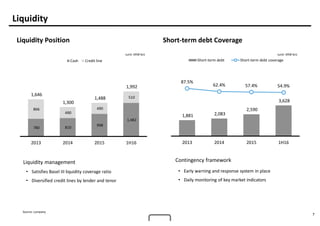
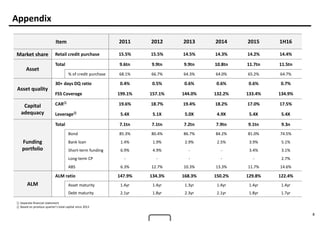
1H16 Earnings Release
Hyundai Card Corporation
1
Disclaimer
These presentation materials have been prepared by Hyundai Card Corporation., Ltd. (“HCC or the Company”), solely for
the use at this presentation. This presentation material may not be reproduced, redistributed or passed on, directly or
indirectly, to any other person or published, in whole or in part, for any purpose.
The Company has not taken measures to independently verify data contained in this material. No representations or warranties, express or
implied, are made as to, and no reliance should be placed on, the accuracy, fairness or completeness of the information presented or contained
in this presentation. This presentation should not be construed as legal, tax, investment or other advice.
Financial statements in this document have been prepared in accordance with K-IFRS. Other additional market information has been sourced
from the Company or from other external institutions. The information presented or contained in this presentation is current as of the date
hereof and is subject to change without notice and its accuracy is not guaranteed.
Certain information and statements made in this presentation contain “forward-looking statements.” Caution should be taken with respect to
such statements and you should not place undue reliance on any such forward-looking statements.
2
Asset
Asset Portfolio Business Strategies 2016
(unit: KRW bn)
2014 2015 1H15 1H16 YoY
Lump sum 4,447 4,806 4,113 4,702 14.3%
Installment 2,470 2,807 2,488 2,763 11.0%
Cash advance 838 827 785 852 8.5%
Card loan 3,048 3,240 3,072 3,223 4.9%
Asset growth focused on credit purchase
• Credit purchase market size increased aligned with private
consumption
• Market share gradually increased based on active members
Expand solid membership
• Increase in total member through optimized acquisition process
and improved online channel
(unit: KRW bn)
6,915 7,613 6,601 7,465
3,885
4,067
3,857
4,075
10,800
11,680
10,458
11,540
64.0% 65.2% 63.1% 64.7%
2014 2015 1H15 1H16
Credit purchase Finance % of credit purchase
 Reference
Source: company, excluding corporate sales volume and corporate members
(Unit: *1,000)
Source: managed asset
6,818
6,611
6,684 6,743
14.5%
14.3% 14.2%
14.4%
2013 2014 2015 1H16
Market share
Membership
3
Profitability
(unit: KRW bn)
① Excluding FX effect
② Figures in 1H15 and 1H16 are annualized
Summary of Income Statement
2014 2015 YoY 1H15 1H16 YoY
Operating revenue 2,569.5 2,602.4 1.3% 1,269.4 1,334.6 5.1%
• Despite MDR cut, increase in operating revenue due to sales
volume increase
Operating expenses 2,279.0 2,370.8 4.0% 1,129.0 1,214.4 7.6%
Card expenses 1,041.3 1,144.4 9.9% 529.3 608.9 15.1% • Increase mainly in acquisition cost to secure prime members
Interest expenses 305.9 277.6 -9.2% 140.8 131.0 -7.0% • Lower interest expenses on new funding proceeds
Bad debt expenses 265.9 237.7 -10.6% 105.9 120.9 14.1% • Increase according to growth in financial receivable
SG&A 647.0 674.4 4.2% 332.7 334.1 0.4%
Operating income 300.0 241.5 -19.5% 145.1 125.7 -13.4%
Net income 223.5 186.8 -16.4% 110.8 94.9 -14.4%
ROA 2.2% 1.7% -0.5%p 2.1% 1.7% -0.4%p
①
①
②
4
Asset Quality
Delinquency Reserve
0.6% 0.6% 0.6%
0.7%
0.8%
0.9%
0.8% 0.8%
2013 2014 2015 1H16
30+ days delinquency ratio
30+ days delinquency ratio including re-aged loan
① (Allowance + Reserve) / FSS requirement
205 236 255 267
389 413 367 354
594
649 622 621
144%
132% 133% 135%
2013 2014 2015 1H16
Allowance Reserve FSS requirement coverage
(unit: KRW bn)
Asset quality management strategies
• Focus more on lower-risk card loan
• Conservative underwriting policy based on in-house modeling
Reserve policy
• Max of expected loss, incurred loss or FSS requirement
①
Capital adequacy management
• Manage leverage within FSS regulation
: leverage under 6X
5
Capital Structure
Leverage
Source: separate financial statement, according to FSS guidelines
2013 2014 2015 1H16 YTD
Total asset 11,521 12,397 13,311 13,638 2.5%
Total capital 2,325 2,549 2,468 2,548 3.3%
(unit: KRW bn)
Capital Adequacy Ratio
5.0X 4.9X
5.4X 5.4X
2013 2014 2015 1H16
19.4%
18.2% 17.0% 17.5%
2013 2014 2015 1H16
6
Funding
Funding Position Maturity
Funding guidelines
• By product: ABS <20%, Short-term funding <10%
• ALM ratio: 100% or more
77.2%
6.4%
8.2%
5.1%
3.1%
Bond and others Domestic ABS Overseas ABS
Bank loan Short-term funding
2.3yr
2.1yr
1.8yr 1.7yr
168.3%
150.2%
129.8% 122.4%
2013 2014 2015 1H16
Debt maturity ALM ratio
KRW 9.3tn
Source: company
Portfolio diversification
• Stable portfolio through diversification in maturity, product and
currency
7
Liquidity
Liquidity Position Short-term debt Coverage
Contingency framework
• Early warning and response system in place
• Daily monitoring of key market indicators
(unit: KRW bn) (unit: KRW bn)
Liquidity management
• Satisfies Basel III liquidity coverage ratio
• Diversified credit lines by lender and tenor
780 810
998
1,482
866
490
490
510
1,646
1,300
1,488
1,992
2013 2014 2015 1H16
Cash Credit line
1,881 2,083
2,590
3,628
87.5%
62.4% 57.4% 54.9%
2013 2014 2015 1H16
Short-term debt Short-term debt coverage
Source: company
8
Appendix
Item 2011 2012 2013 2014 2015 1H16
Market share Retail credit purchase 15.5% 15.5% 14.5% 14.3% 14.2% 14.4%
Asset
Total 9.6tn 9.9tn 9.9tn 10.8tn 11.7tn 11.5tn
% of credit purchase 68.1% 66.7% 64.3% 64.0% 65.2% 64.7%
Asset quality
30+ days DQ ratio 0.4% 0.5% 0.6% 0.6% 0.6% 0.7%
FSS Coverage 199.1% 157.1% 144.0% 132.2% 133.4% 134.9%
Capital
adequacy
CAR①
19.6% 18.7% 19.4% 18.2% 17.0% 17.5%
Leverage②
5.4X 5.1X 5.0X 4.9X 5.4X 5.4X
Funding
portfolio
Total 7.1tn 7.1tn 7.2tn 7.9tn 9.1tn 9.3n
Bond 85.3% 80.4% 86.7% 84.2% 81.0% 74.5%
Bank loan 1.4% 1.9% 2.9% 2.5% 3.9% 5.1%
Short-term funding 6.9% 4.9% - - 3.4% 3.1%
Long-term CP - - - - - 2.7%
ABS 6.3% 12.7% 10.3% 13.3% 11.7% 14.6%
ALM
ALM ratio 147.9% 134.3% 168.3% 150.2% 129.8% 122.4%
Asset maturity 1.4yr 1.4yr 1.3yr 1.4yr 1.4yr 1.4yr
Debt maturity 2.1yr 1.8yr 2.3yr 2.1yr 1.8yr 1.7yr
① Separate financial statement
② Based on previous quarter’s total capital since 2013
Further Information
IR Homepage: http://ir.hyundaicard.com
IR email address: irhcc@hyundaicard.com

현대카드 Ir 자료 (2016 2 q) jp

  • 1.
  • 2.
    1 Disclaimer These presentation materialshave been prepared by Hyundai Card Corporation., Ltd. (“HCC or the Company”), solely for the use at this presentation. This presentation material may not be reproduced, redistributed or passed on, directly or indirectly, to any other person or published, in whole or in part, for any purpose. The Company has not taken measures to independently verify data contained in this material. No representations or warranties, express or implied, are made as to, and no reliance should be placed on, the accuracy, fairness or completeness of the information presented or contained in this presentation. This presentation should not be construed as legal, tax, investment or other advice. Financial statements in this document have been prepared in accordance with K-IFRS. Other additional market information has been sourced from the Company or from other external institutions. The information presented or contained in this presentation is current as of the date hereof and is subject to change without notice and its accuracy is not guaranteed. Certain information and statements made in this presentation contain “forward-looking statements.” Caution should be taken with respect to such statements and you should not place undue reliance on any such forward-looking statements.
  • 3.
    2 Asset Asset Portfolio BusinessStrategies 2016 (unit: KRW bn) 2014 2015 1H15 1H16 YoY Lump sum 4,447 4,806 4,113 4,702 14.3% Installment 2,470 2,807 2,488 2,763 11.0% Cash advance 838 827 785 852 8.5% Card loan 3,048 3,240 3,072 3,223 4.9% Asset growth focused on credit purchase • Credit purchase market size increased aligned with private consumption • Market share gradually increased based on active members Expand solid membership • Increase in total member through optimized acquisition process and improved online channel (unit: KRW bn) 6,915 7,613 6,601 7,465 3,885 4,067 3,857 4,075 10,800 11,680 10,458 11,540 64.0% 65.2% 63.1% 64.7% 2014 2015 1H15 1H16 Credit purchase Finance % of credit purchase  Reference Source: company, excluding corporate sales volume and corporate members (Unit: *1,000) Source: managed asset 6,818 6,611 6,684 6,743 14.5% 14.3% 14.2% 14.4% 2013 2014 2015 1H16 Market share Membership
  • 4.
    3 Profitability (unit: KRW bn) ①Excluding FX effect ② Figures in 1H15 and 1H16 are annualized Summary of Income Statement 2014 2015 YoY 1H15 1H16 YoY Operating revenue 2,569.5 2,602.4 1.3% 1,269.4 1,334.6 5.1% • Despite MDR cut, increase in operating revenue due to sales volume increase Operating expenses 2,279.0 2,370.8 4.0% 1,129.0 1,214.4 7.6% Card expenses 1,041.3 1,144.4 9.9% 529.3 608.9 15.1% • Increase mainly in acquisition cost to secure prime members Interest expenses 305.9 277.6 -9.2% 140.8 131.0 -7.0% • Lower interest expenses on new funding proceeds Bad debt expenses 265.9 237.7 -10.6% 105.9 120.9 14.1% • Increase according to growth in financial receivable SG&A 647.0 674.4 4.2% 332.7 334.1 0.4% Operating income 300.0 241.5 -19.5% 145.1 125.7 -13.4% Net income 223.5 186.8 -16.4% 110.8 94.9 -14.4% ROA 2.2% 1.7% -0.5%p 2.1% 1.7% -0.4%p ① ① ②
  • 5.
    4 Asset Quality Delinquency Reserve 0.6%0.6% 0.6% 0.7% 0.8% 0.9% 0.8% 0.8% 2013 2014 2015 1H16 30+ days delinquency ratio 30+ days delinquency ratio including re-aged loan ① (Allowance + Reserve) / FSS requirement 205 236 255 267 389 413 367 354 594 649 622 621 144% 132% 133% 135% 2013 2014 2015 1H16 Allowance Reserve FSS requirement coverage (unit: KRW bn) Asset quality management strategies • Focus more on lower-risk card loan • Conservative underwriting policy based on in-house modeling Reserve policy • Max of expected loss, incurred loss or FSS requirement ①
  • 6.
    Capital adequacy management •Manage leverage within FSS regulation : leverage under 6X 5 Capital Structure Leverage Source: separate financial statement, according to FSS guidelines 2013 2014 2015 1H16 YTD Total asset 11,521 12,397 13,311 13,638 2.5% Total capital 2,325 2,549 2,468 2,548 3.3% (unit: KRW bn) Capital Adequacy Ratio 5.0X 4.9X 5.4X 5.4X 2013 2014 2015 1H16 19.4% 18.2% 17.0% 17.5% 2013 2014 2015 1H16
  • 7.
    6 Funding Funding Position Maturity Fundingguidelines • By product: ABS <20%, Short-term funding <10% • ALM ratio: 100% or more 77.2% 6.4% 8.2% 5.1% 3.1% Bond and others Domestic ABS Overseas ABS Bank loan Short-term funding 2.3yr 2.1yr 1.8yr 1.7yr 168.3% 150.2% 129.8% 122.4% 2013 2014 2015 1H16 Debt maturity ALM ratio KRW 9.3tn Source: company Portfolio diversification • Stable portfolio through diversification in maturity, product and currency
  • 8.
    7 Liquidity Liquidity Position Short-termdebt Coverage Contingency framework • Early warning and response system in place • Daily monitoring of key market indicators (unit: KRW bn) (unit: KRW bn) Liquidity management • Satisfies Basel III liquidity coverage ratio • Diversified credit lines by lender and tenor 780 810 998 1,482 866 490 490 510 1,646 1,300 1,488 1,992 2013 2014 2015 1H16 Cash Credit line 1,881 2,083 2,590 3,628 87.5% 62.4% 57.4% 54.9% 2013 2014 2015 1H16 Short-term debt Short-term debt coverage Source: company
  • 9.
    8 Appendix Item 2011 20122013 2014 2015 1H16 Market share Retail credit purchase 15.5% 15.5% 14.5% 14.3% 14.2% 14.4% Asset Total 9.6tn 9.9tn 9.9tn 10.8tn 11.7tn 11.5tn % of credit purchase 68.1% 66.7% 64.3% 64.0% 65.2% 64.7% Asset quality 30+ days DQ ratio 0.4% 0.5% 0.6% 0.6% 0.6% 0.7% FSS Coverage 199.1% 157.1% 144.0% 132.2% 133.4% 134.9% Capital adequacy CAR① 19.6% 18.7% 19.4% 18.2% 17.0% 17.5% Leverage② 5.4X 5.1X 5.0X 4.9X 5.4X 5.4X Funding portfolio Total 7.1tn 7.1tn 7.2tn 7.9tn 9.1tn 9.3n Bond 85.3% 80.4% 86.7% 84.2% 81.0% 74.5% Bank loan 1.4% 1.9% 2.9% 2.5% 3.9% 5.1% Short-term funding 6.9% 4.9% - - 3.4% 3.1% Long-term CP - - - - - 2.7% ABS 6.3% 12.7% 10.3% 13.3% 11.7% 14.6% ALM ALM ratio 147.9% 134.3% 168.3% 150.2% 129.8% 122.4% Asset maturity 1.4yr 1.4yr 1.3yr 1.4yr 1.4yr 1.4yr Debt maturity 2.1yr 1.8yr 2.3yr 2.1yr 1.8yr 1.7yr ① Separate financial statement ② Based on previous quarter’s total capital since 2013
  • 10.
    Further Information IR Homepage:http://ir.hyundaicard.com IR email address: irhcc@hyundaicard.com