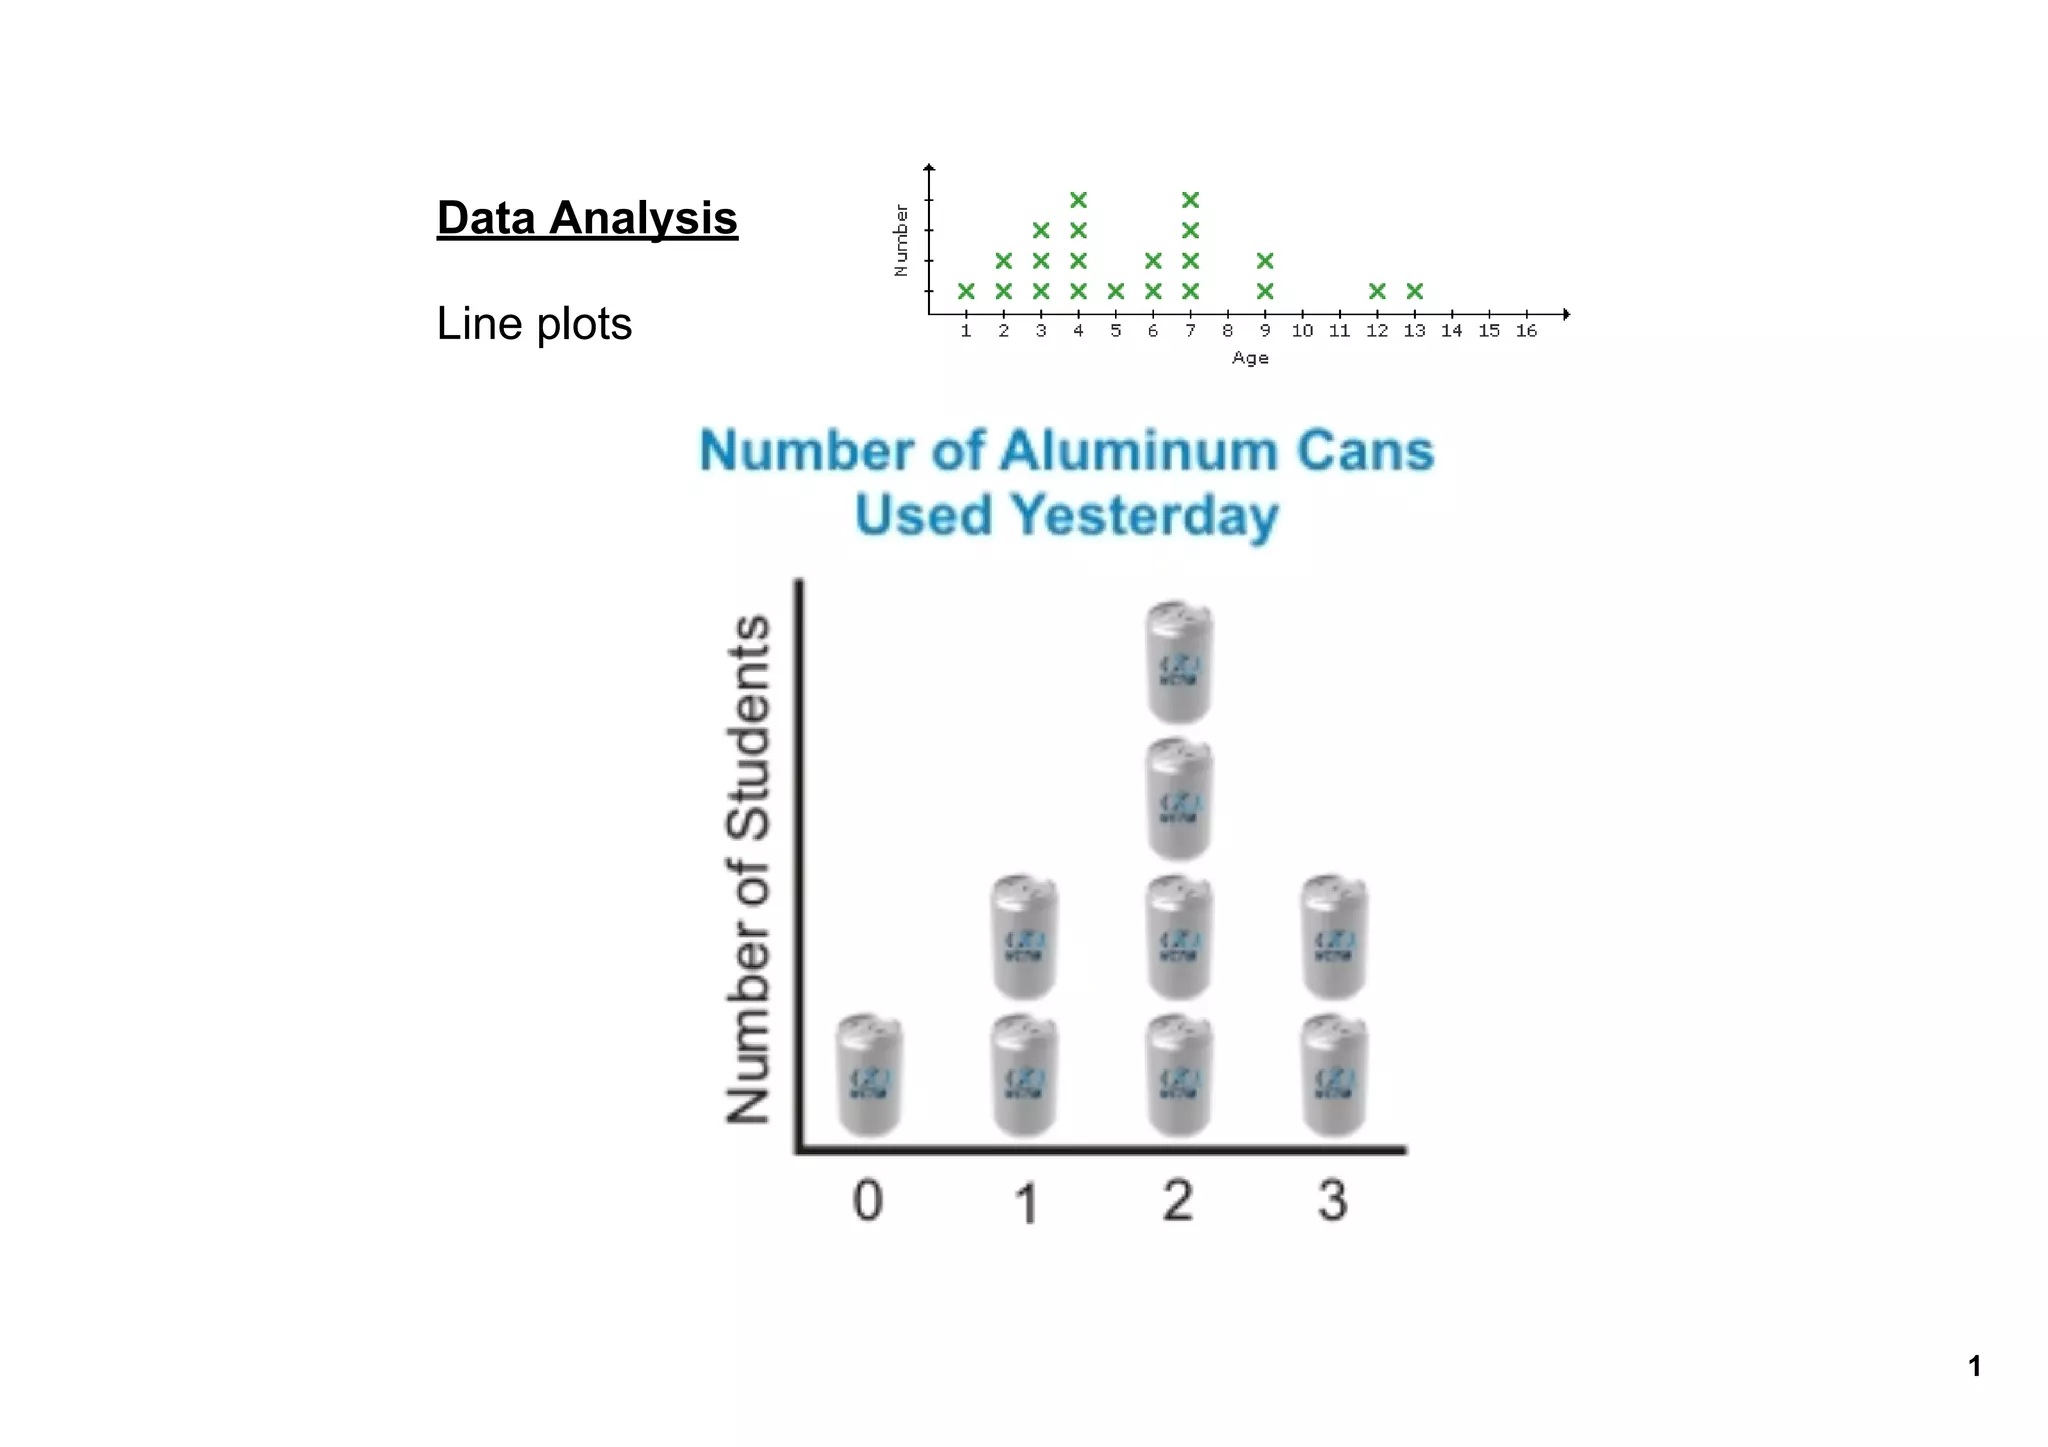
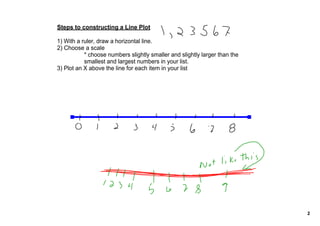
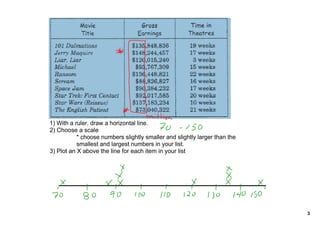
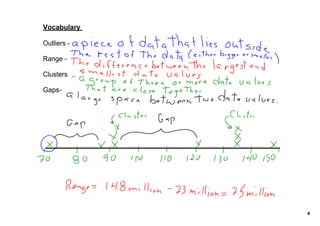
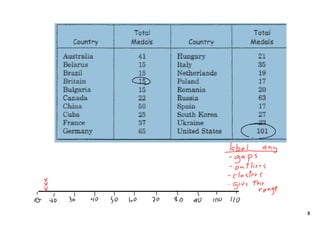
The document provides instructions for constructing a line plot, including drawing a horizontal line, choosing an appropriate scale, and plotting an X above the line for each item in the data list. It also defines key terms used in line plots such as outliers, range, clusters, and gaps.


![Circle graphs[1]](https://cdn.slidesharecdn.com/ss_thumbnails/circlegraphs1-120315115056-phpapp01-thumbnail.jpg?width=640&height=640&fit=bounds)


