Download to read offline


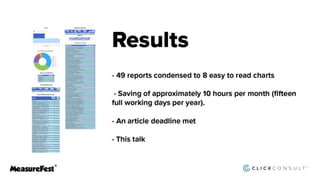
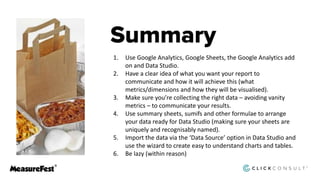


The document outlines various techniques for refining and reporting data using Google Analytics and Google Sheets. It discusses the use of segments, filters, sampling limits, and formulas to streamline data analysis and automate reporting periods. Key recommendations include using the right metrics, preparing summary sheets, and importing data into Data Studio for visualization.


![Buy Twitter Ads Account [ X Verified & Ready for Campaigns].docx](https://cdn.slidesharecdn.com/ss_thumbnails/buytwitteradsaccountxverifiedreadyforcampaigns-260114201150-9fcc4249-thumbnail.jpg?width=640&height=640&fit=bounds)


