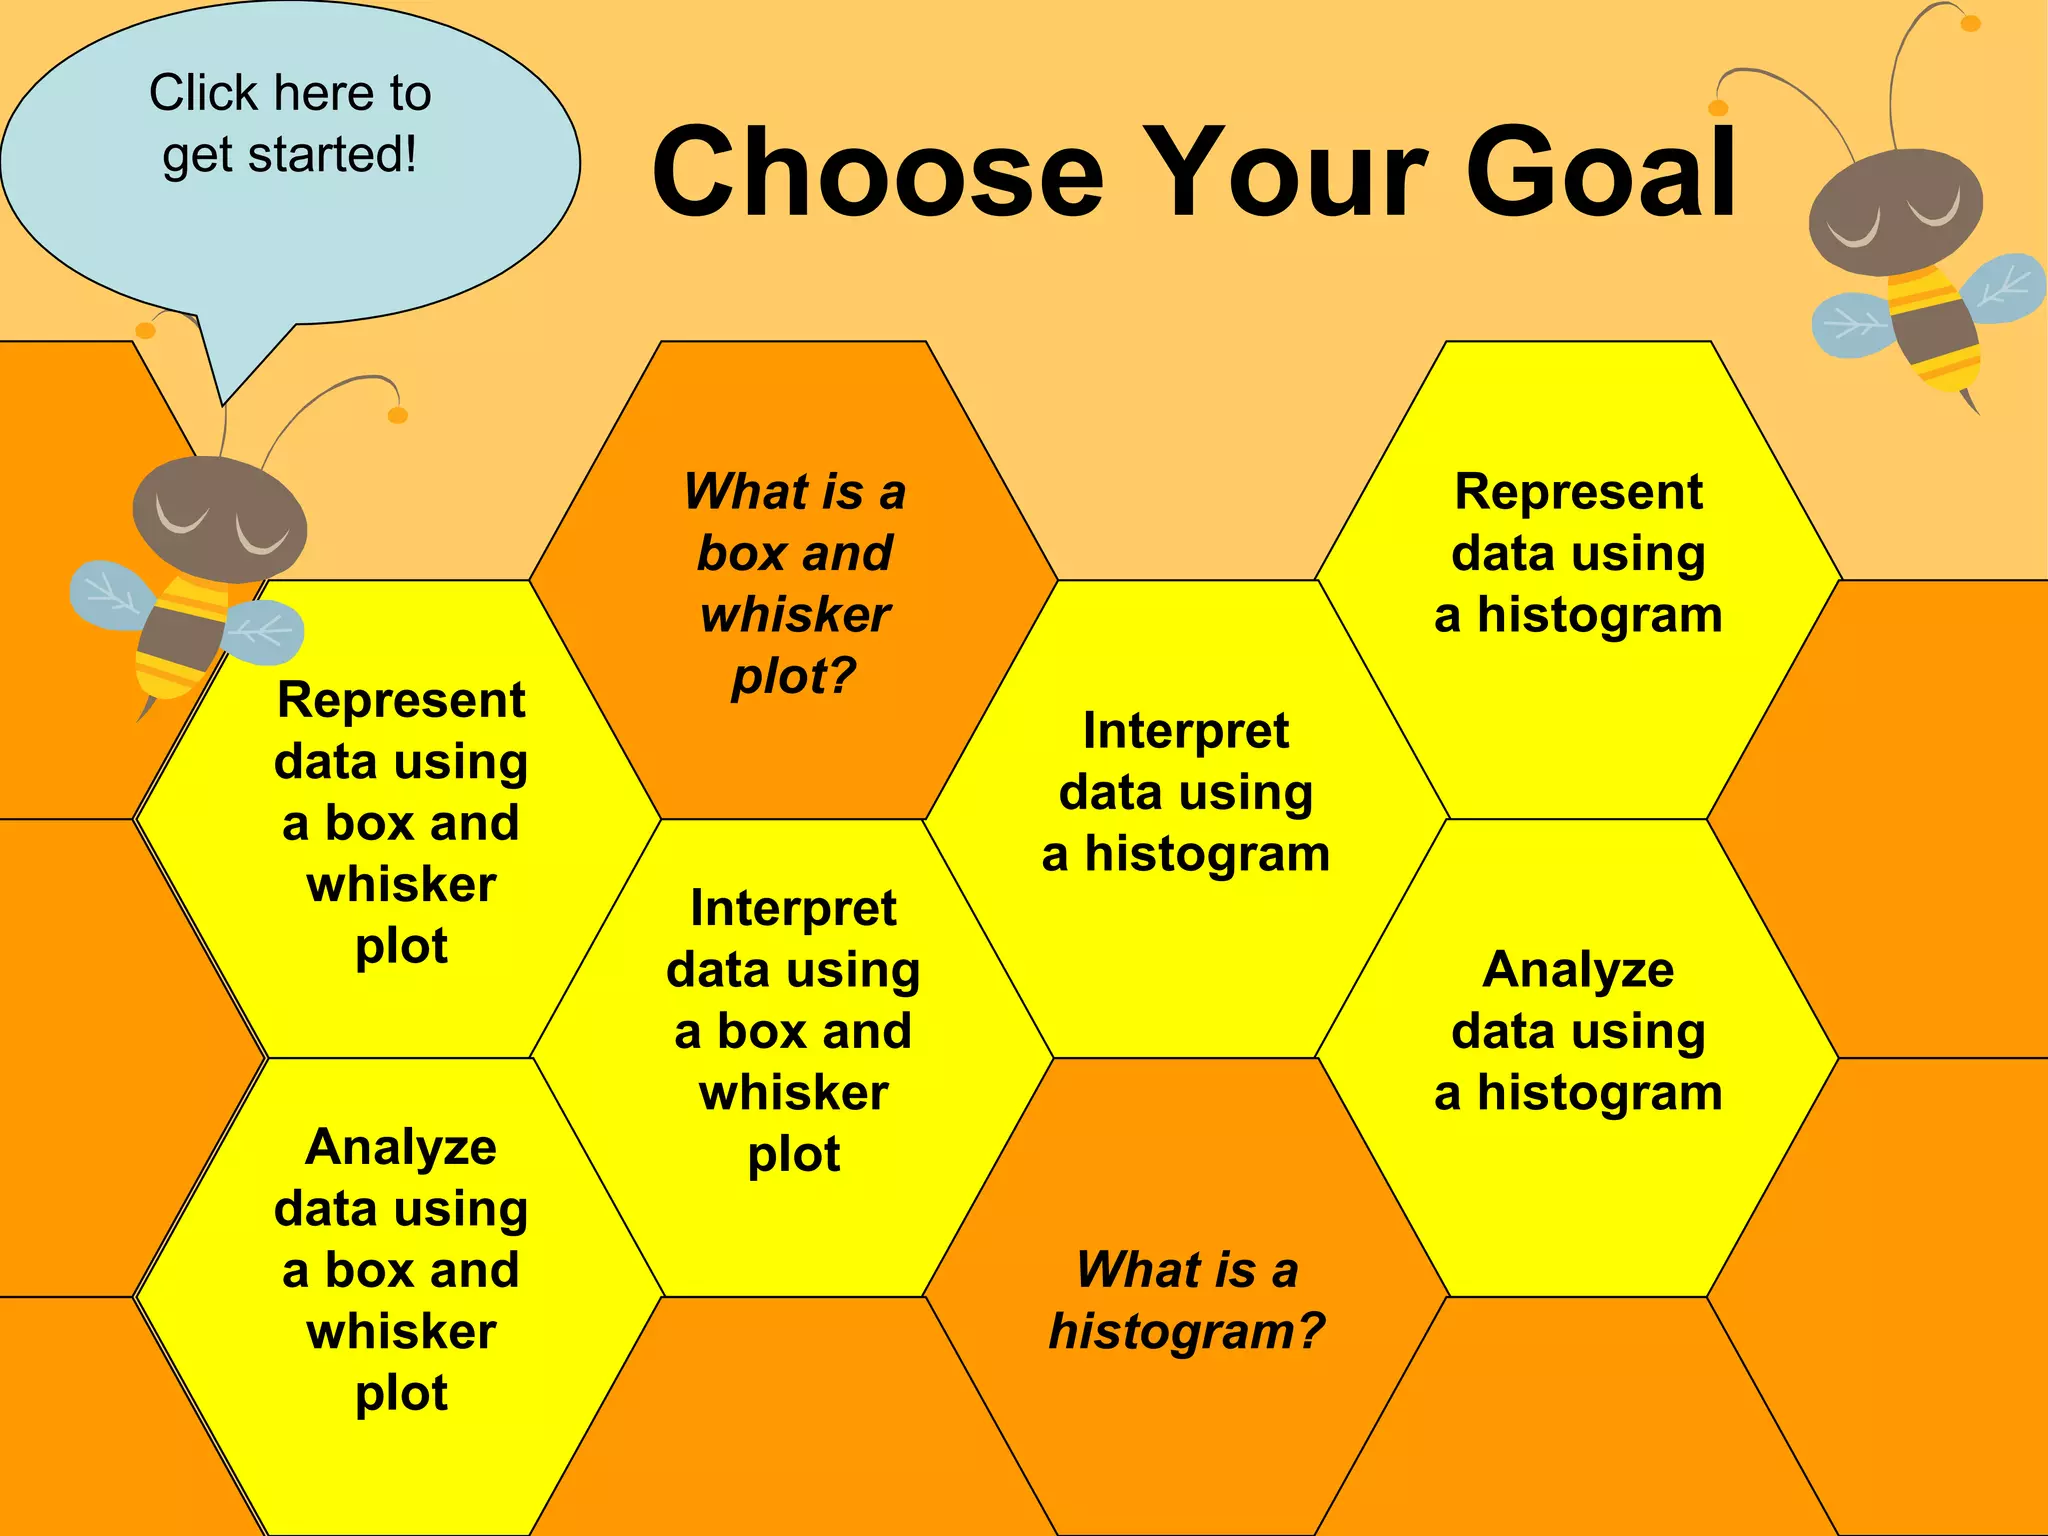
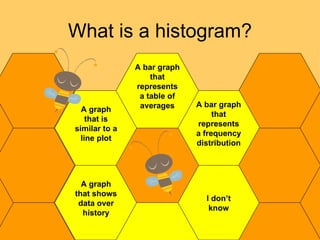
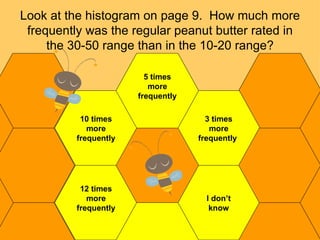
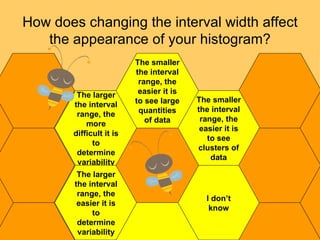
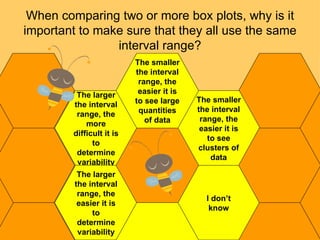
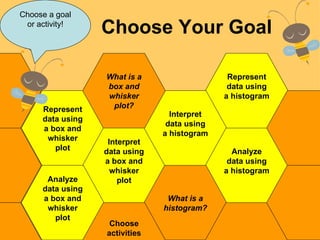
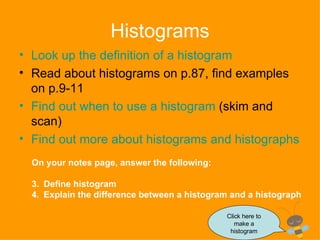
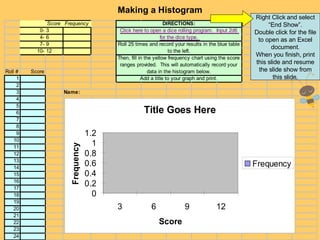
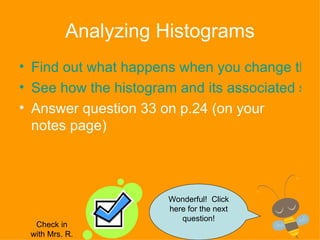
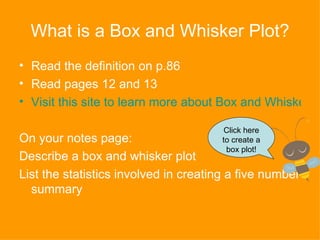
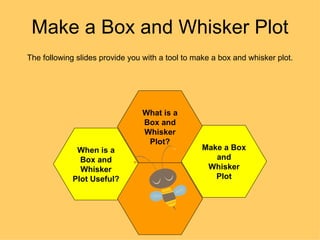
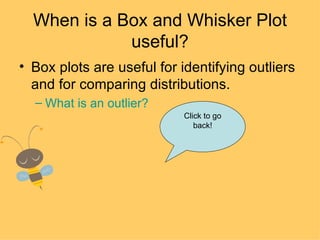
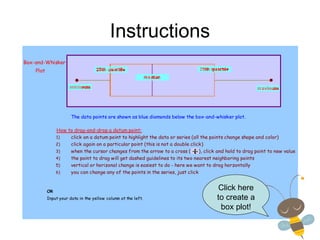
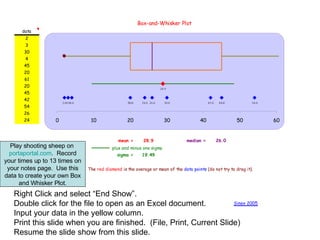
The document provides instructions and questions for learning activities about histograms and box-and-whisker plots. It includes definitions of these graphical representations, instructions for creating them in Excel based on sample data, questions to interpret example graphs, and directions to analyze how the graphs change based on different data ranges or sets. The overall goal is to help students understand and be able to use histograms and box-and-whisker plots to represent, interpret, and analyze quantitative data.


![Circle graphs[1]](https://cdn.slidesharecdn.com/ss_thumbnails/circlegraphs1-120315115056-phpapp01-thumbnail.jpg?width=640&height=640&fit=bounds)


![Lect_2_ Data visualization using Microsoft Excel[64].pptx](https://cdn.slidesharecdn.com/ss_thumbnails/lect2datavisualizationusingmicrosoftexcel64-231012114950-813fedd2-thumbnail.jpg?width=640&height=640&fit=bounds)


