Web & Social Media Analytics Previous Year Question Paper.pdf
1) 1999, 2001, and 2008 CIRP Frequency Distribution Trend Results of CMU Responses
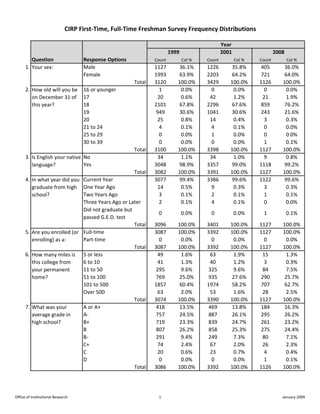
1. CIRP First‐Time, Full‐Time Freshman Survey Frequency Distributions
Year
1999 2001 2008
Question Response Options Count Col % Count Col % Count Col %
1. Your sex: Male 1127 36.1% 1226 35.8% 405 36.0%
Female 1993 63.9% 2203 64.2% 721 64.0%
Total 3120 100.0% 3429 100.0% 1126 100.0%
2. How old will you be 16 or younger 1 0.0% 0 0.0% 0 0.0%
on December 31 of 17 20 0.6% 42 1.2% 21 1.9%
this year? 18 2101 67.8% 2296 67.6% 859 76.2%
19 949 30.6% 1041 30.6% 243 21.6%
20 25 0.8% 14 0.4% 3 0.3%
21 to 24 4 0.1% 4 0.1% 0 0.0%
25 to 29 0 0.0% 1 0.0% 0 0.0%
30 to 39 0 0.0% 0 0.0% 1 0.1%
Total 3100 100.0% 3398 100.0% 1127 100.0%
3. Is English your native No 34 1.1% 34 1.0% 9 0.8%
language? Yes 3048 98.9% 3357 99.0% 1118 99.2%
Total 3082 100.0% 3391 100.0% 1127 100.0%
4. In what year did you Current Year 3077 99.4% 3386 99.6% 1122 99.6%
graduate from high One Year Ago 14 0.5% 9 0.3% 3 0.3%
school? Two Years Ago 3 0.1% 2 0.1% 1 0.1%
Three Years Ago or Later 2 0.1% 4 0.1% 0 0.0%
Did not graduate but
0 0.0% 0 0.0% 1 0.1%
passed G.E.D. test
Total 3096 100.0% 3401 100.0% 1127 100.0%
5. Are you enrolled (or Full‐time 3087 100.0% 3392 100.0% 1127 100.0%
enrolling) as a: Part‐time 0 0.0% 0 0.0% 0 0.0%
Total 3087 100.0% 3392 100.0% 1127 100.0%
6. How many miles is 5 or less 49 1.6% 63 1.9% 15 1.3%
this college from 6 to 10 41 1.3% 40 1.2% 3 0.3%
your permanent 11 to 50 295 9.6% 325 9.6% 84 7.5%
home? 51 to 100 769 25.0% 935 27.6% 290 25.7%
101 to 500 1857 60.4% 1974 58.2% 707 62.7%
Over 500 63 2.0% 53 1.6% 28 2.5%
Total 3074 100.0% 3390 100.0% 1127 100.0%
7. What was your A or A+ 418 13.5% 469 13.8% 184 16.3%
average grade in A‐ 757 24.5% 887 26.1% 295 26.2%
high school? B+ 719 23.3% 839 24.7% 261 23.2%
B 807 26.2% 858 25.3% 275 24.4%
B‐ 291 9.4% 249 7.3% 80 7.1%
C+ 74 2.4% 67 2.0% 26 2.3%
C 20 0.6% 23 0.7% 4 0.4%
D 0 0.0% 0 0.0% 1 0.1%
Total 3086 100.0% 3392 100.0% 1126 100.0%
Office of Institutional Research 1 January 2009
2. Year
1999 2001 2008
Question Response Options Count Col % Count Col % Count Col %
8. What was your 18 or lower 90 8.3%
composite ACT 19 ‐ 21 327 30.3%
score? 22 ‐ 24 352 32.6%
NA NA
25 ‐ 27 198 18.4%
28 or higher 112 10.4%
Total 1079 100.0%
9. From what kind of Public school 1034 91.7%
high school did you Public charter school 15 1.3%
graduate? Public magnet school 2 0.2%
Private religious/
Changed Response 64 5.7%
parochial school NA
Options
Private independent
10 0.9%
college‐prep school
Home school 2 0.2%
Total 1127 100.0%
10. Prior to this term,
No 3026 98.0% 3346 98.1% 1093 97.1%
have you ever taken
courses for credit at
Yes 61 2.0% 64 1.9% 33 2.9%
this institution?
Total 3087 100.0% 3410 100.0% 1126 100.0%
11. Since leaving high
school, have you No 2788 89.4% 3026 88.2% 1027 91.2%
ever taken courses,
whether for credit or
not for credit, at any Yes 332 10.6% 403 11.8% 99 8.8%
other institution?
Total 3120 100.0% 3429 100.0% 1126 100.0%
12. Where do you plan With my family or other
153 4.9% 164 4.8% 35 3.1%
to live during the fall relatives
term? Other private home,
27 0.9% 28 0.8% 8 0.7%
apartment, or room
College residence hall 2902 93.3% 3205 93.7% 1066 94.6%
Fraternity or sorority
2 0.1% 3 0.1% 1 0.1%
house
Other campus student
24 0.8% 17 0.5% 15 1.3%
housing
Other 2 0.1% 2 0.1% 2 0.2%
Total 3110 100.0% 3419 100.0% 1127 100.0%
Office of Institutional Research 2 January 2009
3. Year
1999 2001 2008
Question Response Options Count Col % Count Col % Count Col %
13. To how many None 715 23.1% 810 23.8% 251 22.3%
colleges other than One 676 21.8% 690 20.2% 201 17.8%
this one did you Two 767 24.7% 740 21.7% 257 22.8%
apply for admission Three 513 16.5% 665 19.5% 231 20.5%
this year? Four 261 8.4% 285 8.4% 117 10.4%
Five 95 3.1% 136 4.0% 46 4.1%
Six 37 1.2% 42 1.2% 9 0.8%
Seven to ten 28 0.9% 33 1.0% 12 1.1%
Eleven or more 9 0.3% 8 0.2% 3 0.3%
Total 3101 100.0% 3409 100.0% 1127 100.0%
14. Were you accepted No 130 11.5%
by your first choice Yes NA NA 997 88.5%
college? Total 1127 100.0%
15. Is this college your: Less than third choice 26 0.8% 33 1.0% 10 0.9%
Third choice 59 1.9% 90 2.6% 42 3.7%
Second choice 544 17.5% 713 20.8% 274 24.3%
First choice 2478 79.8% 2586 75.6% 800 71.0%
Total 3107 100.0% 3422 100.0% 1126 100.0%
16. Citizenship status: Neither 4 0.1% 0 0.0% 2 0.2%
Permanent resident 13 0.4% 18 0.5% 7 0.6%
U.S. citizen 3081 99.5% 3387 99.5% 1118 99.2%
Total 3098 100.0% 3405 100.0% 1127 100.0%
17. Are your parents: One or both deceased 93 3.0% 98 2.9% 34 3.0%
Both alive, divorced or
731 23.7% 847 24.9% 304 27.0%
living apart
Both alive and living with
2259 73.3% 2453 72.2% 789 70.0%
each other
Total 3083 100.0% 3398 100.0% 1127 100.0%
18a. During high school None 3 0.1% 2 0.2%
how may years did One‐half 2 0.1% 1 0.1%
you study each of One 3 0.1% 4 0.4%
the following: Two 18 0.5% 3 0.3%
NA
English Three 230 6.7% 49 4.3%
Four 3015 88.2% 1026 91.0%
Five or more 149 4.4% 42 3.7%
Total 3420 100.0% 1127 100.0%
18b. During high school None 0 0.0% 4 0.4%
how may years did One‐half 4 0.1% 3 0.3%
you study each of One 5 0.1% 8 0.7%
the following: Two 168 4.9% 39 3.5%
NA
Mathematics Three 1181 34.6% 247 21.9%
Four 1957 57.3% 785 69.7%
Five or more 102 3.0% 41 3.6%
Total 3417 100.0% 1127 100.0%
Office of Institutional Research 3 January 2009
4. Year
1999 2001 2008
Question Response Options Count Col % Count Col % Count Col %
18c. During high school None 227 6.7% 68 6.0%
how may years did One‐half 60 1.8% 18 1.6%
you study each of One 454 13.3% 131 11.6%
the following: Two 1447 42.5% 458 40.7%
NA
Foreign Language Three 736 21.6% 254 22.6%
Four 454 13.3% 179 15.9%
Five or more 27 0.8% 18 1.6%
Total 3405 100.0% 1126 100.0%
18d. During high school None 217 6.4% 39 3.5%
how may years did One‐half 141 4.1% 32 2.8%
you study each of One 1360 40.0% 417 37.1%
the following: Two 1083 31.9% 362 32.2%
NA
Physical Science Three 437 12.9% 179 15.9%
Four 148 4.4% 92 8.2%
Five or more 13 0.4% 4 0.4%
Total 3399 100.0% 1125 100.0%
18e. During high school None 92 2.7% 12 1.1%
how may years did One‐half 112 3.3% 21 1.9%
you study each of One 1675 49.2% 469 41.7%
the following: Two 1158 34.0% 416 37.0%
NA
Biological Science Three 259 7.6% 121 10.8%
Four 101 3.0% 80 7.1%
Five or more 9 0.3% 6 0.5%
Total 3406 100.0% 1125 100.0%
18f. During high school None 1 0.0% 2 0.2%
how may years did One‐half 40 1.2% 11 1.0%
you study each of One 288 8.5% 74 6.6%
the following: Two 855 25.2% 211 18.8%
NA
History/Am. Govt. Three 1272 37.4% 442 39.4%
Four 903 26.6% 369 32.9%
Five or more 38 1.1% 14 1.2%
Total 3397 100.0% 1123 100.0%
18g. During high school None 876 26.0% 275 24.5%
how may years did One‐half 574 17.0% 169 15.0%
you study each of One 1084 32.2% 378 33.7%
the following: Two 555 16.5% 199 17.7%
NA
Computer Science Three 179 5.3% 64 5.7%
Four 88 2.6% 35 3.1%
Five or more 14 0.4% 3 0.3%
Total 3370 100.0% 1123 100.0%
Office of Institutional Research 4 January 2009
5. Year
1999 2001 2008
Question Response Options Count Col % Count Col % Count Col %
18h. During high school None 838 24.7% 252 22.4%
how may years did One‐half 211 6.2% 81 7.2%
you study each of One 599 17.6% 162 14.4%
the following: Arts Two 479 14.1% 166 14.7%
NA
and/or Music Three 290 8.5% 103 9.1%
Four 850 25.0% 313 27.8%
Five or more 128 3.8% 50 4.4%
Total 3395 100.0% 1127 100.0%
19a. Highest Degree None 12 0.5% 10 0.3% 14 1.3%
Planned at Any Vocational certificate 2 0.1% 4 0.1% 3 0.3%
Institution: Associate 4 0.2% 3 0.1% 22 2.0%
Bachelor's degree 903 34.7% 939 32.2% 279 25.1%
Master's degree 1212 46.6% 1390 47.7% 473 42.6%
Ph.D. or Ed.D. 280 10.8% 355 12.2% 200 18.0%
M.D., D.O., D.D.S., D.V.M. 104 4.0% 136 4.7% 80 7.2%
J.D. (Law) 51 2.0% 47 1.6% 21 1.9%
B.D. or M.DIV. (Divinity) 4 0.2% 6 0.2% 2 0.2%
Other 30 1.2% 24 0.8% 17 1.5%
Total 2602 100.0% 2914 100.0% 1111 100.0%
19b. Highest Degree None 27 1.7% 31 1.7% 23 2.1%
Planned at This Vocational certificate 3 0.2% 3 0.2% 10 0.9%
Institution: Associate 22 1.3% 37 2.0% 37 3.4%
Bachelor's degree 1131 69.2% 1273 69.3% 636 58.9%
Master's degree 385 23.5% 433 23.6% 276 25.6%
Ph.D. or Ed.D. 39 2.4% 31 1.7% 61 5.7%
M.D., D.O., D.D.S., D.V.M. 3 0.2% 9 0.5% 15 1.4%
J.D. (Law) 6 0.4% 3 0.2% 4 0.4%
B.D. or M.DIV. (Divinity) 3 0.2% 0 0.0% 3 0.3%
Other 16 1.0% 18 1.0% 14 1.3%
Total 1635 100.0% 1838 100.0% 1079 100.0%
20a. Racial composition Completely non‐White 9 0.8%
of high school I last Mostly non‐White 43 3.8%
attended: Roughly half non‐White 195 17.3%
NA NA
Mostly White 772 68.6%
Completely White 106 9.4%
Total 1125 100.0%
20b. Racial composition Completely non‐White 14 1.2%
of the neighborhood Mostly non‐White 38 3.4%
where I grew up: Roughly half non‐White 92 8.2%
NA NA
Mostly White 658 58.4%
Completely White 324 28.8%
Total 1126 100.0%
Office of Institutional Research 5 January 2009
6. Year
1999 2001 2008
Question Response Options Count Col % Count Col % Count Col %
21a. Do you have a No 998 88.6%
disability? Yes NA NA 129 11.4%
Total 1127 100.0%
21b. Of those that have a No 118 91.5%
disability: Hearing Yes NA NA 11 8.5%
Disability Total 129 100.0%
21c. Of those that have a No 123 95.3%
disability: Speech Yes NA NA 6 4.7%
Disability Total 129 100.0%
21d. Of those that have a No 125 96.9%
disability:
Yes NA NA 4 3.1%
Orthopedic
Disability Total 129 100.0%
21e. Of those that have a No 99 76.7%
disability: Learning Yes NA NA 30 23.3%
Disability Total 129 100.0%
21f. Of those that have a No 115 89.1%
disability: Partially
Yes NA NA 14 10.9%
sighted or blind
Total 129 100.0%
21g. Of those that have a No 108 83.7%
disability: Health‐ Yes NA NA 21 16.3%
related Disability Total 129 100.0%
21h. Of those that have a No 110 85.3%
disability: Other Yes NA NA 19 14.7%
Disability Total 129 100.0%
22a. How much of your None 312 9.7% 192 17.2%
first year's
Less than $1,000 410 12.8% 153 13.7%
educational
expenses do you $1,000 ‐ 2,999 645 20.1% 173 15.5%
expect to cover $3,000 ‐ 5,999 NA 765 23.8% 195 17.5%
from: Family
$6,000 ‐ 9,999 566 17.6% 155 13.9%
resources (parents,
relatives, spouse, $10,000 + 514 16.0% 249 22.3%
etc.) Total 3212 100.0% 1117 100.0%
22b. How much of your None 402 13.8% 189 17.0%
first year's
educational Less than $1,000 1050 36.0% 382 34.3%
expenses do you $1,000 ‐ 2,999 1067 36.6% 372 33.4%
expect to cover
$3,000 ‐ 5,999 NA 312 10.7% 114 10.2%
from: My own
resources (savings $6,000 ‐ 9,999 61 2.1% 39 3.5%
from work, work‐
$10,000 + 25 0.9% 19 1.7%
study, other income)
Total 2917 100.0% 1115 100.0%
Office of Institutional Research 6 January 2009
7. Year
1999 2001 2008
Question Response Options Count Col % Count Col % Count Col %
22c. How much of your None 326 10.6% 238 21.4%
first year's
educational Less than $1,000 202 6.6% 118 10.6%
expenses do you
$1,000 ‐ 2,999 1110 36.1% 279 25.1%
expect to cover
from: Aid which $3,000 ‐ 5,999 NA 955 31.1% 243 21.9%
need not be repaid
(grants, $6,000 ‐ 9,999 334 10.9% 128 11.5%
scholarships, $10,000 + 144 4.7% 104 9.4%
military funding,
etc.) Total 3071 100.0% 1110 100.0%
22d. How much of your None 1133 41.7% 315 28.3%
first year's Less than $1,000 225 8.3% 44 4.0%
educational $1,000 ‐ 2,999 659 24.3% 120 10.8%
expenses do you $3,000 ‐ 5,999 NA 443 16.3% 234 21.0%
expect to cover $6,000 ‐ 9,999 185 6.8% 207 18.6%
from: Aid which $10,000 + 69 2.5% 192 17.3%
must be repaid Total 2714 100.0% 1112 100.0%
22e. How much of your None 1477 90.1% 900 82.1%
first year's Less than $1,000 80 4.9% 104 9.5%
educational $1,000 ‐ 2,999 43 2.6% 55 5.0%
expenses do you $3,000 ‐ 5,999 NA 21 1.3% 17 1.6%
expect to cover $6,000 ‐ 9,999 8 0.5% 10 0.9%
from: Other than $10,000 + 10 0.6% 10 0.9%
above Total 1639 100.0% 1096 100.0%
23. What is your best Less than $10,000 30 2.7%
estimate of your $10,000 to $14,999 25 2.3%
parents' total $15,000 to $19,999 22 2.0%
income last year? $20,000 to $24,999 32 2.9%
Consider income $25,000 to $29,999 33 3.0%
from all sources $30,000 to $39,999 76 6.9%
before taxes $40,000 to $49,999 78 7.1%
Response Options Response Options
$50,000 to $59,999 109 9.9%
Differed Differed
$60,000 to $74,999 161 14.6%
$75,000 to $99,999 187 17.0%
$100,000 to $149,999 196 17.8%
$150,000 to $199,999 78 7.1%
$200,000 to $249,999 31 2.8%
$250,000 or more 44 4.0%
Total 1102 100.0%
Office of Institutional Research 7 January 2009
8. Year
1999 2001 2008
Question Response Options Count Col % Count Col % Count Col %
23.* What is your best Less than $10,000 67 2.4% 60 2.0% 30 2.7%
estimate of your $10,000 to $14,999 51 1.8% 57 1.8% 25 2.3%
parents' total $15,000 to $19,999 66 2.4% 73 2.3% 22 2.0%
income last year? $20,000 to $24,999 90 3.2% 110 3.5% 32 2.9%
*Recoded: 1999 and $25,000 to $29,999 107 3.8% 114 3.6% 33 3.0%
2000 included "less $30,000 to $39,999 245 8.8% 230 7.4% 76 6.9%
than $6,000"; $40,000 to $49,999 314 11.3% 327 10.5% 78 7.1%
"$6,000 to $9,999"; $50,000 to $59,999 386 13.8% 410 13.1% 109 9.9%
and "$200,000 or $60,000 to $74,999 489 17.5% 535 17.1% 161 14.6%
more" $75,000 to $99,999 447 16.0% 519 16.6% 187 17.0%
$100,000 to $149,999 355 12.7% 476 15.2% 196 17.8%
$150,000 to $199,999 117 4.2% 136 4.3% 78 7.1%
$200,000 or more 55 2.0% 81 2.6% 75 6.8%
Total 2789 100.0% 3128 100.0% 1102 100.0%
24. Do you have any None (I am confident that
867 28.8% 936 27.9% 271 24.1%
concern about your I will have sufficient funds)
ability to finance Some (but I probably will
1691 56.1% 1976 58.8% 653 58.0%
your college have enough funds)
education? Major (not sure I will have
454 15.1% 447 13.3% 201 17.9%
enough funds)
Total 3012 100.0% 3359 100.0% 1125 100.0%
25a.* Your current Baptist 186 6.2% 247 7.4% 54 4.8%
religious preference: Buddhist 3 0.1% 7 0.2% 5 0.4%
*Recoded: 2008 Church of Christ NA NA NA NA 50 4.5%
included "Church of Eastern Orthodox 12 0.4% 8 0.2% 6 0.5%
Christ", "Hindu", and Episcopalian 33 1.1% 32 1.0% 9 0.8%
"Muslim" Hindu NA NA NA NA 0 0.0%
Islamic 3 0.1% 3 0.1% 0 0.0%
Jewish 8 0.3% 12 0.4% 6 0.5%
LDS (Mormon) 7 0.2% 6 0.2% 1 0.1%
Lutheran 341 11.4% 324 9.7% 89 7.9%
Methodist 267 8.9% 251 7.5% 91 8.1%
Muslim NA NA NA NA 1 0.1%
Presbyterian 139 4.7% 125 3.8% 24 2.1%
Quaker 5 0.2% 6 0.2% 2 0.2%
Roman Catholic 1005 33.6% 1078 32.3% 293 26.2%
Seventh Day Adventist 5 0.2% 9 0.3% 3 0.3%
United Church of Christ/
29 1.0% 50 1.5% 11 1.0%
Congregational
Other Christian 368 12.3% 499 15.0% 219 19.6%
Other Religion 76 2.5% 85 2.6% 36 3.2%
None 501 16.8% 591 17.7% 220 19.6%
Total 2988 100.0% 3333 100.0% 1120 100.0%
Office of Institutional Research 8 January 2009
9. Year
1999 2001 2008
Question Response Options Count Col % Count Col % Count Col %
25b.* Your father's current Baptist 178 6.6% 238 7.7% 68 6.1%
religious preference: Buddhist 4 0.1% 6 0.2% 0 0.0%
*Recoded: 2008 Church of Christ NA NA NA NA 59 5.3%
included "Church of Eastern Orthodox 8 0.3% 7 0.2% 9 0.8%
Christ", "Hindu", and Episcopalian 30 1.1% 35 1.1% 11 1.0%
"Muslim" Hindu NA NA NA NA 0 0.0%
Islamic 6 0.2% 7 0.2% 0 0.0%
Jewish 17 0.6% 17 0.5% 10 0.9%
LDS (Mormon) 5 0.2% 3 0.1% 3 0.3%
Lutheran 341 12.6% 332 10.7% 98 8.8%
Methodist 254 9.4% 244 7.9% 82 7.4%
Muslim NA NA NA NA 4 0.4%
Presbyterian 133 4.9% 134 4.3% 42 3.8%
Quaker 5 0.2% 3 0.1% 2 0.2%
Roman Catholic 968 35.7% 1093 35.3% 292 26.3%
Seventh Day Adventist 4 0.1% 7 0.2% 5 0.4%
United Church of Christ/
19 0.7% 42 1.4% 13 1.2%
Congregational
Other Christian 295 10.9% 388 12.5% 199 17.9%
Other Religion 44 1.6% 51 1.6% 26 2.3%
None 403 14.8% 488 15.8% 189 17.0%
Total 2714 100.0% 3095 100.0% 1112 100.0%
25c.* Your mother's Baptist 191 6.8% 254 8.0% 73 6.5%
current religious Buddhist 1 0.0% 4 0.1% 0 0.0%
preference: Church of Christ NA NA NA NA 64 5.7%
*Recoded: 2008 Eastern Orthodox 7 0.2% 8 0.3% 10 0.9%
included "Church of Episcopalian 40 1.4% 41 1.3% 13 1.2%
Christ", "Hindu", and Hindu NA NA NA NA 0 0.0%
"Muslim" Islamic 3 0.1% 3 0.1% 0 0.0%
Jewish 17 0.6% 8 0.3% 8 0.7%
LDS (Mormon) 5 0.2% 6 0.2% 1 0.1%
Lutheran 360 12.8% 349 11.0% 111 9.9%
Methodist 279 9.9% 288 9.1% 101 9.1%
Muslim NA NA NA NA 1 0.1%
Presbyterian 155 5.5% 151 4.8% 36 3.2%
Quaker 8 0.3% 4 0.1% 2 0.2%
Roman Catholic 1066 38.0% 1151 36.3% 320 28.7%
Seventh Day Adventist 4 0.1% 10 0.3% 6 0.5%
United Church of Christ/
22 0.8% 43 1.4% 12 1.1%
Congregational
Other Christian 330 11.8% 461 14.5% 208 18.6%
Other Religion 45 1.6% 60 1.9% 24 2.2%
None 274 9.8% 330 10.4% 126 11.3%
Total 2807 100.0% 3171 100.0% 1116 100.0%
Office of Institutional Research 9 January 2009
10. Year
1999 2001 2008
Question Response Options Count Col % Count Col % Count Col %
26a. Activities noted in Not at all 562 18.1% 566 16.6% 293 26.0%
the past year: Occasionally 1368 44.1% 1521 44.5% 477 42.3%
Attended a religious Frequently 1169 37.7% 1328 38.9% 357 31.7%
service Total 3099 100.0% 3415 100.0% 1127 100.0%
26b. Activities noted in Not at all 36 1.2% 42 1.2% 39 3.5%
the past year: Was Occasionally 1577 50.8% 1603 46.9% 654 58.1%
bored in class Frequently 1490 48.0% 1773 51.9% 433 38.5%
Total 3103 100.0% 3418 100.0% 1126 100.0%
26c. Activities noted in Not at all 1397 45.2% 1487 43.6% 828 73.5%
the past year:
Occasionally 1316 42.6% 1494 43.9% 267 23.7%
Participated in
political Frequently 377 12.2% 426 12.5% 31 2.8%
demonstrations Total 3090 100.0% 3407 100.0% 1126 100.0%
26d. Activities noted in Not at all 1658 53.5% 1812 53.1% 495 44.0%
the past year: Occasionally 1114 35.9% 1256 36.8% 518 46.0%
Tutored another Frequently 329 10.6% 345 10.1% 113 10.0%
student Total 3101 100.0% 3413 100.0% 1126 100.0%
26e. Activities noted in Not at all 452 14.6% 484 14.2% 122 10.8%
the past year: Occasionally 1957 63.1% 2194 64.2% 748 66.4%
Studied with other Frequently 692 22.3% 739 21.6% 257 22.8%
students Total 3101 100.0% 3417 100.0% 1127 100.0%
26f. Activities noted in Not at all 2121 68.4% 2279 66.8% 865 76.8%
the past year: Was a Occasionally 837 27.0% 970 28.4% 218 19.3%
guest in a teacher's Frequently 145 4.7% 163 4.8% 44 3.9%
home Total 3103 100.0% 3412 100.0% 1127 100.0%
26g. Activities noted in Not at all 1933 62.4% 2325 68.0% 865 76.8%
the past year: Occasionally 686 22.1% 685 20.0% 200 17.7%
Smoked cigarettes Frequently 481 15.5% 409 12.0% 62 5.5%
Total 3100 100.0% 3419 100.0% 1127 100.0%
26h. Activities noted in Not at all 1319 42.6% 1537 45.0% 626 55.5%
the past year: Drank Occasionally 1367 44.2% 1447 42.3% 407 36.1%
beer Frequently 409 13.2% 435 12.7% 94 8.3%
Total 3095 100.0% 3419 100.0% 1127 100.0%
26i. Activities noted in Not at all 1156 37.4% 1259 36.8% 557 49.4%
the past year: Drank Occasionally 1639 53.0% 1787 52.2% 492 43.7%
wine or liquor Frequently 296 9.6% 375 11.0% 78 6.9%
Total 3091 100.0% 3421 100.0% 1127 100.0%
26j. Activities noted in Not at all 247 7.9% 299 8.8% 91 8.1%
the past year: Felt Occasionally 1738 55.9% 1937 56.7% 648 57.5%
overwhelmed by all Frequently 1122 36.1% 1180 34.5% 388 34.4%
I had to do Total 3107 100.0% 3416 100.0% 1127 100.0%
26k. Activities noted in Not at all 1071 34.5% 1288 37.7% 403 35.8%
the past year: Felt Occasionally 1738 56.0% 1853 54.2% 619 54.9%
depressed Frequently 295 9.5% 276 8.1% 105 9.3%
Total 3104 100.0% 3417 100.0% 1127 100.0%
Office of Institutional Research 10 January 2009
11. Year
1999 2001 2008
Question Response Options Count Col % Count Col % Count Col %
26l. Activities noted in Not at all 654 21.1% 704 20.6% 179 15.9%
the past year: Occasionally 1735 56.0% 1856 54.3% 654 58.1%
Performed Frequently 711 22.9% 858 25.1% 293 26.0%
volunteer work Total 3100 100.0% 3418 100.0% 1126 100.0%
26m. Activities noted in Not at all 2010 64.9% 2114 61.9% 642 57.0%
the past year: Occasionally 442 14.3% 553 16.2% 210 18.6%
Played a musical Frequently 647 20.9% 748 21.9% 275 24.4%
instrument Total 3099 100.0% 3415 100.0% 1127 100.0%
26n. Activities noted in Not at all 522 16.8% 546 16.0% 146 13.0%
the past year: Asked Occasionally 1968 63.4% 2119 62.0% 691 61.3%
a teacher for advice Frequently 613 19.8% 754 22.1% 290 25.7%
after class Total 3103 100.0% 3419 100.0% 1127 100.0%
26o. Activities noted in Not at all 730 23.6% 677 19.9% 263 23.4%
the past year: Voted Occasionally 1749 56.5% 1987 58.3% 597 53.0%
in a student election Frequently 615 19.9% 742 21.8% 266 23.6%
Total 3094 100.0% 3406 100.0% 1126 100.0%
26p. Activities noted in Not at all 150 4.8% 134 3.9% 46 4.1%
the past year:
Socialized with Occasionally 1295 41.7% 1359 39.8% 455 40.4%
someone of another Frequently 1660 53.5% 1922 56.3% 624 55.5%
racial/ethnic group
Total 3105 100.0% 3415 100.0% 1125 100.0%
26q. Activities noted in Not at all 897 29.0% 960 28.3% 461 40.9%
the past year: Came Occasionally 1823 58.9% 1920 56.5% 575 51.0%
late to class Frequently 376 12.1% 516 15.2% 91 8.1%
Total 3096 100.0% 3396 100.0% 1127 100.0%
26r. Activities noted in Not at all 180 5.8% 50 1.5% 5 0.4%
the past year: Used
Occasionally 1137 36.6% 785 22.9% 258 22.9%
the Internet: For
research or Frequently 1787 57.6% 2586 75.6% 864 76.7%
homework Total 3104 100.0% 3421 100.0% 1127 100.0%
26s. Activities noted in Not at all 152 13.5%
the past year: Used Occasionally 476 42.2%
NA NA
the Internet: To Frequently 499 44.3%
read news sites Total 1127 100.0%
26t. Activities noted in Not at all 483 42.9%
the past year: Used Occasionally 328 29.1%
NA NA
the Internet: To Frequently 315 28.0%
read blogs Total 1126 100.0%
26u. Activities noted in Not at all 704 62.6%
the past year: Used Occasionally 243 21.6%
NA NA
the Internet: To Frequently 178 15.8%
blog Total 1125 100.0%
Office of Institutional Research 11 January 2009
12. Year
1999 2001 2008
Question Response Options Count Col % Count Col % Count Col %
26v. Activities noted in Not at all 1498 48.4% 1620 47.4% 411 36.5%
the past year:
Occasionally 1165 37.6% 1309 38.3% 519 46.1%
Performed
community service Frequently 434 14.0% 490 14.3% 197 17.5%
as part of a class Total 3097 100.0% 3419 100.0% 1127 100.0%
26w. Activities noted in Not at all 727 23.6% 709 20.8% 218 19.4%
the past year: Occasionally 1727 56.0% 1896 55.7% 603 53.6%
Discussed religion Frequently 632 20.5% 801 23.5% 305 27.1%
Total 3086 100.0% 3406 100.0% 1126 100.0%
26x. Activities noted in Not at all 1025 33.2% 1000 29.4% 159 14.1%
the past year: Occasionally 1659 53.7% 1881 55.2% 634 56.3%
Discussed politics Frequently 408 13.2% 524 15.4% 334 29.6%
Total 3092 100.0% 3405 100.0% 1127 100.0%
26y. Activities noted in Not at all 1004 89.1%
the past year:
Occasionally 98 8.7%
Worked on a local, NA NA
state or national Frequently 25 2.2%
political campaign Total 1127 100.0%
27a. Rate yourself on Lowest 10% 0 0.0% 0 0.0% 1 0.1%
each trait compared Below average 18 0.6% 24 0.7% 16 1.4%
with the average Average 1082 35.0% 1189 34.8% 376 33.4%
person your age: Above average 1593 51.5% 1774 51.9% 559 49.6%
Academic ability Highest 10% 399 12.9% 429 12.6% 174 15.5%
Total 3092 100.0% 3416 100.0% 1126 100.0%
27b. Rate yourself on Lowest 10% 386 12.5% 392 11.5% 117 10.4%
each trait compared Below average 1044 33.8% 1023 29.9% 396 35.2%
with the average Average 956 30.9% 1120 32.8% 347 30.8%
person your age: Above average 552 17.9% 697 20.4% 203 18.0%
Artistic ability Highest 10% 153 4.9% 184 5.4% 62 5.5%
Total 3091 100.0% 3416 100.0% 1125 100.0%
27c. Rate yourself on Lowest 10% 52 1.7% 39 1.1% 10 0.9%
each trait compared Below average 446 14.4% 387 11.3% 90 8.0%
with the average Average 1685 54.5% 1871 54.8% 567 50.4%
person your age: Above average 776 25.1% 936 27.4% 401 35.6%
Computer skills Highest 10% 132 4.3% 182 5.3% 58 5.2%
Total 3091 100.0% 3415 100.0% 1126 100.0%
27d. Rate yourself on Lowest 10% 2 0.1% 5 0.1% 1 0.1%
each trait compared Below average 57 1.8% 64 1.9% 7 0.6%
with the average Average 761 24.7% 948 27.8% 252 22.4%
person your age: Above average 1615 52.4% 1761 51.6% 619 55.0%
Cooperativeness Highest 10% 649 21.0% 638 18.7% 247 21.9%
Total 3084 100.0% 3416 100.0% 1126 100.0%
Office of Institutional Research 12 January 2009
13. Year
1999 2001 2008
Question Response Options Count Col % Count Col % Count Col %
27e. Rate yourself on Lowest 10% 29 0.9% 27 0.8% 10 0.9%
each trait compared Below average 325 10.5% 319 9.3% 116 10.3%
with the average Average 1152 37.3% 1269 37.2% 378 33.6%
person your age: Above average 1151 37.2% 1273 37.3% 453 40.2%
Creativity Highest 10% 434 14.0% 525 15.4% 169 15.0%
Total 3091 100.0% 3413 100.0% 1126 100.0%
27f. Rate yourself on Lowest 10% 6 0.2% 5 0.1% 1 0.1%
each trait compared Below average 97 3.1% 88 2.6% 25 2.2%
with the average Average 892 28.9% 1023 29.9% 279 24.8%
person your age: Above average 1400 45.3% 1485 43.5% 488 43.3%
Drive to achieve Highest 10% 693 22.4% 815 23.9% 333 29.6%
Total 3088 100.0% 3416 100.0% 1126 100.0%
27g. Rate yourself on Lowest 10% 29 0.9% 35 1.0% 9 0.8%
each trait compared Below average 196 6.3% 260 7.6% 114 10.1%
with the average Average 1307 42.3% 1535 45.0% 453 40.2%
person your age: Above average 1107 35.9% 1136 33.3% 372 33.0%
Emotional health Highest 10% 448 14.5% 448 13.1% 178 15.8%
Total 3087 100.0% 3414 100.0% 1126 100.0%
27h. Rate yourself on Lowest 10% 16 0.5% 15 0.4% 9 0.8%
each trait compared Below average 199 6.4% 258 7.6% 69 6.1%
with the average Average 1020 33.0% 1193 35.0% 350 31.1%
person your age: Above average 1252 40.5% 1323 38.8% 463 41.1%
Leadership ability Highest 10% 606 19.6% 624 18.3% 235 20.9%
Total 3093 100.0% 3413 100.0% 1126 100.0%
27i. Rate yourself on Lowest 10% 141 4.6% 157 4.6% 41 3.6%
each trait compared Below average 685 22.2% 762 22.3% 217 19.3%
with the average
Average 1145 37.0% 1321 38.7% 428 38.0%
person your age:
Mathematical ability Above average 871 28.2% 892 26.1% 341 30.3%
Highest 10% 249 8.1% 283 8.3% 99 8.8%
Total 3091 100.0% 3415 100.0% 1126 100.0%
27j. Rate yourself on Lowest 10% 15 0.5% 12 0.4% 4 0.4%
each trait compared Below average 173 5.6% 211 6.2% 90 8.0%
with the average Average 1268 41.0% 1461 42.7% 463 41.1%
person your age: Above average 1110 35.9% 1224 35.8% 376 33.4%
Physical health Highest 10% 524 17.0% 510 14.9% 193 17.1%
Total 3090 100.0% 3418 100.0% 1126 100.0%
27k. Rate yourself on Lowest 10% 30 1.0% 36 1.1% 17 1.5%
each trait compared Below average 177 5.7% 236 6.9% 99 8.8%
with the average Average 1606 52.1% 1771 51.9% 596 52.9%
person your age: Above average 1056 34.3% 1116 32.7% 346 30.7%
Popularity Highest 10% 213 6.9% 255 7.5% 68 6.0%
Total 3082 100.0% 3414 100.0% 1126 100.0%
Office of Institutional Research 13 January 2009
14. Year
1999 2001 2008
Question Response Options Count Col % Count Col % Count Col %
27l. Rate yourself on Lowest 10% 124 4.0% 130 3.8% 34 3.0%
each trait compared Below average 660 21.4% 757 22.2% 224 19.9%
with the average Average 1281 41.5% 1362 39.9% 445 39.5%
person your age: Above average 776 25.1% 849 24.9% 310 27.5%
Public speaking Highest 10% 248 8.0% 315 9.2% 113 10.0%
ability Total 3089 100.0% 3413 100.0% 1126 100.0%
27m. Rate yourself on Lowest 10% 14 0.5% 18 0.5% 2 0.2%
each trait compared Below average 170 5.5% 197 5.8% 87 7.7%
with the average
Average 1310 42.4% 1404 41.1% 435 38.7%
person your age:
Self‐confidence Above average 1208 39.1% 1373 40.2% 431 38.3%
(intellectual) Highest 10% 385 12.5% 421 12.3% 170 15.1%
Total 3087 100.0% 3413 100.0% 1125 100.0%
27n. Rate yourself on Lowest 10% 30 1.0% 40 1.2% 9 0.8%
each trait compared Below average 330 10.7% 365 10.7% 152 13.5%
with the average Average 1253 40.6% 1418 41.5% 428 38.0%
person your age: Above average 1097 35.5% 1173 34.3% 400 35.6%
Self‐confidence Highest 10% 378 12.2% 421 12.3% 136 12.1%
(social) Total 3088 100.0% 3417 100.0% 1125 100.0%
27o. Rate yourself on Lowest 10% 10 0.3% 12 0.4% 3 0.3%
each trait compared Below average 131 4.2% 173 5.1% 56 5.0%
with the average Average 1462 47.4% 1654 48.5% 461 41.0%
person your age: Above average 1133 36.7% 1187 34.8% 427 38.0%
Self‐understanding Highest 10% 351 11.4% 383 11.2% 178 15.8%
Total 3087 100.0% 3409 100.0% 1125 100.0%
27p. Rate yourself on Lowest 10% 88 2.9% 211 6.2% 58 5.2%
each trait compared Below average 438 14.2% 504 14.8% 157 14.0%
with the average Average 1407 45.7% 1573 46.2% 472 42.0%
person your age: Above average 828 26.9% 842 24.7% 320 28.4%
Spirituality Highest 10% 318 10.3% 276 8.1% 118 10.5%
Total 3079 100.0% 3406 100.0% 1125 100.0%
27q. Rate yourself on Lowest 10% 5 0.2% 15 0.4% 1 0.1%
each trait compared Below average 69 2.2% 89 2.6% 13 1.2%
with the average
Average 1042 33.8% 1238 36.3% 351 31.2%
person your age:
Understanding of Above average 1508 48.9% 1553 45.5% 540 48.0%
others Highest 10% 463 15.0% 515 15.1% 221 19.6%
Total 3087 100.0% 3410 100.0% 1126 100.0%
27r. Rate yourself on Lowest 10% 30 1.0% 34 1.0% 13 1.2%
each trait compared Below average 321 10.4% 345 10.1% 119 10.6%
with the average Average 1347 43.6% 1468 43.1% 473 42.0%
person your age: Above average 1075 34.8% 1218 35.7% 387 34.4%
Writing ability Highest 10% 316 10.2% 343 10.1% 134 11.9%
Total 3089 100.0% 3408 100.0% 1126 100.0%
Office of Institutional Research 14 January 2009
15. Year
1999 2001 2008
Question Response Options Count Col % Count Col % Count Col %
28a. Rate yourself on Lowest 10% 2 0.2%
each trait compared
Below average 27 2.4%
with the average
person your age: Average 388 34.4%
Ability to see the NA NA
Above average 482 42.8%
world from
someone else's Highest 10% 228 20.2%
perspective Total 1127 100.0%
28b. Rate yourself on Lowest 10% 1 0.1%
each trait compared
Below average 26 2.3%
with the average
person your age: Average 293 26.0%
Tolerance of others NA NA
Above average 511 45.3%
with different
beliefs Highest 10% 296 26.3%
Total 1127 100.0%
28c. Rate yourself on Lowest 10% 4 0.4%
each trait compared
Below average 74 6.6%
with the average
person your age: Average 395 35.0%
Openness to having NA NA
Above average 443 39.3%
my own views
challenged Highest 10% 211 18.7%
Total 1127 100.0%
28d. Rate yourself on Lowest 10% 3 0.3%
each trait compared
with the average Below average 60 5.3%
person your age: Average 376 33.4%
Ability to discuss NA NA
and negotiate Above average 442 39.3%
controversial issues
Highest 10% 245 21.8%
Total 1126 100.0%
28e. Rate yourself on Below average 11 1.0%
each trait compared
with the average Average 261 23.2%
person your age:
Ability to work Above average NA NA 527 46.8%
cooperatively with Highest 10% 328 29.1%
diverse people
Total 1127 100.0%
Office of Institutional Research 15 January 2009
16. Year
1999 2001 2008
Question Response Options Count Col % Count Col % Count Col %
29a. Father's highest level Grammar school or less 53 1.7% 31 0.9% 10 0.9%
of education Some high school 123 4.0% 128 3.8% 31 2.8%
High school graduate 906 29.5% 986 29.1% 276 24.6%
Postsecondary school
152 5.0% 152 4.5% 61 5.4%
other than college
Some college 607 19.8% 721 21.3% 223 19.9%
College degree 824 26.9% 891 26.3% 334 29.7%
Some graduate school 41 1.3% 38 1.1% 24 2.1%
Graduate degree 362 11.8% 437 12.9% 164 14.6%
Total 3068 100.0% 3384 100.0% 1123 100.0%
29b. Mother's highest Grammar school or less 50 1.6% 26 0.8% 3 0.3%
level of education Some high school 71 2.3% 60 1.8% 20 1.8%
High school graduate 1031 33.4% 1063 31.2% 253 22.5%
Postsecondary school
120 3.9% 134 3.9% 53 4.7%
other than college
Some college 670 21.7% 801 23.5% 269 23.9%
College degree 797 25.8% 909 26.7% 369 32.8%
Some graduate school 61 2.0% 48 1.4% 23 2.0%
Graduate degree 284 9.2% 362 10.6% 135 12.0%
Total 3084 100.0% 3403 100.0% 1125 100.0%
30a. How often in the Not at all 32 2.8%
past year have you: Occasionally 536 47.6%
NA NA
Ask questions in Frequently 559 49.6%
class Total 1127 100.0%
30b. How often in the Not at all 33 2.9%
past year have you:
Occasionally 479 42.5%
Support your NA NA
opinions with a Frequently 614 54.5%
logical argument Total 1126 100.0%
30c. How often in the Not at all 35 3.1%
past year have you:
Seek solutions to Occasionally 520 46.2%
NA NA
problems and Frequently 571 50.7%
explain them to
others Total 1126 100.0%
30d. How often in the Not at all 45 4.0%
past year have you:
Occasionally 487 43.3%
Revise your papers NA NA
to improve your Frequently 594 52.8%
writing Total 1126 100.0%
Office of Institutional Research 16 January 2009
17. Year
1999 2001 2008
Question Response Options Count Col % Count Col % Count Col %
30e. How often in the
Not at all 36 3.2%
past year have you:
Evaluate the quality Occasionally 647 57.5%
or reliability of NA NA
information you Frequently 443 39.3%
received
Total 1126 100.0%
30f. How often in the Not at all 63 5.6%
past year have you:
Occasionally 601 53.4%
Take a risk because NA NA
you felt you had Frequently 461 41.0%
more to gain Total 1125 100.0%
30g. How often in the Not at all 28 2.5%
past year have you:
Occasionally 599 53.2%
Seek alternative NA NA
solutions to a Frequently 499 44.3%
problem Total 1126 100.0%
30h. How often in the Not at all 271 24.1%
past year have you: Occasionally 630 56.0%
NA NA
Look up scientific Frequently 224 19.9%
research articles and Total 1125 100.0%
30i. How often in the Not at all 192 17.1%
past year have you:
Explore topics on Occasionally 635 56.4%
NA NA
your own, even Frequently 299 26.6%
though it was not
required for a class Total 1126 100.0%
30j. How often in the Not at all 29 2.6%
past year have you:
Occasionally 532 47.2%
Accept mistakes as NA NA
part of the learning Frequently 565 50.2%
process Total 1126 100.0%
30k. How often in the Not at all 53 4.7%
past year have you:
Occasionally 556 49.4%
Seek feedback on NA NA
your academic work Frequently 517 45.9%
Total 1126 100.0%
30l. How often in the Not at all 14 1.2%
past year have you: Occasionally 337 29.9%
NA NA
Take notes during Frequently 775 68.8%
class Total 1126 100.0%
Office of Institutional Research 17 January 2009