SlideShare a Scribd company logo
1 of 7
Download to read offline
SINGLE  ANSWER
Which  animal  is  coolest,  in  your  opinion?
Results  for  respondents  with  demographics.  Weighted  by  Age,  Gender,  Region.  (728  responses)  
Confidence  too  close  to  call.


    Shark                                                                                  34.1%  (+3.6  /  -­3.4)


    Turtle                                                                               33.0%  (+3.6  /  -­3.4)


     Bear                                                                                32.9%  (+3.6  /  -­3.4)


Metrics  only  apply  to  the  topline  results  for  this  question.  Filters  and  weighting  do  not  apply.

Impressions                                                    Responses                                             Response  Rate

6,271                                                          1,001                                                 16.0%
Response  Times                                                Responses  by  hour  of  day                          Responses  by  day  of  week
Median  response  time  is  8.9  seconds                       Local  times  of  respondents                         Local  times  of  respondents


               All  (728)

  Shark        34.1%  (+3.6  /  -­3.4)

  Turtle       33.0%  (+3.6  /  -­3.4)

    Bear       32.9%  (+3.6  /  -­3.4)

  Methodology:  Conducted  by  Google  Consumer  Surveys,  September  17,  2012  -­  September  19,  2012
  and  based  on  728  online  responses.  Sample:  National  adult  Internet  population.
SINGLE  ANSWER
Which  animal  is  coolest,  in  your  opinion?
Results  for  respondents  with  demographics.  Weighted  by  Age,  Region.  (728  responses)  

           Shark  (247  responses)
                                                                              Overall

     Male                                                                                       36.5%  (+5.5  /  -­5.2)


  Female                                                                           31.8%  (+4.8  /  -­4.4)


           Turtle  (244  responses)
                                                                            Overall

     Male                                                                       29.7%  (+5.3  /  -­4.8)


  Female                                                                                      36.1%  (+4.9  /  -­4.6)


           Bear  (237  responses)
                                                                            Overall

     Male                                                                                 33.8%  (+5.5  /  -­5.1)


  Female                                                                              32.1%  (+4.8  /  -­4.4)


Metrics  only  apply  to  the  topline  results  for  this  question.  Filters  and  weighting  do  not  apply.

Impressions                                                    Responses                                                          Response  Rate

6,271                                                          1,001                                                              16.0%
Response  Times                                                Responses  by  hour  of  day                                       Responses  by  day  of  week
Median  response  time  is  8.9  seconds                       Local  times  of  respondents                                      Local  times  of  respondents


               Men  (312)                                                                               Women  (416)

  Shark        36.5%  (+5.5  /  -­5.2)                                                                  31.8%  (+4.8  /  -­4.4)

  Turtle       29.7%  (+5.3  /  -­4.8)                                                                  36.1%  (+4.9  /  -­4.6)

    Bear       33.8%  (+5.5  /  -­5.1)                                                                  32.1%  (+4.8  /  -­4.4)

  Methodology:  Conducted  by  Google  Consumer  Surveys,  September  17,  2012  -­  September  19,  2012
  and  based  on  728  online  responses.  Sample:  National  adult  Internet  population.
SINGLE  ANSWER
Which  animal  is  coolest,  in  your  opinion?
Results  for  respondents  with  demographics.  Weighted  by  Region.  (728  responses)  

           Shark  (247  responses)
                                                                  Overall

  18-­24                                                                             35.6%  (+8.5  /  -­7.7)


  25-­34                                                                                37.7%  (+8.0  /  -­7.4)


  35-­44                                                                                  37.9%  (+9.0  /  -­8.2)


  45-­54                                                                          34.7%  (+8.0  /  -­7.3)


  55-­64                                                        24.2%  (+8.4  /  -­6.8)


     65+                                                                      28.4%  (+11.6  /  -­9.3)


           Turtle  (244  responses)
                                                                 Overall

  18-­24                                                                                       40.8%  (+8.6  /  -­8.0)


  25-­34                                                                                37.5%  (+8.0  /  -­7.4)


  35-­44                                                             26.3%  (+8.7  /  -­7.1)


  45-­54                                                                      31.9%  (+8.1  /  -­7.1)


  55-­64                                                                                36.2%  (+9.0  /  -­8.1)


     65+                                                                     27.7%  (+11.6  /  -­9.2)


           Bear  (237  responses)
                                                                Overall

  18-­24                                                      23.6%  (+7.9  /  -­6.4)


  25-­34                                                        24.8%  (+7.5  /  -­6.3)


  35-­44                                                                              35.8%  (+9.0  /  -­8.1)


  45-­54                                                                        33.4%  (+8.1  /  -­7.2)


  55-­64                                                                                     39.6%  (+8.9  /  -­8.2)


     65+                                                                                                  44.0%  (+11.9  /  -­11.2)


Metrics  only  apply  to  the  topline  results  for  this  question.  Filters  and  weighting  do  not  apply.

Impressions                                                     Responses                                                             Response  Rate

6,271                                                           1,001                                                                 16.0%
Response  Times                                                 Responses  by  hour  of  day                                          Responses  by  day  of  week
Median  response  time  is  8.9  seconds                        Local  times  of  respondents                                         Local  times  of  respondents


               18-­24  year-­olds          25-­34  year-­olds              35-­44  year-­olds               45-­54  year-­olds          55-­64  year-­olds            65+  year-­olds
               (129)                       (149)                           (118)                            (147)                       (118)                         (67)


  Shark        35.6%  (+8.5  /  -­7.7)     37.7%  (+8.0  /  -­7.4)         37.9%  (+9.0  /  -­8.2)          34.7%  (+8.0  /  -­7.3)     24.2%  (+8.4  /  -­6.8)       28.4%  (+11.6  /
                                                                                                                                                                      -­9.3)


  Turtle       40.8%  (+8.6  /  -­8.0)     37.5%  (+8.0  /  -­7.4)         26.3%  (+8.7  /  -­7.1)          31.9%  (+8.1  /  -­7.1)     36.2%  (+9.0  /  -­8.1)       27.7%  (+11.6  /
                                                                                                                                                                      -­9.2)


    Bear       23.6%  (+7.9  /  -­6.4)     24.8%  (+7.5  /  -­6.3)         35.8%  (+9.0  /  -­8.1)          33.4%  (+8.1  /  -­7.2)     39.6%  (+8.9  /  -­8.2)       44.0%  (+11.9  /
                                                                                                                                                                      -­11.2)

  Methodology:  Conducted  by  Google  Consumer  Surveys,  September  17,  2012  -­  September  19,  2012
  and  based  on  728  online  responses.  Sample:  National  adult  Internet  population.
SINGLE  ANSWER
Which  animal  is  coolest,  in  your  opinion?
182  insights  investigated.  3.6  false  discoveries  expected  on  average  (p  value:  0.02).


 55-­64  year-­olds  picked  Bear  more  than
 those  aged  18-­24.


                                                                                       39.6%

                                                     23.6%
SINGLE  ANSWER
Which  animal  is  coolest,  in  your  opinion?
Results  for  US.  Weighted  by  Age,  Gender.  (728  responses)  

           Shark  (247  responses)
                                                                       Overall

     the  US  Midwest                                                          32.1%  (+7.8  /  -­6.9)


   the  US  Northeast                                                     27.7%  (+8.7  /  -­7.3)


        the  US  South                                                           34.2%  (+6.1  /  -­5.6)


         the  US  West                                                                      40.7%  (+7.6  /  -­7.1)


           Turtle  (244  responses)
                                                                     Overall

     the  US  Midwest                                                      29.9%  (+7.6  /  -­6.6)


   the  US  Northeast                                                                   37.2%  (+8.8  /  -­8.1)


        the  US  South                                                           34.0%  (+6.1  /  -­5.6)


         the  US  West                                                      30.9%  (+7.2  /  -­6.4)


           Bear  (237  responses)
                                                                     Overall

     the  US  Midwest                                                                   38.0%  (+7.8  /  -­7.2)


   the  US  Northeast                                                                 35.1%  (+9.0  /  -­8.1)


        the  US  South                                                     31.8%  (+5.9  /  -­5.4)


         the  US  West                                                   28.4%  (+7.5  /  -­6.4)


Metrics  only  apply  to  the  topline  results  for  this  question.  Filters  and  weighting  do  not  apply.

Impressions                                                    Responses                                                             Response  Rate

6,271                                                          1,001                                                                 16.0%
Response  Times                                                Responses  by  hour  of  day                                          Responses  by  day  of  week
Median  response  time  is  8.9  seconds                       Local  times  of  respondents                                         Local  times  of  respondents


               The  US  Midwest  (164)                     The  US  Northeast  (133)                            The  US  South  (260)                    The  US  West  (171)

  Shark        32.1%  (+7.8  /  -­6.9)                     27.7%  (+8.7  /  -­7.3)                              34.2%  (+6.1  /  -­5.6)                  40.7%  (+7.6  /  -­7.1)

  Turtle       29.9%  (+7.6  /  -­6.6)                     37.2%  (+8.8  /  -­8.1)                              34.0%  (+6.1  /  -­5.6)                  30.9%  (+7.2  /  -­6.4)

    Bear       38.0%  (+7.8  /  -­7.2)                     35.1%  (+9.0  /  -­8.1)                              31.8%  (+5.9  /  -­5.4)                  28.4%  (+7.5  /  -­6.4)

  Methodology:  Conducted  by  Google  Consumer  Surveys,  September  17,  2012  -­  September  19,  2012
  and  based  on  728  online  responses.  Sample:  National  adult  Internet  population.
SINGLE  ANSWER
Which  animal  is  coolest,  in  your  opinion?
Results  for  respondents  with  demographics.  $0-­$24,999  was  weighted  by  Age;;  $75,000-­$99,999  was  weighted  by
Region;;  $50,000-­$74,999  was  weighted  by  Age,  Gender;;  $25,000-­$49,999  was  weighted  by  Age,  Region;;  $100,000-­
$149,999,  $150,000+  were  not  weighted.  (750  responses)  

           Shark  (249  responses)
                                                               Overall

            $​0-­$24,999                                                  32.4%  (+10.7  /  -­9.1)


     $​25,000-­$49,999                                                34.3%  (+4.7  /  -­4.4)


     $​50,000-­$74,999                                                31.1%  (+7.7  /  -­6.8)


     $​75,000-­$99,999                                                          34.4%  (+14.2  /  -­11.9)


  $​100,000-­$149,999                                                                                41.7%  (+26.4  /  -­22.3)


             $150,000+        Insufficient  data


           Turtle  (248  responses)
                                                              Overall

            $​0-­$24,999                                                       37.2%  (+10.8  /  -­9.6)


     $​25,000-­$49,999                                           32.0%  (+4.7  /  -­4.3)


     $​50,000-­$74,999                                                     36.0%  (+7.9  /  -­7.2)


     $​75,000-­$99,999                                                     28.5%  (+15.5  /  -­11.7)


  $​100,000-­$149,999                                                               25.0%  (+28.2  /  -­16.1)


             $150,000+        Insufficient  data


           Bear  (241  responses)
                                                              Overall

            $​0-­$24,999                                                30.4%  (+10.9  /  -­9.1)


     $​25,000-­$49,999                                                33.8%  (+4.7  /  -­4.4)


     $​50,000-­$74,999                                                  32.9%  (+7.9  /  -­7.0)


     $​75,000-­$99,999                                                             37.1%  (+14.9  /  -­12.8)


  $​100,000-­$149,999                                                                       33.3%  (+27.6  /  -­19.5)


             $150,000+        Insufficient  data


Metrics  only  apply  to  the  topline  results  for  this  question.  Filters  and  weighting  do  not  apply.

Impressions                                                      Responses                                                        Response  Rate

6,271                                                            1,001                                                            16.0%
Response  Times                                                  Responses  by  hour  of  day                                     Responses  by  day  of  week
Median  response  time  is  8.9  seconds                         Local  times  of  respondents                                    Local  times  of  respondents


               People  earning              People  earning                  People  earning                   People  earning       People  earning              People
               $0-­24K  (84)                $25-­49K  (427)                  $50-­74K  (184)                   $75-­99K  (43)        $100-­149K  (12)             earning
                                                                                                                                                                  $150K+  


  Shark        32.4%  (+10.7  /             34.3%  (+4.7  /  -­4.4)          31.1%  (+7.7  /  -­6.8)           34.4%  (+14.2  /      41.7%  (+26.4  /             Insufficient  data
               -­9.1)                                                                                          -­11.9)               -­22.3)


  Turtle       37.2%  (+10.8  /             32.0%  (+4.7  /  -­4.3)          36.0%  (+7.9  /  -­7.2)           28.5%  (+15.5  /      25.0%  (+28.2  /             Insufficient  data
               -­9.6)                                                                                          -­11.7)               -­16.1)


    Bear       30.4%  (+10.9  /             33.8%  (+4.7  /  -­4.4)          32.9%  (+7.9  /  -­7.0)           37.1%  (+14.9  /      33.3%  (+27.6  /             Insufficient  data
               -­9.1)                                                                                          -­12.8)               -­19.5)
Methodology:  Conducted  by  Google  Consumer  Surveys,  September  17,  2012  -­  September  19,  2012
and  based  on  750  online  responses.  Sample:  National  adult  Internet  population.

More Related Content

Viewers also liked

Viewers also liked (20)

4101 2
4101 24101 2
4101 2
 
Useful web resource links
Useful web resource linksUseful web resource links
Useful web resource links
 
2nd Anniversary Celebration
2nd Anniversary Celebration2nd Anniversary Celebration
2nd Anniversary Celebration
 
love you mum-Pandas
love you mum-Pandaslove you mum-Pandas
love you mum-Pandas
 
Toolbox financial incentives income distribution-final
Toolbox financial incentives   income distribution-finalToolbox financial incentives   income distribution-final
Toolbox financial incentives income distribution-final
 
Designer1995 STUDIO
Designer1995 STUDIODesigner1995 STUDIO
Designer1995 STUDIO
 
Propose
ProposePropose
Propose
 
MSDS DermaMix-Res
MSDS DermaMix-ResMSDS DermaMix-Res
MSDS DermaMix-Res
 
Neuroinf
NeuroinfNeuroinf
Neuroinf
 
Doug Smith On Line Presentation
Doug Smith On Line PresentationDoug Smith On Line Presentation
Doug Smith On Line Presentation
 
Fotografias Fantásticas
Fotografias FantásticasFotografias Fantásticas
Fotografias Fantásticas
 
Turing machine
Turing machineTuring machine
Turing machine
 
Walter S Arnold Stonework
Walter S Arnold StoneworkWalter S Arnold Stonework
Walter S Arnold Stonework
 
Olimpiada sibiu 2009 5_6
Olimpiada sibiu 2009 5_6Olimpiada sibiu 2009 5_6
Olimpiada sibiu 2009 5_6
 
Estupidez humana
Estupidez humanaEstupidez humana
Estupidez humana
 
Batch rename2
Batch rename2Batch rename2
Batch rename2
 
Ijetcas14 370
Ijetcas14 370Ijetcas14 370
Ijetcas14 370
 
Ch03
Ch03Ch03
Ch03
 
dotnet development company
dotnet development companydotnet development company
dotnet development company
 
Leveraging Ict 97 2003 Version
Leveraging Ict 97 2003 VersionLeveraging Ict 97 2003 Version
Leveraging Ict 97 2003 Version
 

Recently uploaded

JORNADA 5 LIGA MURO 2024INSUGURACION.pdf
JORNADA 5 LIGA MURO 2024INSUGURACION.pdfJORNADA 5 LIGA MURO 2024INSUGURACION.pdf
JORNADA 5 LIGA MURO 2024INSUGURACION.pdfArturo Pacheco Alvarez
 
Slovenia Vs Serbia UEFA Euro 2024 Fixture Guide Every Fixture Detailed.docx
Slovenia Vs Serbia UEFA Euro 2024 Fixture Guide Every Fixture Detailed.docxSlovenia Vs Serbia UEFA Euro 2024 Fixture Guide Every Fixture Detailed.docx
Slovenia Vs Serbia UEFA Euro 2024 Fixture Guide Every Fixture Detailed.docxWorld Wide Tickets And Hospitality
 
Croatia vs Italy Euro Cup 2024 Three pitfalls for Spalletti’s Italy in Group ...
Croatia vs Italy Euro Cup 2024 Three pitfalls for Spalletti’s Italy in Group ...Croatia vs Italy Euro Cup 2024 Three pitfalls for Spalletti’s Italy in Group ...
Croatia vs Italy Euro Cup 2024 Three pitfalls for Spalletti’s Italy in Group ...Eticketing.co
 
CALL ON ➥8923113531 🔝Call Girls Chinhat Lucknow best sexual service
CALL ON ➥8923113531 🔝Call Girls Chinhat Lucknow best sexual serviceCALL ON ➥8923113531 🔝Call Girls Chinhat Lucknow best sexual service
CALL ON ➥8923113531 🔝Call Girls Chinhat Lucknow best sexual serviceanilsa9823
 
+971565801893>>SAFE AND ORIGINAL ABORTION PILLS FOR SALE IN DUBAI AND ABUDHAB...
+971565801893>>SAFE AND ORIGINAL ABORTION PILLS FOR SALE IN DUBAI AND ABUDHAB...+971565801893>>SAFE AND ORIGINAL ABORTION PILLS FOR SALE IN DUBAI AND ABUDHAB...
+971565801893>>SAFE AND ORIGINAL ABORTION PILLS FOR SALE IN DUBAI AND ABUDHAB...Health
 
Spain Vs Italy 20 players confirmed for Spain's Euro 2024 squad, and three po...
Spain Vs Italy 20 players confirmed for Spain's Euro 2024 squad, and three po...Spain Vs Italy 20 players confirmed for Spain's Euro 2024 squad, and three po...
Spain Vs Italy 20 players confirmed for Spain's Euro 2024 squad, and three po...World Wide Tickets And Hospitality
 
9990611130 Find & Book Russian Call Girls In Ghazipur
9990611130 Find & Book Russian Call Girls In Ghazipur9990611130 Find & Book Russian Call Girls In Ghazipur
9990611130 Find & Book Russian Call Girls In GhazipurGenuineGirls
 
08448380779 Call Girls In IIT Women Seeking Men
08448380779 Call Girls In IIT Women Seeking Men08448380779 Call Girls In IIT Women Seeking Men
08448380779 Call Girls In IIT Women Seeking MenDelhi Call girls
 
CALL ON ➥8923113531 🔝Call Girls Saharaganj Lucknow best Female service 🦺
CALL ON ➥8923113531 🔝Call Girls Saharaganj Lucknow best Female service  🦺CALL ON ➥8923113531 🔝Call Girls Saharaganj Lucknow best Female service  🦺
CALL ON ➥8923113531 🔝Call Girls Saharaganj Lucknow best Female service 🦺anilsa9823
 
CALL ON ➥8923113531 🔝Call Girls Telibagh Lucknow best Night Fun service 🧣
CALL ON ➥8923113531 🔝Call Girls Telibagh Lucknow best Night Fun service  🧣CALL ON ➥8923113531 🔝Call Girls Telibagh Lucknow best Night Fun service  🧣
CALL ON ➥8923113531 🔝Call Girls Telibagh Lucknow best Night Fun service 🧣anilsa9823
 
Atlanta Dream Exec Dan Gadd on Driving Fan Engagement and Growth, Serving the...
Atlanta Dream Exec Dan Gadd on Driving Fan Engagement and Growth, Serving the...Atlanta Dream Exec Dan Gadd on Driving Fan Engagement and Growth, Serving the...
Atlanta Dream Exec Dan Gadd on Driving Fan Engagement and Growth, Serving the...Neil Horowitz
 
( Sports training) All topic (MCQs).pptx
( Sports training) All topic (MCQs).pptx( Sports training) All topic (MCQs).pptx
( Sports training) All topic (MCQs).pptxParshotamGupta1
 
Top Call Girls In Jankipuram ( Lucknow ) 🔝 8923113531 🔝 Cash Payment
Top Call Girls In Jankipuram ( Lucknow  ) 🔝 8923113531 🔝  Cash PaymentTop Call Girls In Jankipuram ( Lucknow  ) 🔝 8923113531 🔝  Cash Payment
Top Call Girls In Jankipuram ( Lucknow ) 🔝 8923113531 🔝 Cash Paymentanilsa9823
 
ALL NFL NETWORK CONTACTS- April 29, 2024
ALL NFL NETWORK CONTACTS- April 29, 2024ALL NFL NETWORK CONTACTS- April 29, 2024
ALL NFL NETWORK CONTACTS- April 29, 2024Brian Slack
 
Albania Vs Spain Albania is Loaded with Defensive Talent on their Roster.docx
Albania Vs Spain Albania is Loaded with Defensive Talent on their Roster.docxAlbania Vs Spain Albania is Loaded with Defensive Talent on their Roster.docx
Albania Vs Spain Albania is Loaded with Defensive Talent on their Roster.docxWorld Wide Tickets And Hospitality
 
Hire 💕 8617697112 Kasauli Call Girls Service Call Girls Agency
Hire 💕 8617697112 Kasauli Call Girls Service Call Girls AgencyHire 💕 8617697112 Kasauli Call Girls Service Call Girls Agency
Hire 💕 8617697112 Kasauli Call Girls Service Call Girls AgencyNitya salvi
 
Spain Vs Albania- Spain at risk of being thrown out of Euro 2024 with Tournam...
Spain Vs Albania- Spain at risk of being thrown out of Euro 2024 with Tournam...Spain Vs Albania- Spain at risk of being thrown out of Euro 2024 with Tournam...
Spain Vs Albania- Spain at risk of being thrown out of Euro 2024 with Tournam...World Wide Tickets And Hospitality
 
08448380779 Call Girls In Karol Bagh Women Seeking Men
08448380779 Call Girls In Karol Bagh Women Seeking Men08448380779 Call Girls In Karol Bagh Women Seeking Men
08448380779 Call Girls In Karol Bagh Women Seeking MenDelhi Call girls
 
Technical Data | Sig Sauer Easy6 BDX 1-6x24 | Optics Trade
Technical Data | Sig Sauer Easy6 BDX 1-6x24 | Optics TradeTechnical Data | Sig Sauer Easy6 BDX 1-6x24 | Optics Trade
Technical Data | Sig Sauer Easy6 BDX 1-6x24 | Optics TradeOptics-Trade
 

Recently uploaded (20)

JORNADA 5 LIGA MURO 2024INSUGURACION.pdf
JORNADA 5 LIGA MURO 2024INSUGURACION.pdfJORNADA 5 LIGA MURO 2024INSUGURACION.pdf
JORNADA 5 LIGA MURO 2024INSUGURACION.pdf
 
Slovenia Vs Serbia UEFA Euro 2024 Fixture Guide Every Fixture Detailed.docx
Slovenia Vs Serbia UEFA Euro 2024 Fixture Guide Every Fixture Detailed.docxSlovenia Vs Serbia UEFA Euro 2024 Fixture Guide Every Fixture Detailed.docx
Slovenia Vs Serbia UEFA Euro 2024 Fixture Guide Every Fixture Detailed.docx
 
Croatia vs Italy Euro Cup 2024 Three pitfalls for Spalletti’s Italy in Group ...
Croatia vs Italy Euro Cup 2024 Three pitfalls for Spalletti’s Italy in Group ...Croatia vs Italy Euro Cup 2024 Three pitfalls for Spalletti’s Italy in Group ...
Croatia vs Italy Euro Cup 2024 Three pitfalls for Spalletti’s Italy in Group ...
 
CALL ON ➥8923113531 🔝Call Girls Chinhat Lucknow best sexual service
CALL ON ➥8923113531 🔝Call Girls Chinhat Lucknow best sexual serviceCALL ON ➥8923113531 🔝Call Girls Chinhat Lucknow best sexual service
CALL ON ➥8923113531 🔝Call Girls Chinhat Lucknow best sexual service
 
+971565801893>>SAFE AND ORIGINAL ABORTION PILLS FOR SALE IN DUBAI AND ABUDHAB...
+971565801893>>SAFE AND ORIGINAL ABORTION PILLS FOR SALE IN DUBAI AND ABUDHAB...+971565801893>>SAFE AND ORIGINAL ABORTION PILLS FOR SALE IN DUBAI AND ABUDHAB...
+971565801893>>SAFE AND ORIGINAL ABORTION PILLS FOR SALE IN DUBAI AND ABUDHAB...
 
Spain Vs Italy 20 players confirmed for Spain's Euro 2024 squad, and three po...
Spain Vs Italy 20 players confirmed for Spain's Euro 2024 squad, and three po...Spain Vs Italy 20 players confirmed for Spain's Euro 2024 squad, and three po...
Spain Vs Italy 20 players confirmed for Spain's Euro 2024 squad, and three po...
 
9990611130 Find & Book Russian Call Girls In Ghazipur
9990611130 Find & Book Russian Call Girls In Ghazipur9990611130 Find & Book Russian Call Girls In Ghazipur
9990611130 Find & Book Russian Call Girls In Ghazipur
 
08448380779 Call Girls In IIT Women Seeking Men
08448380779 Call Girls In IIT Women Seeking Men08448380779 Call Girls In IIT Women Seeking Men
08448380779 Call Girls In IIT Women Seeking Men
 
CALL ON ➥8923113531 🔝Call Girls Saharaganj Lucknow best Female service 🦺
CALL ON ➥8923113531 🔝Call Girls Saharaganj Lucknow best Female service  🦺CALL ON ➥8923113531 🔝Call Girls Saharaganj Lucknow best Female service  🦺
CALL ON ➥8923113531 🔝Call Girls Saharaganj Lucknow best Female service 🦺
 
CALL ON ➥8923113531 🔝Call Girls Telibagh Lucknow best Night Fun service 🧣
CALL ON ➥8923113531 🔝Call Girls Telibagh Lucknow best Night Fun service  🧣CALL ON ➥8923113531 🔝Call Girls Telibagh Lucknow best Night Fun service  🧣
CALL ON ➥8923113531 🔝Call Girls Telibagh Lucknow best Night Fun service 🧣
 
Atlanta Dream Exec Dan Gadd on Driving Fan Engagement and Growth, Serving the...
Atlanta Dream Exec Dan Gadd on Driving Fan Engagement and Growth, Serving the...Atlanta Dream Exec Dan Gadd on Driving Fan Engagement and Growth, Serving the...
Atlanta Dream Exec Dan Gadd on Driving Fan Engagement and Growth, Serving the...
 
( Sports training) All topic (MCQs).pptx
( Sports training) All topic (MCQs).pptx( Sports training) All topic (MCQs).pptx
( Sports training) All topic (MCQs).pptx
 
Call Girls Service Noida Extension @9999965857 Delhi 🫦 No Advance VVIP 🍎 SER...
Call Girls Service Noida Extension @9999965857 Delhi 🫦 No Advance  VVIP 🍎 SER...Call Girls Service Noida Extension @9999965857 Delhi 🫦 No Advance  VVIP 🍎 SER...
Call Girls Service Noida Extension @9999965857 Delhi 🫦 No Advance VVIP 🍎 SER...
 
Top Call Girls In Jankipuram ( Lucknow ) 🔝 8923113531 🔝 Cash Payment
Top Call Girls In Jankipuram ( Lucknow  ) 🔝 8923113531 🔝  Cash PaymentTop Call Girls In Jankipuram ( Lucknow  ) 🔝 8923113531 🔝  Cash Payment
Top Call Girls In Jankipuram ( Lucknow ) 🔝 8923113531 🔝 Cash Payment
 
ALL NFL NETWORK CONTACTS- April 29, 2024
ALL NFL NETWORK CONTACTS- April 29, 2024ALL NFL NETWORK CONTACTS- April 29, 2024
ALL NFL NETWORK CONTACTS- April 29, 2024
 
Albania Vs Spain Albania is Loaded with Defensive Talent on their Roster.docx
Albania Vs Spain Albania is Loaded with Defensive Talent on their Roster.docxAlbania Vs Spain Albania is Loaded with Defensive Talent on their Roster.docx
Albania Vs Spain Albania is Loaded with Defensive Talent on their Roster.docx
 
Hire 💕 8617697112 Kasauli Call Girls Service Call Girls Agency
Hire 💕 8617697112 Kasauli Call Girls Service Call Girls AgencyHire 💕 8617697112 Kasauli Call Girls Service Call Girls Agency
Hire 💕 8617697112 Kasauli Call Girls Service Call Girls Agency
 
Spain Vs Albania- Spain at risk of being thrown out of Euro 2024 with Tournam...
Spain Vs Albania- Spain at risk of being thrown out of Euro 2024 with Tournam...Spain Vs Albania- Spain at risk of being thrown out of Euro 2024 with Tournam...
Spain Vs Albania- Spain at risk of being thrown out of Euro 2024 with Tournam...
 
08448380779 Call Girls In Karol Bagh Women Seeking Men
08448380779 Call Girls In Karol Bagh Women Seeking Men08448380779 Call Girls In Karol Bagh Women Seeking Men
08448380779 Call Girls In Karol Bagh Women Seeking Men
 
Technical Data | Sig Sauer Easy6 BDX 1-6x24 | Optics Trade
Technical Data | Sig Sauer Easy6 BDX 1-6x24 | Optics TradeTechnical Data | Sig Sauer Easy6 BDX 1-6x24 | Optics Trade
Technical Data | Sig Sauer Easy6 BDX 1-6x24 | Optics Trade
 

Bears Vs. Sharks Vs. Turtles

  • 1. SINGLE  ANSWER Which  animal  is  coolest,  in  your  opinion? Results  for  respondents  with  demographics.  Weighted  by  Age,  Gender,  Region.  (728  responses)   Confidence  too  close  to  call. Shark 34.1%  (+3.6  /  -­3.4) Turtle 33.0%  (+3.6  /  -­3.4) Bear 32.9%  (+3.6  /  -­3.4) Metrics  only  apply  to  the  topline  results  for  this  question.  Filters  and  weighting  do  not  apply. Impressions Responses Response  Rate 6,271 1,001 16.0% Response  Times Responses  by  hour  of  day Responses  by  day  of  week Median  response  time  is  8.9  seconds Local  times  of  respondents Local  times  of  respondents All  (728) Shark 34.1%  (+3.6  /  -­3.4) Turtle 33.0%  (+3.6  /  -­3.4) Bear 32.9%  (+3.6  /  -­3.4) Methodology:  Conducted  by  Google  Consumer  Surveys,  September  17,  2012  -­  September  19,  2012 and  based  on  728  online  responses.  Sample:  National  adult  Internet  population.
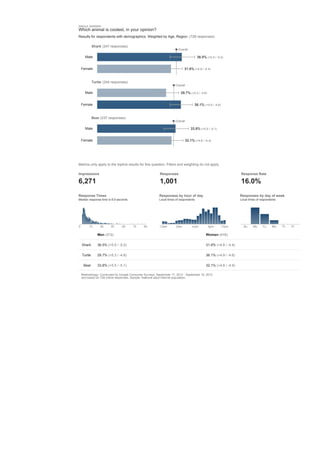
  • 2. SINGLE  ANSWER Which  animal  is  coolest,  in  your  opinion? Results  for  respondents  with  demographics.  Weighted  by  Age,  Region.  (728  responses)   Shark  (247  responses) Overall Male 36.5%  (+5.5  /  -­5.2) Female 31.8%  (+4.8  /  -­4.4) Turtle  (244  responses) Overall Male 29.7%  (+5.3  /  -­4.8) Female 36.1%  (+4.9  /  -­4.6) Bear  (237  responses) Overall Male 33.8%  (+5.5  /  -­5.1) Female 32.1%  (+4.8  /  -­4.4) Metrics  only  apply  to  the  topline  results  for  this  question.  Filters  and  weighting  do  not  apply. Impressions Responses Response  Rate 6,271 1,001 16.0% Response  Times Responses  by  hour  of  day Responses  by  day  of  week Median  response  time  is  8.9  seconds Local  times  of  respondents Local  times  of  respondents Men  (312) Women  (416) Shark 36.5%  (+5.5  /  -­5.2) 31.8%  (+4.8  /  -­4.4) Turtle 29.7%  (+5.3  /  -­4.8) 36.1%  (+4.9  /  -­4.6) Bear 33.8%  (+5.5  /  -­5.1) 32.1%  (+4.8  /  -­4.4) Methodology:  Conducted  by  Google  Consumer  Surveys,  September  17,  2012  -­  September  19,  2012 and  based  on  728  online  responses.  Sample:  National  adult  Internet  population.
  • 3. SINGLE  ANSWER Which  animal  is  coolest,  in  your  opinion? Results  for  respondents  with  demographics.  Weighted  by  Region.  (728  responses)   Shark  (247  responses) Overall 18-­24 35.6%  (+8.5  /  -­7.7) 25-­34 37.7%  (+8.0  /  -­7.4) 35-­44 37.9%  (+9.0  /  -­8.2) 45-­54 34.7%  (+8.0  /  -­7.3) 55-­64 24.2%  (+8.4  /  -­6.8) 65+ 28.4%  (+11.6  /  -­9.3) Turtle  (244  responses) Overall 18-­24 40.8%  (+8.6  /  -­8.0) 25-­34 37.5%  (+8.0  /  -­7.4) 35-­44 26.3%  (+8.7  /  -­7.1) 45-­54 31.9%  (+8.1  /  -­7.1) 55-­64 36.2%  (+9.0  /  -­8.1) 65+ 27.7%  (+11.6  /  -­9.2) Bear  (237  responses) Overall 18-­24 23.6%  (+7.9  /  -­6.4) 25-­34 24.8%  (+7.5  /  -­6.3) 35-­44 35.8%  (+9.0  /  -­8.1) 45-­54 33.4%  (+8.1  /  -­7.2) 55-­64 39.6%  (+8.9  /  -­8.2) 65+ 44.0%  (+11.9  /  -­11.2) Metrics  only  apply  to  the  topline  results  for  this  question.  Filters  and  weighting  do  not  apply. Impressions Responses Response  Rate 6,271 1,001 16.0% Response  Times Responses  by  hour  of  day Responses  by  day  of  week Median  response  time  is  8.9  seconds Local  times  of  respondents Local  times  of  respondents 18-­24  year-­olds 25-­34  year-­olds 35-­44  year-­olds 45-­54  year-­olds 55-­64  year-­olds 65+  year-­olds (129) (149) (118) (147) (118) (67) Shark 35.6%  (+8.5  /  -­7.7) 37.7%  (+8.0  /  -­7.4) 37.9%  (+9.0  /  -­8.2) 34.7%  (+8.0  /  -­7.3) 24.2%  (+8.4  /  -­6.8) 28.4%  (+11.6  / -­9.3) Turtle 40.8%  (+8.6  /  -­8.0) 37.5%  (+8.0  /  -­7.4) 26.3%  (+8.7  /  -­7.1) 31.9%  (+8.1  /  -­7.1) 36.2%  (+9.0  /  -­8.1) 27.7%  (+11.6  / -­9.2) Bear 23.6%  (+7.9  /  -­6.4) 24.8%  (+7.5  /  -­6.3) 35.8%  (+9.0  /  -­8.1) 33.4%  (+8.1  /  -­7.2) 39.6%  (+8.9  /  -­8.2) 44.0%  (+11.9  / -­11.2) Methodology:  Conducted  by  Google  Consumer  Surveys,  September  17,  2012  -­  September  19,  2012 and  based  on  728  online  responses.  Sample:  National  adult  Internet  population.
  • 4. SINGLE  ANSWER Which  animal  is  coolest,  in  your  opinion? 182  insights  investigated.  3.6  false  discoveries  expected  on  average  (p  value:  0.02). 55-­64  year-­olds  picked  Bear  more  than those  aged  18-­24. 39.6% 23.6%
  • 5. SINGLE  ANSWER Which  animal  is  coolest,  in  your  opinion? Results  for  US.  Weighted  by  Age,  Gender.  (728  responses)   Shark  (247  responses) Overall the  US  Midwest 32.1%  (+7.8  /  -­6.9) the  US  Northeast 27.7%  (+8.7  /  -­7.3) the  US  South 34.2%  (+6.1  /  -­5.6) the  US  West 40.7%  (+7.6  /  -­7.1) Turtle  (244  responses) Overall the  US  Midwest 29.9%  (+7.6  /  -­6.6) the  US  Northeast 37.2%  (+8.8  /  -­8.1) the  US  South 34.0%  (+6.1  /  -­5.6) the  US  West 30.9%  (+7.2  /  -­6.4) Bear  (237  responses) Overall the  US  Midwest 38.0%  (+7.8  /  -­7.2) the  US  Northeast 35.1%  (+9.0  /  -­8.1) the  US  South 31.8%  (+5.9  /  -­5.4) the  US  West 28.4%  (+7.5  /  -­6.4) Metrics  only  apply  to  the  topline  results  for  this  question.  Filters  and  weighting  do  not  apply. Impressions Responses Response  Rate 6,271 1,001 16.0% Response  Times Responses  by  hour  of  day Responses  by  day  of  week Median  response  time  is  8.9  seconds Local  times  of  respondents Local  times  of  respondents The  US  Midwest  (164) The  US  Northeast  (133) The  US  South  (260) The  US  West  (171) Shark 32.1%  (+7.8  /  -­6.9) 27.7%  (+8.7  /  -­7.3) 34.2%  (+6.1  /  -­5.6) 40.7%  (+7.6  /  -­7.1) Turtle 29.9%  (+7.6  /  -­6.6) 37.2%  (+8.8  /  -­8.1) 34.0%  (+6.1  /  -­5.6) 30.9%  (+7.2  /  -­6.4) Bear 38.0%  (+7.8  /  -­7.2) 35.1%  (+9.0  /  -­8.1) 31.8%  (+5.9  /  -­5.4) 28.4%  (+7.5  /  -­6.4) Methodology:  Conducted  by  Google  Consumer  Surveys,  September  17,  2012  -­  September  19,  2012 and  based  on  728  online  responses.  Sample:  National  adult  Internet  population.
  • 6. SINGLE  ANSWER Which  animal  is  coolest,  in  your  opinion? Results  for  respondents  with  demographics.  $0-­$24,999  was  weighted  by  Age;;  $75,000-­$99,999  was  weighted  by Region;;  $50,000-­$74,999  was  weighted  by  Age,  Gender;;  $25,000-­$49,999  was  weighted  by  Age,  Region;;  $100,000-­ $149,999,  $150,000+  were  not  weighted.  (750  responses)   Shark  (249  responses) Overall $​0-­$24,999 32.4%  (+10.7  /  -­9.1) $​25,000-­$49,999 34.3%  (+4.7  /  -­4.4) $​50,000-­$74,999 31.1%  (+7.7  /  -­6.8) $​75,000-­$99,999 34.4%  (+14.2  /  -­11.9) $​100,000-­$149,999 41.7%  (+26.4  /  -­22.3) $150,000+ Insufficient  data Turtle  (248  responses) Overall $​0-­$24,999 37.2%  (+10.8  /  -­9.6) $​25,000-­$49,999 32.0%  (+4.7  /  -­4.3) $​50,000-­$74,999 36.0%  (+7.9  /  -­7.2) $​75,000-­$99,999 28.5%  (+15.5  /  -­11.7) $​100,000-­$149,999 25.0%  (+28.2  /  -­16.1) $150,000+ Insufficient  data Bear  (241  responses) Overall $​0-­$24,999 30.4%  (+10.9  /  -­9.1) $​25,000-­$49,999 33.8%  (+4.7  /  -­4.4) $​50,000-­$74,999 32.9%  (+7.9  /  -­7.0) $​75,000-­$99,999 37.1%  (+14.9  /  -­12.8) $​100,000-­$149,999 33.3%  (+27.6  /  -­19.5) $150,000+ Insufficient  data Metrics  only  apply  to  the  topline  results  for  this  question.  Filters  and  weighting  do  not  apply. Impressions Responses Response  Rate 6,271 1,001 16.0% Response  Times Responses  by  hour  of  day Responses  by  day  of  week Median  response  time  is  8.9  seconds Local  times  of  respondents Local  times  of  respondents People  earning People  earning People  earning People  earning People  earning People $0-­24K  (84) $25-­49K  (427) $50-­74K  (184) $75-­99K  (43) $100-­149K  (12) earning $150K+   Shark 32.4%  (+10.7  / 34.3%  (+4.7  /  -­4.4) 31.1%  (+7.7  /  -­6.8) 34.4%  (+14.2  / 41.7%  (+26.4  / Insufficient  data -­9.1) -­11.9) -­22.3) Turtle 37.2%  (+10.8  / 32.0%  (+4.7  /  -­4.3) 36.0%  (+7.9  /  -­7.2) 28.5%  (+15.5  / 25.0%  (+28.2  / Insufficient  data -­9.6) -­11.7) -­16.1) Bear 30.4%  (+10.9  / 33.8%  (+4.7  /  -­4.4) 32.9%  (+7.9  /  -­7.0) 37.1%  (+14.9  / 33.3%  (+27.6  / Insufficient  data -­9.1) -­12.8) -­19.5)
  • 7. Methodology:  Conducted  by  Google  Consumer  Surveys,  September  17,  2012  -­  September  19,  2012 and  based  on  750  online  responses.  Sample:  National  adult  Internet  population.