SlideShare a Scribd company logo
1 of 2
EFFICIENT SET                      Markowitz Portfolio Analysis With Two Risky Assets
Inputs (yellow)      Expected Standard                                                  Dynamic Chart of the Efficient Set
                      Return  Deviation                                                     With Two Risky Assets
Risky Asset 1            0.1%    10.4%                                          16%
Risky Asset 2            1.6%    13.8%
                                                                                14%
Correlation (ρ)           36.8%               4                                 12%


                                                              Expected Return
The 2-asset correlation goes in cell B7.                                        10%

Change correlation and study graph to see                                       8%
  blue Markowitz efficient frontier change.
                                                                                6%
The two red horizontal lines trace maximum
                                                                                4%
  and minimum portfolio risk.
                                                                                2%
The red vertical lines traces the efficient
  frontier when the correlation is +1.                                          0%
                                                                                  -5%       0%      5%     10%     15%    20%   25%
Rescale the graph if all of your points of
                                                                                                 Standard Deviation (s)
  interest do not show in the graph.

The computational numbers below are not transparent. The graph above is more instructive than the numbers
  below. Change the 5 input statistics in the yellow boxes to see how the graph above changes.

                                                                         36.8%    100.0% -100.0%
                                   Unsorted                    Sorted Standard Standard Standard Expected
                       Rank         Weight        Index        Weight Deviation Deviation Deviation Return
Min Weight (ρ=-1)             18      57.0%               1     140.0%   13.5%      9.0%     20.1%    -0.5%
Upper Bound                    1     140.0%               2     135.0%   13.1%      9.2%     18.9%    -0.4%
                               2     135.0%               3     130.0%   12.6%      9.4%     17.7%    -0.3%
                               3     130.0%               4     125.0%   12.2%      9.6%     16.5%    -0.2%
                               4     125.0%               5     120.0%   11.7%      9.7%     15.2%    -0.2%
                               5     120.0%               6     115.0%   11.4%      9.9%     14.0%    -0.1%
                               6     115.0%               7     110.0%   11.0%     10.1%     12.8%     0.0%
                               7     110.0%               8     105.0%   10.7%     10.2%     11.6%     0.1%
8   105.0%    9   100.0%   10.4%   10.4%   10.4%   0.1%
               9   100.0%   10    95.0%   10.2%   10.6%    9.2%   0.2%
              10    95.0%   11    90.0%   10.0%   10.7%    8.0%   0.3%
              11    90.0%   12    85.0%    9.8%   10.9%    6.8%   0.4%
              12    85.0%   13    80.0%    9.7%   11.1%    5.6%   0.4%
              13    80.0%   14    75.0%    9.6%   11.3%    4.4%   0.5%
              14    75.0%   15    70.0%    9.6%   11.4%    3.1%   0.6%
              15    70.0%   16    65.0%    9.6%   11.6%    1.9%   0.7%
              16    65.0%   17    60.0%    9.7%   11.8%    0.7%   0.7%
              17    60.0%   18    57.0%    9.8%   11.9%    0.0%   0.8%
              19    55.0%   19    55.0%    9.9%   11.9%    0.5%   0.8%
              20    50.0%   20    50.0%   10.1%   12.1%    1.7%   0.9%
              21    45.0%   21    45.0%   10.3%   12.3%    2.9%   1.0%
              22    40.0%   22    40.0%   10.5%   12.4%    4.1%   1.0%
              23    35.0%   23    35.0%   10.9%   12.6%    5.3%   1.1%
              24    30.0%   24    30.0%   11.2%   12.8%    6.5%   1.2%
              25    25.0%   25    25.0%   11.6%   13.0%    7.8%   1.3%
              26    20.0%   26    20.0%   12.0%   13.1%    9.0%   1.3%
              27    15.0%   27    15.0%   12.4%   13.3%   10.2%   1.4%
              28    10.0%   28    10.0%   12.8%   13.5%   11.4%   1.5%
              29     5.0%   29     5.0%   13.3%   13.6%   12.6%   1.6%
              30     0.0%   30     0.0%   13.8%   13.8%   13.8%   1.6%
              31    -5.0%   31    -5.0%   14.3%   14.0%   15.0%   1.7%
              32   -10.0%   32   -10.0%   14.8%   14.1%   16.2%   1.8%
              33   -15.0%   33   -15.0%   15.4%   14.3%   17.4%   1.9%
              34   -20.0%   34   -20.0%   15.9%   14.5%   18.6%   1.9%
              35   -25.0%   35   -25.0%   16.5%   14.7%   19.8%   2.0%
              36   -30.0%   36   -30.0%   17.0%   14.8%   21.1%   2.1%
              37   -35.0%   37   -35.0%   17.6%   15.0%   22.3%   2.2%
              38   -40.0%   38   -40.0%   18.2%   15.2%   23.5%   2.2%
              39   -45.0%   39   -45.0%   18.8%   15.3%   24.7%   2.3%
              40   -50.0%   40   -50.0%   19.4%   15.5%   25.9%   2.4%
              41   -55.0%   41   -55.0%   20.0%   15.7%   27.1%   2.5%
Lower Bound   42   -60.0%   42   -60.0%   20.6%   15.8%   28.3%   2.5%

More Related Content

What's hot

10 Social Media Thoughts for Integrated Marketing
10 Social Media Thoughts for Integrated Marketing10 Social Media Thoughts for Integrated Marketing
10 Social Media Thoughts for Integrated MarketingBryan McCarty
 
Survey on The Internet of Things and Social Media
Survey on The Internet of Things and Social MediaSurvey on The Internet of Things and Social Media
Survey on The Internet of Things and Social Mediagrins1
 
ACEP Massachusetts Emergency Physicians Survey Results
ACEP Massachusetts Emergency Physicians Survey ResultsACEP Massachusetts Emergency Physicians Survey Results
ACEP Massachusetts Emergency Physicians Survey ResultsBrian Ahier
 
柏瑞週報 20190912
柏瑞週報 20190912柏瑞週報 20190912
柏瑞週報 20190912Pinebridge
 
depth interview tabs
depth interview tabsdepth interview tabs
depth interview tabskimberlybak88
 
柏瑞週報 20191108
柏瑞週報 20191108柏瑞週報 20191108
柏瑞週報 20191108Pinebridge
 
柏瑞週報 20190809
柏瑞週報 20190809柏瑞週報 20190809
柏瑞週報 20190809Pinebridge
 
柏瑞週報 20191101
柏瑞週報 20191101柏瑞週報 20191101
柏瑞週報 20191101Pinebridge
 
[대학내일20대연구소] 2030세대 영어와 영어교육에 대한 인식 조사 report (연구리포트 2017-02)
[대학내일20대연구소] 2030세대 영어와 영어교육에 대한 인식 조사 report (연구리포트 2017-02)[대학내일20대연구소] 2030세대 영어와 영어교육에 대한 인식 조사 report (연구리포트 2017-02)
[대학내일20대연구소] 2030세대 영어와 영어교육에 대한 인식 조사 report (연구리포트 2017-02)20slab(대학내일20대연구소)
 
柏瑞週報 20190119
柏瑞週報 20190119柏瑞週報 20190119
柏瑞週報 20190119Pinebridge
 
柏瑞週報 20190111
柏瑞週報 20190111柏瑞週報 20190111
柏瑞週報 20190111Pinebridge
 
柏瑞週報20190906
柏瑞週報20190906柏瑞週報20190906
柏瑞週報20190906Pinebridge
 
柏瑞週報 20190510
柏瑞週報 20190510柏瑞週報 20190510
柏瑞週報 20190510Pinebridge
 
柏瑞週報 20200117
柏瑞週報  20200117柏瑞週報  20200117
柏瑞週報 20200117Pinebridge
 
柏瑞週報 20181102
柏瑞週報 20181102柏瑞週報 20181102
柏瑞週報 20181102Pinebridge
 
柏瑞週報 20190308
柏瑞週報 20190308柏瑞週報 20190308
柏瑞週報 20190308Pinebridge
 
Qcl 14-v3 [bunking lectures]_[banasthaliuniversity]_[garimasrivastava]
Qcl 14-v3 [bunking lectures]_[banasthaliuniversity]_[garimasrivastava]Qcl 14-v3 [bunking lectures]_[banasthaliuniversity]_[garimasrivastava]
Qcl 14-v3 [bunking lectures]_[banasthaliuniversity]_[garimasrivastava]Trina Ghosh
 
柏瑞週報 20191115
柏瑞週報 20191115柏瑞週報 20191115
柏瑞週報 20191115Pinebridge
 

What's hot (20)

10 Social Media Thoughts for Integrated Marketing
10 Social Media Thoughts for Integrated Marketing10 Social Media Thoughts for Integrated Marketing
10 Social Media Thoughts for Integrated Marketing
 
Survey on The Internet of Things and Social Media
Survey on The Internet of Things and Social MediaSurvey on The Internet of Things and Social Media
Survey on The Internet of Things and Social Media
 
ACEP Massachusetts Emergency Physicians Survey Results
ACEP Massachusetts Emergency Physicians Survey ResultsACEP Massachusetts Emergency Physicians Survey Results
ACEP Massachusetts Emergency Physicians Survey Results
 
柏瑞週報 20190912
柏瑞週報 20190912柏瑞週報 20190912
柏瑞週報 20190912
 
depth interview tabs
depth interview tabsdepth interview tabs
depth interview tabs
 
柏瑞週報 20191108
柏瑞週報 20191108柏瑞週報 20191108
柏瑞週報 20191108
 
柏瑞週報 20190809
柏瑞週報 20190809柏瑞週報 20190809
柏瑞週報 20190809
 
柏瑞週報 20191101
柏瑞週報 20191101柏瑞週報 20191101
柏瑞週報 20191101
 
Smartphones 3
Smartphones 3Smartphones 3
Smartphones 3
 
[대학내일20대연구소] 2030세대 영어와 영어교육에 대한 인식 조사 report (연구리포트 2017-02)
[대학내일20대연구소] 2030세대 영어와 영어교육에 대한 인식 조사 report (연구리포트 2017-02)[대학내일20대연구소] 2030세대 영어와 영어교육에 대한 인식 조사 report (연구리포트 2017-02)
[대학내일20대연구소] 2030세대 영어와 영어교육에 대한 인식 조사 report (연구리포트 2017-02)
 
柏瑞週報 20190119
柏瑞週報 20190119柏瑞週報 20190119
柏瑞週報 20190119
 
柏瑞週報 20190111
柏瑞週報 20190111柏瑞週報 20190111
柏瑞週報 20190111
 
柏瑞週報20190906
柏瑞週報20190906柏瑞週報20190906
柏瑞週報20190906
 
Ergonomia
ErgonomiaErgonomia
Ergonomia
 
柏瑞週報 20190510
柏瑞週報 20190510柏瑞週報 20190510
柏瑞週報 20190510
 
柏瑞週報 20200117
柏瑞週報  20200117柏瑞週報  20200117
柏瑞週報 20200117
 
柏瑞週報 20181102
柏瑞週報 20181102柏瑞週報 20181102
柏瑞週報 20181102
 
柏瑞週報 20190308
柏瑞週報 20190308柏瑞週報 20190308
柏瑞週報 20190308
 
Qcl 14-v3 [bunking lectures]_[banasthaliuniversity]_[garimasrivastava]
Qcl 14-v3 [bunking lectures]_[banasthaliuniversity]_[garimasrivastava]Qcl 14-v3 [bunking lectures]_[banasthaliuniversity]_[garimasrivastava]
Qcl 14-v3 [bunking lectures]_[banasthaliuniversity]_[garimasrivastava]
 
柏瑞週報 20191115
柏瑞週報 20191115柏瑞週報 20191115
柏瑞週報 20191115
 

Similar to Eff Set2 Assets

Corporate finance -session_5
Corporate finance -session_5Corporate finance -session_5
Corporate finance -session_5Gurpreet Singh
 
Call 1 q12
Call 1 q12Call 1 q12
Call 1 q12BRMALLS
 
Report Marketing Networking - 24.10.12
Report Marketing Networking - 24.10.12Report Marketing Networking - 24.10.12
Report Marketing Networking - 24.10.12KingBee Media
 
Third point-exposure-report
Third point-exposure-reportThird point-exposure-report
Third point-exposure-reportFrank Ragol
 
Cisco Candidate Survey Report Winter 2012
Cisco Candidate Survey Report Winter 2012Cisco Candidate Survey Report Winter 2012
Cisco Candidate Survey Report Winter 2012georgeleobarnes
 
IMCA 2009 Practice Management Survey Results
IMCA 2009 Practice Management Survey ResultsIMCA 2009 Practice Management Survey Results
IMCA 2009 Practice Management Survey ResultsExplore Atlanta
 
Sales Webinar | Leveraging Lessons Learned in 2012 to Exceed Financial Goals ...
Sales Webinar | Leveraging Lessons Learned in 2012 to Exceed Financial Goals ...Sales Webinar | Leveraging Lessons Learned in 2012 to Exceed Financial Goals ...
Sales Webinar | Leveraging Lessons Learned in 2012 to Exceed Financial Goals ...Altify
 
Comparativo estudios de_opinion
Comparativo estudios de_opinionComparativo estudios de_opinion
Comparativo estudios de_opinionMartin Triana
 
Apres call 2_q10_v2
Apres call 2_q10_v2Apres call 2_q10_v2
Apres call 2_q10_v2Arteris S.A.
 
3 conference call 2 q10
3   conference call 2 q103   conference call 2 q10
3 conference call 2 q10Arteris S.A.
 
Charting for few Good Performing Funds
Charting for few Good Performing FundsCharting for few Good Performing Funds
Charting for few Good Performing FundsTio Sheng Chiat
 
Cross tabulation for survey
Cross tabulation for surveyCross tabulation for survey
Cross tabulation for surveykimberlybak88
 
Driver's Attitudes toward Speed Limits
Driver's Attitudes toward Speed LimitsDriver's Attitudes toward Speed Limits
Driver's Attitudes toward Speed LimitsBasil Psarianos
 
Bnm analisis financiero estructural nov 2000 - oct 2001
Bnm   analisis financiero estructural nov 2000 - oct 2001Bnm   analisis financiero estructural nov 2000 - oct 2001
Bnm analisis financiero estructural nov 2000 - oct 2001gonzaloromani
 
2012 october 3 survey of tunisian public opinion, july 26 august 8, 2012
2012 october 3 survey of tunisian public opinion, july 26 august 8, 20122012 october 3 survey of tunisian public opinion, july 26 august 8, 2012
2012 october 3 survey of tunisian public opinion, july 26 august 8, 2012Moez
 
ApresentaçãO 3 Q08 Ingles Final
ApresentaçãO 3 Q08 Ingles FinalApresentaçãO 3 Q08 Ingles Final
ApresentaçãO 3 Q08 Ingles FinalBRMALLS
 

Similar to Eff Set2 Assets (20)

Corporate finance -session_5
Corporate finance -session_5Corporate finance -session_5
Corporate finance -session_5
 
Call 1 q12
Call 1 q12Call 1 q12
Call 1 q12
 
Report Marketing Networking - 24.10.12
Report Marketing Networking - 24.10.12Report Marketing Networking - 24.10.12
Report Marketing Networking - 24.10.12
 
Ebi.ferrier.2011 sdep
Ebi.ferrier.2011 sdepEbi.ferrier.2011 sdep
Ebi.ferrier.2011 sdep
 
Third point-exposure-report
Third point-exposure-reportThird point-exposure-report
Third point-exposure-report
 
Cisco Candidate Survey Report Winter 2012
Cisco Candidate Survey Report Winter 2012Cisco Candidate Survey Report Winter 2012
Cisco Candidate Survey Report Winter 2012
 
IMCA 2009 Practice Management Survey Results
IMCA 2009 Practice Management Survey ResultsIMCA 2009 Practice Management Survey Results
IMCA 2009 Practice Management Survey Results
 
Sales Webinar | Leveraging Lessons Learned in 2012 to Exceed Financial Goals ...
Sales Webinar | Leveraging Lessons Learned in 2012 to Exceed Financial Goals ...Sales Webinar | Leveraging Lessons Learned in 2012 to Exceed Financial Goals ...
Sales Webinar | Leveraging Lessons Learned in 2012 to Exceed Financial Goals ...
 
Korea Supplement
Korea SupplementKorea Supplement
Korea Supplement
 
Comparativo estudios de_opinion
Comparativo estudios de_opinionComparativo estudios de_opinion
Comparativo estudios de_opinion
 
Apres call 2_q10_v2
Apres call 2_q10_v2Apres call 2_q10_v2
Apres call 2_q10_v2
 
3 conference call 2 q10
3   conference call 2 q103   conference call 2 q10
3 conference call 2 q10
 
S. stone e health business models for chronic conditions-experiences of basqu...
S. stone e health business models for chronic conditions-experiences of basqu...S. stone e health business models for chronic conditions-experiences of basqu...
S. stone e health business models for chronic conditions-experiences of basqu...
 
Charting for few Good Performing Funds
Charting for few Good Performing FundsCharting for few Good Performing Funds
Charting for few Good Performing Funds
 
Cross tabulation for survey
Cross tabulation for surveyCross tabulation for survey
Cross tabulation for survey
 
Driver's Attitudes toward Speed Limits
Driver's Attitudes toward Speed LimitsDriver's Attitudes toward Speed Limits
Driver's Attitudes toward Speed Limits
 
Bnm analisis financiero estructural nov 2000 - oct 2001
Bnm   analisis financiero estructural nov 2000 - oct 2001Bnm   analisis financiero estructural nov 2000 - oct 2001
Bnm analisis financiero estructural nov 2000 - oct 2001
 
3Q11 Earnings Results
3Q11 Earnings Results3Q11 Earnings Results
3Q11 Earnings Results
 
2012 october 3 survey of tunisian public opinion, july 26 august 8, 2012
2012 october 3 survey of tunisian public opinion, july 26 august 8, 20122012 october 3 survey of tunisian public opinion, july 26 august 8, 2012
2012 october 3 survey of tunisian public opinion, july 26 august 8, 2012
 
ApresentaçãO 3 Q08 Ingles Final
ApresentaçãO 3 Q08 Ingles FinalApresentaçãO 3 Q08 Ingles Final
ApresentaçãO 3 Q08 Ingles Final
 

Eff Set2 Assets

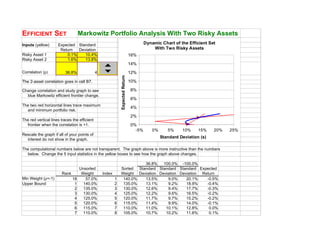
  • 1. EFFICIENT SET Markowitz Portfolio Analysis With Two Risky Assets Inputs (yellow) Expected Standard Dynamic Chart of the Efficient Set Return Deviation With Two Risky Assets Risky Asset 1 0.1% 10.4% 16% Risky Asset 2 1.6% 13.8% 14% Correlation (ρ) 36.8% 4 12% Expected Return The 2-asset correlation goes in cell B7. 10% Change correlation and study graph to see 8% blue Markowitz efficient frontier change. 6% The two red horizontal lines trace maximum 4% and minimum portfolio risk. 2% The red vertical lines traces the efficient frontier when the correlation is +1. 0% -5% 0% 5% 10% 15% 20% 25% Rescale the graph if all of your points of Standard Deviation (s) interest do not show in the graph. The computational numbers below are not transparent. The graph above is more instructive than the numbers below. Change the 5 input statistics in the yellow boxes to see how the graph above changes. 36.8% 100.0% -100.0% Unsorted Sorted Standard Standard Standard Expected Rank Weight Index Weight Deviation Deviation Deviation Return Min Weight (ρ=-1) 18 57.0% 1 140.0% 13.5% 9.0% 20.1% -0.5% Upper Bound 1 140.0% 2 135.0% 13.1% 9.2% 18.9% -0.4% 2 135.0% 3 130.0% 12.6% 9.4% 17.7% -0.3% 3 130.0% 4 125.0% 12.2% 9.6% 16.5% -0.2% 4 125.0% 5 120.0% 11.7% 9.7% 15.2% -0.2% 5 120.0% 6 115.0% 11.4% 9.9% 14.0% -0.1% 6 115.0% 7 110.0% 11.0% 10.1% 12.8% 0.0% 7 110.0% 8 105.0% 10.7% 10.2% 11.6% 0.1%
  • 2. 8 105.0% 9 100.0% 10.4% 10.4% 10.4% 0.1% 9 100.0% 10 95.0% 10.2% 10.6% 9.2% 0.2% 10 95.0% 11 90.0% 10.0% 10.7% 8.0% 0.3% 11 90.0% 12 85.0% 9.8% 10.9% 6.8% 0.4% 12 85.0% 13 80.0% 9.7% 11.1% 5.6% 0.4% 13 80.0% 14 75.0% 9.6% 11.3% 4.4% 0.5% 14 75.0% 15 70.0% 9.6% 11.4% 3.1% 0.6% 15 70.0% 16 65.0% 9.6% 11.6% 1.9% 0.7% 16 65.0% 17 60.0% 9.7% 11.8% 0.7% 0.7% 17 60.0% 18 57.0% 9.8% 11.9% 0.0% 0.8% 19 55.0% 19 55.0% 9.9% 11.9% 0.5% 0.8% 20 50.0% 20 50.0% 10.1% 12.1% 1.7% 0.9% 21 45.0% 21 45.0% 10.3% 12.3% 2.9% 1.0% 22 40.0% 22 40.0% 10.5% 12.4% 4.1% 1.0% 23 35.0% 23 35.0% 10.9% 12.6% 5.3% 1.1% 24 30.0% 24 30.0% 11.2% 12.8% 6.5% 1.2% 25 25.0% 25 25.0% 11.6% 13.0% 7.8% 1.3% 26 20.0% 26 20.0% 12.0% 13.1% 9.0% 1.3% 27 15.0% 27 15.0% 12.4% 13.3% 10.2% 1.4% 28 10.0% 28 10.0% 12.8% 13.5% 11.4% 1.5% 29 5.0% 29 5.0% 13.3% 13.6% 12.6% 1.6% 30 0.0% 30 0.0% 13.8% 13.8% 13.8% 1.6% 31 -5.0% 31 -5.0% 14.3% 14.0% 15.0% 1.7% 32 -10.0% 32 -10.0% 14.8% 14.1% 16.2% 1.8% 33 -15.0% 33 -15.0% 15.4% 14.3% 17.4% 1.9% 34 -20.0% 34 -20.0% 15.9% 14.5% 18.6% 1.9% 35 -25.0% 35 -25.0% 16.5% 14.7% 19.8% 2.0% 36 -30.0% 36 -30.0% 17.0% 14.8% 21.1% 2.1% 37 -35.0% 37 -35.0% 17.6% 15.0% 22.3% 2.2% 38 -40.0% 38 -40.0% 18.2% 15.2% 23.5% 2.2% 39 -45.0% 39 -45.0% 18.8% 15.3% 24.7% 2.3% 40 -50.0% 40 -50.0% 19.4% 15.5% 25.9% 2.4% 41 -55.0% 41 -55.0% 20.0% 15.7% 27.1% 2.5% Lower Bound 42 -60.0% 42 -60.0% 20.6% 15.8% 28.3% 2.5%