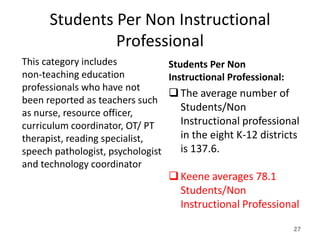
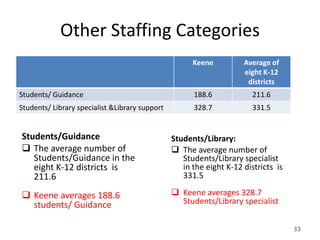
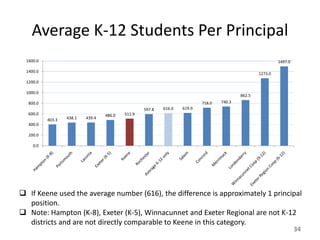
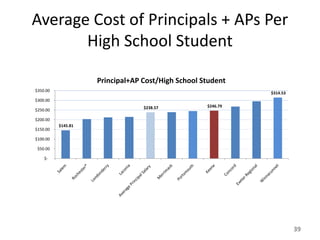
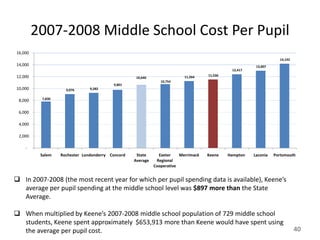
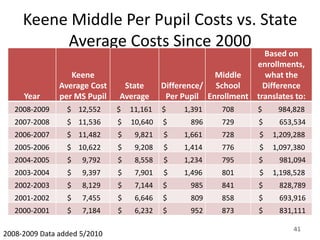
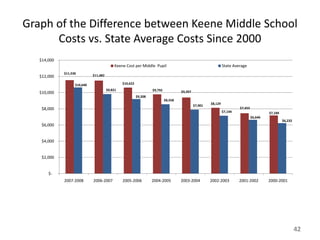
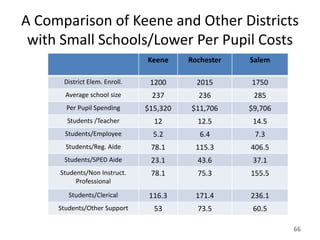
The average number of
Students/Non-Instructional
Professional in the eight K-12
districts is 438.3
Keene averages 406.6
Students/Non-Instructional
Professional.
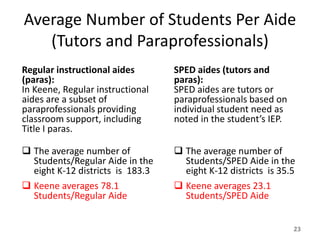
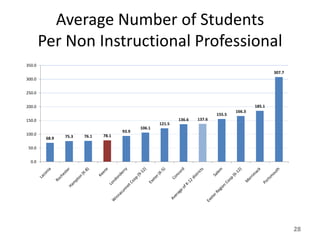
guidance counselors, library
media specialists, principals,
assistant principals, etc.
Students served by each non-
instructional professional.
Of the eight K-12 districts,
the average number of
Students/Non-Instructional
Professional is 438.3
Keene averages 406.6
Students/Non-Instructional
Professional.
This category does not include
clerical or other support staff.


![Wsu%20 superintendents%201.6.12[1]](https://cdn.slidesharecdn.com/ss_thumbnails/wsu20superintendents201-6-121-120107230534-phpapp02-thumbnail.jpg?width=640&height=640&fit=bounds)


