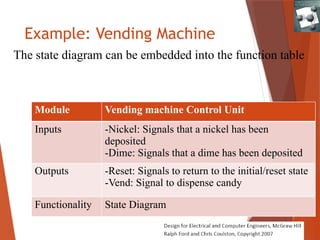
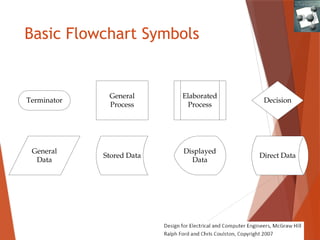
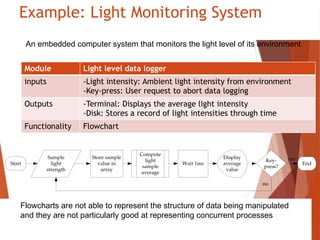
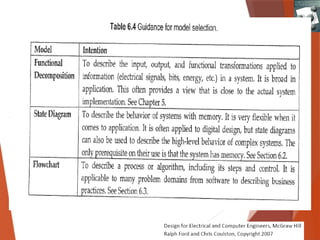
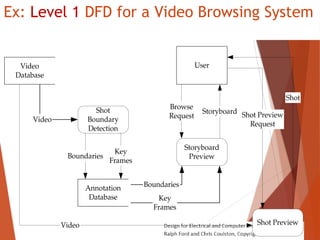
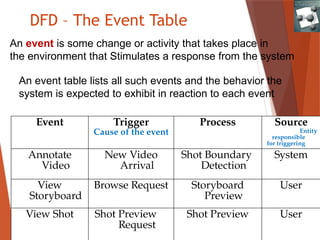
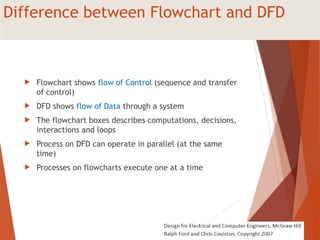
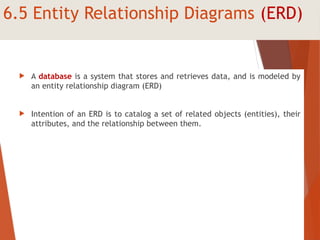
Pertemuan 6
System Design II: Behavioral Models
Tujuan
Module Nama moduk
Inputs - Data input
Outputs - Data ouptu
Functionality Fungsionalitas?
Mahasiswa mampu memodelkan fungsionalitas sistem dengan benar
Bagaimana cara menjelaskan fungsionalitas?
Apa itu model?
Models
 Models allow systems to be described without having to
determine all of the implementation details
 Models are not the same- they come in a variety of
forms and each serves a different intention
Properties of Good Models
A good model should be:
 Abstract (independent of specific implementation)
 Unambiguous (single and clear meaning of terms used)
 Allow for innovation (encourage alternatives)
 Standardized (follow standards in field)
 Provide a means of communication ( a model should facilitate communication within design team)
 Modifiable (allow for ease of change in design)
 Remove unnecessary details & show important features (simple and focused)
 Break system into sub-problems (decomposed into simple units)
 Substitute sequence of actions by a single action (supports high and low level description)
 Assist in verification (aid in demonstrating requirements)
 Assist in validation (easy to test/validate)
Istilah-istial
 Model: simplified description of a system or a process to assist analysis, calculations,
prediction.
 Modeling Language: special algorithm used to express information flow or a system
in a certain structure with certain rules
 Object Type: to describe actual components
 Intention :intended class of behavior
 Relationship: to describe dependence of objects
Types of Models
 Functional/Physical decomposition models
 State diagrams
 Flowcharts
 Pseudocode
 Data flow models
 Entity relationship diagrams
 Unified modeling language
 Equation
6.2 State Diagrams
 A directed graph and modes used to describe system with
memory.
 System with memory is able to modify response to inputs
based on the state of the system.
 States are used to model operating modes and characterize
history of inputs.
 Inputs cause transition between states.
 To verify system with memory ask: can same inputs produce
different outputs ?
If yes, system has memory.
Example: Vending Machine
The state diagram can be embedded into the function table
Module Vending machine Control Unit
Inputs -Nickel: Signals that a nickel has been
deposited
-Dime: Signals that a dime has been deposited
Outputs -Reset: Signals to return to the initial/reset state
-Vend: Signal to dispense candy
Functionality State Diagram
State Diagram for Vending Machine
$0.05
$0.10
$0.15
$0.20
Initial/
Reset:
$0.00
dime
nickel
nickel
nickel
nickel
nickel
>=$0.25
dime
dime
dime
dime
-Reset state is $0.00
-The state that dispenses candy is >=$0.25
-The unlabeled transition from state $.25
to state $0.00 is called an unconditional transition
-Any unspecified input conditions cause the system
To remain in the current state. If no coin is inserted
while the system is in state $020, the system remains
In state $0.20.
-No change is dispended
6.3 Flowcharts
 The intention of a flowchart is to model what type of
behavior do we expect when certain action is taken
 Old-fashioned and overly simple (strength or weakness?)
 Being simple makes them accessible to a wide audience
and used in a great number of applications including non-
technical.
Basic Flowchart Symbols
Terminator
General
Process
Elaborated
Process
General
Data
Displayed
Data
Stored Data Direct Data
Decision
Example: Light Monitoring
System
Sample
light
strength
Start
Compute
light
sample
average
Store sample
value in
array
Display
average
value
Key-
press?
Wait 1ms End
no
yes
What do you understand from the following Flowchart
What are the inputs?, Outputs?,
Example: Light Monitoring System
Sample
light
strength
Start
Compute
light
sample
average
Store sample
value in
array
Display
average
value
Key-
press?
Wait 1ms End
no
yes
Module Light level data logger
inputs -Light intensity: Ambient light intensity from environment
-Key-press: User request to abort data logging
Outputs -Terminal: Displays the average light intensity
-Disk: Stores a record of light intensities through time
Functionality Flowchart
Flowcharts are not able to represent the structure of data being manipulated
and they are not particularly good at representing concurrent processes
An embedded computer system that monitors the light level of its environment
6.4 Data Flow Diagrams (DFD)
 The intention of a Data Flow Diagram is to model the processing
and flow of data inside a system
 DFDs can have levels, just like functional decomposition
 DFD models the system from a data point of view whereas the
functional decomposition is often closer to the implementation
of the design
 DFD is different from a flowchart in that it does not encapsulate
control and sequencing information, but allows multiple
processes running concurrently
Definitions for DFD
 Process: A rectangle with rounded corners that describes a useful task or function
(they perform a transformation on the data)
 Data flow: An arrow representing a data relationship between two processes
 Data stores: An open rectangle representing a data repository
 Interface: A square describing external agents or entities that use the system.
Process Interface
Data Store
Data Flow
Video Browsing System
 It is cumbersome to preview videos and extract information
 Image analysis techniques can identify shots (continuous scenes without a break) in a video
and store both the location of the shot boundaries in the video and key frames that
summarizes each shot.
 The collection of the key frames is known as a storyboard
 The storyboards are stored in an annotation database that is much smaller than the original
video database
 Users can preview the storyboard and select shots from it to view.
Level 1 DFD for a video browsing
system
Module Video Browsing System
Inputs -Video: External video to the system that is entered into the
video database
-Browse Request: User request to brows a particular video
-Shot Preview Request: User request to preview a particular
shot from a video
Outputs -Storyboard: A sequence of frames summarizing the entire
video
-Shot: The complete video corresponding to the still image in
the storyboard
Functionality DFD
Ex: Level 1 DFD for a Video Browsing System
Video
Database
Shot
Boundary
Detection
Annotation
Database
Video
Boundaries
Key
Frames
User
Browse
Request
Storyboard
Preview
Storyboard
Key
Frames
Boundaries
Shot Preview
Shot Preview
Request
Video
Shot
DFD – The Event Table
Event Trigger
Cause of the event
Process Source
Entity
responsible
for triggering
Annotate
Video
New Video
Arrival
Shot Boundary
Detection
System
View
Storyboard
Browse Request Storyboard
Preview
User
View Shot Shot Preview
Request
Shot Preview User
An event table lists all such events and the behavior the
system is expected to exhibit in reaction to each event
An event is some change or activity that takes place in
the environment that Stimulates a response from the system
Microwave oven state description
State Description
Waiting The oven is waiting for input. The display shows the current time.
Half power The oven power is set to 300 watts. The display shows ÔH
alf powerÕ
.
Full power The oven power is set to 600 watts. The display shows ÔF
ull powerÕ
.
Set time The cooking time is s et to the userÕ
s input value. The display shows the cooking time
selected and is updated as the time is set.
Disabled Oven operation is disabled for safety. Interior oven light is on. Display shows ÔN
ot
readyÕ
.
Enabled Oven operation is enabled. Interior oven light is off. Display shows Ô
Ready to cookÕ
.
Operation Oven in operation. Interior oven light is on. Display shows the timer countdown. On
completion of cooking, the buzzer is sounded for 5 s econds. Oven light is on. Display
shows Ô
Cooking completeÕ w
hile buzzer is sounding.
Difference between Flowchart and DFD
 Flowchart shows flow of Control (sequence and transfer
of control)
 DFD shows flow of Data through a system
 The flowchart boxes describes computations, decisions,
interactions and loops
 Process on DFD can operate in parallel (at the same
time)
 Processes on flowcharts execute one at a time
6.5 Entity Relationship Diagrams (ERD)
 A database is a system that stores and retrieves data, and is modeled by
an entity relationship diagram (ERD)
 Intention of an ERD is to catalog a set of related objects (entities), their
attributes, and the relationship between them.
6.5 Three elements of an ERD
 Entities: Generally in the form of tangible objects, roles played,
organizational units, devices, and locations. An instance is the manifestation
of a particular entity. For example, an entity could be a student while an
instance is Hasan
 Relationships: They are descriptors for the relationships between entities.
 Attributes: They are features that are used to differentiate between
instances of entities.
Ex: An ERD describing academic scheduling at a College
Student Course Department
Student Takes many
M:M
Majors in one
M:1
Course
Has many
M:M
Can require many /
can be the
prerequisite of many
M:M
Is offered by one
M:1
Department Enrolls many
1:M
Offers many
1:M
Entity relationship matrix
A college wants to store data about three entities:
Students, Courses, and Departments
The process of building an ERD starts by determining the
relationships between entities
College Database ERD
Student
SSN
Name
Date of birth
Age
GPA
Major
Department
Name
Chair
# of students
Course
Number
Department
Credits
Instructor
Available Seats
takes /
has
offers /
offered by
majors in/
enrolls
requires /
is prereq
M
M
M
1
M
M
M
1
RELATIONSHIP
ENTITY
Key attribute is underlined
The ERD is a formal language that can be used to automatically generate
the database structure
6.6 The Unified Modeling Language UML
 For object-oriented software
design.
 Value in applying it to ECE Systems.
 Has 6 different views of systems
(unified!).
 Only a brief overview is provided
here.
EX: UML for Virtual Grocery (V-Grocer)
 Order groceries to be delivered home.
 User has a barcode scanner connected to home
computer with application software.
 User scans a used item to automatically order it
from the grocery store.
 Groceries are delivered at pre-arranged time.
6.6.1 Static View
 The intention of the static view is to show the classes in
a system and their relationships
 Classes represent:
 Data and Methods (functions) that operate on data
 The static view is characterized by a class diagram
 The class has a label (Customer), Attributes (Name,
Address, and CustId)
 It has one method (ChangeAddr())
+ChangeAddr() : bool
-Name : string
-Address : string
-CustId : long
Customer
Class Diagram for a portion of the V-Grocer
+ChangeAddr() : bool
-Name : string
-Address : string
-CustId : long
Customer
+ChangePrice()
-UPC : string
-Cost : decimal
-Type : string
Item
+TotalCost() : float
-OrderID : long
-CustId : long
Order
+AddItem()
-UPC
-OrderID
-Quantity
GroceryCart
*
-contains
*
-part of
-Time : string
-OrderId : long
-CustID : long
Delivery
-receives
*
-sent to
1
-sent by
1
-contains
1
Relationships are drawn as lines connecting the two participant classes
Five classes: Customer, Delivery, Order, Item and GroceryCart
6.7 Project Application: Selecting Models
Summary of Different Models
Summary
 Models are an abstraction of system.
 Models can be thought of as a design specification.
 Models have different intentions for describing behavior.
 Models should encourage innovation and provide for
clear documentation.

06_Model Behaviour materiiiiiiiiiiii.pptx

  • 1.
    Pertemuan 6 System DesignII: Behavioral Models
  • 2.
    Tujuan Module Nama moduk Inputs- Data input Outputs - Data ouptu Functionality Fungsionalitas? Mahasiswa mampu memodelkan fungsionalitas sistem dengan benar Bagaimana cara menjelaskan fungsionalitas?
  • 3.
  • 4.
    Models  Models allowsystems to be described without having to determine all of the implementation details  Models are not the same- they come in a variety of forms and each serves a different intention
  • 5.
    Properties of GoodModels A good model should be:  Abstract (independent of specific implementation)  Unambiguous (single and clear meaning of terms used)  Allow for innovation (encourage alternatives)  Standardized (follow standards in field)  Provide a means of communication ( a model should facilitate communication within design team)  Modifiable (allow for ease of change in design)  Remove unnecessary details & show important features (simple and focused)  Break system into sub-problems (decomposed into simple units)  Substitute sequence of actions by a single action (supports high and low level description)  Assist in verification (aid in demonstrating requirements)  Assist in validation (easy to test/validate)
  • 6.
    Istilah-istial  Model: simplifieddescription of a system or a process to assist analysis, calculations, prediction.  Modeling Language: special algorithm used to express information flow or a system in a certain structure with certain rules  Object Type: to describe actual components  Intention :intended class of behavior  Relationship: to describe dependence of objects
  • 7.
    Types of Models Functional/Physical decomposition models  State diagrams  Flowcharts  Pseudocode  Data flow models  Entity relationship diagrams  Unified modeling language  Equation
  • 8.
    6.2 State Diagrams A directed graph and modes used to describe system with memory.  System with memory is able to modify response to inputs based on the state of the system.  States are used to model operating modes and characterize history of inputs.  Inputs cause transition between states.  To verify system with memory ask: can same inputs produce different outputs ? If yes, system has memory.
  • 9.
    Example: Vending Machine Thestate diagram can be embedded into the function table Module Vending machine Control Unit Inputs -Nickel: Signals that a nickel has been deposited -Dime: Signals that a dime has been deposited Outputs -Reset: Signals to return to the initial/reset state -Vend: Signal to dispense candy Functionality State Diagram
  • 10.
    State Diagram forVending Machine $0.05 $0.10 $0.15 $0.20 Initial/ Reset: $0.00 dime nickel nickel nickel nickel nickel >=$0.25 dime dime dime dime -Reset state is $0.00 -The state that dispenses candy is >=$0.25 -The unlabeled transition from state $.25 to state $0.00 is called an unconditional transition -Any unspecified input conditions cause the system To remain in the current state. If no coin is inserted while the system is in state $020, the system remains In state $0.20. -No change is dispended
  • 11.
    6.3 Flowcharts  Theintention of a flowchart is to model what type of behavior do we expect when certain action is taken  Old-fashioned and overly simple (strength or weakness?)  Being simple makes them accessible to a wide audience and used in a great number of applications including non- technical.
  • 12.
  • 13.
    Example: Light Monitoring System Sample light strength Start Compute light sample average Storesample value in array Display average value Key- press? Wait 1ms End no yes What do you understand from the following Flowchart What are the inputs?, Outputs?,
  • 14.
    Example: Light MonitoringSystem Sample light strength Start Compute light sample average Store sample value in array Display average value Key- press? Wait 1ms End no yes Module Light level data logger inputs -Light intensity: Ambient light intensity from environment -Key-press: User request to abort data logging Outputs -Terminal: Displays the average light intensity -Disk: Stores a record of light intensities through time Functionality Flowchart Flowcharts are not able to represent the structure of data being manipulated and they are not particularly good at representing concurrent processes An embedded computer system that monitors the light level of its environment
  • 16.
    6.4 Data FlowDiagrams (DFD)  The intention of a Data Flow Diagram is to model the processing and flow of data inside a system  DFDs can have levels, just like functional decomposition  DFD models the system from a data point of view whereas the functional decomposition is often closer to the implementation of the design  DFD is different from a flowchart in that it does not encapsulate control and sequencing information, but allows multiple processes running concurrently
  • 17.
    Definitions for DFD Process: A rectangle with rounded corners that describes a useful task or function (they perform a transformation on the data)  Data flow: An arrow representing a data relationship between two processes  Data stores: An open rectangle representing a data repository  Interface: A square describing external agents or entities that use the system. Process Interface Data Store Data Flow
  • 18.
    Video Browsing System It is cumbersome to preview videos and extract information  Image analysis techniques can identify shots (continuous scenes without a break) in a video and store both the location of the shot boundaries in the video and key frames that summarizes each shot.  The collection of the key frames is known as a storyboard  The storyboards are stored in an annotation database that is much smaller than the original video database  Users can preview the storyboard and select shots from it to view.
  • 19.
    Level 1 DFDfor a video browsing system Module Video Browsing System Inputs -Video: External video to the system that is entered into the video database -Browse Request: User request to brows a particular video -Shot Preview Request: User request to preview a particular shot from a video Outputs -Storyboard: A sequence of frames summarizing the entire video -Shot: The complete video corresponding to the still image in the storyboard Functionality DFD
  • 20.
    Ex: Level 1DFD for a Video Browsing System Video Database Shot Boundary Detection Annotation Database Video Boundaries Key Frames User Browse Request Storyboard Preview Storyboard Key Frames Boundaries Shot Preview Shot Preview Request Video Shot
  • 21.
    DFD – TheEvent Table Event Trigger Cause of the event Process Source Entity responsible for triggering Annotate Video New Video Arrival Shot Boundary Detection System View Storyboard Browse Request Storyboard Preview User View Shot Shot Preview Request Shot Preview User An event table lists all such events and the behavior the system is expected to exhibit in reaction to each event An event is some change or activity that takes place in the environment that Stimulates a response from the system
  • 22.
    Microwave oven statedescription State Description Waiting The oven is waiting for input. The display shows the current time. Half power The oven power is set to 300 watts. The display shows ÔH alf powerÕ . Full power The oven power is set to 600 watts. The display shows ÔF ull powerÕ . Set time The cooking time is s et to the userÕ s input value. The display shows the cooking time selected and is updated as the time is set. Disabled Oven operation is disabled for safety. Interior oven light is on. Display shows ÔN ot readyÕ . Enabled Oven operation is enabled. Interior oven light is off. Display shows Ô Ready to cookÕ . Operation Oven in operation. Interior oven light is on. Display shows the timer countdown. On completion of cooking, the buzzer is sounded for 5 s econds. Oven light is on. Display shows Ô Cooking completeÕ w hile buzzer is sounding.
  • 23.
    Difference between Flowchartand DFD  Flowchart shows flow of Control (sequence and transfer of control)  DFD shows flow of Data through a system  The flowchart boxes describes computations, decisions, interactions and loops  Process on DFD can operate in parallel (at the same time)  Processes on flowcharts execute one at a time
  • 24.
    6.5 Entity RelationshipDiagrams (ERD)  A database is a system that stores and retrieves data, and is modeled by an entity relationship diagram (ERD)  Intention of an ERD is to catalog a set of related objects (entities), their attributes, and the relationship between them.
  • 25.
    6.5 Three elementsof an ERD  Entities: Generally in the form of tangible objects, roles played, organizational units, devices, and locations. An instance is the manifestation of a particular entity. For example, an entity could be a student while an instance is Hasan  Relationships: They are descriptors for the relationships between entities.  Attributes: They are features that are used to differentiate between instances of entities.
  • 26.
    Ex: An ERDdescribing academic scheduling at a College Student Course Department Student Takes many M:M Majors in one M:1 Course Has many M:M Can require many / can be the prerequisite of many M:M Is offered by one M:1 Department Enrolls many 1:M Offers many 1:M Entity relationship matrix A college wants to store data about three entities: Students, Courses, and Departments The process of building an ERD starts by determining the relationships between entities
  • 27.
    College Database ERD Student SSN Name Dateof birth Age GPA Major Department Name Chair # of students Course Number Department Credits Instructor Available Seats takes / has offers / offered by majors in/ enrolls requires / is prereq M M M 1 M M M 1 RELATIONSHIP ENTITY Key attribute is underlined The ERD is a formal language that can be used to automatically generate the database structure
  • 28.
    6.6 The UnifiedModeling Language UML  For object-oriented software design.  Value in applying it to ECE Systems.  Has 6 different views of systems (unified!).  Only a brief overview is provided here.
  • 30.
    EX: UML forVirtual Grocery (V-Grocer)  Order groceries to be delivered home.  User has a barcode scanner connected to home computer with application software.  User scans a used item to automatically order it from the grocery store.  Groceries are delivered at pre-arranged time.
  • 31.
    6.6.1 Static View The intention of the static view is to show the classes in a system and their relationships  Classes represent:  Data and Methods (functions) that operate on data  The static view is characterized by a class diagram  The class has a label (Customer), Attributes (Name, Address, and CustId)  It has one method (ChangeAddr()) +ChangeAddr() : bool -Name : string -Address : string -CustId : long Customer
  • 32.
    Class Diagram fora portion of the V-Grocer +ChangeAddr() : bool -Name : string -Address : string -CustId : long Customer +ChangePrice() -UPC : string -Cost : decimal -Type : string Item +TotalCost() : float -OrderID : long -CustId : long Order +AddItem() -UPC -OrderID -Quantity GroceryCart * -contains * -part of -Time : string -OrderId : long -CustID : long Delivery -receives * -sent to 1 -sent by 1 -contains 1 Relationships are drawn as lines connecting the two participant classes Five classes: Customer, Delivery, Order, Item and GroceryCart
  • 33.
    6.7 Project Application:Selecting Models Summary of Different Models
  • 35.
    Summary  Models arean abstraction of system.  Models can be thought of as a design specification.  Models have different intentions for describing behavior.  Models should encourage innovation and provide for clear documentation.