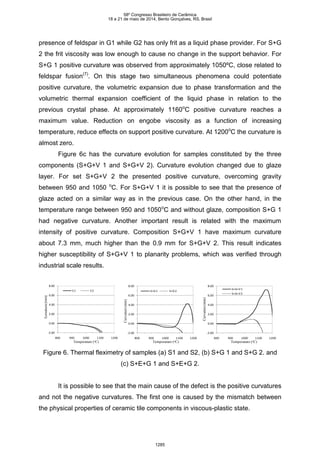
CURVATURE EVOLUTION IN PORCELAIN TILE DURING FIRING
P. Henrique1,2
, A. Wanderlind1
, A. De Noni Jr1*
.
1
Programa de Pós-Graduação em Ciência e Engenharia de Materiais– PPGCEM
* Universidade do Extremo Sul Catarinense - UNESC
Av. Universitária, 1105 - Bairro Universitário, 88806-000, Criciúma (SC)
e-mail: agenordenoni@unesc.net
2
Cerâmica Elizabeth, Rod.Luiz Rosso, km 7, 88803-470, Criciúma - SC
agenordenoni@unesc.net
ABSTRACT
Planarity is one of indispensable attribute of a ceramic tile quality. During the firing
changes on curvature may be permanent causing damage on quality and
productivity. The objective was to evaluate curvature evolution on porcelain tile
during heating stage of firing. Effects of engobe and glaze coating were evaluated.
The performance of two compositions of porcelain tile was studied on industrial
(1000 mm x 500 mm x 10 mm) and laboratorial (100 mm x 50 mm x 6 mm) scale.
Industrial test pieces were fired at 950 and 1200 o
C. Final curvature was measured
by conventional dial indicator. Curvature evolution of laboratorial test pieces was
evaluated by thermal fleximetry from 25 to 1200 o
C. This characterization was
capable to identify very significant positive curvature deflection on temperature range
from 930 to 1200 o
C, directly associated to permanent planarity defects. Differences
on composition affect significantly the curvature evolution.
Keywords: Firing, Thermal properties, Traditional ceramics, Structural applications.
INTRODUCTION
Ceramic tiles are applied in floors and wall of industrial, commercial, home
and public places environments. Macroeconomic factors are favoring the growth of
the concurrence and world production of this class of products, being constant the
search for technological advancement in product and process(1,2)
. They are made
58º Congresso Brasileiro de Cerâmica
18 a 21 de maio de 2014, Bento Gonçalves, RS, Brasil
1277
mainly of three layers of ceramic materials with distinct properties and behaviors: the
body, that is the base of the tile and the thicker part (>90% of total thickness), the
engobe and the glaze.
One indispensable quality attribute of a ceramic tile is its planarity. The lack of
planarity causes seating problems, making it more vulnerable to impact fractures(3)
. It
may also cause undesired accumulation of water and also interfere in the aesthetic
performance of the product.
The increase in the level of consumers needs contributing to make planarity,
in many products, the higher motivation of complains. One example is rectified
glazed products where the seating joints are smaller than 2 mm. This proximity
between the ceramic plates allows easy visual perception on planarity imperfections.
The problem is greater for ceramic plates of large sizes and small thickness, which
has been the world trend in recent years(1)
. The problems caused by curvature
problems may be present in several ways. The most common are concave or convex
pieces, curvatures on corners or edges. Figure 1 illustrates some of the most typical
problems(4)
.
a b
c d
e f
g h
a b
c d
e f
g h
Figure 1. Typical problems of planarity in ceramic tiles(4)
During the manufacture process of ceramic plates, there are several factors
that may affect their planarity. This is due to the nature of the body, engobe and
glaze as well as to the operations that they are submitted to(5)
. During firing, the
ceramic plates pass through a succession of phenomena that generate geometric
changes in relation to the crude product. Thermal expansion, fusion and sintering are
the most relevant ones(6,7)
. The resulting final curvature depends on the
characteristics of the firing cycle and on the dynamic with which those phenomena
manifest themselves and match with the properties of each component of the
plate(8)
.
58º Congresso Brasileiro de Cerâmica
18 a 21 de maio de 2014, Bento Gonçalves, RS, Brasil
1278
In order to reduce planarity defects some techniques are well known: (i)
Thermal expansion coefficients mismatch between glaze and body during the
elastic-rigid state(9,10)
; (ii) Firing shrinkage mismatch between engobe layer during
the heating phase(11)
; (iii) Furnace temperature mismatch between the upper and
lower parts of the pieces during heating stage of firing(4,5,12)
. Delayed curvatures is a
another kind of planarity defects observed large ceramic tiles after firing but not well
understood yet(13)
.
Even so, there are a fell works in literature about alterations in the curvature
during the heating stage, especially during the viscous-plastic regime and correlating
with the mass composition of the ceramic tile components. Despite being transitory
those curvatures may generate permanent deformations in the material. During
bending, the piece may reach the rolls with an angle able to transfer mechanical
deformation energy instead of just supporting and moving the material. Normally this
problem is softened by temperature adjustments in the lower and upper parts of the
kiln or change glaze and engobes composition by trial and error. Despite all those
efforts, many times the defect continues to be visible in the finished product. The
photo in Figure 2 is glazed porcelain installed in a Shopping Center. A repetitive
pattern of undulation may be seen along one direction concentrated in two of the
piece’s four edges.
Figure. 2 Photography of esthetical effect caused by defects by edge curvatures.
From the geometric point of view, the intensity of planarity loss itself is
normally small and difficult to quantify by conventional methods. On the other hand,
the defect becomes more evident due to variations in the aesthetic standard of the
glazed surface. Low brightness glaze types are normally the ones who evidence the
problem.
58º Congresso Brasileiro de Cerâmica
18 a 21 de maio de 2014, Bento Gonçalves, RS, Brasil
1279
The justification of this work is due to the relevance and complexity of
planarity defects in ceramic tile industry. The main objective of this work was to
evaluate the curvature evolution during heating stage of firing process using thermal
fleximetry. Effetcs of composition, engobe and glaze coating as also investigated.
MATERIALS AND METHODS
Materials
The study was based in two products: standard (P1) and test (P2). A glazed
porcelain tile was selected as a standard product. Its size was 1000 mm x 500 mm x
10 mm (length x width x thickness) and had planarity problems similar to type A
(Figure 1). Changes were made in the composition of both body and engobe in order
to significantly attenuate the problem. The glaze composition was not changed in
order to not mischaracterize the aesthetic attributes of the product. The pieces were
industrially produced by wet milling route. Table 1 and Table 2 show the body’s (S1
and S2) and engobe’s (G1 and G2) composition, respectively, as well as the
chemical composition (measured by FRX, Philips PW 2400, The Netherlands) and
linear thermal expansion coefficient at 325o
C (325) measured by contact dilatometry
(Netzsch DIL 402 C, Germany) of each raw materials, individually. The chemical
composition and 325 at 325o
C of the compositions was determined by weighted
mean.
Table 1. Composition and thermal expansion of standard (S1) and test (S2) bodies.
Raw
materials
Mixture
(% w/w)
325
(x 10-6 o
C-1
)
Chemical Composition (%w/w)
S1 S2 SiO2 Al2O3 K2O Na2O CaO MgO Fe2O3 Others L.O.I
Clay 1 25 25 71.5 61.5 24.9 1.3 1.2 2.7 0.5 1.5 0.5 5.9
Clay 2 50 35 67.8 72.1 15.6 2.4 0.2 0.2 1.0 2.9 0.6 5
Feldspar 1 10 10 109.0 56.4 22.7 5.5 10.5 0.5 0.1 2.2 0.5 1.6
Feldspar 2 10 25 69.6 74.4 15.6 5.1 1.1 0.1 0.1 1.3 ~0 2.3
Talc 5 5 120.0 64.4 7 0.5 0.1 0.6 18.2 2.9 0.7 5.6
Standard body (S1) 74.4 67.7 18.2 67.7 18.2 2.6 1.6 0.9 1.6 2.3
Test body S2 74.7 68.1 18.2 68.1 18.2 3 1.7 0.9 1.4 2.1

linear thermal expansion coefficient at 325 o
C.
58º Congresso Brasileiro de Cerâmica
18 a 21 de maio de 2014, Bento Gonçalves, RS, Brasil
1280
Table 2. Chemical composition and thermal expansion coefficient of standard (G1)
and test (G2) engobes;
Raw
Materials
Mixture
(% w/w)
325

(x 10-6 o
C-1
)
Chemical Composition (%w/w)
G1 G2 SiO2 Al2O3 K2O Na2O CaO MgO TiO2 Fe2O3 ZrO2 PF
Frit 15 35 63.2 47.3 14.5 4.0 5.0 4.5 2.3 21.8 0.2 0.0 0.4
Zircon 11 11 40.0 33.2 0.1 0.0 0.0 0.1 0.0 0.2 0.1 65.2 1.1
Clay 3 23 23 61.5 69 20.2 0.6 0.0 0.1 0.2 0.7 0.9 0.0 8.4
Kaolin 9 9 40.0 46.8 38.2 0.9 0.2 0.1 0.1 0.0 0.5 0.0 13.1
Quartz 19 19 120.0 99.2 0.4 0.0 0.0 0.0 0.0 0.0 0.0 0.0 0.4
Feldspar 3 20 70.0 74.8 14.8 1.0 7.3 1.1 0.2 0.0 0.1 0.0 0.9
Standard Engobe (G1) 70.5 64.6 13.3 1.0 2.2 0.9 0.4 3.5 0.3 7.2 3.5
Test Engobe (G2) 69.1 59.1 13.2 1.6 1.8 1.6 0.9 7.8 0.3 7.2 3.4
From the economic point of view the test product (P2) increased the raw
materials cost in approximately 5%. In the support composition the main change was
the reduction in the amount of Clay 2 from 50% to 35%, in its place it was increased
the amount of Feldspar 2 from 10% to 25%. In test engobe Feldspar 3 was replaced
by Frit 1 from 15% to 35%.
Clay 2 has good sinterability due to the amount of potassium oxide in its
composition due to the presence of illite. The substitution of Feldspar 2,
predominantly potassium, was proposed in order to delay the beginning by the liquid
phase formation, but keeping the water absorption value below 0.5% without
significant alteration in the firing temperature. The change in engobe composition,
was made in order to reduce the engobe viscosity, since feldspar fuses around
1100o
C(7)
, above the glass transition temperature of the frit, at around 660o
C.
Industrial Procedures
Three different types of industrial pieces were produced: body only (S), with a
mass of 20 kg/m2
; body+engobe (S+G) with a mass of 21 kg/m2
;
body+engobe+glaze (S+G+V or P) with a mass of 22 kg/m2
. Pieces were fired in the
usual process condition of 1200o
C in industrial roller kiln (Sacmi, Ímola Italy, 221 m
of length) and cold-to-cold time of 55 min. The kiln was properly regulated for the
best planarity result. Some pieces were also fired at 950o
C. This temperature was
chosen because could give some additional information about pieces behavior and
58º Congresso Brasileiro de Cerâmica
18 a 21 de maio de 2014, Bento Gonçalves, RS, Brasil
1281
also because it is the temperature where the kiln stays during maintenance operation
for rolls replacement. The pieces were characterized by: water absorption, after
boiling during 2 h; apparent density by thrust in water; firing shrinkage, with caliper.
The planarity was visually evaluated and quantified from the measurement of the
curvature deflection (digital dial indicator) in six points along the two edges
transversal to the kiln movement direction, as illustrated in Figure 3.
y4
y5
y6
y1
y2
y3
Figure 3. Illustration of planarity measurement points.
Laboratorial procedures
Spray-dryer powder of both supports was collected and test-pieces conformed with
approximately 10 kg/m2
and dimensions of 100 mm x 50 mm x 4 mm under the
same humidity conditions (6% w/w dry base) and pressure (40 MPa) like industrial
process. Samples were dried at 110o
C±5o
C by 24h. Engobe and glaze were
industrially applied via bell waterfall under industrial conditions (1.0 kg/m2
engobe
and 1.0 kg/m2
glaze). They were dried at 110±5o
C and characterized by thermal
fleximetry.
To perform the thermal fleximetry a device was built as illustrated in Figure 4.
The apparatus consists in: (1) one laboratorial electric kiln (ML 1300, Fortlab, Brazil);
(2) a system of refractory silica rod, identical to the ones used in contact
dilatometers; (3) the samples; (4) cleavers for support of cordierite and (5) digital dial
indicator (Digimess, China). As the samples heats, the variations in the curvature
deflection are transmitted to the rod that displaces the dial indicator. The figure
illustrated convex curvature, in the positive direction of (7.00±0.01) mm. The
measurement was made under heating rate of 20o
C/min from 25 to 1200o
C or until
the indicator showed a displacement of -2.00 mm. The engobed or glazed face
was turned up. To eliminate effects caused by the thermal expansion a baseline was
determined from thermal fleximetry of a cordierite plate with same dimension. The
weight of the set rod plus dial indicator is approximately 0.30 N, distributed over an
alumina plate of 17 mm x 8 mm x 1mm.
58º Congresso Brasileiro de Cerâmica
18 a 21 de maio de 2014, Bento Gonçalves, RS, Brasil
1282
7,00
1
3 2
4
5
+
-
Fig. 4. Illustration of the device used to thermal fleximetry.
RESULTS AND DISCUSSION
Firing Shrinkage
Figure 5 shows the shrinkage of S1 and S2 body composition as a function of
firing temperature. It is observed that S1 and S2 had similar maximum shrinkage and
temperature, being S2 slightly more refractory. On the other hand, between 850 and
1200o
C, S1 had higher shrinkage in comparison to S2. Higher clay content of
composition S1 was responsible to anticipate firing shrinkage on that temperature
range.
-2
0
2
4
6
8
700 800 900 1000 1100 1200 1300
S2 S1
Shrinkage
(%)
Temperature (oC)
Fig. 5. Firing shrinkage as a function of temperature for S1 and S2 body
composition.
Industrial Procedures
Table 3 shows the results of technological characterization performed with the
industrial pieces for both kinds of products under two firing temperatures. It is
possible to see that at 1200o
C both products developed similar properties and typical
58º Congresso Brasileiro de Cerâmica
18 a 21 de maio de 2014, Bento Gonçalves, RS, Brasil
1283
of glazed porcelain, especially water absorption under 0.5%. Significant differences
were not observed for pieces without application of engobe and glaze (S1 and S2),
in both temperatures, especially on curvature deflection. This result shows that the
body itself, even with the elevated amount of liquid phase at 1200o
C is not able to
generate planarity problems. Pieces with engobe and glaze applications (S+G+V)
had more intense curvatures being higher for P1 fired at 950o
C and lower to P2 fired
at 1200o
C. The more intense curvatures were measured for lower temperatures,
suggesting that the phenomena that generates planarity effects manifest when
engobe and glaze viscosities are higher. Despite those observation, the absolute
values of curvature are considered small and do not cause declassification of
products due to planarity problems. On the other hand, the aesthetic problems were
clearly observed on standard product (P1) and not significant observed on test
product (P2).
Table 3. Industrial results of standard (P1) versus test (P2) condition
P1 P2
Firing temperature (o
C) 950 1200 950 1200
Firing shrinkage (%) 1.8±0.1 6.2±0.1 1.5±0.1 6.2±0.1
Apparent density (kg/m3
) 2040±10 2320±12 2000±11 2340±10
Water absorption (%) 15.2±0.1 0.3±0.1 15.7±0.1 0.3±0.1
Curvature deflection S (mm) 0.05±0.02 0.06±0.02 0.05±0.02 0.05±0.02
Curvature deflection S+E (mm) 0.05±0.02 -0.40±0.02 0.05±0.02 -0.30±0.02
Curvature deflection S+E+G (mm) 1.50±0.02 0.80±0.02 0.50±0.02 0.10±0.02
Laboratorial procedures
Figure 6a shows the thermal fleximetry result of probes S1 and S2, without
application of engobe and glaze. From 900o
C negative curvature is observed due to
formation of liquid phase together with the action of gravity. This result is comparable
to measurement of pyroplastic deformation(14)
. Therefore, from this temperature the
material are under viscous-plastic regime that coincides with the beginning of
sintering showed in Figure 5 by the firing shrinkage. Both support composition had
similar behavior.
Figure 6b shows the curvature evolution for samples with engobe application
(S+G). Composition S+G 2 had almost the same behavior of the samples without
engobe (S2, Figure 6). On the other hand, the set S+G 1 was strongly influenced by
the engobe layer. The fundamental difference among both engobe is related to the
58º Congresso Brasileiro de Cerâmica
18 a 21 de maio de 2014, Bento Gonçalves, RS, Brasil
1284
presence of feldspar in G1 while G2 has only frit as a liquid phase provider. For S+G
2 the frit viscosity was low enough to cause no change in the support behavior. For
S+G 1 positive curvature was observed from approximately 1050ºC, close related to
feldspar fusion(7)
. On this stage two simultaneous phenomena could potentiate
positive curvature, the volumetric expansion due to phase transformation and the
volumetric thermal expansion coefficient of the liquid phase in relation to the
previous crystal phase. At approximately 1160o
C positive curvature reaches a
maximum value. Reduction on engobe viscosity as a function of increasing
temperature, reduce effects on support positive curvature. At 1200o
C the curvature is
almost zero.
Figure 6c has the curvature evolution for samples constituted by the three
components (S+G+V 1 and S+G+V 2). Curvature evolution changed due to glaze
layer. For set S+G+V 2 the presented positive curvature, overcoming gravity
between 950 and 1050 o
C. For S+G+V 1 it is possible to see that the presence of
glaze acted on a similar way as in the previous case. On the other hand, in the
temperature range between 950 and 1050o
C and without glaze, composition S+G 1
had negative curvature. Another important result is related with the maximum
intensity of positive curvature. Composition S+G+V 1 have maximum curvature
about 7.3 mm, much higher than the 0.9 mm for S+G+V 2. This result indicates
higher susceptibility of S+G+V 1 to planarity problems, which was verified through
industrial scale results.
-2.00
0.00
2.00
4.00
6.00
8.00
800 900 1000 1100 1200
S 1 S 2
Temperature (oC)
Curvature
(mm)
-2.00
0.00
2.00
4.00
6.00
8.00
800 900 1000 1100 1200
S+G1 S+G2
Curvature
(mm)
Temperature (oC)
-2.00
0.00
2.00
4.00
6.00
8.00
800 900 1000 1100 1200
S+G+V1
S+G+V2
Temperature (oC)
Curvature
(mm)
Figure 6. Thermal fleximetry of samples (a) S1 and S2, (b) S+G 1 and S+G 2. and
(c) S+E+G 1 and S+E+G 2.
It is possible to see that the main cause of the defect is the positive curvatures
and not the negative curvatures. The first one is caused by the mismatch between
the physical properties of ceramic tile components in viscous-plastic state.
58º Congresso Brasileiro de Cerâmica
18 a 21 de maio de 2014, Bento Gonçalves, RS, Brasil
1285
Qualitative Interpretation Using Timoshenko’s Model
Timoshenko’s model, equation (A), is the simplest model describing curvature
of a sample composed by asymmetric two layers material.
(A)
Where: c = curvature deflection (mm); L = piece length (mm); h = Piece
thickness (mm); Δv-s = (v – s), deformation mismatch between the two materials if
they are uncoupled;
The dimensionless parameter KR, equation (B), takes into account the effect of the
ratio between Young’s modulus and thicknesses of support and glaze layers.
(B)
Where: m = ev/es; n = Ev/Es; ev, es = glaze (v) and body (s) thickness ; Ev, Es =
glaze (v) and body (s) Young’s modulus.
This model is applied for materials with elastic-rigid behavior. In this study, the
curvatures were observed in viscous-plastic state. Thus, the components have no
elasticity modulus, but viscosity. Replacing Hooke’s law by viscous law, equation
(C), the parameter “n” could assumes the form presented in equation (D).
(C); n (D)
Where:  = deformation; t = time;  = tension;  = viscosity
According to this model, the curvatures would be observed if there are
deformation mismatch between the two materials layers, either by thermal
expansion, phase transition and/or sintering. KR constant may attenuate or amplify
the effect on curvature caused by Δv-s. A piece made by two layers of different
materials with same thickness and viscosity tends to amplify the curvature effects.
As a function of thickness and/or viscosity reduction, of one of the layers (engobe
and/or glaze in this case), KR decrease and attenuate curvatures.
In this work, positive curvatures were measured. These result is possible if
support contracts faster than glaze layers due to sintering, or glaze layer expands
more than support by thermal expansion or fusion.
58º Congresso Brasileiro de Cerâmica
18 a 21 de maio de 2014, Bento Gonçalves, RS, Brasil
1286
The body composition with large amount of feldspar had lower firing shrinkage
and higher viscosities between 950 and 1150 o
C, the most critical region of the
problem. The engobe with frit in the place of feldspar became less viscous and free
of expansion caused by feldspar fusion. These effects together had significantly
reduced positive curvature of product P2 compared to P1.
CONCLUSIONS
In this work curvature evolution of porcelain tile was investigated by thermal
fleximetry. Effects of engobe and glaze phase of two compositions were considered.
Industrial experiments was carried out in order to compare with laboratorial results
and final effects on planarity of pieces.
Non glazed pieces tended to present negative curvature during thermal
fleximetry, starting at 900 o
C due to the liquid phase formation, when the material
became viscous-plastic. The negative curvatures are not the main responsible to
final planarity problems once they are relatively well supported by the kiln rolls and
short firing time.
For engobed and glazed pieces, the curvature evolution depends on
differences in mechanical behavior between layers. When positive curvatures are
observed, the material reaches a maximum positive value. The origin of some final
planarity defects is close related to level of maximum positive curvature. Changes on
curvature are observed in the temperature range where simultaneously happen
sintering, fusion, thermal expansion and viscosity reduction of liquid phase. Those
variables, associated to the fact that layers are made by different materials and
different thicknesses, made this arrangement complex. Thermal fleximetry can be a
useful method for future studies to better understanding the mechanisms and also to
development new compositions with performance improvements.
Timoshenko’s model adapted to viscous state may be used for a qualitative
analysis, but in order to really be employed it should be more properly studied. All
layers interfere in the positive curvatures. KR seems to be the key parameter to
control positive curvatures industrially, once deformation mismatch (Δv-s) is more
complex. In order to minimize the problem it would be recommendable to keep some
rigidity of the support until a temperature where engobe and glaze have enough
lower viscosity.
58º Congresso Brasileiro de Cerâmica
18 a 21 de maio de 2014, Bento Gonçalves, RS, Brasil
1287
ACKNOWLEDGMENTS
The authors would like to thank Cerâmica Elizabeth and Universidade do
Extremo Sul Catarinense by the financial support of this research.
REFERENCES
(1) Sanchez E., García-Ten J., Sanz V. & A. Moreno (2010), Porcelain tile:
Almost 30 years of steady scientific-technological evolution. Ceramics
International,36, 831-845.
(2) Shu Z., Garcia J., Monfort E., Amoros J.L., Zhou J. & Wang Y.X. (2012),
Cleaner production of porcelain tile powders: Fired compact properties. Ceramics
International, 38, 1479-1487.
(3) Cantavella V., Moreno A., Mesquita A., Jarque J.C., Barba J. & Palanques A.
(2008). Evolution of stress and curvatures in porous bodies during cooling, Xth world
congress on ceramic tile quality, Qualicer, Castellón, 3, 241-255
(4) SACMI (2003), Tecnologia ceramica aplicatta, Imola.
(5) Cantavella V. (1998). Simulación de la deformación de baldosas cerámicas
durante la cocción. (Chemical Engeneering Tesis) – Universitat Jaume I de Castelló,
Castellón.
(6) Dondi M., Zanelli C., Raimondo M. & G. Guarini (2011) The vitreous phase of
porcelain stoneware: composition, evolution during sintering and physical properties,
Journal of Non-Crystalline Solids, 357, 3251-3260.
(7) M-Márquez J., De la Torre A.G., Aranda M.A.G., Rincón J.M. & Romero M.
(2009) Evolution with temperature of crystalline and amorphous phases in porcelain
stoneware. Journal of the American Ceramic Sociey, 92, 229-234.
(8) Melchiades F.G., Barbosa A.R.D., Boschi A.O. (2000). Relação entre a
curvatura de revestimentos cerâmicos e as características da camada de engobe.
Revista Cerâmica Industrial. Ind., 5, 29-33.
(9) Marino L.F.B. & A.O.Boschi (1998) Expansão térmica de materiais cerâmicos.
Parte III: Efeitos da adição de calcita, Revista Cerâmica Industrial, 3, 18-23.
(10) Amorós J.L., Negre F., Belda A. & Sánchez E. (1996) Acordo esmalte-suporte
(I): A falta de acordo como causa de empenamento. Revista Cerâmica Industrial, 1,
6-13.
(11) Gennari R.C., Dal Bó M., Melchiades F.G., Boschi A.O. (2011) Influencia das
características do engobe na curvatura das placas cerâmicas parte I:
desenvolvimento dos engobes. Revista Cerâmica Industrial, 16, 12-14
(12) Geménez S., Beltrán G., Horrillo S., Mallol G., Cantavella V. & Daroca M.J.
(2000) Pilot-scale study of the influence of firing cycle variables on single-fire tile
curvature. VIth world congress on ceramic tile quality, Qualicer, Castellón., 3, 3-15.
(13) Bannier E., García-Ten J., Castellano J. & Cantavella V. (2013) Delayed
curvature and residual stresses in porcelain tiles, Journal of European Ceramic
Society, 33, 493-501.
(14) Airey A.C. & Birles J.F (2006). Pyroplastic deformation of whiteware bodies.
Pp. 215-224 in: Science of whitewares (V.E. Henkes, G.Y. Onoda & W.M Carty,
editors). American Ceramic Society, Ohio.
58º Congresso Brasileiro de Cerâmica
18 a 21 de maio de 2014, Bento Gonçalves, RS, Brasil
1288

05 009

  • 1.
    CURVATURE EVOLUTION INPORCELAIN TILE DURING FIRING P. Henrique1,2 , A. Wanderlind1 , A. De Noni Jr1* . 1 Programa de Pós-Graduação em Ciência e Engenharia de Materiais– PPGCEM * Universidade do Extremo Sul Catarinense - UNESC Av. Universitária, 1105 - Bairro Universitário, 88806-000, Criciúma (SC) e-mail: agenordenoni@unesc.net 2 Cerâmica Elizabeth, Rod.Luiz Rosso, km 7, 88803-470, Criciúma - SC agenordenoni@unesc.net ABSTRACT Planarity is one of indispensable attribute of a ceramic tile quality. During the firing changes on curvature may be permanent causing damage on quality and productivity. The objective was to evaluate curvature evolution on porcelain tile during heating stage of firing. Effects of engobe and glaze coating were evaluated. The performance of two compositions of porcelain tile was studied on industrial (1000 mm x 500 mm x 10 mm) and laboratorial (100 mm x 50 mm x 6 mm) scale. Industrial test pieces were fired at 950 and 1200 o C. Final curvature was measured by conventional dial indicator. Curvature evolution of laboratorial test pieces was evaluated by thermal fleximetry from 25 to 1200 o C. This characterization was capable to identify very significant positive curvature deflection on temperature range from 930 to 1200 o C, directly associated to permanent planarity defects. Differences on composition affect significantly the curvature evolution. Keywords: Firing, Thermal properties, Traditional ceramics, Structural applications. INTRODUCTION Ceramic tiles are applied in floors and wall of industrial, commercial, home and public places environments. Macroeconomic factors are favoring the growth of the concurrence and world production of this class of products, being constant the search for technological advancement in product and process(1,2) . They are made 58º Congresso Brasileiro de Cerâmica 18 a 21 de maio de 2014, Bento Gonçalves, RS, Brasil 1277
  • 2.
    mainly of threelayers of ceramic materials with distinct properties and behaviors: the body, that is the base of the tile and the thicker part (>90% of total thickness), the engobe and the glaze. One indispensable quality attribute of a ceramic tile is its planarity. The lack of planarity causes seating problems, making it more vulnerable to impact fractures(3) . It may also cause undesired accumulation of water and also interfere in the aesthetic performance of the product. The increase in the level of consumers needs contributing to make planarity, in many products, the higher motivation of complains. One example is rectified glazed products where the seating joints are smaller than 2 mm. This proximity between the ceramic plates allows easy visual perception on planarity imperfections. The problem is greater for ceramic plates of large sizes and small thickness, which has been the world trend in recent years(1) . The problems caused by curvature problems may be present in several ways. The most common are concave or convex pieces, curvatures on corners or edges. Figure 1 illustrates some of the most typical problems(4) . a b c d e f g h a b c d e f g h Figure 1. Typical problems of planarity in ceramic tiles(4) During the manufacture process of ceramic plates, there are several factors that may affect their planarity. This is due to the nature of the body, engobe and glaze as well as to the operations that they are submitted to(5) . During firing, the ceramic plates pass through a succession of phenomena that generate geometric changes in relation to the crude product. Thermal expansion, fusion and sintering are the most relevant ones(6,7) . The resulting final curvature depends on the characteristics of the firing cycle and on the dynamic with which those phenomena manifest themselves and match with the properties of each component of the plate(8) . 58º Congresso Brasileiro de Cerâmica 18 a 21 de maio de 2014, Bento Gonçalves, RS, Brasil 1278
  • 3.
    In order toreduce planarity defects some techniques are well known: (i) Thermal expansion coefficients mismatch between glaze and body during the elastic-rigid state(9,10) ; (ii) Firing shrinkage mismatch between engobe layer during the heating phase(11) ; (iii) Furnace temperature mismatch between the upper and lower parts of the pieces during heating stage of firing(4,5,12) . Delayed curvatures is a another kind of planarity defects observed large ceramic tiles after firing but not well understood yet(13) . Even so, there are a fell works in literature about alterations in the curvature during the heating stage, especially during the viscous-plastic regime and correlating with the mass composition of the ceramic tile components. Despite being transitory those curvatures may generate permanent deformations in the material. During bending, the piece may reach the rolls with an angle able to transfer mechanical deformation energy instead of just supporting and moving the material. Normally this problem is softened by temperature adjustments in the lower and upper parts of the kiln or change glaze and engobes composition by trial and error. Despite all those efforts, many times the defect continues to be visible in the finished product. The photo in Figure 2 is glazed porcelain installed in a Shopping Center. A repetitive pattern of undulation may be seen along one direction concentrated in two of the piece’s four edges. Figure. 2 Photography of esthetical effect caused by defects by edge curvatures. From the geometric point of view, the intensity of planarity loss itself is normally small and difficult to quantify by conventional methods. On the other hand, the defect becomes more evident due to variations in the aesthetic standard of the glazed surface. Low brightness glaze types are normally the ones who evidence the problem. 58º Congresso Brasileiro de Cerâmica 18 a 21 de maio de 2014, Bento Gonçalves, RS, Brasil 1279
  • 4.
    The justification ofthis work is due to the relevance and complexity of planarity defects in ceramic tile industry. The main objective of this work was to evaluate the curvature evolution during heating stage of firing process using thermal fleximetry. Effetcs of composition, engobe and glaze coating as also investigated. MATERIALS AND METHODS Materials The study was based in two products: standard (P1) and test (P2). A glazed porcelain tile was selected as a standard product. Its size was 1000 mm x 500 mm x 10 mm (length x width x thickness) and had planarity problems similar to type A (Figure 1). Changes were made in the composition of both body and engobe in order to significantly attenuate the problem. The glaze composition was not changed in order to not mischaracterize the aesthetic attributes of the product. The pieces were industrially produced by wet milling route. Table 1 and Table 2 show the body’s (S1 and S2) and engobe’s (G1 and G2) composition, respectively, as well as the chemical composition (measured by FRX, Philips PW 2400, The Netherlands) and linear thermal expansion coefficient at 325o C (325) measured by contact dilatometry (Netzsch DIL 402 C, Germany) of each raw materials, individually. The chemical composition and 325 at 325o C of the compositions was determined by weighted mean. Table 1. Composition and thermal expansion of standard (S1) and test (S2) bodies. Raw materials Mixture (% w/w) 325 (x 10-6 o C-1 ) Chemical Composition (%w/w) S1 S2 SiO2 Al2O3 K2O Na2O CaO MgO Fe2O3 Others L.O.I Clay 1 25 25 71.5 61.5 24.9 1.3 1.2 2.7 0.5 1.5 0.5 5.9 Clay 2 50 35 67.8 72.1 15.6 2.4 0.2 0.2 1.0 2.9 0.6 5 Feldspar 1 10 10 109.0 56.4 22.7 5.5 10.5 0.5 0.1 2.2 0.5 1.6 Feldspar 2 10 25 69.6 74.4 15.6 5.1 1.1 0.1 0.1 1.3 ~0 2.3 Talc 5 5 120.0 64.4 7 0.5 0.1 0.6 18.2 2.9 0.7 5.6 Standard body (S1) 74.4 67.7 18.2 67.7 18.2 2.6 1.6 0.9 1.6 2.3 Test body S2 74.7 68.1 18.2 68.1 18.2 3 1.7 0.9 1.4 2.1  linear thermal expansion coefficient at 325 o C. 58º Congresso Brasileiro de Cerâmica 18 a 21 de maio de 2014, Bento Gonçalves, RS, Brasil 1280
  • 5.
    Table 2. Chemicalcomposition and thermal expansion coefficient of standard (G1) and test (G2) engobes; Raw Materials Mixture (% w/w) 325  (x 10-6 o C-1 ) Chemical Composition (%w/w) G1 G2 SiO2 Al2O3 K2O Na2O CaO MgO TiO2 Fe2O3 ZrO2 PF Frit 15 35 63.2 47.3 14.5 4.0 5.0 4.5 2.3 21.8 0.2 0.0 0.4 Zircon 11 11 40.0 33.2 0.1 0.0 0.0 0.1 0.0 0.2 0.1 65.2 1.1 Clay 3 23 23 61.5 69 20.2 0.6 0.0 0.1 0.2 0.7 0.9 0.0 8.4 Kaolin 9 9 40.0 46.8 38.2 0.9 0.2 0.1 0.1 0.0 0.5 0.0 13.1 Quartz 19 19 120.0 99.2 0.4 0.0 0.0 0.0 0.0 0.0 0.0 0.0 0.4 Feldspar 3 20 70.0 74.8 14.8 1.0 7.3 1.1 0.2 0.0 0.1 0.0 0.9 Standard Engobe (G1) 70.5 64.6 13.3 1.0 2.2 0.9 0.4 3.5 0.3 7.2 3.5 Test Engobe (G2) 69.1 59.1 13.2 1.6 1.8 1.6 0.9 7.8 0.3 7.2 3.4 From the economic point of view the test product (P2) increased the raw materials cost in approximately 5%. In the support composition the main change was the reduction in the amount of Clay 2 from 50% to 35%, in its place it was increased the amount of Feldspar 2 from 10% to 25%. In test engobe Feldspar 3 was replaced by Frit 1 from 15% to 35%. Clay 2 has good sinterability due to the amount of potassium oxide in its composition due to the presence of illite. The substitution of Feldspar 2, predominantly potassium, was proposed in order to delay the beginning by the liquid phase formation, but keeping the water absorption value below 0.5% without significant alteration in the firing temperature. The change in engobe composition, was made in order to reduce the engobe viscosity, since feldspar fuses around 1100o C(7) , above the glass transition temperature of the frit, at around 660o C. Industrial Procedures Three different types of industrial pieces were produced: body only (S), with a mass of 20 kg/m2 ; body+engobe (S+G) with a mass of 21 kg/m2 ; body+engobe+glaze (S+G+V or P) with a mass of 22 kg/m2 . Pieces were fired in the usual process condition of 1200o C in industrial roller kiln (Sacmi, Ímola Italy, 221 m of length) and cold-to-cold time of 55 min. The kiln was properly regulated for the best planarity result. Some pieces were also fired at 950o C. This temperature was chosen because could give some additional information about pieces behavior and 58º Congresso Brasileiro de Cerâmica 18 a 21 de maio de 2014, Bento Gonçalves, RS, Brasil 1281
  • 6.
    also because itis the temperature where the kiln stays during maintenance operation for rolls replacement. The pieces were characterized by: water absorption, after boiling during 2 h; apparent density by thrust in water; firing shrinkage, with caliper. The planarity was visually evaluated and quantified from the measurement of the curvature deflection (digital dial indicator) in six points along the two edges transversal to the kiln movement direction, as illustrated in Figure 3. y4 y5 y6 y1 y2 y3 Figure 3. Illustration of planarity measurement points. Laboratorial procedures Spray-dryer powder of both supports was collected and test-pieces conformed with approximately 10 kg/m2 and dimensions of 100 mm x 50 mm x 4 mm under the same humidity conditions (6% w/w dry base) and pressure (40 MPa) like industrial process. Samples were dried at 110o C±5o C by 24h. Engobe and glaze were industrially applied via bell waterfall under industrial conditions (1.0 kg/m2 engobe and 1.0 kg/m2 glaze). They were dried at 110±5o C and characterized by thermal fleximetry. To perform the thermal fleximetry a device was built as illustrated in Figure 4. The apparatus consists in: (1) one laboratorial electric kiln (ML 1300, Fortlab, Brazil); (2) a system of refractory silica rod, identical to the ones used in contact dilatometers; (3) the samples; (4) cleavers for support of cordierite and (5) digital dial indicator (Digimess, China). As the samples heats, the variations in the curvature deflection are transmitted to the rod that displaces the dial indicator. The figure illustrated convex curvature, in the positive direction of (7.00±0.01) mm. The measurement was made under heating rate of 20o C/min from 25 to 1200o C or until the indicator showed a displacement of -2.00 mm. The engobed or glazed face was turned up. To eliminate effects caused by the thermal expansion a baseline was determined from thermal fleximetry of a cordierite plate with same dimension. The weight of the set rod plus dial indicator is approximately 0.30 N, distributed over an alumina plate of 17 mm x 8 mm x 1mm. 58º Congresso Brasileiro de Cerâmica 18 a 21 de maio de 2014, Bento Gonçalves, RS, Brasil 1282
  • 7.
    7,00 1 3 2 4 5 + - Fig. 4.Illustration of the device used to thermal fleximetry. RESULTS AND DISCUSSION Firing Shrinkage Figure 5 shows the shrinkage of S1 and S2 body composition as a function of firing temperature. It is observed that S1 and S2 had similar maximum shrinkage and temperature, being S2 slightly more refractory. On the other hand, between 850 and 1200o C, S1 had higher shrinkage in comparison to S2. Higher clay content of composition S1 was responsible to anticipate firing shrinkage on that temperature range. -2 0 2 4 6 8 700 800 900 1000 1100 1200 1300 S2 S1 Shrinkage (%) Temperature (oC) Fig. 5. Firing shrinkage as a function of temperature for S1 and S2 body composition. Industrial Procedures Table 3 shows the results of technological characterization performed with the industrial pieces for both kinds of products under two firing temperatures. It is possible to see that at 1200o C both products developed similar properties and typical 58º Congresso Brasileiro de Cerâmica 18 a 21 de maio de 2014, Bento Gonçalves, RS, Brasil 1283
  • 8.
    of glazed porcelain,especially water absorption under 0.5%. Significant differences were not observed for pieces without application of engobe and glaze (S1 and S2), in both temperatures, especially on curvature deflection. This result shows that the body itself, even with the elevated amount of liquid phase at 1200o C is not able to generate planarity problems. Pieces with engobe and glaze applications (S+G+V) had more intense curvatures being higher for P1 fired at 950o C and lower to P2 fired at 1200o C. The more intense curvatures were measured for lower temperatures, suggesting that the phenomena that generates planarity effects manifest when engobe and glaze viscosities are higher. Despite those observation, the absolute values of curvature are considered small and do not cause declassification of products due to planarity problems. On the other hand, the aesthetic problems were clearly observed on standard product (P1) and not significant observed on test product (P2). Table 3. Industrial results of standard (P1) versus test (P2) condition P1 P2 Firing temperature (o C) 950 1200 950 1200 Firing shrinkage (%) 1.8±0.1 6.2±0.1 1.5±0.1 6.2±0.1 Apparent density (kg/m3 ) 2040±10 2320±12 2000±11 2340±10 Water absorption (%) 15.2±0.1 0.3±0.1 15.7±0.1 0.3±0.1 Curvature deflection S (mm) 0.05±0.02 0.06±0.02 0.05±0.02 0.05±0.02 Curvature deflection S+E (mm) 0.05±0.02 -0.40±0.02 0.05±0.02 -0.30±0.02 Curvature deflection S+E+G (mm) 1.50±0.02 0.80±0.02 0.50±0.02 0.10±0.02 Laboratorial procedures Figure 6a shows the thermal fleximetry result of probes S1 and S2, without application of engobe and glaze. From 900o C negative curvature is observed due to formation of liquid phase together with the action of gravity. This result is comparable to measurement of pyroplastic deformation(14) . Therefore, from this temperature the material are under viscous-plastic regime that coincides with the beginning of sintering showed in Figure 5 by the firing shrinkage. Both support composition had similar behavior. Figure 6b shows the curvature evolution for samples with engobe application (S+G). Composition S+G 2 had almost the same behavior of the samples without engobe (S2, Figure 6). On the other hand, the set S+G 1 was strongly influenced by the engobe layer. The fundamental difference among both engobe is related to the 58º Congresso Brasileiro de Cerâmica 18 a 21 de maio de 2014, Bento Gonçalves, RS, Brasil 1284
  • 9.
    presence of feldsparin G1 while G2 has only frit as a liquid phase provider. For S+G 2 the frit viscosity was low enough to cause no change in the support behavior. For S+G 1 positive curvature was observed from approximately 1050ºC, close related to feldspar fusion(7) . On this stage two simultaneous phenomena could potentiate positive curvature, the volumetric expansion due to phase transformation and the volumetric thermal expansion coefficient of the liquid phase in relation to the previous crystal phase. At approximately 1160o C positive curvature reaches a maximum value. Reduction on engobe viscosity as a function of increasing temperature, reduce effects on support positive curvature. At 1200o C the curvature is almost zero. Figure 6c has the curvature evolution for samples constituted by the three components (S+G+V 1 and S+G+V 2). Curvature evolution changed due to glaze layer. For set S+G+V 2 the presented positive curvature, overcoming gravity between 950 and 1050 o C. For S+G+V 1 it is possible to see that the presence of glaze acted on a similar way as in the previous case. On the other hand, in the temperature range between 950 and 1050o C and without glaze, composition S+G 1 had negative curvature. Another important result is related with the maximum intensity of positive curvature. Composition S+G+V 1 have maximum curvature about 7.3 mm, much higher than the 0.9 mm for S+G+V 2. This result indicates higher susceptibility of S+G+V 1 to planarity problems, which was verified through industrial scale results. -2.00 0.00 2.00 4.00 6.00 8.00 800 900 1000 1100 1200 S 1 S 2 Temperature (oC) Curvature (mm) -2.00 0.00 2.00 4.00 6.00 8.00 800 900 1000 1100 1200 S+G1 S+G2 Curvature (mm) Temperature (oC) -2.00 0.00 2.00 4.00 6.00 8.00 800 900 1000 1100 1200 S+G+V1 S+G+V2 Temperature (oC) Curvature (mm) Figure 6. Thermal fleximetry of samples (a) S1 and S2, (b) S+G 1 and S+G 2. and (c) S+E+G 1 and S+E+G 2. It is possible to see that the main cause of the defect is the positive curvatures and not the negative curvatures. The first one is caused by the mismatch between the physical properties of ceramic tile components in viscous-plastic state. 58º Congresso Brasileiro de Cerâmica 18 a 21 de maio de 2014, Bento Gonçalves, RS, Brasil 1285
  • 10.
    Qualitative Interpretation UsingTimoshenko’s Model Timoshenko’s model, equation (A), is the simplest model describing curvature of a sample composed by asymmetric two layers material. (A) Where: c = curvature deflection (mm); L = piece length (mm); h = Piece thickness (mm); Δv-s = (v – s), deformation mismatch between the two materials if they are uncoupled; The dimensionless parameter KR, equation (B), takes into account the effect of the ratio between Young’s modulus and thicknesses of support and glaze layers. (B) Where: m = ev/es; n = Ev/Es; ev, es = glaze (v) and body (s) thickness ; Ev, Es = glaze (v) and body (s) Young’s modulus. This model is applied for materials with elastic-rigid behavior. In this study, the curvatures were observed in viscous-plastic state. Thus, the components have no elasticity modulus, but viscosity. Replacing Hooke’s law by viscous law, equation (C), the parameter “n” could assumes the form presented in equation (D). (C); n (D) Where:  = deformation; t = time;  = tension;  = viscosity According to this model, the curvatures would be observed if there are deformation mismatch between the two materials layers, either by thermal expansion, phase transition and/or sintering. KR constant may attenuate or amplify the effect on curvature caused by Δv-s. A piece made by two layers of different materials with same thickness and viscosity tends to amplify the curvature effects. As a function of thickness and/or viscosity reduction, of one of the layers (engobe and/or glaze in this case), KR decrease and attenuate curvatures. In this work, positive curvatures were measured. These result is possible if support contracts faster than glaze layers due to sintering, or glaze layer expands more than support by thermal expansion or fusion. 58º Congresso Brasileiro de Cerâmica 18 a 21 de maio de 2014, Bento Gonçalves, RS, Brasil 1286
  • 11.
    The body compositionwith large amount of feldspar had lower firing shrinkage and higher viscosities between 950 and 1150 o C, the most critical region of the problem. The engobe with frit in the place of feldspar became less viscous and free of expansion caused by feldspar fusion. These effects together had significantly reduced positive curvature of product P2 compared to P1. CONCLUSIONS In this work curvature evolution of porcelain tile was investigated by thermal fleximetry. Effects of engobe and glaze phase of two compositions were considered. Industrial experiments was carried out in order to compare with laboratorial results and final effects on planarity of pieces. Non glazed pieces tended to present negative curvature during thermal fleximetry, starting at 900 o C due to the liquid phase formation, when the material became viscous-plastic. The negative curvatures are not the main responsible to final planarity problems once they are relatively well supported by the kiln rolls and short firing time. For engobed and glazed pieces, the curvature evolution depends on differences in mechanical behavior between layers. When positive curvatures are observed, the material reaches a maximum positive value. The origin of some final planarity defects is close related to level of maximum positive curvature. Changes on curvature are observed in the temperature range where simultaneously happen sintering, fusion, thermal expansion and viscosity reduction of liquid phase. Those variables, associated to the fact that layers are made by different materials and different thicknesses, made this arrangement complex. Thermal fleximetry can be a useful method for future studies to better understanding the mechanisms and also to development new compositions with performance improvements. Timoshenko’s model adapted to viscous state may be used for a qualitative analysis, but in order to really be employed it should be more properly studied. All layers interfere in the positive curvatures. KR seems to be the key parameter to control positive curvatures industrially, once deformation mismatch (Δv-s) is more complex. In order to minimize the problem it would be recommendable to keep some rigidity of the support until a temperature where engobe and glaze have enough lower viscosity. 58º Congresso Brasileiro de Cerâmica 18 a 21 de maio de 2014, Bento Gonçalves, RS, Brasil 1287
  • 12.
    ACKNOWLEDGMENTS The authors wouldlike to thank Cerâmica Elizabeth and Universidade do Extremo Sul Catarinense by the financial support of this research. REFERENCES (1) Sanchez E., García-Ten J., Sanz V. & A. Moreno (2010), Porcelain tile: Almost 30 years of steady scientific-technological evolution. Ceramics International,36, 831-845. (2) Shu Z., Garcia J., Monfort E., Amoros J.L., Zhou J. & Wang Y.X. (2012), Cleaner production of porcelain tile powders: Fired compact properties. Ceramics International, 38, 1479-1487. (3) Cantavella V., Moreno A., Mesquita A., Jarque J.C., Barba J. & Palanques A. (2008). Evolution of stress and curvatures in porous bodies during cooling, Xth world congress on ceramic tile quality, Qualicer, Castellón, 3, 241-255 (4) SACMI (2003), Tecnologia ceramica aplicatta, Imola. (5) Cantavella V. (1998). Simulación de la deformación de baldosas cerámicas durante la cocción. (Chemical Engeneering Tesis) – Universitat Jaume I de Castelló, Castellón. (6) Dondi M., Zanelli C., Raimondo M. & G. Guarini (2011) The vitreous phase of porcelain stoneware: composition, evolution during sintering and physical properties, Journal of Non-Crystalline Solids, 357, 3251-3260. (7) M-Márquez J., De la Torre A.G., Aranda M.A.G., Rincón J.M. & Romero M. (2009) Evolution with temperature of crystalline and amorphous phases in porcelain stoneware. Journal of the American Ceramic Sociey, 92, 229-234. (8) Melchiades F.G., Barbosa A.R.D., Boschi A.O. (2000). Relação entre a curvatura de revestimentos cerâmicos e as características da camada de engobe. Revista Cerâmica Industrial. Ind., 5, 29-33. (9) Marino L.F.B. & A.O.Boschi (1998) Expansão térmica de materiais cerâmicos. Parte III: Efeitos da adição de calcita, Revista Cerâmica Industrial, 3, 18-23. (10) Amorós J.L., Negre F., Belda A. & Sánchez E. (1996) Acordo esmalte-suporte (I): A falta de acordo como causa de empenamento. Revista Cerâmica Industrial, 1, 6-13. (11) Gennari R.C., Dal Bó M., Melchiades F.G., Boschi A.O. (2011) Influencia das características do engobe na curvatura das placas cerâmicas parte I: desenvolvimento dos engobes. Revista Cerâmica Industrial, 16, 12-14 (12) Geménez S., Beltrán G., Horrillo S., Mallol G., Cantavella V. & Daroca M.J. (2000) Pilot-scale study of the influence of firing cycle variables on single-fire tile curvature. VIth world congress on ceramic tile quality, Qualicer, Castellón., 3, 3-15. (13) Bannier E., García-Ten J., Castellano J. & Cantavella V. (2013) Delayed curvature and residual stresses in porcelain tiles, Journal of European Ceramic Society, 33, 493-501. (14) Airey A.C. & Birles J.F (2006). Pyroplastic deformation of whiteware bodies. Pp. 215-224 in: Science of whitewares (V.E. Henkes, G.Y. Onoda & W.M Carty, editors). American Ceramic Society, Ohio. 58º Congresso Brasileiro de Cerâmica 18 a 21 de maio de 2014, Bento Gonçalves, RS, Brasil 1288