036-Tijssen R&D Excellence New performance indicators for international comparison
•
0 likes•230 views

Blue Sky 3 - Poster Gallery
Recommended

Recommended
More Related Content
What's hot
What's hot (20)
Similar to 036-Tijssen R&D Excellence New performance indicators for international comparison
Similar to 036-Tijssen R&D Excellence New performance indicators for international comparison (20)
More from innovationoecd
More from innovationoecd (20)
Recently uploaded
Recently uploaded (20)
036-Tijssen R&D Excellence New performance indicators for international comparison
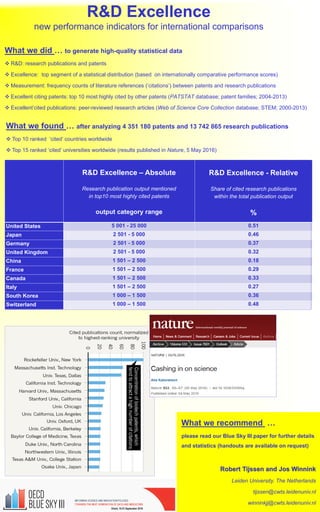
- 1. R&D Excellence new performance indicators for international comparisons What we did … to generate high-quality statistical data R&D: research publications and patents Excellence: top segment of a statistical distribution (based on internationally comparative performance scores) Measurement: frequency counts of literature references (‘citations’) between patents and research publications Excellent citing patents: top 10 most highly cited by other patents (PATSTAT database; patent families; 2004-2013) Excellent’cited publications: peer-reviewed research articles (Web of Science Core Collection database; STEM; 2000-2013) What we recommend … please read our Blue Sky III paper for further details and statistics (handouts are available on request) Robert Tijssen and Jos Winnink Leiden University. The Netherlands tijssen@cwts.leidenuniv.nl winninkjj@cwts.leidenuniv.nl R&D Excellence – Absolute Research publication output mentioned in top10 most highly cited patents output category range R&D Excellence - Relative Share of cited research publications within the total publication output % United States 5 001 - 25 000 0.51 Japan 2 501 - 5 000 0.46 Germany 2 501 - 5 000 0.37 United Kingdom 2 501 - 5 000 0.32 China 1 501 – 2 500 0.18 France 1 501 – 2 500 0.29 Canada 1 501 – 2 500 0.33 Italy 1 501 – 2 500 0.27 South Korea 1 000 – 1 500 0.36 Switzerland 1 000 – 1 500 0.48 What we found … after analyzing 4 351 180 patents and 13 742 865 research publications Top 10 ranked ‘cited’ countries worldwide Top 15 ranked ‘cited’ universities worldwide (results published in Nature, 5 May 2016)