


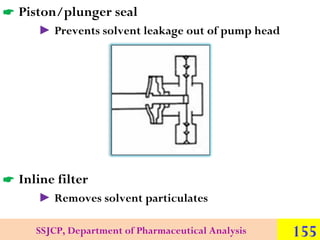
![Peak width
Retention factor (k)
Phase ratio
Retention volume (VR or tR)
Plate height (H)
Separation factor (a)
Plate number (N)
Solid support
Pressure drop
Solute
Reduced mobile phase velocity (n) Stationary phase
Resolution (Peak) [ Rs ]/
Resolution(R)
Tailing
Reduced plate height (h)
Void volume
Relative Retention time (RRT)
Retention time (tR )
Interparticle time (tZ)
Capacity factor (k’)
Dead Volume(Vd)
Selectivity factor (α)
SSJCP, Department of Pharmaceutical Analysis
12](https://image.slidesharecdn.com/hplc-131125225011-phpapp01/85/HPLC-12-320.jpg)


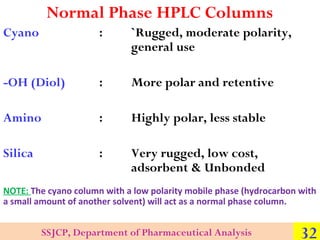


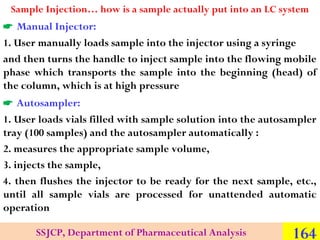
![RESOLUTION
For closely eluting or adjacent peaks, the
resolution equation may be expressed as:
Rs = 1 / 4[(α − 1) / α ] N [k ' /(1 + k ' )]
The terms of capacity factor (k’), selectivity (α),
and efficiency (N) all contribute to resolution
SSJCP, Department of Pharmaceutical Analysis
82](https://image.slidesharecdn.com/hplc-131125225011-phpapp01/85/HPLC-82-320.jpg)


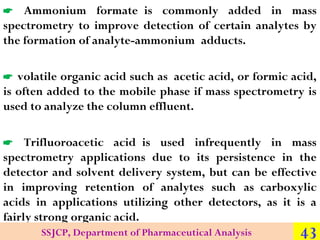
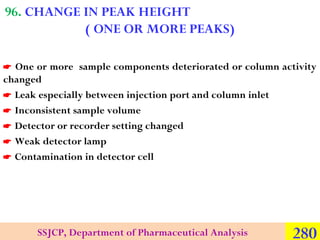
![Effect of α on Overall Resolution
Remember the resolution equation?
Rs = 1 / 4[(α − 1) / α ] N [k ' /(1 + k ' )]
Let’s only look at the part involving α
Rs = 1 / 4[(α −1) / α]
And see how much resolution will improve with small changes in α
SSJCP, Department of Pharmaceutical Analysis
91](https://image.slidesharecdn.com/hplc-131125225011-phpapp01/85/HPLC-91-320.jpg)


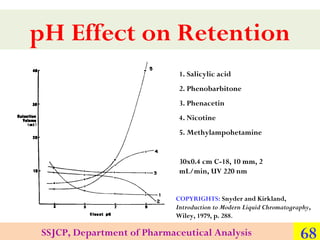
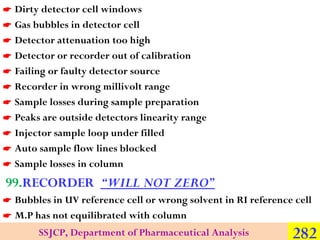
![Effect of N on Overall Resolution
Do you STILL remember the resolution equation?
Rs let’s/lookαat − 1)part ]involving/(1 + k ' )]
= 1 4[( the / α N [k ' N
Now
Rs = 1 / 4 N
And see how much resolution will improve with
changes in N
SSJCP, Department of Pharmaceutical Analysis
99](https://image.slidesharecdn.com/hplc-131125225011-phpapp01/85/HPLC-99-320.jpg)


![Examples
Stationary phase contains charged groups
SAX (Strong Anion Exchange): NH3+
WAX (Weak Anion Exchange): NR2H+(DEAE)
[Di Ethyl Amino Ethanol]
SCX (Strong Cation Exchange): SO3-
WCX (Weak Cation Exchange): CarboxyMethyl
(CM)
More highly charged analytes have stronger
retention
More “bulky” stationary phases have weaker
retention
SSJCP, Department of Pharmaceutical Analysis
112](https://image.slidesharecdn.com/hplc-131125225011-phpapp01/85/HPLC-112-320.jpg)


![ Within the Column is where separation occurs
Key Point – Proper choice of column is critical for success in HPLC
Types of columns in HPLC:
►Analytical [internal diameter (i.d.) 1.0 - 4.6-mm; lengths 15 – 250
mm]
► Preparative (i.d. > 4.6 mm; lengths 50 – 250 mm)
► Capillary (i.d. 0.1 - 1.0 mm; various lengths)
► Nano (i.d. < 0.1 mm, or sometimes stated as < 100 µm)
Materials of construction for the tubing
► Stainless steel (the most popular; gives high pressure capabilities)
► Glass (mostly for biomolecules)
► PEEK polymer (biocompatible and chemically inert to most
solvents)
SSJCP, Department of Pharmaceutical Analysis
171](https://image.slidesharecdn.com/hplc-131125225011-phpapp01/85/HPLC-171-320.jpg)


This document provides an overview of high performance liquid chromatography (HPLC) presented by Ravi Pratap Pulla. It introduces HPLC and its history. Key topics covered include HPLC components like columns and systems. Applications to pharmaceutical analysis are discussed. The document also reviews some basic HPLC terminology and concepts.