1. Flow Cytometry
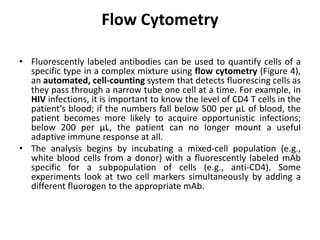
• Fluorescently labeled antibodies can be used to quantify cells of a
specific type in a complex mixture using flow cytometry (Figure 4),
an automated, cell-counting system that detects fluorescing cells as
they pass through a narrow tube one cell at a time. For example, in
HIV infections, it is important to know the level of CD4 T cells in the
patient’s blood; if the numbers fall below 500 per μL of blood, the
patient becomes more likely to acquire opportunistic infections;
below 200 per μL, the patient can no longer mount a useful
adaptive immune response at all.
• The analysis begins by incubating a mixed-cell population (e.g.,
white blood cells from a donor) with a fluorescently labeled mAb
specific for a subpopulation of cells (e.g., anti-CD4). Some
experiments look at two cell markers simultaneously by adding a
different fluorogen to the appropriate mAb.
2. Cont;
• The cells are then introduced to the flow
cytometer through a narrow capillary that
forces the cells to pass in single file. A laser is
used to activate the fluorogen. The
fluorescent light radiates out in all directions,
so the fluorescence detector can be
positioned at an angle from the incident laser
light.
3. Cont;
• Figure 4 shows the obscuration bar in front of the
forward-scatter detector that prevents laser light from
hitting the detector. As a cell passes through the laser
bar, the forward-scatter detector detects light scattered
around the obscuration bar. The scattered light is
transformed into a voltage pulse, and the cytometer
counts a cell.
• The fluorescence from a labeled cell is detected by the
side-scatter detectors. The light passes through various
dichroic mirrors such that the light emitted from the
fluorophore is received by the correct detector.
4.
5. Cont;
• Data are collected from both the forward- and
side-scatter detectors. One way these data can be
presented is in the form of a histogram. The
forward scatter is placed on the y-axis (to
represent the number of cells), and the side
scatter is placed on the x-axis (to represent the
fluoresence of each cell). The scaling for the x-
axis is logarithmic, so fluorescence intensity
increases by a factor of 10 with each unit increase
along the axis.
6. • Flow cytometry data are often compiled as a histogram. In the
histogram, the area under each peak is proportional to the number
of cells in each population. The x-axis is the relative fluorescence
expressed by the cells (on a log scale), and the y-axis represents the
number of cells at a particular level of fluorescence.
Figure 5 depicts an example in which a culture of cells is combined
with an antibody attached to a fluorophore to detect CD8 cells and
then analyzed by flow cytometry.
• The histogram has two peaks. The peak on the left has lower
fluorescence readings, representing the subset of the cell
population (approximately 30 cells) that does not fluoresce; hence,
they are not bound by antibody and therefore do not express CD8.
The peak on the right has higher fluorescence readings,
representing the subset of the cell population (approximately 100
cells) that show fluorescence; hence, they are bound by the
antibody and therefore do express CD8
7.
8. Cell Sorting Using
Immunofluorescence
• The flow cytometer and immunofluorescence can also be
modified to sort cells from a single sample into purified
subpopulations of cells for research purposes. This
modification of the flow cytometer is called a fluorescence-
activated cell sorter (FACS). In a FACS, fluorescence by a
cell induces the device to put a charge on a droplet of the
transporting fluid containing that cell.
• The charge is specific to the wavelength of the fluorescent
light, which allows for differential sorting by those different
charges. The sorting is accomplished by an electrostatic
deflector that moves the charged droplet containing the
cell into one collecting vessel or another. The process
results in highly purified subpopulations of cells.
9. Cont;
• One limitation of a FACS is that it only works on
isolated cells. Thus, the method would work in sorting
white blood cells, since they exist as isolated cells. But
for cells in a tissue, flow cytometry can only be applied
if we can excise the tissue and separate it into single
cells (using proteases to cleave cell-cell adhesion
molecules) without disrupting cell integrity.
• This method may be used on tumors, but more often,
immunohistochemistry and immunocytochemistry are
used to study cells in tissues.