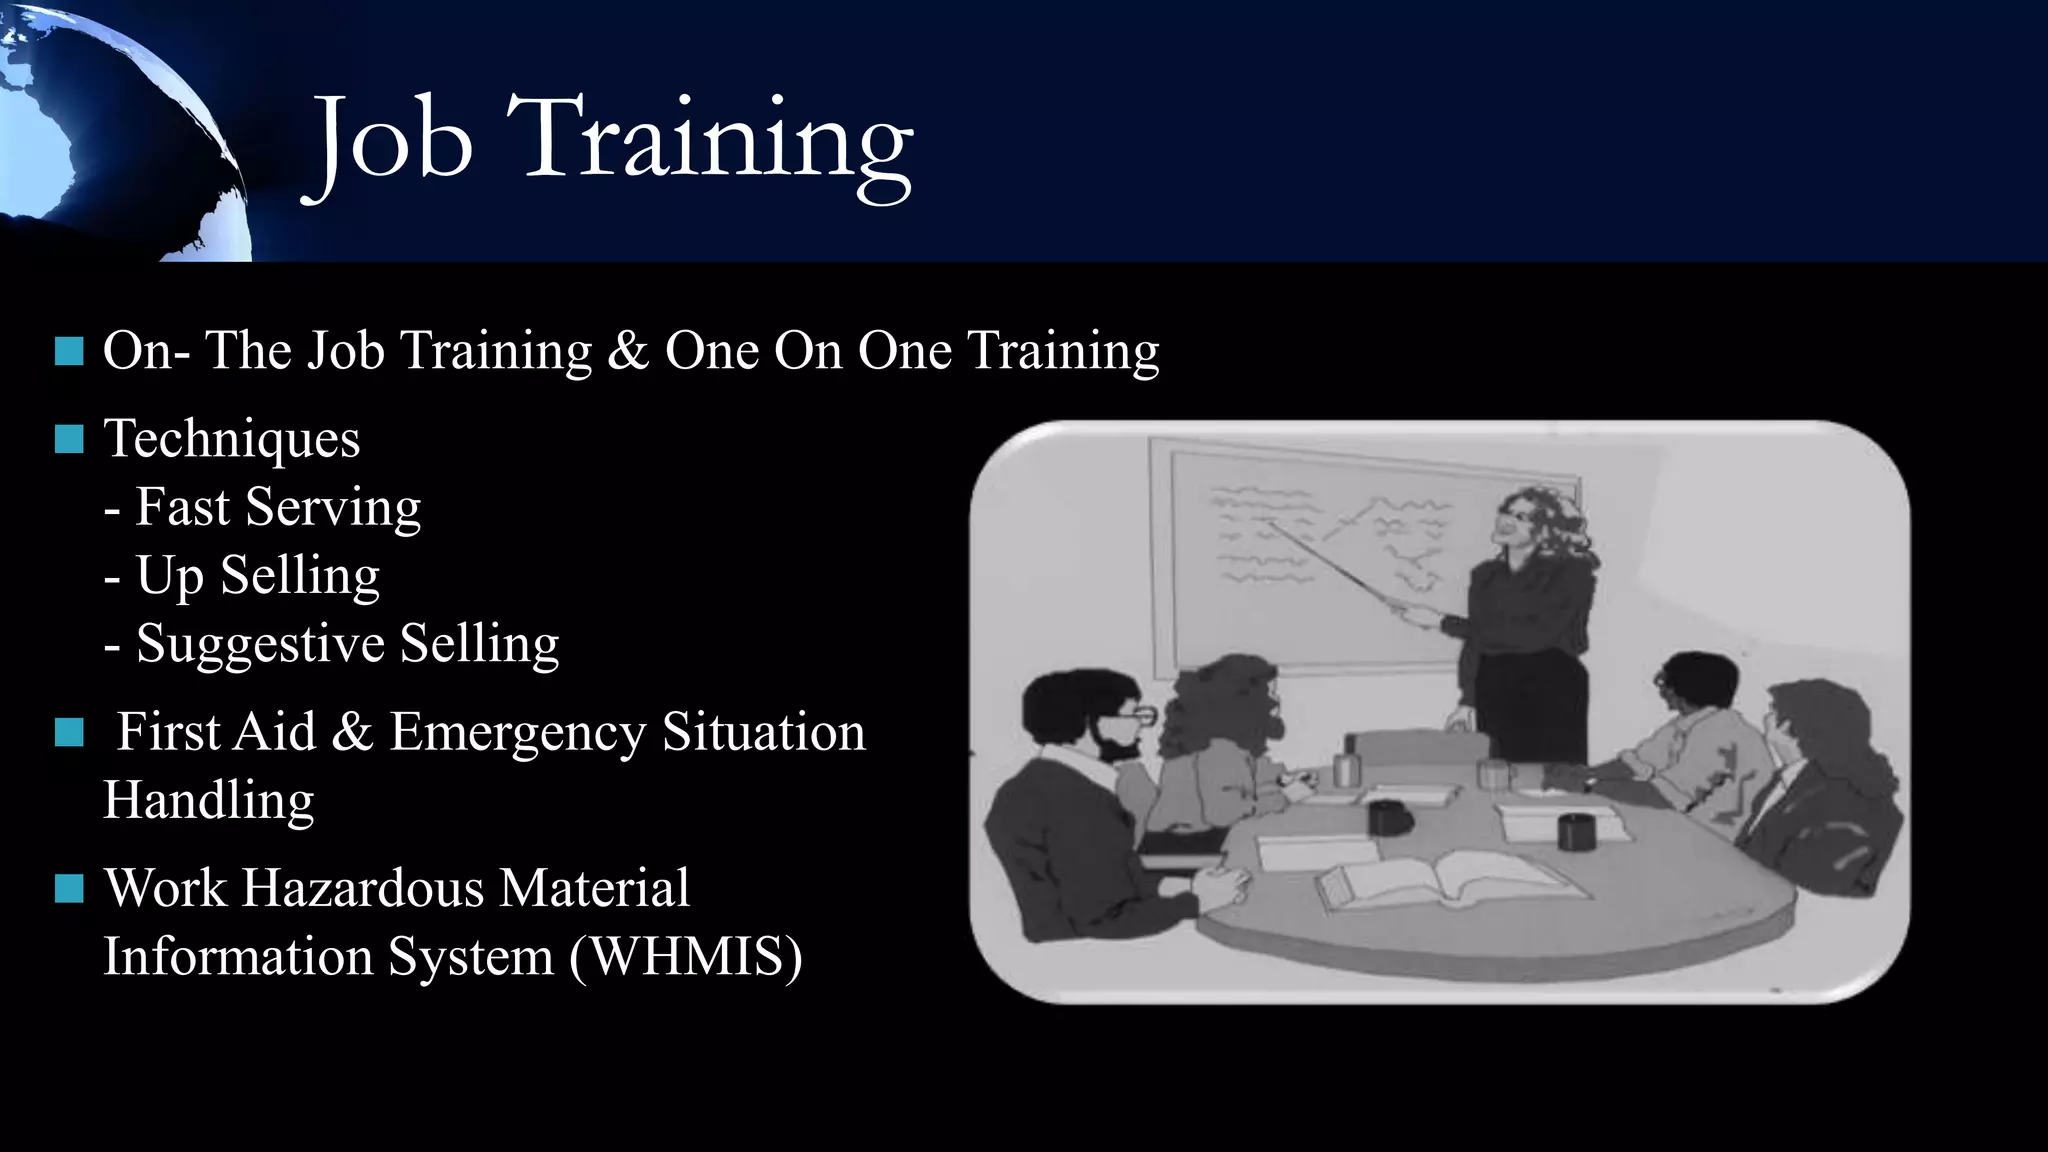
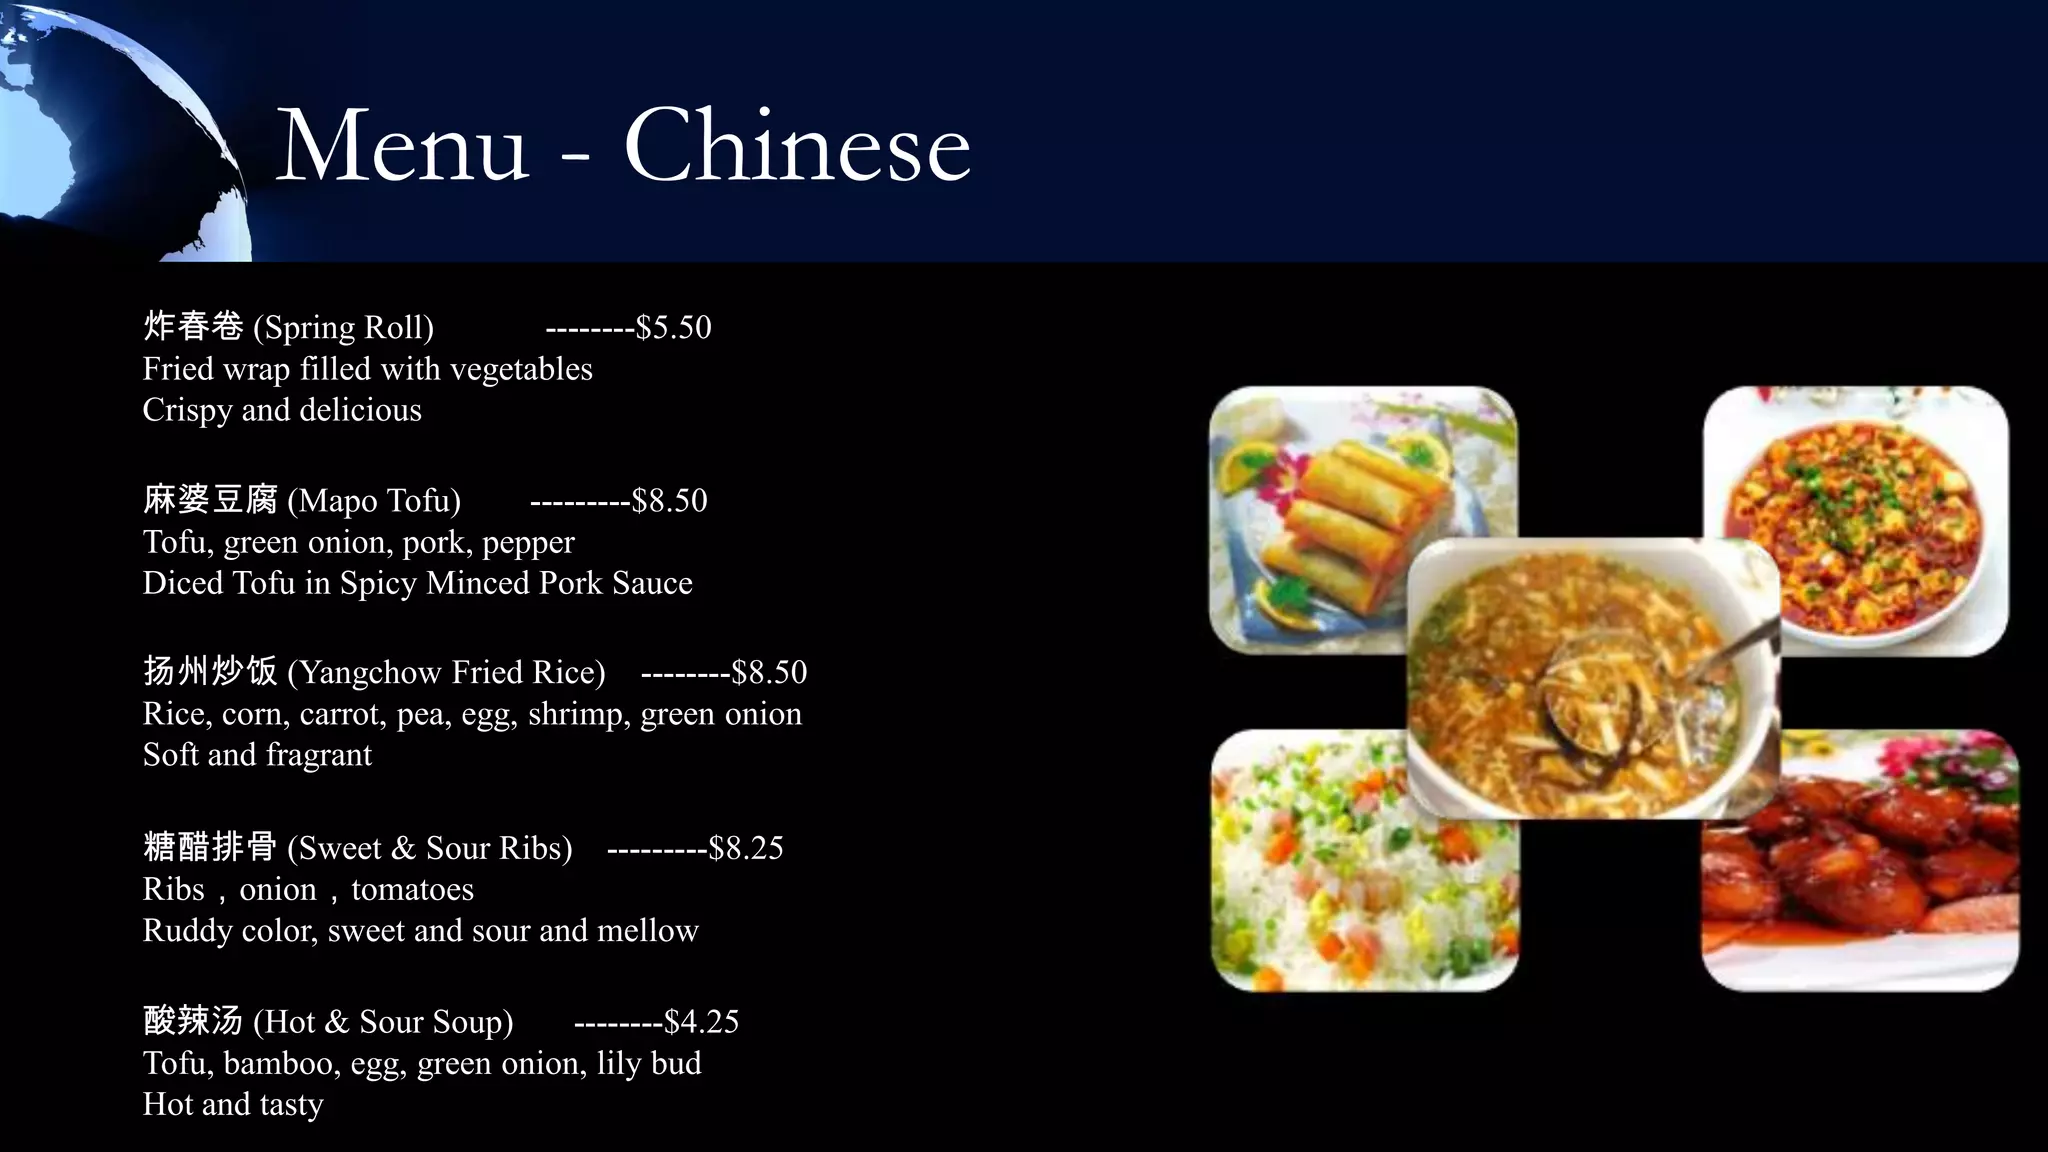
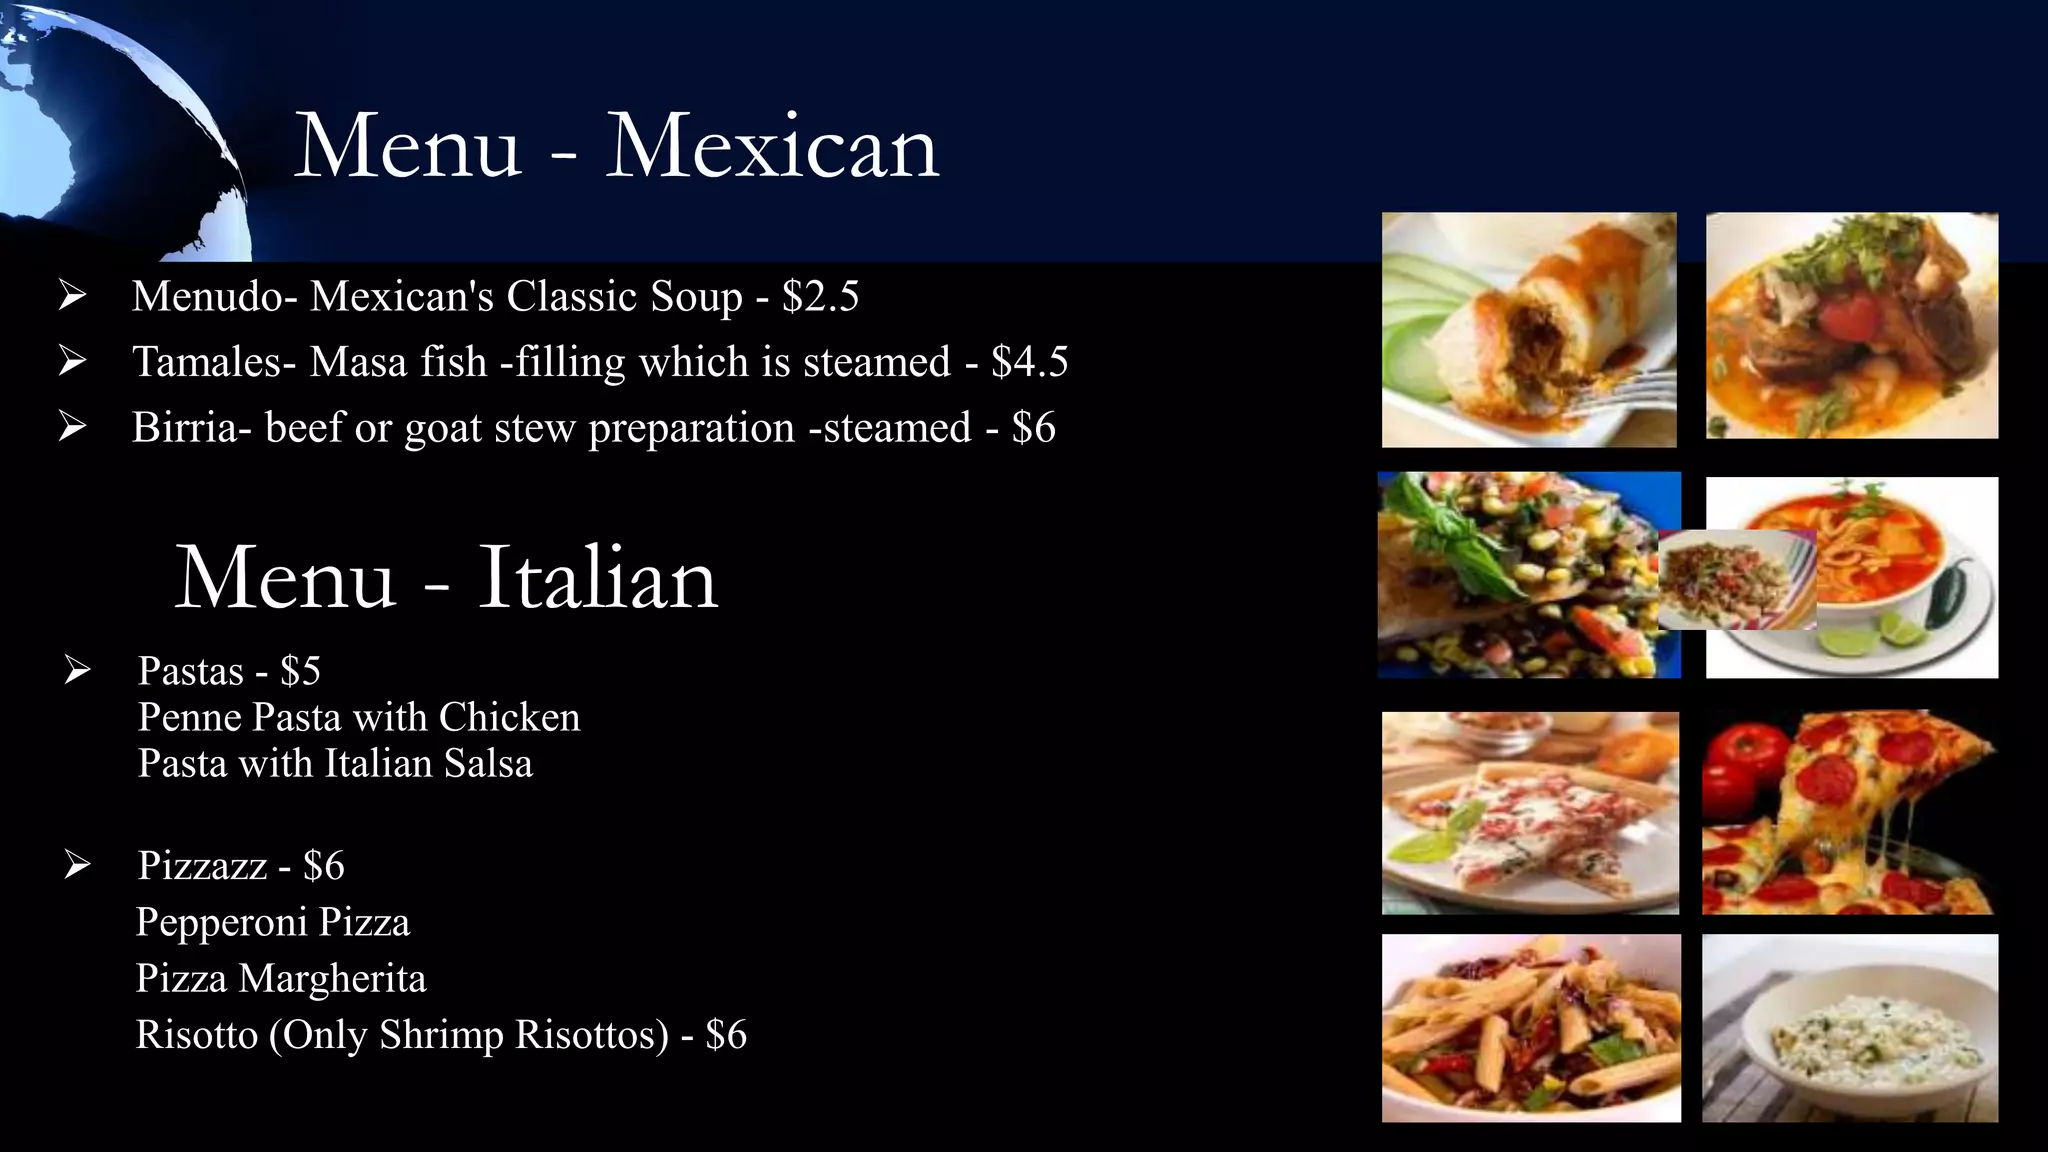
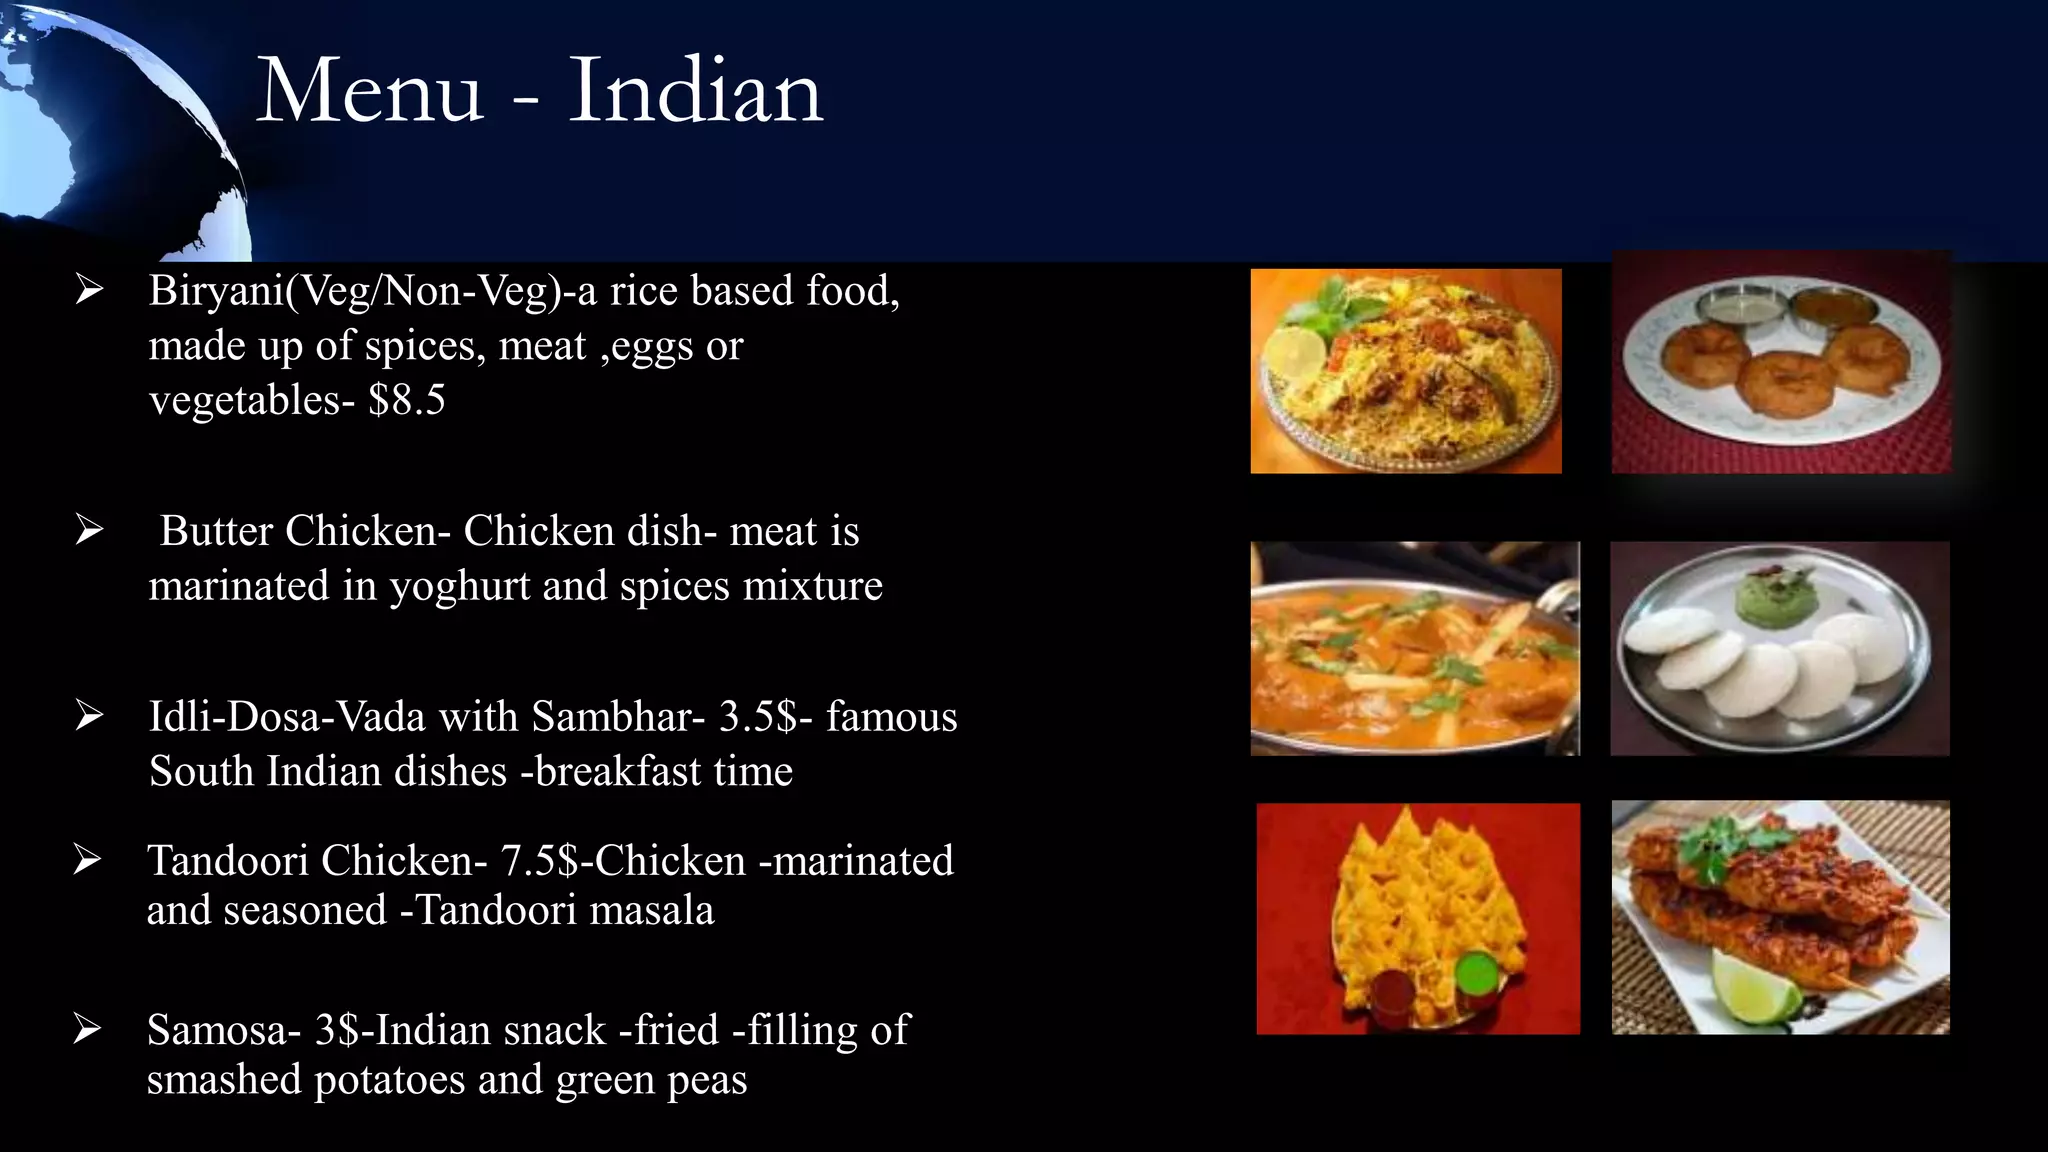
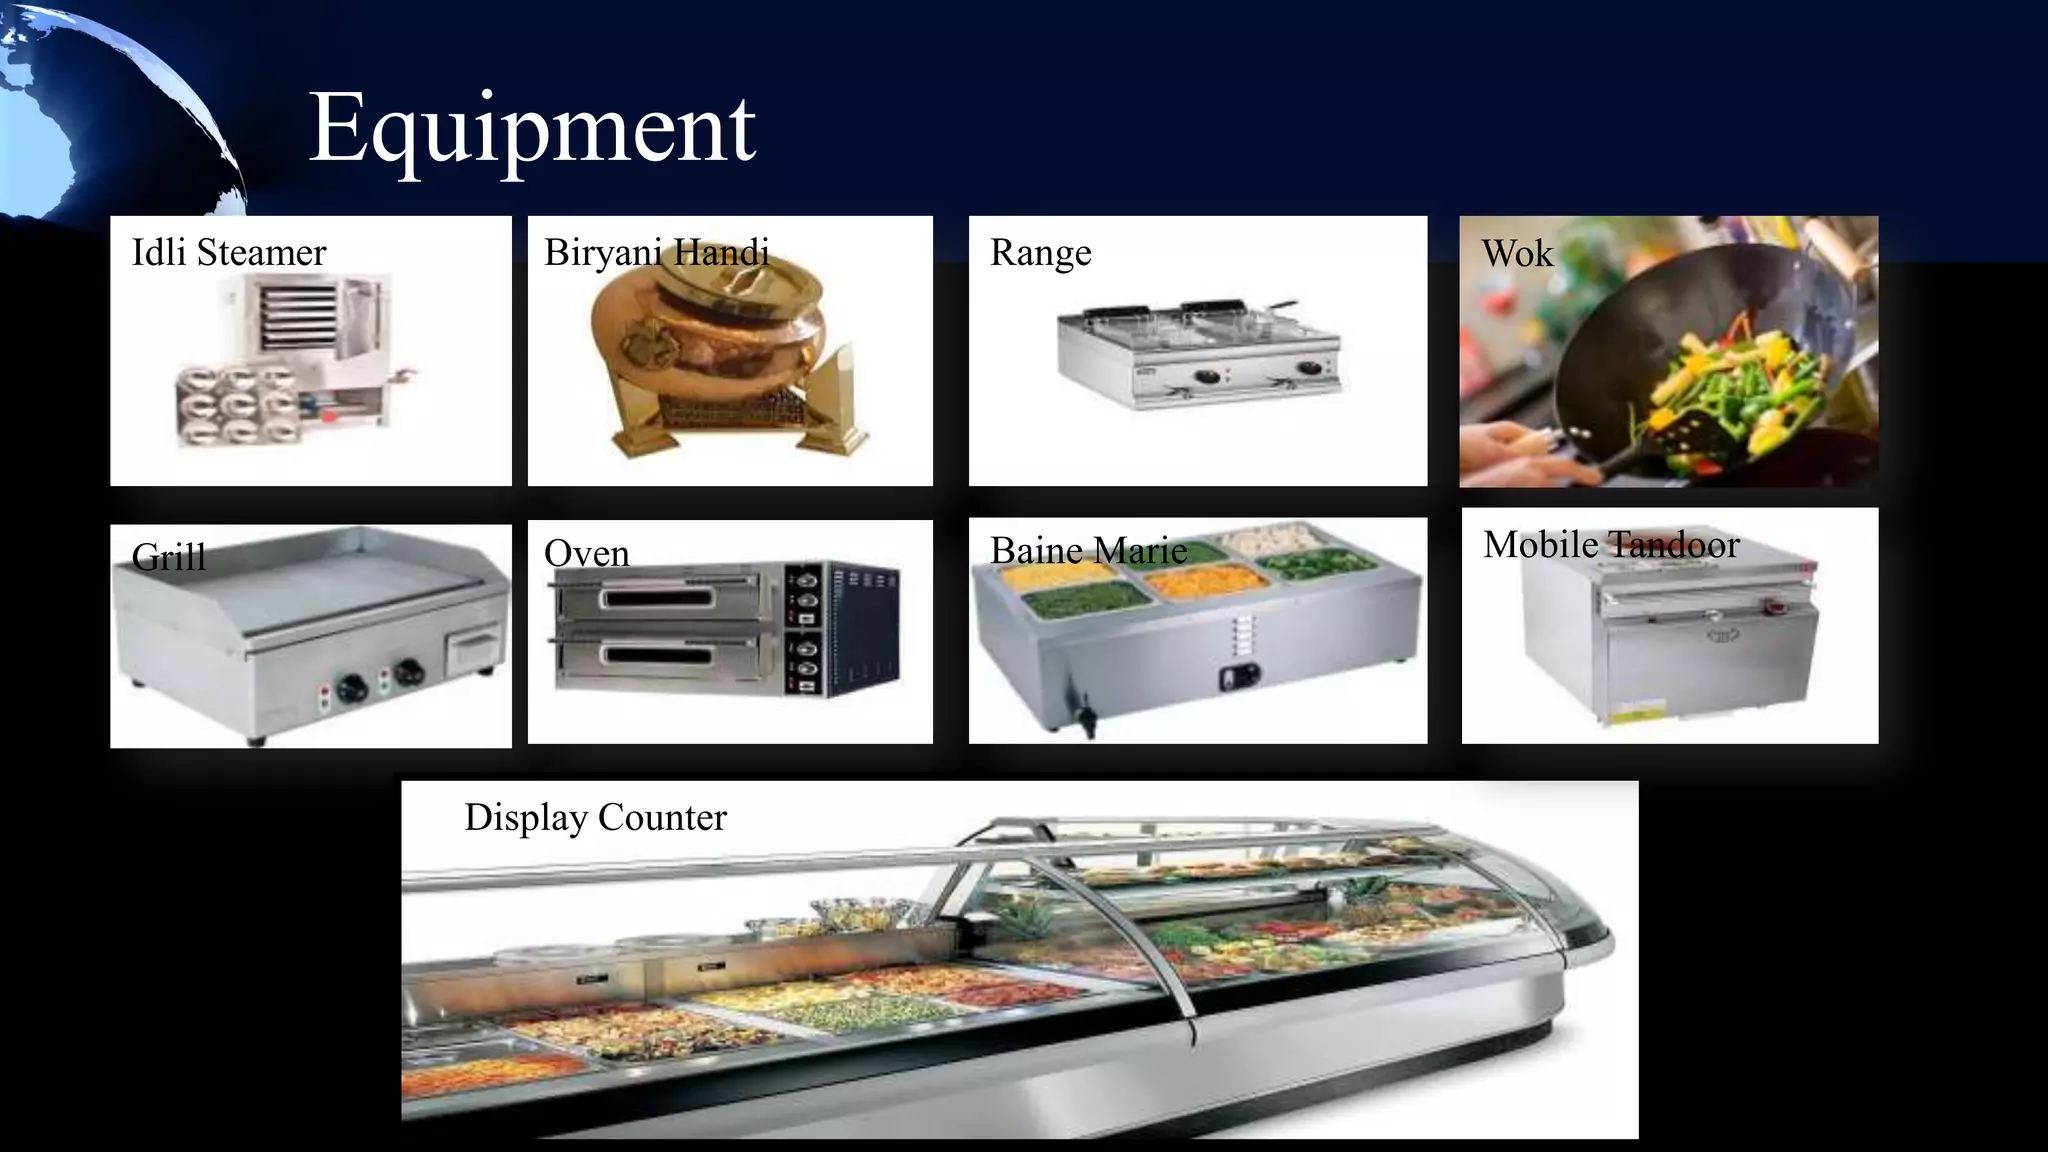
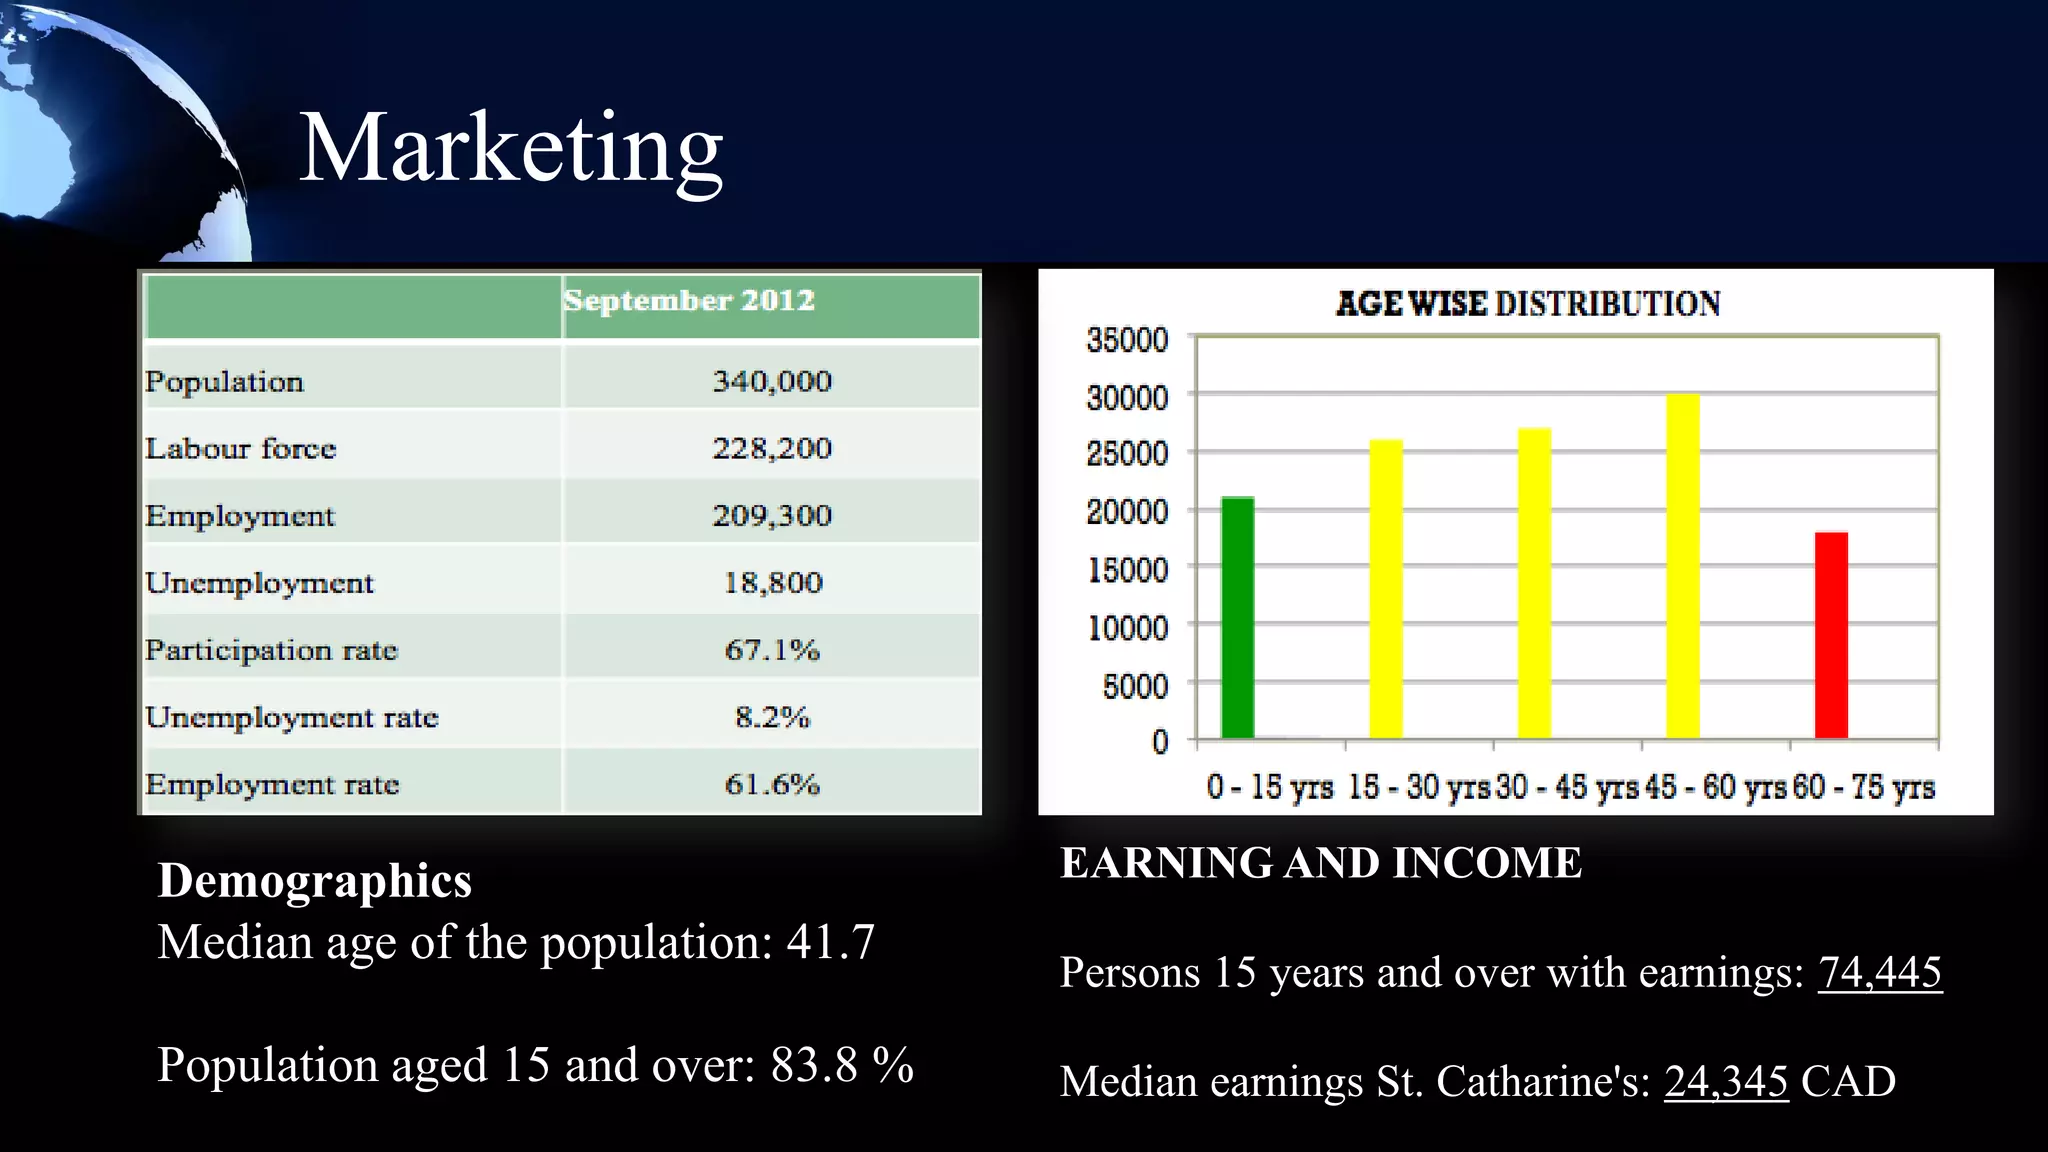
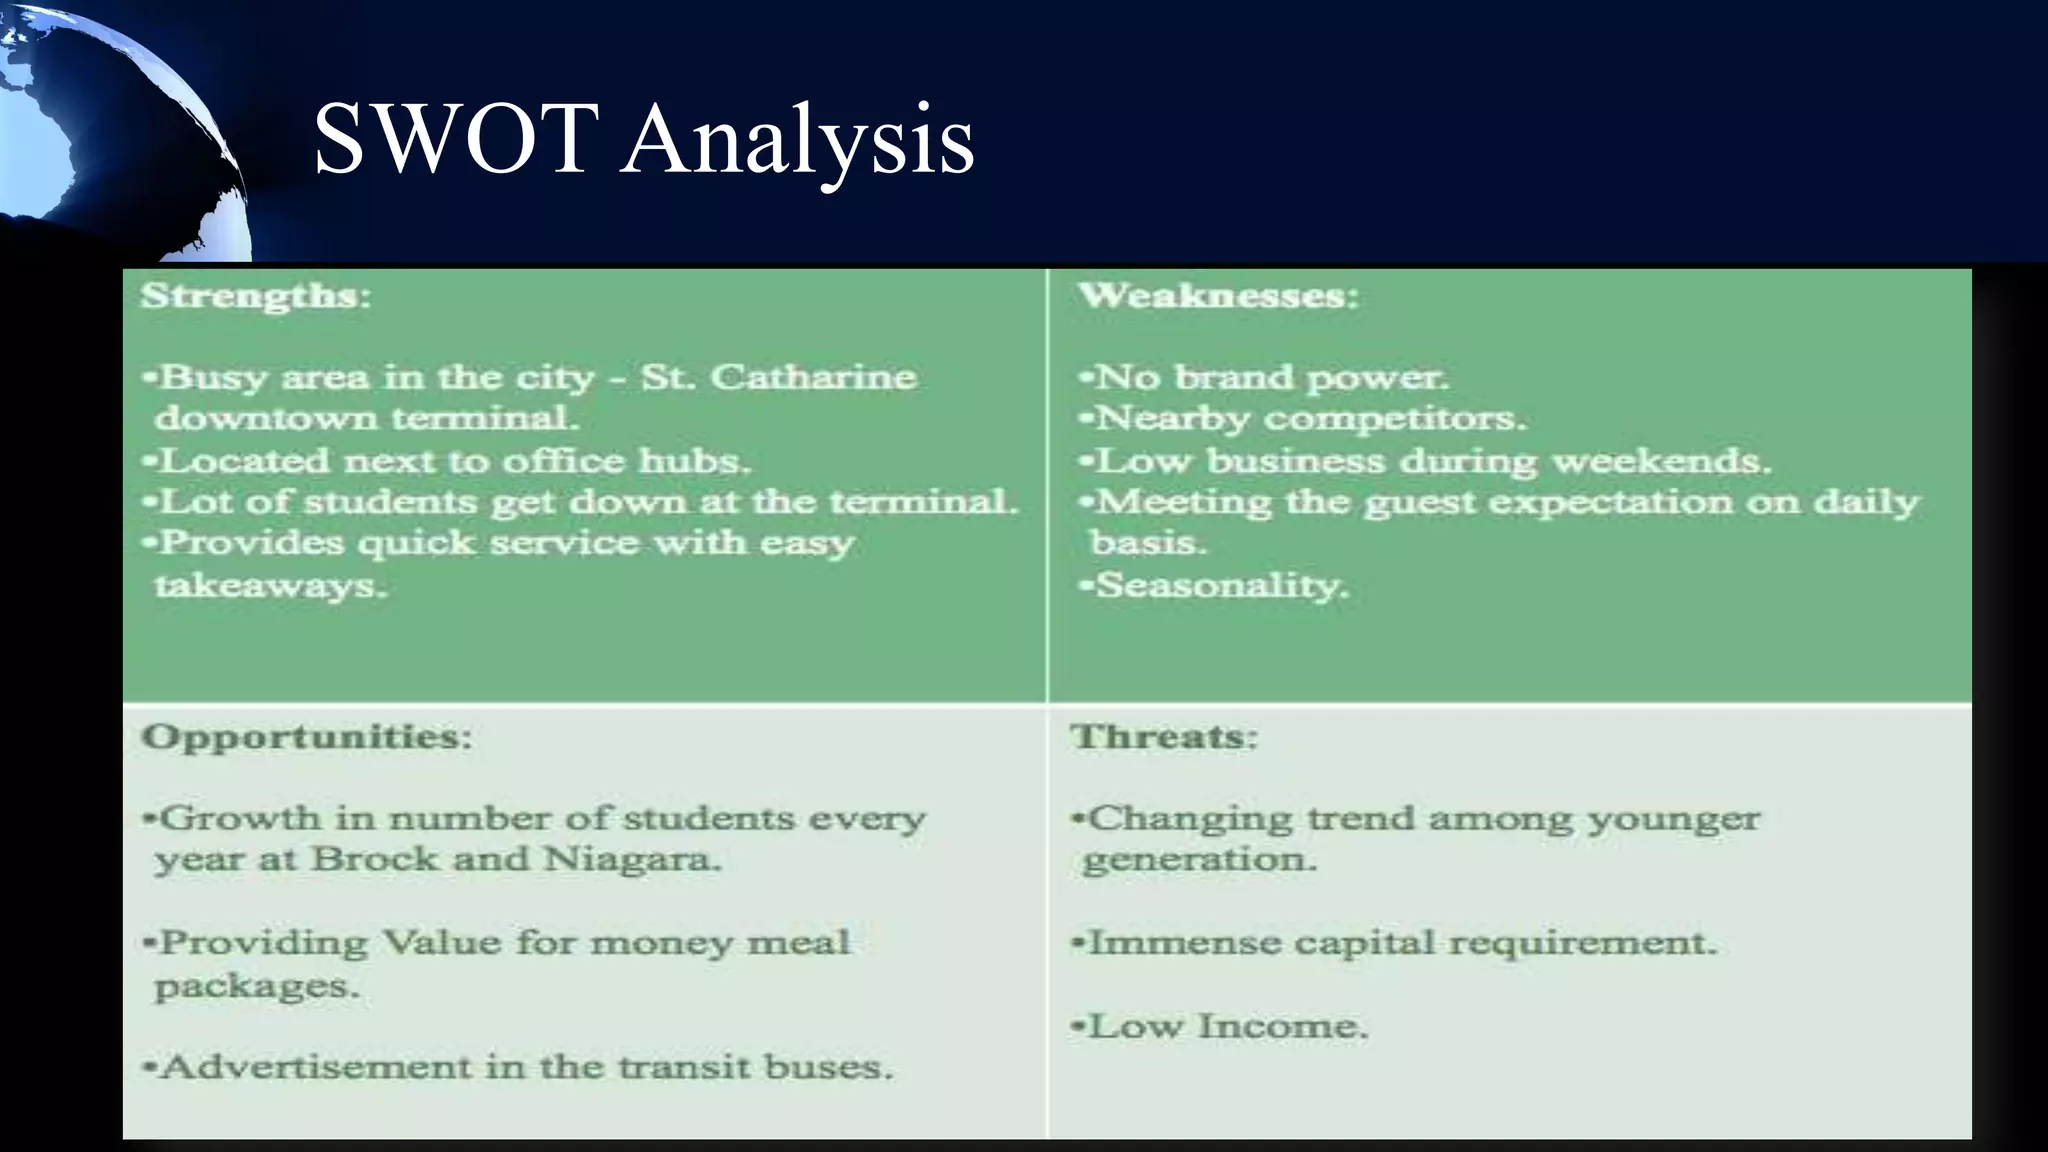
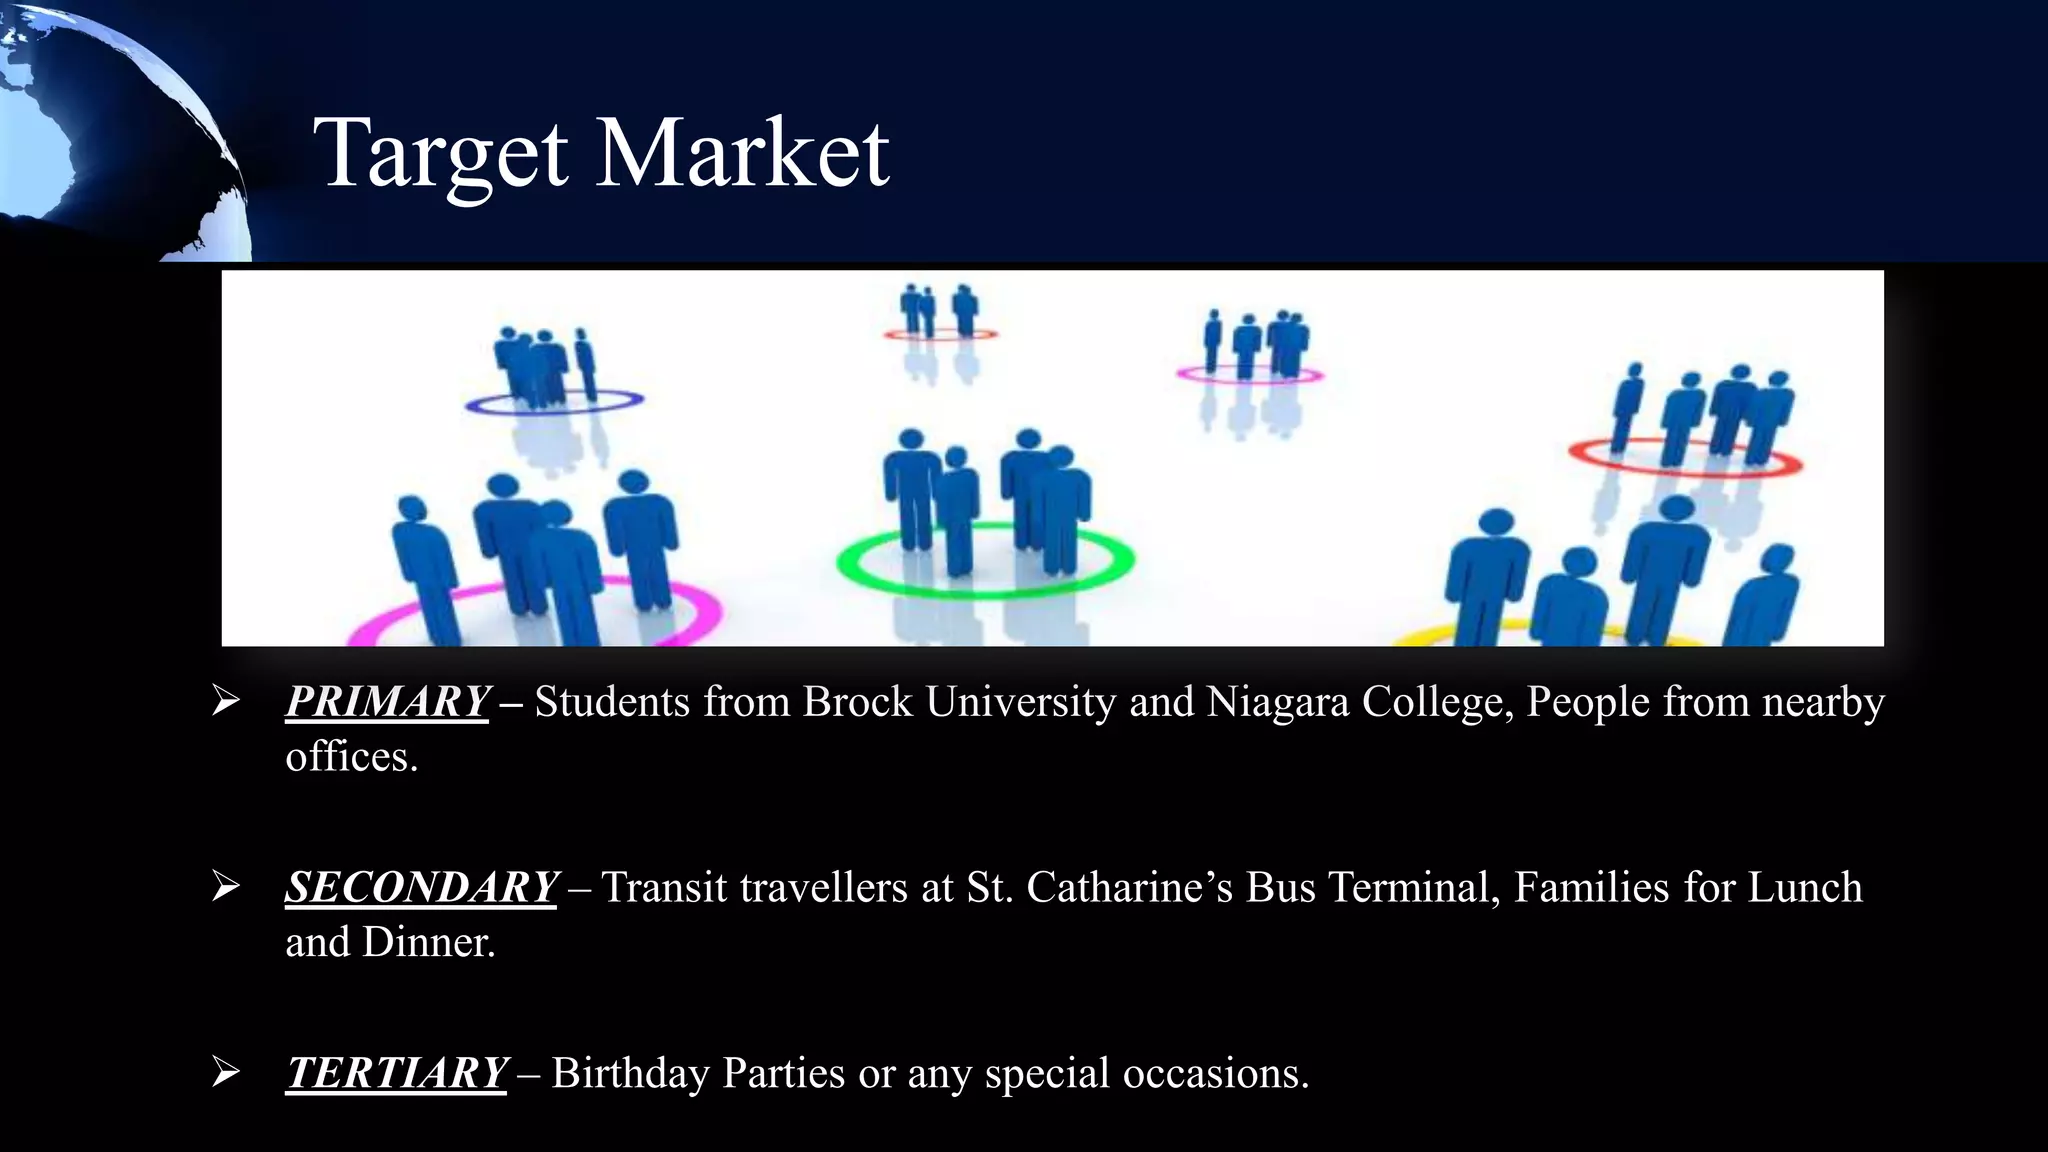
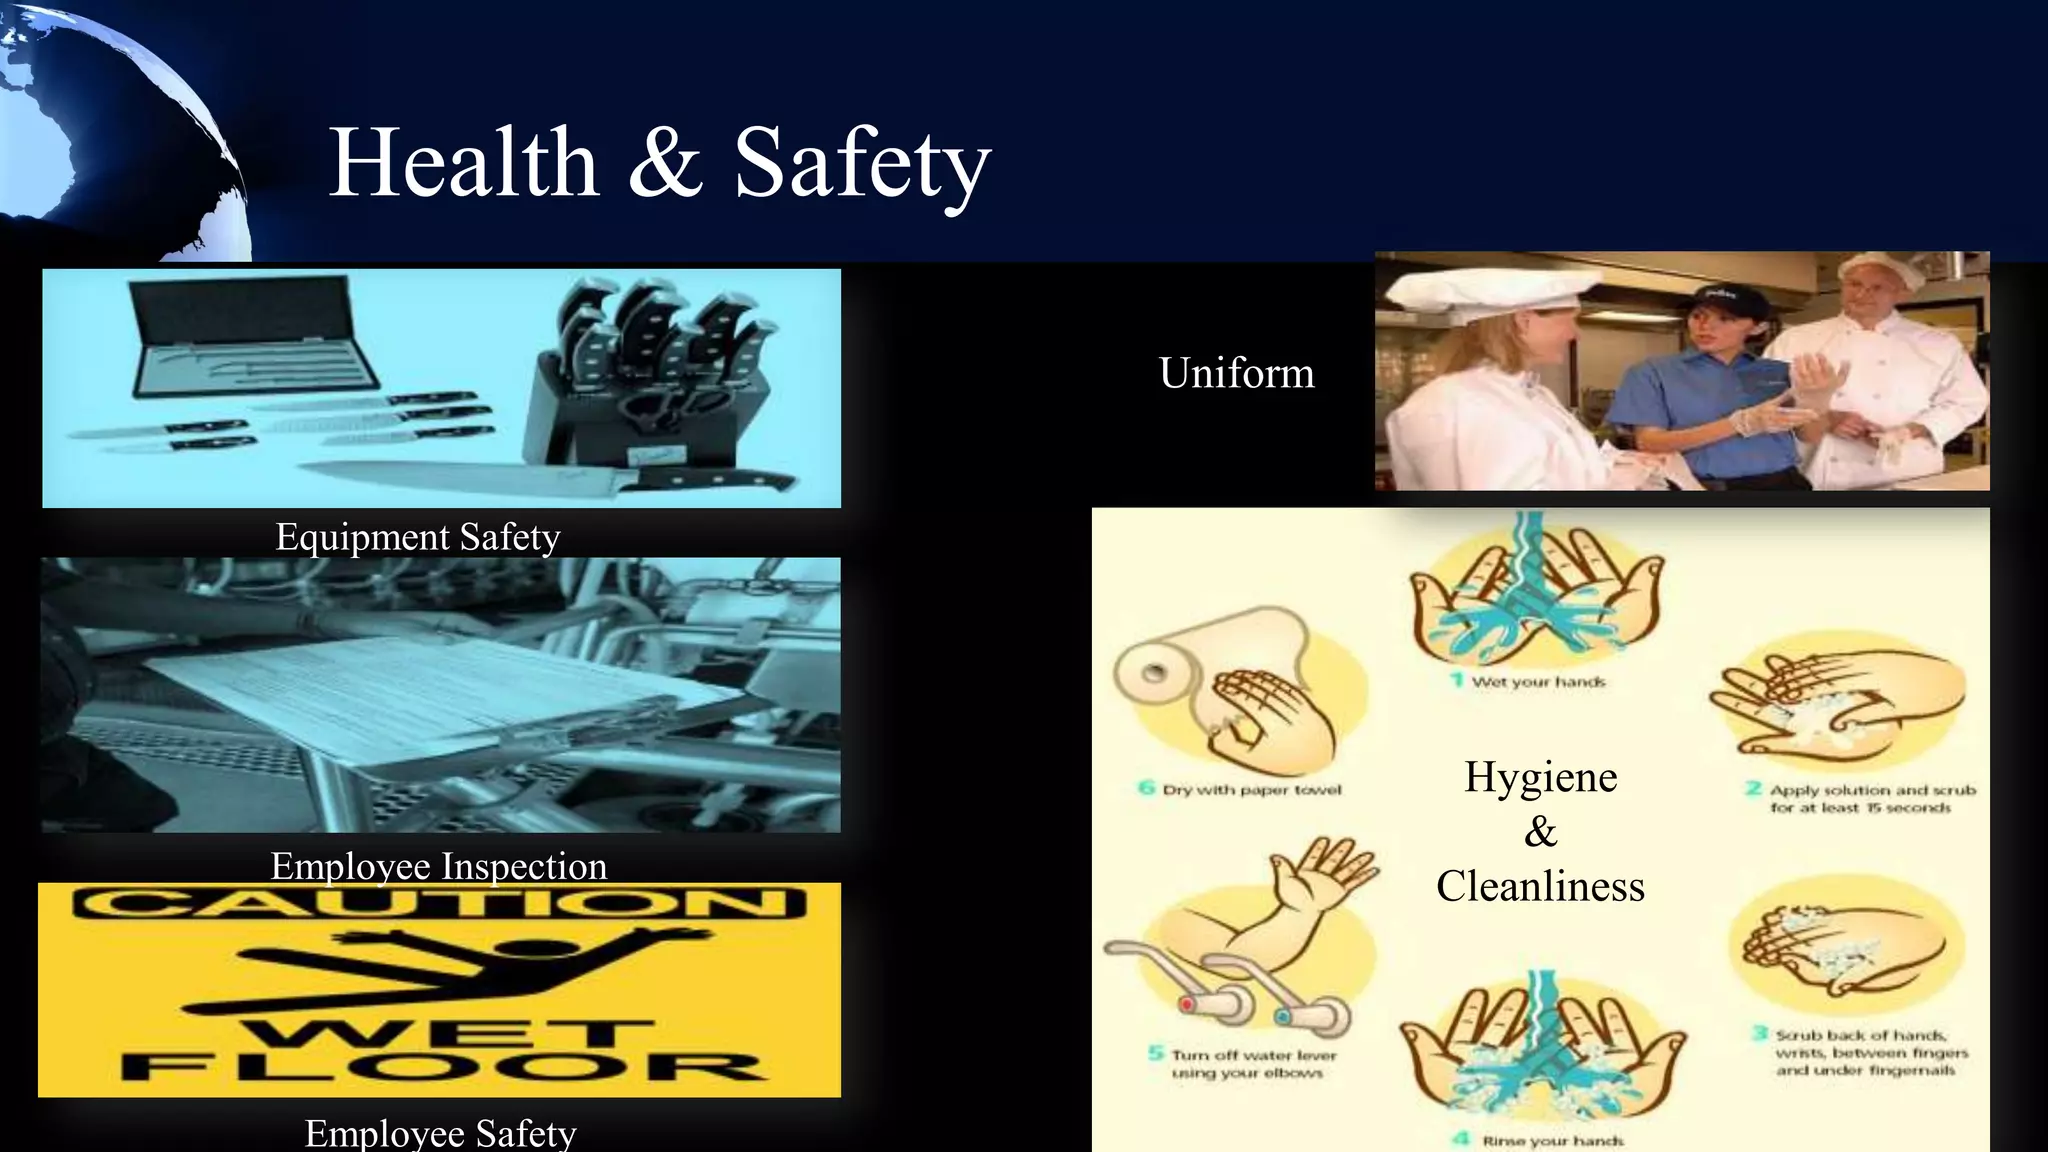
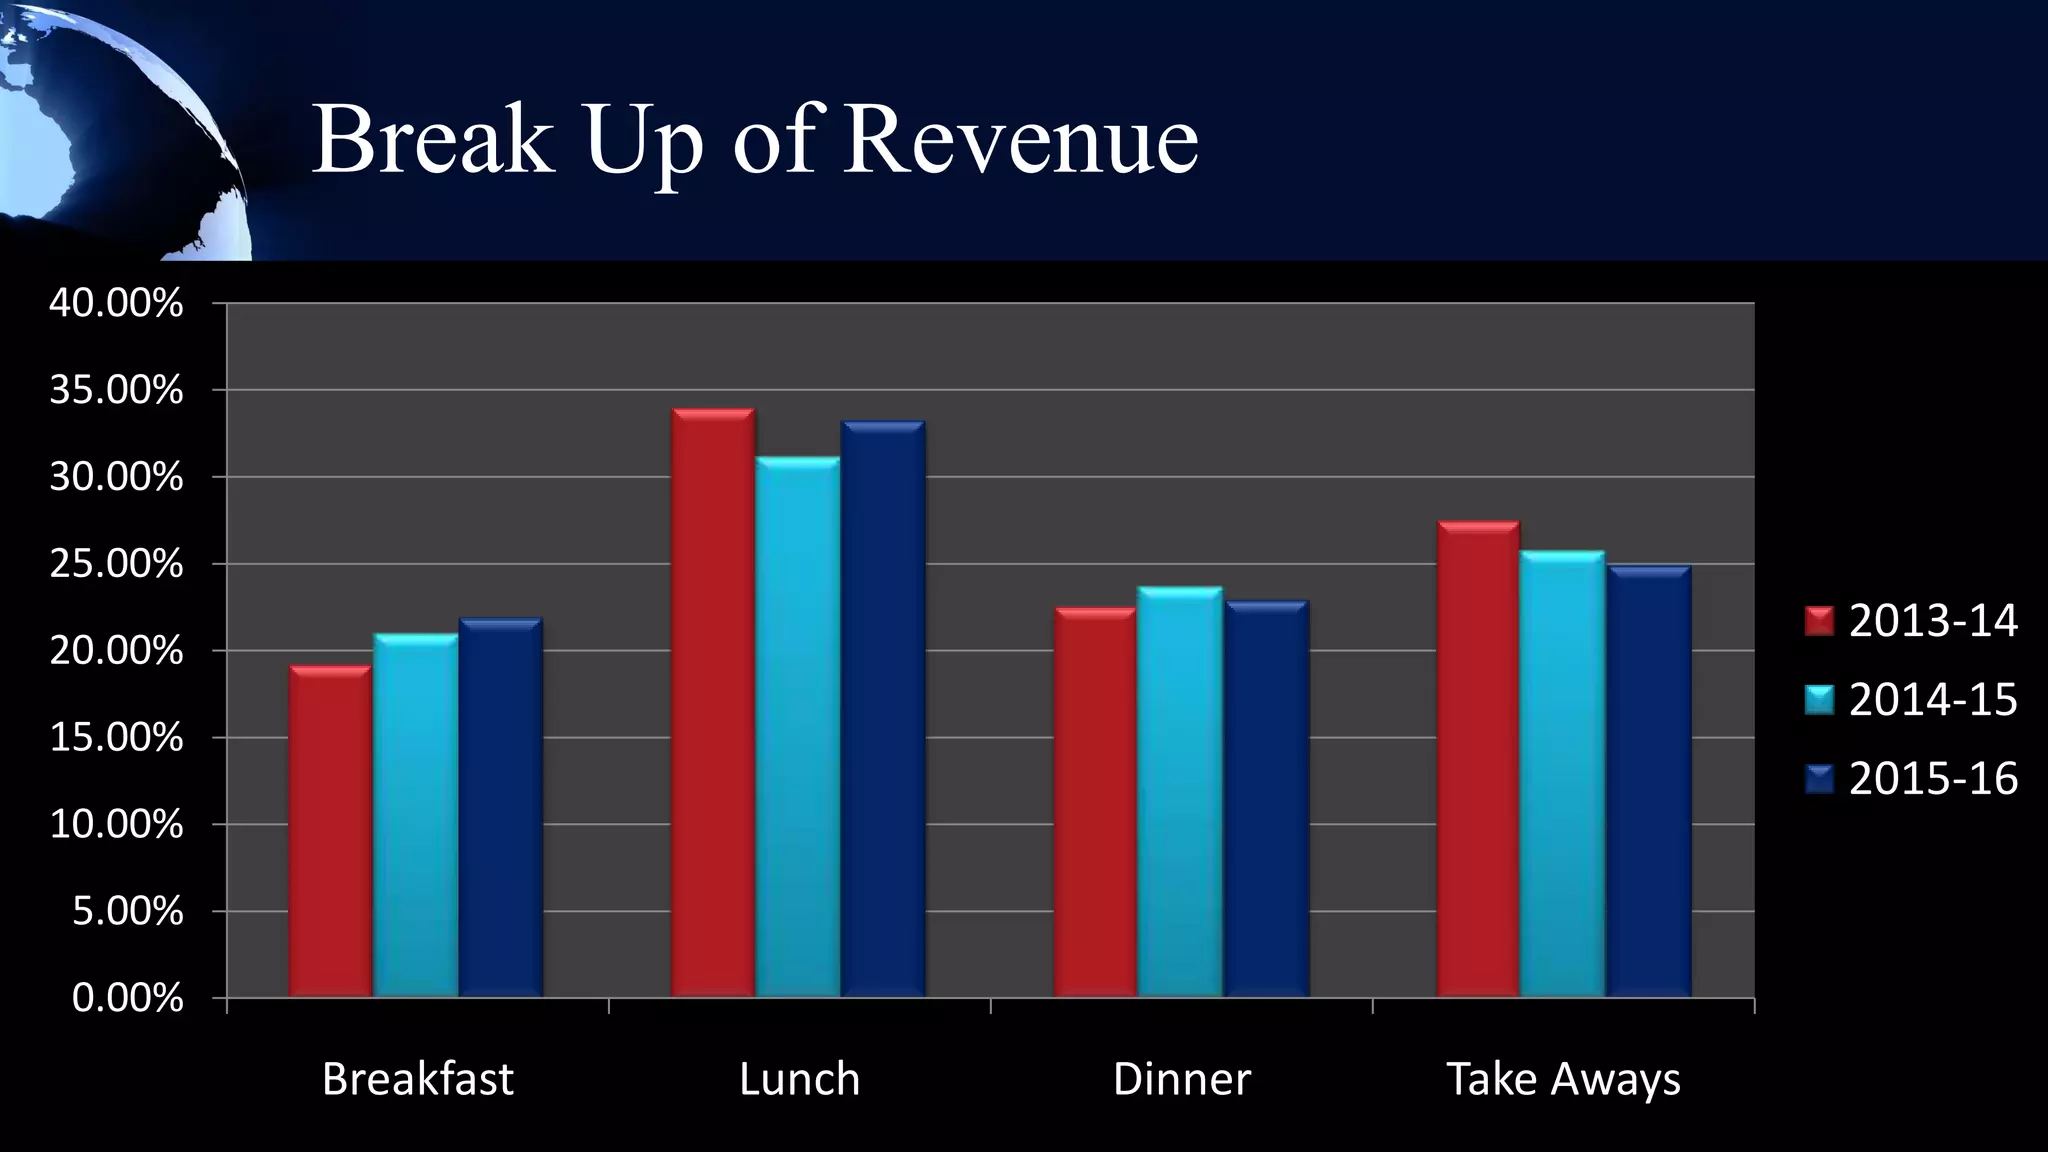
Spice it, flavor up!
Our restaurant serves different cuisines which include Indian, Chinese, Mexican & Italian
and it situated near downtown bus terminal, Saint Catharine. Spice it, flavor up! Is our
trademark.
 It is been observed that students and sometimes employee skip their breakfast for the early
morning class and also sometimes a student or employee couldn’t cook for themselves when
burdened with the work pressure from college or offices. After learning this we thought to
setup a fast food restaurant near Downtown Bus Terminal which serves quickly to these
people and do not make them go to their respective places without empty stomach.
We at mix & match provide healthy as well as affordable food. We serve every meal of the
day right from the breakfast to the dinner. If you are a student or a working employee, don’t
worry for your meals, we cater the needs of each and every individual.
Our Website – Mix & Match
Our Mobile Website & App – Mix & Match


           http://mixandmatchh.webs.com
Layout & Design
       Counter

                           Washroom
                 Kitchen
                               Sitting Area
Organizational Hierarchy
               Manager
        Supervisor
               Dish Washer   Counter
    Cooks 4         2        Staff 4

    Chinese

     Indian

     Italian

    Mexican
Duty Roster of Employees
Job Training
 On- The Job Training & One On One Training
 Techniques
  - Fast Serving
  - Up Selling
  - Suggestive Selling
 First Aid & Emergency Situation
  Handling
 Work Hazardous Material
  Information System (WHMIS)
Menu - Chinese
炸春卷 (Spring Roll)            --------$5.50
Fried wrap filled with vegetables
Crispy and delicious

麻婆豆腐 (Mapo Tofu)            ---------$8.50
Tofu, green onion, pork, pepper
Diced Tofu in Spicy Minced Pork Sauce

扬州炒饭 (Yangchow Fried Rice) --------$8.50
Rice, corn, carrot, pea, egg, shrimp, green onion
Soft and fragrant

糖醋排骨 (Sweet & Sour Ribs) ---------$8.25
Ribs,onion,tomatoes
Ruddy color, sweet and sour and mellow

酸辣汤 (Hot & Sour Soup)         --------$4.25
Tofu, bamboo, egg, green onion, lily bud
Hot and tasty
Menu - Mexican
 Menudo- Mexican's Classic Soup - $2.5
 Tamales- Masa fish -filling which is steamed - $4.5
 Birria- beef or goat stew preparation -steamed - $6


      Menu - Italian
   Pastas - $5
    Penne Pasta with Chicken
    Pasta with Italian Salsa

   Pizzazz - $6
    Pepperoni Pizza
    Pizza Margherita
    Risotto (Only Shrimp Risottos) - $6
Menu - Indian
 Biryani(Veg/Non-Veg)-a rice based food,
  made up of spices, meat ,eggs or
  vegetables- $8.5

   Butter Chicken- Chicken dish- meat is
    marinated in yoghurt and spices mixture

 Idli-Dosa-Vada with Sambhar- 3.5$- famous
  South Indian dishes -breakfast time
 Tandoori Chicken- 7.5$-Chicken -marinated
  and seasoned -Tandoori masala

 Samosa- 3$-Indian snack -fried -filling of
  smashed potatoes and green peas
Mock Tails
 Afterglow – Grenadine, Pineapple and orange juice mix. Serve
  chilled.

 Banana Bonkers - Puree banana, combine the pureed bananas,
  grapefruit juice, and lemon sherbet and crushed ice. Stir and
  serve.

 Virgin Grapefruit Mojito - Pink grapefruit, honey, garnish with
  mint sprigs and serve.

 Mock Champagne - In a large punch bowl, combine 1 bottle
  ginger ale, pineapple juice and white grape juice.

 Cherry Fizz - Place cherry concentrate in a glass. Slowly stir in
  ginger ale.
Equipment
Idli Steamer       Biryani Handi   Range         Wok


Grill              Oven            Baine Marie   Mobile Tandoor


               Display Counter
Marketing


Demographics                          EARNING AND INCOME
Median age of the population: 41.7
                                      Persons 15 years and over with earnings: 74,445

Population aged 15 and over: 83.8 %   Median earnings St. Catharine's: 24,345 CAD
SWOT Analysis
Target Market


 PRIMARY – Students from Brock University and Niagara College, People from nearby
  offices.

 SECONDARY – Transit travellers at St. Catharine’s Bus Terminal, Families for Lunch
  and Dinner.

 TERTIARY – Birthday Parties or any special occasions.
Sales And Promotion
 Our Objectives:

   Attract as many customers
   Increase sales volume in short-term
   Retaining customers
   Compete effectively
Channels of Promotion
   Media – Ex. Radio, Websites, Social Media
   Newspaper – Ex. Brock Press, The Standard
   Hoardings
   Flyers
   Word of Mouth
Techniques of Promotion
 Giving Vouchers & Coupons
 Price packs (combo meals)
 Lucky Draws
 Joint Promotions with Saint Catharine Transit
  and Niagara Region Transit
 Free Gifts on certain amount purchase
 Discounts on weekends
 Sponsorship on special events
Food purchasing & storing

                    Food purchasing and storing is an
                     important issue in any restaurant
                     to control the cost price and make
                     sure that all the supplies have a
                     good quality and durability.
Purchasing & Receiving
 EQUIPMENT SUPPLIES: Equipment supplies will be ordered from Advantage
  Restaurant & Supplies.

 FOOD SUPPLIES: We are going to order all food products from Big Red which is located
  in Thorold.

 CUTLERY AND CROCKERY: All types of glass wares, cutlery and crockery’s will be
  ordered from Golden Fleece. This company operates in Toronto city.
Storage of Food Products
 FIRST IN- FIRST OUT: Food products which are stored first that
  will be used first to reduce the wastage of the food products.


 STORAGE FOR FOOD PRODUCTS: Food storage is an important
  factor and is necessary to have a proper storage condition such as
  temperature, storage space, and cleanliness.
Health & Safety
                      Uniform


Equipment Safety


                                 Hygiene
                                    &
Employee Inspection
                                Cleanliness


 Employee Safety
Profit & Loss Statement


       Profit & Loss Statement
             (2013-2015)
Month-Wise Revenue
                                     Month Wise Revenue
                  140000
                  120000
Revenue (CAD $)


                  100000
                  80000
                  60000
                  40000
                  20000
                      0

                                                          2013-14

                                                          2014-15
                                            Months        2015-16
Break Up of Revenue
40.00%
35.00%
30.00%
25.00%
                                                   2013-14
20.00%
                                                   2014-15
15.00%
                                                   2015-16
10.00%
 5.00%
 0.00%
         Breakfast   Lunch   Dinner   Take Aways
Operating Profit/Loss
30000

25000

20000

15000                              2013-14
                                   2014-15
10000                              2015-16
 5000

    0
                     Profit/Loss
-5000
Presentation of a Restaurant Project for Coursework

Presentation of a Restaurant Project for Coursework

  • 1.
  • 2.
    Our restaurant servesdifferent cuisines which include Indian, Chinese, Mexican & Italian and it situated near downtown bus terminal, Saint Catharine. Spice it, flavor up! Is our trademark. It is been observed that students and sometimes employee skip their breakfast for the early morning class and also sometimes a student or employee couldn’t cook for themselves when burdened with the work pressure from college or offices. After learning this we thought to setup a fast food restaurant near Downtown Bus Terminal which serves quickly to these people and do not make them go to their respective places without empty stomach. We at mix & match provide healthy as well as affordable food. We serve every meal of the day right from the breakfast to the dinner. If you are a student or a working employee, don’t worry for your meals, we cater the needs of each and every individual.
  • 3.
    Our Website –Mix & Match
  • 4.
    Our Mobile Website& App – Mix & Match http://mixandmatchh.webs.com
  • 5.
    Layout & Design Counter Washroom Kitchen Sitting Area
  • 8.
    Organizational Hierarchy Manager Supervisor Dish Washer Counter Cooks 4 2 Staff 4 Chinese Indian Italian Mexican
  • 9.
    Duty Roster ofEmployees
  • 10.
    Job Training  On-The Job Training & One On One Training  Techniques - Fast Serving - Up Selling - Suggestive Selling  First Aid & Emergency Situation Handling  Work Hazardous Material Information System (WHMIS)
  • 11.
    Menu - Chinese 炸春卷(Spring Roll) --------$5.50 Fried wrap filled with vegetables Crispy and delicious 麻婆豆腐 (Mapo Tofu) ---------$8.50 Tofu, green onion, pork, pepper Diced Tofu in Spicy Minced Pork Sauce 扬州炒饭 (Yangchow Fried Rice) --------$8.50 Rice, corn, carrot, pea, egg, shrimp, green onion Soft and fragrant 糖醋排骨 (Sweet & Sour Ribs) ---------$8.25 Ribs,onion,tomatoes Ruddy color, sweet and sour and mellow 酸辣汤 (Hot & Sour Soup) --------$4.25 Tofu, bamboo, egg, green onion, lily bud Hot and tasty
  • 12.
    Menu - Mexican Menudo- Mexican's Classic Soup - $2.5  Tamales- Masa fish -filling which is steamed - $4.5  Birria- beef or goat stew preparation -steamed - $6 Menu - Italian  Pastas - $5 Penne Pasta with Chicken Pasta with Italian Salsa  Pizzazz - $6 Pepperoni Pizza Pizza Margherita Risotto (Only Shrimp Risottos) - $6
  • 13.
    Menu - Indian Biryani(Veg/Non-Veg)-a rice based food, made up of spices, meat ,eggs or vegetables- $8.5  Butter Chicken- Chicken dish- meat is marinated in yoghurt and spices mixture  Idli-Dosa-Vada with Sambhar- 3.5$- famous South Indian dishes -breakfast time  Tandoori Chicken- 7.5$-Chicken -marinated and seasoned -Tandoori masala  Samosa- 3$-Indian snack -fried -filling of smashed potatoes and green peas
  • 14.
    Mock Tails  Afterglow– Grenadine, Pineapple and orange juice mix. Serve chilled.  Banana Bonkers - Puree banana, combine the pureed bananas, grapefruit juice, and lemon sherbet and crushed ice. Stir and serve.  Virgin Grapefruit Mojito - Pink grapefruit, honey, garnish with mint sprigs and serve.  Mock Champagne - In a large punch bowl, combine 1 bottle ginger ale, pineapple juice and white grape juice.  Cherry Fizz - Place cherry concentrate in a glass. Slowly stir in ginger ale.
  • 15.
    Equipment Idli Steamer Biryani Handi Range Wok Grill Oven Baine Marie Mobile Tandoor Display Counter
  • 16.
    Marketing Demographics EARNING AND INCOME Median age of the population: 41.7 Persons 15 years and over with earnings: 74,445 Population aged 15 and over: 83.8 % Median earnings St. Catharine's: 24,345 CAD
  • 17.
  • 18.
    Target Market  PRIMARY– Students from Brock University and Niagara College, People from nearby offices.  SECONDARY – Transit travellers at St. Catharine’s Bus Terminal, Families for Lunch and Dinner.  TERTIARY – Birthday Parties or any special occasions.
  • 19.
    Sales And Promotion Our Objectives:  Attract as many customers  Increase sales volume in short-term  Retaining customers  Compete effectively
  • 20.
    Channels of Promotion  Media – Ex. Radio, Websites, Social Media  Newspaper – Ex. Brock Press, The Standard  Hoardings  Flyers  Word of Mouth
  • 21.
    Techniques of Promotion Giving Vouchers & Coupons  Price packs (combo meals)  Lucky Draws  Joint Promotions with Saint Catharine Transit and Niagara Region Transit  Free Gifts on certain amount purchase  Discounts on weekends  Sponsorship on special events
  • 22.
    Food purchasing &storing  Food purchasing and storing is an important issue in any restaurant to control the cost price and make sure that all the supplies have a good quality and durability.
  • 23.
    Purchasing & Receiving EQUIPMENT SUPPLIES: Equipment supplies will be ordered from Advantage Restaurant & Supplies.  FOOD SUPPLIES: We are going to order all food products from Big Red which is located in Thorold.  CUTLERY AND CROCKERY: All types of glass wares, cutlery and crockery’s will be ordered from Golden Fleece. This company operates in Toronto city.
  • 24.
    Storage of FoodProducts  FIRST IN- FIRST OUT: Food products which are stored first that will be used first to reduce the wastage of the food products.  STORAGE FOR FOOD PRODUCTS: Food storage is an important factor and is necessary to have a proper storage condition such as temperature, storage space, and cleanliness.
  • 25.
    Health & Safety Uniform Equipment Safety Hygiene & Employee Inspection Cleanliness Employee Safety
  • 26.
    Profit & LossStatement Profit & Loss Statement (2013-2015)
  • 27.
    Month-Wise Revenue Month Wise Revenue 140000 120000 Revenue (CAD $) 100000 80000 60000 40000 20000 0 2013-14 2014-15 Months 2015-16
  • 28.
    Break Up ofRevenue 40.00% 35.00% 30.00% 25.00% 2013-14 20.00% 2014-15 15.00% 2015-16 10.00% 5.00% 0.00% Breakfast Lunch Dinner Take Aways
  • 29.
    Operating Profit/Loss 30000 25000 20000 15000 2013-14 2014-15 10000 2015-16 5000 0 Profit/Loss -5000

Editor's Notes

  • #9 SmartArt custom animation effects: organization chart(Intermediate)Tip: The instructions below describe how to reproduce the exact organization chart and animation effects in the example above. In the animation procedures, the number of animation effects that require modification in the Custom Animation task pane will vary if the chart contains a different number of managers and employees.To reproduce the SmartArt effects on this slide, do the following:On the Home tab, in the Slides group, click Layout, and then click Blank. On the Insert tab, in the Illustrations group, click SmartArt. In the Choose a SmartArt Graphic dialog box, in the left pane, click Hierarchy. In the Hierarchy pane, click Organization Chart (first row, first option from the left), and then click OK to insert the graphic into the slide. Select the graphic, and then click one of the arrows on the left border. In the Type your text here dialog box, in the text box for the first-level rectangle, enter Director (or the name of the director). In the second-level rectangle enter Assistant Director (or the name of the assistant director). In the text boxes for the third-level rectangles, enter Manager 1, Manager 2, and Manager 3 (or the names of the managers). On the slide, do the following to add more employee rectangles:Right-click the Manager 1 rectangle, point to Add Shape, and then click Add Shape Below. Repeat this process one more time for a total of three rectangles below Manager 1. Right-click the Manager 2 rectangle, point to Add Shape, and then click Add Shape Below.Right-click the Manager 3 rectangle, point to Add Shape, and then click Add Shape Below. Select the graphic, and then click one of the arrows on the left border. In the Type your text here dialog box, in the text boxes for the fourth-level rectangles, enter Employee (or the names of the employees).If you would like to modify the number of directors, managers, and employees in the chart to match the structure of your organization, do one or more of the following: To add a rectangle within a particular level, right-click one of the rectangles in that level, point to Add Shape, and then click Add Shape After or Add Shape Before. To add a rectangle below another rectangle, right-click the higher-level rectangle, point to Add Shape, and then click Add Shape Below. To delete a rectangle, select the rectangle and then press DELETE. To add text to new rectangles, select the graphic, and then click one of the arrows on the left border. In the Type your text here dialog box, enter text. Select the graphic. Under SmartArt Tools, on the Format tab, click Size, and then do the following:In the Height box, enter 6.55”.In the Width box, enter 8.79”. Under SmartArt Tools, on the Format tab, click Arrange, click Align, and then do the following:Click Align to Slide.Click Align Middle. Click Align Center. To reproduce the effects for the employee rectangles on this slide, do the following:Press and hold SHIFT, and then select all of the rectangles in the slide. On one of the rectangles, on the middle of the left edge, drag the blue square adjustment handle slightly to the left to increase the width of all of the rectangles. On the slide, select the graphic. On the Home tab, in the Font group, select Gill Sans MT from the Font list, and then select 20 from the FontSize list.Press and hold SHIFT, and then select all of the rectangles in the graphic. On the Home tab, in the bottom right corner of the Drawing group, click the FormatShape dialog box launcher. In the FormatShape dialog box, click Line Color in the left pane. In the Line Color pane, select No line. Also in the FormatShape dialog box, click Shadow in the left pane. In the Shadow pane, click the button next to Presets , and then under Outer click OffsetCenter (second row, second option from the left). Also in the FormatShape dialog box, click 3-DFormat in the left pane, and then do the following in the 3-DFormat pane under Bevel:Click the button next to Top, and then click CoolSlant (first row, fourth option from the left). Next to Top, in the Width box, enter 5 pt,and in the Height box, enter 5 pt.Press and hold SHIFT, and then select all of the employee rectangles in the graphic. On the Home tab, in the bottom right corner of the Drawing group, click the FormatShape dialog box launcher. In the FormatShape dialog box, click Fill in the left pane, select Gradient fill in the Fill pane, and then do the following:In the Type list, select Linear.Click the button next to Direction, and then click LinearDown (first row, second option from the left).Under Gradient stops, click Add or Remove until two stops appear in the drop-down list. Also under Gradient stops, customize the gradient stops as follows:Select Stop 1 from the list, and then do the following:In the Stop position box, enter 0%.Click the button next to Color, and then under Theme Colors click Blue, Accent 1, Darker 50% (sixth row, fifth option from the left). Select Stop 2 from the list, and then do the following: In the Stop position box, enter 100%.Click the button next to Color, and then under Theme Colors click Blue, Accent 1, Darker 25% (fifth row, fifth option from the left). To reproduce the effects for the manager rectangles on this slide, do the following:Press and hold SHIFT, and then select all three manager rectangles in the graphic. On the Home tab, in the bottom right corner of the Drawing group, click the FormatShape dialog box launcher. In the FormatShape dialog box, click Fill in the left pane, select Gradientfill in the Fill pane, and then do the following:In the Type list, select Linear.Click the button next to Direction, and then click LinearDown (first row, second option from the left).Under Gradient stops, click Add or Remove until two stops appear in the drop-down list. Also under Gradient stops, customize the gradient stops as follows:Select Stop 1 from the list, and then do the following:In the Stop position box, enter 0%.Click the button next to Color, and then under Theme Colors click Blue, Accent 1, Darker 25% (fifth row, fifth option from the left). Select Stop 2 from the list, and then do the following: In the Stop position box, enter 100%.Click the button next to Color, and then under Theme Colors click Blue, Accent 1, Lighter 40% (fourth row, fifth option from the left). To reproduce the effects for the director rectangles on this slide, do the following:Press and hold SHIFT, and then the director and assistant director rectangles (first- and second-level rectangles) in the graphic. On the Home tab, in the bottom right corner of the Drawing group, click the FormatShape dialog box launcher. In the FormatShape dialog box, click Fill in the left pane, select Gradientfill in the Fill pane, and then do the following:In the Type list, select Linear.Click the button next to Direction, and then click LinearDown (first row, second option from the left).Under Gradient stops, click Add or Remove until two stops appear in the drop-down list. Also under Gradient stops, customize the gradient stops as follows:Select Stop 1 from the list, and then do the following:In the Stop position box, enter 0%.Click the button next to Color, and then under Theme Colors click Blue, Accent 1, Lighter 40% (fourth row, fifth option from the left). Select Stop 2 from the list, and then do the following: In the Stop position box, enter 100%.Click the button next to Color, and then under Theme Colors click Blue, Accent 1, Lighter 60% (third row, fifth option from the left). Press and hold SHIFT, and then select the director and assistant director rectangles in the graphic. On the Home tab, in the Font group, click the button next to FontColor, and then click Dark Blue, Text 2 (first row, fourth option from the left).To reproduce the connecting line between Manager 2 and the last employee under Manager 1, do the following:On the Home tab, in the Drawing group, click Shapes, and then under Lines click Freeform (11th option from the left). On the slide, do the following to draw a freeform line:Click the first point on the right edge of the bottom employee rectangle. Click the second point approximately 0.5” to the right of the first point.Click the third point approximately 3.5” above the second point. Double-click the fourth point on the left edge of the Manager 2 rectangle to finish the freeform line. On the slide, select the freeform line. On the Home tab, in the bottom right corner of the Drawing group, click the Format Shape dialog box launcher. In the FormatShape dialog box, in the left pane, click LineColor. In the LineColor pane, select Solid line, click the button next to Color, and then under Theme Colors click Blue, Accent 1 (first row, fifth option from the left). Also in the FormatShape dialog box, in the left pane, click LineStyle, and then do the following in the LineStyle pane:In the Width box, enter 2 pt. In the Dashtype list, select RoundDot (second option from the top).In the Captype list, select Round. In the Jointype list, select Round.To reproduce the animation effects on this slide, do the following:On the Animations tab, in the Animations group, click CustomAnimation.On the slide, select the graphic. In the CustomAnimation task pane, do the following:Click AddEffect, point to Entrance, and then click MoreEffects. In the AddEntranceEffect dialog box, under Basic, click PeekIn. Under Modify: Peek In, in the Speed list, select VeryFast. Click the arrow to the right of the animation effect (peek in effect), and then click EffectOptions. In the Peek In dialog box, on the SmartArtAnimation tab, in the Group graphic list, select By level one by one.Also in the Custom Animation task pane, click the double arrow under the animation effect to expand the contents of the list of effects, and then do the following: Select the first animation effect (peek-in effect). Under Modify: Peek In, in the Start list, select WithPrevious.Press and hold CTRL, and then select the second, fourth, sixth, eighth, 10th, 12th, 14th, 16th, and 18th animation effects (peek-in effects), and do the following:Click Change, point to Entrance, and then click MoreEffects. In the ChangeEntranceEffects dialog box, under Subtle, click Fade. Under Modify: Fade, in the Speed list, select VeryFast.Select the third animation effect (peek-in effect). Under Modify: Peek In, in the Direction list, select FromRight.Press and hold CTRL, and then select the fifth, seventh, and ninth animation effects (peek-in effects). Under Modify: Peek In, in the Direction list, select FromTop.Press and hold CTRL, and then select the 11th, 13th, and 15th animation effects. Under Modify: Peek In, in the Direction list, select FromLeft.Press and hold CTRL, and then select the 11th, 12th, 13th, 14th, and 15th effects. Under Modify: Peek In, in the Start list, select With Previous.Press and hold CTRL, and then select the 17th and 19th animation effects (peek-in effects), and then do the following under Modify: Peek In:In the Direction list, select FromLeft.In the Start list, select WithPrevious.On the slide, select the freeform line. In the CustomAnimation task pane, click AddEffect, point to Entrance, and then click MoreEffects. In the AddEntranceEffect dialog box, under Basic, click Wipe.Also in the CustomAnimation task pane, select the 20th animation effect (wipe effect). Under Modify: Wipe,do the following:In the Start list, select AfterPrevious. In the Direction list, select FromBottom. In the Speed list, select VeryFast.Also in the Custom Animation task pane, drag the 20th animation effect until it is 15th in the list of effects. To reproduce the background on this slide, do the following:Right-click the slide background area, and then click Format Background. In the Format Background dialog box, click Fill in the left pane, select Gradient fill in the Fill pane, and then do the following:In the Type list, select Linear.Click the button next to Direction, and then click Linear Down (first row, second option from the left)Under Gradient stops, click Add or Remove until three stops appear in the drop-down list.Also under Gradient stops, customize the gradient stops as follows:Select Stop 1 from the list, and then do the following:In the Stop position box, enter 0%.Click the button next to Color, and then under Theme Colors click Black, Text 1 (first row, second option from the left). Select Stop 2 from the list, and then do the following: In the Stop position box, enter 32%.Click the button next to Color, and then under Theme Colors click Blue, Accent 1, Darker 50% (sixth row, fourth option from the left).Select Stop 3 from the list, and then do the following: In the Stop position box, enter 100%.Click the button next to Color, and then under Theme Colors click Blue, Accent 1, Lighter 80% (second row, fifth option from the left).
  • #28 This Slide shows the month wise revenue in all three years…We are making huge profits in the months from June to October while we are at loss in December and January.
  • #29 This slide shows the break up of revenue for all 3 years…Our major revenue is from Lunch, Takeaways and Breakfast…Even though Lunch and Dinner are priced higher than break fast and Takeaways, our dinner revenue is not that great in comparison.
  • #30 In 1st Year we are having a loss of 2273 $, but still there is a big reason to smile if you look at the 2nd & 3rd year where we are making profit of 13,285$ & 25,291$ respectively.