This document provides a summary of Tim Hortons' 2012 second quarter conference call. It includes:
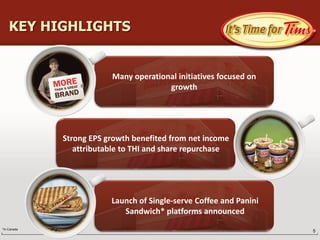
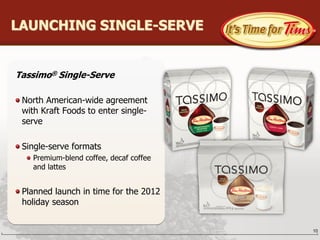
- Key highlights such as many operational initiatives focused on growth and strong EPS growth from net income and share repurchases. They also announced the launch of single-serve coffee and panini sandwiches.
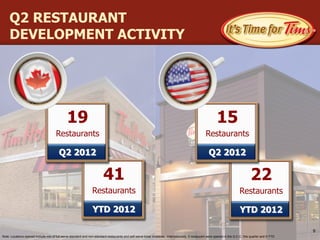
- Restaurant development activity saw 19 restaurants opened in Q2 2012 and 41 YTD.
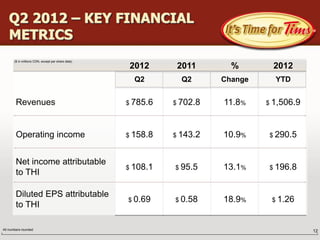
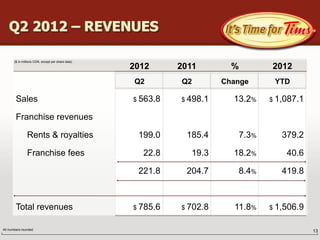
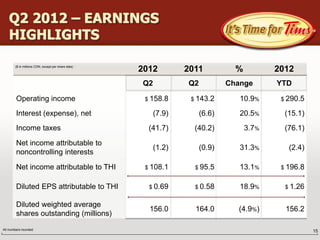
- Financial metrics for Q2 2012 including revenues of $785.6 million (up 11.8% year-over-year), operating income of $158.8 million (up 10.9%), and net income attributable to THI of $108.1 million (up 13.1%).
- Details