Subsecond periodic radio oscillations in a microquasar

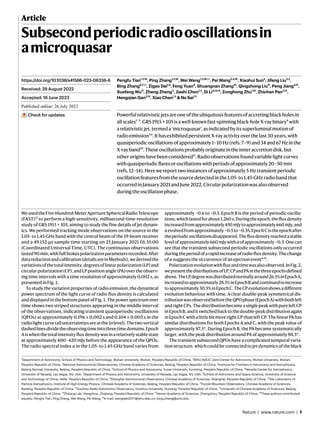
Powerful relativistic jets are one of the ubiquitous features of accreting black holes in all scales1–3 . GRS 1915 + 105 is a well-known fast-spinning black-hole X-ray binary4 with a relativistic jet, termed a ‘microquasar’, as indicated by its superluminal motion of radio emission5,6 . It has exhibited persistent X-ray activity over the last 30 years, with quasiperiodic oscillations of approximately 1–10 Hz (refs. 7–9) and 34 and 67 Hz in the X-ray band10. These oscillations probably originate in the inner accretion disk, but other origins have been considered11. Radio observations found variable light curves with quasiperiodic fares or oscillations with periods of approximately 20–50 min (refs. 12–14). Here we report two instances of approximately 5-Hz transient periodic oscillation features from the source detected in the 1.05- to 1.45-GHz radio band that occurred in January 2021 and June 2022. Circular polarization was also observed during the oscillation phase.

Recommended
Recommended
More Related Content
Similar to Subsecond periodic radio oscillations in a microquasar
Similar to Subsecond periodic radio oscillations in a microquasar (20)
More from Sérgio Sacani
More from Sérgio Sacani (20)
Recently uploaded
Recently uploaded (20)
Subsecond periodic radio oscillations in a microquasar
- 1. Nature | www.nature.com | 1 Article Subsecondperiodicradiooscillationsin amicroquasar Pengfu Tian1,2,16 , Ping Zhang1,2,16 , Wei Wang1,2,16✉, Pei Wang3,4,16 , Xiaohui Sun5 , Jifeng Liu2,3 , Bing Zhang6,7✉, Zigao Dai1,8 , Feng Yuan9 , Shuangnan Zhang10 , Qingzhong Liu11 , Peng Jiang3,12 , Xuefeng Wu11 , Zheng Zheng3 , Jiashi Chen1,2 , Di Li3,13,14 , Zonghong Zhu1,15 , Zhichen Pan3,12 , Hengqian Gan3,12 , Xiao Chen1,2 & Na Sai1,2 Powerfulrelativisticjetsareoneoftheubiquitousfeaturesofaccretingblackholesin allscales1–3 .GRS1915 + 105isawell-knownfast-spinningblack-holeX-raybinary4 with arelativisticjet,termeda‘microquasar’,asindicatedbyitssuperluminalmotionof radioemission5,6 .IthasexhibitedpersistentX-rayactivityoverthelast30 years,with quasiperiodicoscillationsofapproximately1–10 Hz(refs.7–9)and34and67 Hzinthe X-rayband10 .Theseoscillationsprobablyoriginateintheinneraccretiondisk,but otheroriginshavebeenconsidered11 .Radioobservationsfoundvariablelightcurves withquasiperiodicflaresoroscillationswithperiodsofapproximately20–50 min (refs.12–14).Herewereporttwoinstancesofapproximately5-Hztransientperiodic oscillationfeaturesfromthesourcedetectedinthe1.05-to1.45-GHzradiobandthat occurredinJanuary2021andJune2022.Circularpolarizationwasalsoobserved duringtheoscillationphase. WeusedtheFive-Hundred-MeterApertureSphericalRadioTelescope (FAST)15 to perform a high-sensitivity, millisecond-time-resolution study of GRS 1915 + 105, aiming to study the fine details of jet dynam- ics. We performed tracking mode observations on the source in the 1.05- to 1.45-GHz band with the central beam of the 19-beam receiver and a 49.152-μs sample time starting on 25 January 2021 01:35:00 (Coordinated Universal Time, UTC). The continuous observations lasted90 min,withfullStokespolarizationparametersrecorded.After datareductionandcalibration(detailsareinMethods),wederivedthe variationsofthetotalintensity,degreesoflinearpolarization(LP)and circularpolarization(CP),andLPpositionangle(PA)overtheobserv- ing time intervals with a time resolution of approximately 0.002 s, as presented in Fig. 1. To study the variation properties of radio emission, the dynamical power spectrum of the light curve of radio flux density is calculated and displayed in the bottom panel of Fig. 1. The power spectrum over time shows two striped structures appearing in the middle interval of the observations, indicating transient quasiperiodic oscillations (QPOs) at approximately 0.196 ± 0.002 s and 0.104 ± 0.003 s in the radiolightcurve(alluncertaintiesareatthe1σlevel).Thetwovertical dashedlinesdividetheobservingtimeintothreetimedomains.Epoch Aiswhenthetotalintensityfluxdensitywasinarelativelystablestate at approximately 400–420 mJy before the appearance of the QPOs. The radio spectral index α in the 1.05- to 1.45-GHz band varies from approximately −0.6 to −0.5. Epoch B is the period of periodic oscilla- tions,whichlastedforabout1,260 s.Duringtheepoch,thefluxdensity increasedfromapproximately450 mJytoapproximately660 mJy,and αevolvedfromapproximately−0.5to−0.35.EpochCistheepochafter theperiodicoscillationsdisappeared.Thefluxdensityreachedastable levelofapproximately660 mJywithαofapproximately−0.3.Onecan see that the transient subsecond periodic oscillations only occurred duringtheperiodofarapidincreaseofradiofluxdensity.Thechange of α suggests the occurrence of an ejection event6,16 . Polarizationevolutionwithfluxandtimewasalsoobserved.InFig.2, wepresentthedistributionsofLP,CPandPAinthethreeepochsdefined above.TheLPdegreewasdistributednormallyaround26.5%inEpochA, increasedtoapproximately28.5%inEpochBandcontinuedtoincrease toapproximately30.5%inEpochC.TheCPevolutionshowsadifferent evolution behaviour with time. A clear double-peak symmetrical dis- tributionwasobservedbeforetheQPOphase(EpochA)withbothleft andrightCPs.ThedistributionbecameasinglepeakwithpureleftCP inEpochB,anditswitchedbacktothedouble-peakdistributionagain inEpochCwithalittlebitmorerightCPthanleftCP.ThelinearPAhas similar distributions for both Epochs A and C, with the peak value of approximately 87.5°. During Epoch B, the PA became systematically larger, with the peak distribution around PA of approximately 88.5°. The transient subsecond QPOs have a complicated temporal varia- tionstructure,whichcouldbeconnectedtojetdynamicsoftheblack https://doi.org/10.1038/s41586-023-06336-6 Received: 29 August 2022 Accepted: 16 June 2023 Published online: xx xx xxxx Check for updates 1 Department of Astronomy, School of Physics and Technology, Wuhan University, Wuhan, People’s Republic of China. 2 WHU-NAOC Joint Center for Astronomy, Wuhan University, Wuhan, People’s Republic of China. 3 National Astronomical Observatories, Chinese Academy of Sciences, Beijing, People’s Republic of China. 4 Institute for Frontiers in Astronomy and Astrophysics, Beijing Normal University, Beijing, People’s Republic of China. 5 School of Physics and Astronomy, Yunan University, Kunming, People’s Republic of China. 6 Nevada Center for Astrophysics, University of Nevada, Las Vegas, NV, USA. 7 Department of Physics and Astronomy, University of Nevada, Las Vegas, NV, USA. 8 School of Astronomy and Space Science, University of Science and Technology of China, Hefei, People’s Republic of China. 9 Shanghai Astronomical Observatory, Chinese Academy of Sciences, Shanghai, People’s Republic of China. 10 Key Laboratory of Particle Astrophysics, Institute of High Energy Physics, Chinese Academy of Sciences, Beijing, People’s Republic of China. 11 Purple Mountain Observatory, Chinese Academy of Sciences, Nanjing, People’s Republic of China. 12 Guizhou Radio Astronomy Observatory, Guizhou University, Guiyang, People’s Republic of China. 13 University of Chinese Academy of Sciences, Beijing, People’s Republic of China. 14 Zhijiang Lab, Hangzhou, Zhejiang, People’s Republic of China. 15 Henan Academy of Sciences, Zhengzhou, People’s Republic of China. 16 These authors contributed equally: Pengfu Tian, Ping Zhang, Wei Wang, Pei Wang. ✉e-mail: wangwei2017@whu.edu.cn; bing.zhang@unlv.edu
- 2. 2 | Nature | www.nature.com Article hole.Wethenperformawaveletanalysisofthelightcurvesduringthe epoch of periodic oscillations (Methods). The wavelet analysis result of the power profiles of the radio light curve with the QPO signal is presentedinFig.3a.Thecontoursofwaveletsshowthevariationchar- acteristics of the QPOs in both frequency and time domains with the 95%confidencelevelfortheglobalwaveletspectrum.Thelocalwavelet power spectrum example has a duration of 20 s, which displays a sig- nificant 5-Hz signal across essentially the entire time span. The 10-Hz harmonicsignalisweakerandmoresparse.Inthehigh-time-resolution wavelet power diagram, the 5-Hz signal still shows a discontinuous 400 500 600 Flux (mJy) 25.0 27.5 30.0 32.5 LP (%) –4 –2 0 CP (%) 87 88 89 PA (º) –0.6 –0.5 –0.4 –0.3 Index, α 6,500 7,000 7,500 8,000 8,500 9,000 9,500 10,000 10,500 Time (s)—MJD (59,239) 5 10 Frequency (Hz) 0 2 4 6 8 10 12 14 Power Epoch A Epoch B Epoch C Fig.1|LightcurvesduringtheQPOphasein2021.Evolutionoftotalintensity fluxdensity,degreeofLP,degreeofCP,PA,spectralindexanddynamicPDS withobservationsfrom25January202101:35:00to25January202103:04:57 (UTC).Thetwodashedlinesdividethetimedomainintothreeregimes.For EpochA,fluxdensityisaround400–420 mJy.ForEpochB,fluxincreased fromapproximately450to660 mJy,andthe5-and10-HzQPOsappearedwith adurationofapproximately1,260 s.ForEpochC,fluxshowsaplateauof approximately660 mJy,andtheQPOsdisappeared.LPhasaslowrisingfrom 25to31%asthefluxdensityrises,whileCPevolvesfromaround0inEpoch Atoapproximately−1to−2%inEpochBandthenreturnsto0attheendof theobservation.PAisdeterminedtobearound87.5°inEpochsAandC,andPA isapproximately88.5°inEpochB.Theevolutionofthespectralindexfrom approximately−0.65towards−0.3indicatesthatthesystemisevolving fromopticallythintotheopticallythick.Inthebottompanel,wecalculated thedynamicalpowerspectrumbycombiningthePDSforeachdatasetof4-s duration.TheQPOsignalsatapproximately5and10 Hzareonlydetected duringEpochB.MJDisamodificationoftheJuliandate.
- 3. Nature | www.nature.com | 3 behaviour,withtheQPOsignaldisappearingsometimes.Astatistical studyofthetimescalesofthedetectedtransientQPOsignalsfindsthe durationofthe5-HzQPOtobeabout0.4–12 s,withapeakofapproxi- mately0.7 s.Thetypicalduration(τ)ofthe5-HzQPOsignalatτ ≈ 0.7 s definesacharacteristicscaleofapproximatelyτc ≈ 2 × 1010 cm,where cisthelightspeed,whichmayberelatedtothetypicalsizeoftheQPO emission region or lower limit of the emission height. ToprobethevariationcharacteristicsoftheQPOs,wefoldtheradio lightcurvesattheperiodof0.196 sfortheEpochBdata.Inthebottom panelofFig.3,theQPOpulseprofilesforthe5-Hzsignalsarepresented. The pulse profile shows a broad single peak covering more than 70% of the whole phase. The pulse-folding technique also constrains a dis- persionmeasureofapproximately230–280 pc cm−3 forGRS1915 + 105 (Methods). Additionally, we also fold the light curves of three polari- zation parameters (LP, CP and PA) at the same period during Epoch B, showing variations of these polarization parameters over the QPO pulseprofile.Inparticular,theCPshowsavariationpatternsimilartothe QPOprofile. GRS1915 + 105hasshownvariableLPandCPofradioemissionbyrela- tivisticelectrons,whichrevealsalarge-scalemagneticfieldstructure intheoutflow17 .CPofapproximately−1%wasdetectedduringtheQPO epoch. In a relativistic jet, there may be two physical mechanisms for CP:anintrinsicCPfromsynchrotronradiationandLPtoCPconversion (repolarizationbyFaradayconversion)17,18 .Amagneticfieldconfigura- tionperpendiculartothelineofsightwouldinduceFaradayconversion, especially with the presence of copious low-energy electrons18 . If the 26 28 30 32 LP (%) 0 0.2 0.4 0.6 0.8 1.0 Density a Epoch A Epoch B Epoch C –4 –3 –2 –1 0 1 CP (%) Density b 86.0 86.5 87.0 87.5 88.0 88.5 89.0 89.5 PA (º) 0 0.5 1.0 1.5 2.0 2.5 3.0 Density c 0 0.2 0.4 0.6 0.8 1.0 1.2 1.4 1.6 Epoch A Epoch B Epoch C Epoch A Epoch B Epoch C Fig.2|Evolutionofthepolarizationparameters. a–c,Thevaluedistributions oftheLP(a),CP(b)andPA(c)inthreeobservationalepochs:EpochsA,BandC. Thesolidlinesarethekerneldensityestimationsmoothingcurves.LPrises slowlywiththetime,whileCPandPAshowdifferentbehavioursbetweenEpoch B(theQPOregime)andEpochsAandC(thetexthasadetaileddescription). 0 2.5 5.0 7.5 10.0 12.5 15.0 17.5 20.0 Time (s) 64.0 16.0 4.0 Frequency (Hz) a 545 546 547 548 Flux (mJy) b 5 Hz profile 28.05 28.10 28.15 LP (%) –1.20 –1.18 –1.16 CP (%) 0 0.25 0.50 0.75 1.00 1.25 1.50 1.75 2.00 Phase 88.24 88.26 88.28 88.30 PA (º) Fig.3|FastvariationsoftheQPO.a,Inthewaveletanalysisresultoftheflux foratimeintervalof20 sasanexample,thecontourplotsshowthedetected periodic signals and their evolution with time. The orange dashed lines annotatethecentroidfrequenciesoftheperiodicsignals.Thediscontinuous andscatteringfeaturesofQPOsindicatethatthesignalsarenotdetected sometimesandmaynotappearsimultaneously.b,Fromtoptobottom,the pulseprofilesofthe5-HzregimeoverQPOphasesfoldedat0.2-speriodforflux (StokesI),LP,CPandPA.Thepulseprofilesofthe5-HzQPOareLorentzianlike, showingasinglepeak.Inaddition,thepolarizationprofiles,speciallyCP,show similarmodulationsinphasewiththefluxprofile(amplitudevariationsof approximately2–3%).Theerrorbarsaregivenwiththerangesof1σ.
- 4. 4 | Nature | www.nature.com Article large-scale magnetic field along the line of sight changes orientation with time, it also induces modulation of the observed CP. The detection of subsecond periodic oscillations in the radio band brings direct evidence of subsecond QPOs within the jet emission region in a stellar-mass black-hole system. To confirm the genuine origin of the QPO, we searched for similar subsecond QPO features in GRS 1915 + 105 in the archived data observed with FAST from 2020 to 2022.WedetectedanothertransientQPOsignatureatapproximately 0.21 ± 0.02 s, which lasted approximately 80 s, with the observations performed on 16 June 2022 (Fig.4), with the 19-beam receiver record- ingthedataofallbeamssimultaneously.Duringtheobservations,the centralbeam(M01;fieldofviewof3 arcmin)wastowardsthetargetGRS 1915 + 105,whilethebeamsM02–M19weretowardsotherskyregions for background monitoring. We applied the fast Fourier transform analysistoalllightcurves,includingbeamM01onGRS1915 + 105and other beams on the off-source sky regions in the same time interval (Fig. 4). Only the M01 data showed the QPO peak feature at around 5 Hzinthepowerspectrum.Otherbeamlightcurvesonlyshowedfluc- tuations in the power spectra with no QPO features detected. This strongly suggested that the subsecond QPOs at approximately 5 Hz were again from GRS 1915 + 105. This observation confirmed the QPO signaturedetectedinJanuary2021,suggestingthattheapproximately 5-Hzfrequencyisrepresentativeforthismicroquasarsystem.During thesecondevent,theradiofluxwasrelativelysteadyatalevelaround 350 mJy,withthemeasuredLPapproximately6.5%,CPapproximately −1.3% and PA approximately 96°. The spectral index α evolved from −0.08 to approximately −0.01 during the period. Low-frequencyQPOshavebeendetectedinblack-holeX-raybinaries in the optical, infrared, ultraviolet and X-ray bands11,19 . These QPOs probablyoriginatefromtheinneraccretiondisk,butotheroriginsfrom thecoronaortheoutflowarealsopossible11 .Modelsinvokingdifferent physical mechanisms have been proposed to interpret these QPOs (forexample,accretionejectioninstability20 ,propagatingoscillatory shocksinthedisk21 ,relativisticprecessionoftheinneraccretionflow22 or jet base23 ). Radio emission directly probes jet emission. Thus, the first detection of subsecond modulations in radio emission provides an unambiguous connection between the QPOs and the dynamics of the jet. The new phenomenon could arise from the precession of a magnetizedrelativisticjetwithawarpedaccretiondisk24,25 .However, it is not clear whether this variability can survive to the optically thin regionofthejet,anddetailedmodellingisneededtotestthisscenario. Whileitisinterestingtospeculateonaconnectionbetweendiskoscil- lationsandjetoscillations,atpresentthereisnoconfirmedmechanism to propagate oscillations from the disk to the jet. Nowadays,GRS1915 + 105appearsinadimmingX-raystate.During our FAST observations in both 2021 and 2022, GRS 1915 + 105 did not show any enhancement of emission in X-rays, suggesting possible obscuration of the X-rays (the long-term X-ray light curves and a dis- cussion on the special state are in Methods). In general, the launch of the jet may require a special condition at the engine, and a rapidly 10–5 10–4 10–3 10–2 10–1 100 Power Epoch A a Power Epoch B Fit 3V 100 101 102 Frequency (Hz) Power Epoch C 101 Power M01 b 101 Power M08 101 Power M10 10–5 10–4 10–3 10–2 10–1 100 10–5 10–4 10–3 10–2 10–1 100 100 101 102 Frequency (Hz) Fit 3V Fig. 4 | The power spectra of radio light curves based on the FAST observationaldata.a,ThePDSsofthreelightcurvesselectedfromthethree epochsobservedon25January2022(A,BandCasdefinedinFig.1).ThePDS inEpochBisfittedwithapower-lawcomponentandtwoLorentzianfunctions. Thecoloureddashedlineinthemiddlepanelindicatestheconfidencelevelat 3σ(thedetailsoftheuncertaintycalculationaredescribedinMethods).b,The PDSsoftheradiolightcurvesobservedon16June2022simultaneously recordedbythecentralbeamM01towardsGRS1915 + 105andtheotherbeams (forexample,M08andM10)towardsotherskyregions.ThesubsecondQPOs around5 Hzwereonlyreportedfromthetargetsource.Thepowerspectrum fromM01isfittedwithapower-lawcomponentandaLorentzianfunction. Thecoloureddashedlineinthetoppanelindicatestheconfidencelevelat3σ.
- 5. Nature | www.nature.com | 5 spinningblackholewithamagnetized,varyingaccretionflowmaybe in operation in GRS 1915 + 105 to power these relativistic jets. Onlinecontent Anymethods,additionalreferences,NaturePortfolioreportingsumma- ries,sourcedata,extendeddata,supplementaryinformation,acknowl- edgements, peer review information; details of author contributions andcompetinginterests;andstatementsofdataandcodeavailability are available at https://doi.org/10.1038/s41586-023-06336-6. 1. Mirabel, I. F. & Rodriguez, L. F. Sources of relativistic jets in the galaxy. Annu. Rev. Astron. Astrophys. 37, 409–443 (1999). 2. Remillard, R. A. & McClintock, J. E. X-ray properties of black-hole binaries. Annu. Rev. Astron. Astrophys. 44, 49–92 (2006). 3. Zensus, J. A. Parsec-scale jets in extragalactic radio sources. Annu. Rev. Astron. Astrophys. 35, 607–636 (1997). 4. McClintock, J. E. et al. The spin of the near-extreme Kerr black hole GRS 1915+105. Astrophys. J. 652, 518 (2006). 5. Mirabel, I. F. & Rodriguez, L. F. A superluminal source in the Galaxy. Nature 371, 46–48 (1994). 6. Fender, R. & Belloni, T. GRS 1915+105 and the disc-jet coupling in accreting blach hole systems. Annu. Rev. Astron. Astrophys. 42, 317–364 (2004). 7. Belloni, T. M. et al. A model independent analysis of the variability of GRS 1915+105. Astron. Astrophys. 355, 271–290 (2000). 8. Misra, R. et al. Identification of QPO frequency of GRS 1915+105 as the relativistic dynamic frequency of a truncated accretion disk. Astrophys. J. 889, L36 (2020). 9. Zhang, L. et al. A systematic analysis of the phase lags associated with the type-C quasi- periodic oscillation in GRS 1915+105. Mon. Not. R. Astron. Soc. 494, 1375–1386 (2020). 10. Belloni, T. M. & Altamirano, D. Discovery of a 34Hz quasi-periodic oscillation in the X-ray emission of GRS 1915+105. Mon. Not. R. Astron. Soc. 432, 19–22 (2013). 11. Ingram, A. & Motta, S. E. A review of quasi-periodic oscillations from black hole X-ray binaries: observation and theory. New Astron. Rev. 85, 101524 (2019). 12. Pooley, G. G. & Fender, R. P. The variable radio emission from GRS 1915+105. Mon. Not. R. Astron. Soc. 292, 925–933 (1997). 13. Rodriguez, L. F. & Mirabel, I. F. Fast sinusoidal oscillations in the radio flux of GRS 1915+105. Astrophys. J. 474, L123 (1997). 14. Klein-Wolt, M. et al. Hard X-ray states and radio emission in GRS 1915+105. Mon. Not. R. Astron. Soc. 331, 745–764 (2002). 15. Jiang, P. et al. The fundamental performance of FAST with 19-beam receiver at L band. Res. Astron. Astrophys. 20, 64 (2020). 16. Fender, R. P., Belloni, T. M. & Gallo, E. Towards a unified model for black hole X-ray binary jets. Mon. Not. R. Astron. Soc. 355, 1105–1118 (2004). 17. Fender, R. P. et al. Variable circular polarization associated with relativistic ejections from GRS 1915+105. Mon. Not. R. Astron. Soc. 336, 39–46 (2002). 18. Beckert, T. & Falcke, H. Circular polarization of radio emission from relativistic jets. Astron. Astrophys. 388, 1106–1119 (2002). 19. Kalamkar, M. et al. Detection of the first infra-red quasi-periodic oscillation in a black hole X-ray binary. Mon. Not. R. Astron. Soc. 460, 3284–3291 (2016). 20. Tagger, M. & Pellat, R. An accretion-ejection instability in magnetized disks. Astron. Astrophys. 349, 1003–1016 (1999). 21. Chakrabarti, S. K., Debnath, D., Nandi, A. & Pal, P. S. Evolution of the quasi-periodic oscillation frequency in GRO J1655-40: implications for accretion disk dynamics. Astron. Astrophys. 489, L41–L44 (2008). 22. Ingram, A., Done, C. & Fragile, P. C. Low-frequency quasi-periodic oscillations spectra and Lense-Thirring precession. Mon. Not. R. Astron. Soc. 397, L101 (2009). 23. Stevens, A. L. & Uttley, P. Phase-resolved spectroscopy of type-B quasi-periodic oscillations in GX 339-4. Mon. Not. R. Astron. Soc. 460, 2796–2810 (2016). 24. Miller-Jones, J. C. A. et al. A rapidly changing jet orientation in the stellar-mass black-hole system V404 Cygni. Nature 569, 374–377 (2019). 25. Ma, X. et al. Discovery of oscillations above 200 keV in a black hole X-ray binary with Insight- HXMT. Nat. Astron. 5, 94–102 (2021). Publisher’s note Springer Nature remains neutral with regard to jurisdictional claims in published maps and institutional affiliations. Springer Nature or its licensor (e.g. a society or other partner) holds exclusive rights to this article under a publishing agreement with the author(s) or other rightsholder(s); author self-archiving of the accepted manuscript version of this article is solely governed by the terms of such publishing agreement and applicable law. © The Author(s), under exclusive licence to Springer Nature Limited 2023
- 6. Article Methods Observations TheFASTisthelargestsingledishandthemostsensitiveradiotelescope intheworldinthe0.07-to3-GHzfrequencyrange.Thefrequencycover- ageofthe19-beamreceiveris1.05–1.45 GHz.Thesystemtemperature is a function of zenith angle and can be fitted with a modified arctan function validly no more than 40° from the zenith because the back- ground noises of this observation agree with the average level of the long-term noise monitoring (Extended Data Fig. 1). To facilitate the calibration,referencesignalsproducedbythenoisediodeareinjected into the receiving system. The temperature of the reference signal is about 1.1 K for low-power mode and 12.5 K for high-power mode15 . Themeasuredtemperatureuncertaintyofthediodeisapproximately 1%,whichwouldleadtoapproximately2%accuracyinfluxcalibration. Here, we have carried out a FAST observation on the microquasar GRS 1915 + 105 in tracking mode on the 1.05- to 1.45-GHz band with thecentralbeamofthe19-beamreceiver15 startingon25January2021 01:35:00 (UTC) with a 49.152-μs sample time for a duration of 90 min. The resolution of the central beam is approximately 2.9′. Before and afterthetrackingmodeobservations,thepatternoftheon–offmode in which the noise diode was continuously switched on and off was performed for two time intervals: from 01:25:00 to 01:30:00 (UTC) and from 03:10:00 to 03:15:00 (UTC), which are used for calibration processes. This led to the detection of the first QPO event. A second event was also detected by FAST during an observation performed on 16 June 2022 from 17:42:40 (UTC) to 17:47:30 (UTC) in thetrackingmodeonthe1.05-to1.45-GHzbandwiththecentralbeam of the 19-beam receiver. The data from all 19 beams were recorded for this observation. The central beam M01 was beamed towards the source,andtheother18beams(M02–M19)werebeamedtowardsthe off-source sky regions. Before and after the tracking mode observa- tions, the pattern of the on–off mode in which the noise diode was continuously switched on and off was performed. Extractinglightcurvesofradiofluxandpolarization Here,weshowthemethoddetailstoreducedataandcalibratethetotal intensity and polarization. The data of FAST are recorded in PSRFITS format26 .First,weusetheastropypackage27 todothepreprocessingfor FITS data files. For each of the FITS files, we do the resampling for the originaldataandextractthefrequencybandandtimefrom4,096fre- quencychannelsand128subints,andthen,wecombinetheresampled preprocesseddatafiles.ThePRESTO28 producesatimeseries,whichis theuncalibratedlightcurvefromthecombinedfile.Meanwhile,PRESTO canfindtheradiofrequencyinterferences(RFIs)andcreateamaskto eliminate these narrow-band signal-like noises. The noisy broadband signal in the periodogram may be caused by RFIs (for example, the variation of the feed source forms a 0.1-Hz noise, and the frequency of alternating current in the electronic system may also cause a noise of50Hzandtheharmoniccomponentinthewholeobservationtime). RFI-removing processes.Weusedthetwo-dimensionalwavelettrans- formmethodtomasktheRFI-contaminateddataandthen,filledthese masked data with the median values. The two-dimensional wavelet transformcanbeusedtoextracttime–frequencystructuralfeaturesof RFIsfromthenoisedataalongthehorizontal,verticalanddiagonallines ofthefeaturematrices(thatis,thenarrow-bandfrequencydomainRFI and the border-band impulsive RFI can be extracted in the horizontal andverticaldirections,whilethediagonalfeaturesindicatetheisolate abnormal values). We project anomalous signals into these three fea- turedimensions,thensmooththeobviousedgesby3σthresholdfilter- ing and reconstruct the time–frequency dynamic spectrum by using thetwo-dimensionalwaveletalgorithm.Thisalgorithmtendstoretain more data than the traditional frequency channel zapping methods. InExtendedDataFig.2,wedemonstratetheeffectofRFIremovaland the corresponding RFI mitigation data (Extended Data Fig. 2a,b). It is obviousfromthefrequencybandpassthatnearlyallnarrow-bandRFIs have been masked in RFI mitigation data (Extended Data Fig. 2c), and the histogram is consistent with a Gaussian white noise distribution (thevalueofχ2 is5%)(ExtendedDataFig.2d). To ensure that the RFI removal algorithm does not block the detec- tion of QPO-like signals, we designed an experiment to simulate the injectionof5-and10-Hztemporalmodulatedbroadbandsignalsinto therealFASTdatatoevaluatetheeffectofthetwo-dimensionalwave- let algorithm. The combined effect of 5- and 10-Hz temporal inten- sity injection and RFI events, particularly the satellite bands around 1.2 GHz,isshowninExtendedDataFig.3b.Asacomparison,theresult of RFI mitigation data (Extended Data Fig. 3c) shows not only that the two-dimensional wavelet algorithm does not block the detection of thecorrespondingperiodicsignalbutthatitalsoincreasesthesignifi- cance of the detected signal (for example, from 4.2σ to 12.5σ for 5 Hz; from 1σ to 3.4σ for 10 Hz). WealsoworkedwiththeFASTElectromagneticCompatibility(EMC) technical team to carefully examine the noise signals covering the whole bandpass to check for possible QPO-related effects from the receiver or backend instrumentation. The FAST EMC technical team regularly conducts noise tests on the L-band receiver performance15 . Duringeachofthenoisetests,anabsorberisusedtocoverthereceiver feed opening (Extended Data Fig. 4, left panel) (that is, the receiver willnotreceiveanyofexternalsignalsduringthetime).Wereanalysed theswitch-by-switchRFIexclusionexperimentaldataon26April2019 15:35–16:05(UniversalTime(UT) + 8)and10January202110:05–10:25 (UT + 8)asdemonstratedinthecorrespondingpowerspectrumforeach ofthetwofrequency-averagedlight-curvesegmentsinExtendedData Fig.4(rightpanel)assumingabroadbandsignal(afewhundredmega- hertz).Nodetectionof5-or10-Hzsignalswithinthefullfrequencyrange (1,050–1,450 MHz) was made. The horizontal and vertical axes show theFourierfrequencyandtheintensityinarbitraryunitsofthepower spectrum,whiletheverticalredandbluelinesarethelocationsof5and 10 Hz,respectively.Throughouttheobservations,noQPO-likedsignal (inparticular,for5 Hz)withanapparentintensityabove3σwasdetected. Flux calibration.Thesystemtemperatureofthetelescopeisafunction ofthezenithangle, ( ) T P θ P P = ⋅ arctan 1 + − + , (1) n sys 0 ZA 1 2 where θZA is the zenith angle; P0, P1, P2 and n are parameters; and their values vary with different frequencies. Table 4 and figure 12 in ref. 15 show the relationships between Tsys and θZA for different beams. The temperature of the source is T t T T t ( ) = ⋅ ON CALON−ON − ( ), (2) src cal sys where Tcal is the temperature of the injected reference signal from the noise diode, CALON and ON are the intensity values with the injected signal switched on and off for the calibration scans before and after the tracking observations and Tsys(t) is the time-dependent system temperature. Then, the observed flux density with time is: t t T t G Flux( ) = Track( ) ON ⋅ ( ) ⋅ 1 , (3) src whereTrack(t)istheintensityvaluesduringthetrackingobservations, G = ηG0 differsfromthemeasuredgainG0 = 25.6 K Jy−1 byafactoryη,is thefullgainofFASTintheskycoverageandηistheapertureefficiency. Meanwhile, there are some RFI broad peaks around channels from 1,400 to 2,380 (Extended Data Fig. 2) that are conspicuous. For a test
- 7. for the very clean database, we did another calibration and dynamic power density spectrum (PDS) calculation for the light curve with channels from 1,400 to 2,380 removed directly, and the results are shown in Extended Data Fig. 5. The QPO signals are still recognizable but a little weaker, which would be due to the reduction of observed channels leading to the lower signal–noise ratio. In addition, we also derive the spectral index in the band 1.05–1.45 GHz defined by α S ν = ∆log /∆log ν ,whereSv istheobservedfluxdensityatafrequency v.ThespectralindexevolutionversustimeisshowninExtendedData Fig.5,andαvariesfrom−0.6to−0.3duringtheincreasingoftheflux. Thechangeoftheradiospectrumgenerallyoccursbeforetheejection event14,29 . Polarization calibration. The original PSRFITS files of FAST observa- tion contain the polarization components that are recorded as the AABBCRCIform,whereAAandBBarethedirectproductsoftwochan- nelsandCRandCIaretherealandimaginarypartsofthecrossproduct oftwochannels,respectively.WeuseDSPSR30 andPSRCHIVE26 tofold theoriginalfileswiththeirdurationasfoldingperiodstoproducethe fourtimeseries.Eachofthefourtimeseriesisfullof4,096frequency channels and 128 time subints, so it is necessary to eliminate the RFIs manuallyforeachtimeseries. Wecalculatethestokesparametersfromthefourrecordedchannels, named I x 2 , I y 2 ,CRandCI,respectively31 ,whereCRandCIaretherealand imaginary parts of the crossproduct of two channels Ix × Iy. Generally, for normal devices, feeds are never perfect, and there are two quanti- ties that should be considered and calibrated (that is, relative gain of the electronic system and phase differences between two channels). Inthispaper,wenamedthetwoquantitiesasleakageandphaseerror. Additionally, stokes parameters with subscripts obs and true refer to polarization components before and after calibration, respectively, which normally should take the Mueller matrix32,33 of the equipment into account. Then, considering the leakage between two channels, for the linearly polarized signal from the diode, we find I I f Q Q Q f I ′ = ′ + ⋅ ′ ′ = ′ + ⋅ ′ , (4) obs true true obs true true where ′ means the injected reference signal and the leakage f = ′ ′ Q I obs obs . We calibrated the phase error asδ = arctan ′ ′ V U er 1 2 obs obs ; then, removing the error from orientation, we can get the true values of the four stokes parameters: I I f Q f Q Q f I f U P δ δ P δ δ P δ δ V P δ δ P δ δ P δ δ = − ⋅ 1 − = − ⋅ 1 − = cos(2( − )) = cos2 cos2 + sin2 sin2 = sin(2( − )) = sin2 cos2 + cos2 sin2 , (5) true obs obs 2 true obs obs 2 true er er er true er er er where P U V = + obs 2 obs 2 .Finally,thedegreesofLPandCPandthepolar- ization PA are calculated as L I Q U I V I U Q LP = = + CP = PA = 1 2 arctan . (6) true true 2 true 2 true true true true Dispersionmeasuretest The dispersion measure represents the integrated column density of freeelectronsbetweenanobserverandapulsar34 ,thenobservationally leads to a broadening of a sharp pulse when a pulsar is observed over afinitebandwidth.Unfortunately,theverybroadandsine-likeprofile of transient 5-Hz QPO compared with the pulses in pulsars makes it difficult to directly detect the dispersion measure of the source from the delay of time of arrival between different frequencies of the QPO. In this work, we used the prepfold to fold the data during Epoch B in January2021attheperiodoftheQPO(0.196 s)atdifferentdispersion measure values. Here, we take the dispersion measure ranges from 0 to 700 pc cm−3 and set the step of 1 pc cm−3 . Then, we fit each folded profiles via Lorentzians. The fitting parameters (for example, ampli- tude (A) and full-width at half-maximum (σ)) are supposed to reach themaximumandminimum,respectively,aroundthetruedispersion measure value. In Extended Data Fig. 6, the evolution of A, σ and A/σ withdispersionmeasureareplotted;thepeakofA/σcentringaround a dispersion measure of approximately 255 pc cm−3 with an s.d. of 25 pc cm−3 (68% confidence level) indicates the possible dispersion measure of the source. Dynamicalpowerspectrum Themainaimofthetiminganalysishereistosearchforthesubsecond QPOsinradiofluxlightcurves.QPOsaregenerallystudiedintheFou- rierdomainandshowupinthePDSasnarrowpeaks.WeusedNumpy. fft.fft and Stingray in Python packages to perform the PDS analysis, including the production and fitting of the PDS. We calculated the PDS for every 4-s dataset of the calibrated flux time series and then wearrangedtheminchronologicalordertogetasetofspectrathatis calledthedynamicalpowerspectrum(Fig.1andExtendedDataFig.5) for the whole observational time series on 25 January 2021. Based on theQPOsignalevolutionbehaviour,theobservationaltimeseriescan be divided into three time regimes: the pre-QPO regime (Epoch A), the QPO regime (Epoch B) and the post-QPO regime (Epoch C). With thesamemethods,wealsoderivedtheevolutionoftheradiofluxand polarization for the second QPO event on 26 June 2022 and present the dynamical power spectrum of the flux light curves in Extended DataFig.7.TheQPOaround5 Hzlastedforabout80 s,whichwasalso weaker than that detected in January 2021. InFig.4a,wedisplaythePDSsofthethreelightcurvesselectedfrom thethreeepochs(A,BandC)on25January2021.Theplotsofthethree PDSs show two unambiguous peaks around 5 and 10 Hz only appear- ing during Epoch B. There are no QPO signals during Epochs A and C. In addition, for comparison, we also showed the PDSs of the three light curves selected from the central beam and the other two beams with the FAST observations performed on 16 June 2022 in Fig. 4b. The 5-Hz QPO was only reported in the central beam towards the source. Nosignalsweredetectedinotherbeamstowardsthebackgroundsky regions.Meanwhile,inFig.4,wedenoteasignificancelevelof3σusing alightcurvesimulationalgorithm35 torepresentthecriterionforQPO detection.Forthesignificance-levelcomputation,wesimulated20,000 light curves with power-law distributed noises appropriate for our data and resampled these light curves to ensure that the resolution matched our observation data. Waveletanalysisresults The dynamical PDS technique has the limit of the time resolution at thetimeintervals(severalseconds)usedforthetimedomainanalysis. However, the wavelet analysis method can provide accurate time– frequencyspaceinformationwithveryhightimeresolution,andthus, it can be used to study the detailed variation characteristics of the periodic or quasiperiodic signals over time36 , which also have been applied to timing analysis of X-ray light curves in the X-ray binaries to discover the transient QPOs37–39 .
- 8. Article WealsousedthewaveletanalysismethodtotesttheQPOsignalswe detected in dynamical PDS, which can approach the time evolution and variation of the signal. In wavelet analysis, we have taken the red noiseintoaccountbycalculatingthecorrelationfunctionsofthetime series, and a simple model to compute red noise is the univariate lag-1 autoregressive process, so that we estimate the red noise from α α ( + )/2 1 2 wheretheα1 andα2 arethelag-1andlag-2autocorrelations ofthetimeseries,respectively.Basedontheχ2 distribution,ifapower inthewaveletpowerspectrumisabovethe95%confidencelevelcom- pared with the background spectrum, then it can be considered as a true signal. ThewaveletpowerspectrumwiththetimeshowsthattheQPOshave the fine structure evolution in both the time and frequency domains (an example of the wavelet spectrum is in Fig.3). The 5-Hz QPO signal is stronger over the time than the 10-Hz QPO; in addition, 5-Hz QPO can be detected in most observational time intervals during the QPO regime,whilethe10-HzQPOsignaldistributessparsely.Then,basedon thewaveletpowerspectrum,wecanclearlyidentifythetimeregimes whenthe5-HzQPOisonlydetectedandwhenboth5-and10-HzQPOs appear. Thus, we fold the light curves at the 0.2-s period to create the pulseprofilesofthefluxdensityforthe5-Hzregime,whichshowsthe single-peakbroadpulseprofile.Inaddition,tocheckthevariationpat- terns of the polarization with the pulse profiles of the QPOs, we also foldthelightcurvesofdifferentpolarizationcomponents(thatis,LP, CP and PA) at the 0.2-s period of the QPO for the 5-Hz regime (Fig. 3). With the time–frequency space information provided by wavelet analysis, the variance of power with time and frequency can be easily identified so as to distinguish the time intervals with QPOs and non-detectionofQPOs.Theradiovariationpropertiesshouldberelated to the jet dynamics; then, the short timescale evolution of two QPO signalsprovidestheprobeofthecharacteristictimescalesofjetproduc- tionanddynamics.Thus,wehavestatisticsonthetimeintervalsofthe QPOsignalsinEpochB(ExtendedDataFig.8):thedurationdistribution ofthe5-HzQPOs,theseparateintervaldistributionfortwoneighbour 5-HzQPOsandthedurationofthe10-Hzsignal.The5-Hzsignalisstrong andcanbedetectedinmosttime.However,the10-Hzsignalisweaker, the QPO feature lasts for only about 1 s or subseconds, and there are gaps lasting for several to tens of seconds without a feature. Wealsousethelogarithmicnormalfunctiontofitthedistributions todeterminethepeakvaluesofthreetypicaltimeintervals,whichwill probe the characteristic dynamical timescales of jets near the black hole.Thedurationofthe5-HzQPOdistributesinthebroadtimescales from0.3to12 sandthepeakaround0.7 s.Thischaracteristictimescale would be connected to the typical emission size of the QPO emission source in the jet (approximately cτ). Although the 5-Hz QPO signal is the dominant component in the power spectrum, the signal would alsonotbecontinuous,andinsometimeintervalsofEpochB,noQPO signal can be detected. OtherradioQPOsinblack-holeaccretionsystems Long-periodradioQPOswiththeperiodsfromabout100 daystosev- eralyearshavebeenreportedinsomeradioloudactivegalacticnuclei (AGNs),especiallyblazars40–43 .TheseradioQPOsgenerallylastforabout several to 20 cycles, which probably reflects the special dynamics of relativistic jets powered by supermassive black holes in AGNs. Radio oscillations with a period of approximately 15 h were also found in a gamma-ray X-ray binary LS I + 61°303 (ref. 44), which only had two or three QPO cycles. In addition, slow radio oscillations in the period rangefrom20to50 minweredetectedinGRS1915 + 105(refs.12–14). Therehavebeenafewphysicalmodelssuggestedtointerpretthese QPOs.Forstellarmassblack-holesystems(forexample,GRS1915 + 105), thehalf-hourradioperiodicoscillationsmaybeconnectedtotheX-ray oscillations with the similar periods, while in LS I + 61°303, it was sug- gestedthattheradioQPOscouldresultfrommultipleshocksinajet44 . TheinfraredQPOsaround0.1 HzreportedinamicroqusarGX339-4are attributedtothejetprecession45 .IntheframeworkofAGNs,radioQPO modelsarediverse.TheyearlongQPOsaregenerallyconsideredtobe theindicatoroftheorbitalmotionofbinarysupermassiveblack-hole systems. Helical structures in magnetic fields and plasma trajectory are expected in magnetically dominated jets46 , so helical motion of blobsorshocksinrelativisticjetshavebeenincorporatedtointerpret periodsaroundhundredsofdaysinradio,opticalorgamma-raybands in blazars47,48 . Recently, the optical and gamma-ray periods around 0.6 daysinBLLacertaeweresuggestedtooriginatefromkinkinstabil- ity in relativistic jets49 . X-raymonitoringofGRS1915 + 105 We have checked the X-ray light curves by monitoring the source based on Swift and Gas Slit Camera aboard Monitor of All-sky X-ray Image(MAXI)from2016to2021,whicharedisplayedinExtendedData Fig. 9. The Burst Alert Telescope aboard Swift covers the energy band of 15–50 keV, and MAXI reports the count rates of two energy bands: 2–6 keVand6–15 keV.Asexpected,GRS1915 + 105isthestronglyvari- able X-ray source and shows flares in the historic records. Since 2018, GRS 1915 + 105 has unexpectedly started a peculiar low-luminosity state that is an order of magnitude dimmer than the previous states, with greater hardness ratio in X-rays50–55 (Extended Data Fig. 9). Even thoughintrinsicdimmingispossible,detailedX-rayspectralanalyses suggestedthatthesourcemayhaveenteredanobscuredstatewiththe strongabsorption(bydiskwindsortorusintheouterdiskpart)along theobserver’ssight51–53,55,56 duetoalargeinclinationangleofapproxi- mately60°(ref.57).Thisinterpretationwassupportedbythedetection of X-ray flares, which are not strongly affected by obscuration. The observationsoffrequentradioflaresduetotheepisodicjetemissions58 are also consistent with this scenario. During the FAST observations on25January2021and16June2022,theX-rayfluxwasweakbasedon both Swift and MAXI observations. The radio oscillations revealed by our FAST observations suggest that presently GRS 1915 + 105 may stillhaveahighaccretionratetopowertransientrelativisticjets.This adds further support to the suggested strong obscuration in X-rays. Comparisonwithotherradioobservations The radio flux and LP values from relativistic jets are highly vari- able and change significantly in different radio bands and different epochs14,17,29,59,60 . Here, we briefly compare our radio results on GRS 1915 + 105 with other observations. The Very Large Array, Very Long BaselineArray,MeerKat,Multi-ElementRadio-LinkedInterferometer Network (MERLIN) and other radio telescopes have monitored GRS 1915 + 105 in different radio bands. MeerKat reported a radio flux of approximately100–900 mJyduringtheradioflaresafter201858 ,which isconsistentwiththeradiofluxofthepresentobservations.Inaddition, MERLINhasasimilarobservationalwavebandaround1.2 GHz,report- inganLPofapproximately(1–24%)(refs.59,60).OurFASTobservation on 25 January 2021 has an LP of approximately (25–31%), which is a little higher than or still approaching the previously reported values. Thisvalueisalsophysicallyreasonable.Foramagneticallydominated jet with an ordered magnetic field configuration, in the optically thin emission(α < 0;forexample,thecaseofradioflares)themaximumLP can be as high as 70% (refs. 61,62). For the observations of FAST on 25 January2021,theradioflarehasanαofapproximately−0.5,andtheLP couldbeashighasapproximately30%foralarge-scalemagneticfield alongthejet,consistentwiththeFASTresult.ThesomewhatsmallerLP inearlierobservationsmaybearesultofobservingdifferentepisodesof jetinjection.Asthejetpropagates,theLPdegreemaydegradebecause ofthedissipationoftheorderedmagneticfieldintheemissionregion. Ourobservationmighthavecaughttheearlyphaseofafreshlyinjected jetthathasahigherLPdegree.Ingeneral,theLPofthepresentobserva- tions is still similar to the previous observations and other black-hole systems59,60,62 , which increases with decreasing randomization of the magnetic field within the jet component29 .
- 9. Dataavailability All relevant data for the GRS 1915 + 105 observations are available from the Five-Hundred-Meter Aperture Spherical Radio Telescope archive(http://fast.bao.ac.cn)one yearafterdatatakingfollowingthe Five-Hundred-MeterApertureSphericalRadioTelescopedatapolicy. Owingtothelargedatavolumefortheseobservations,interestedusers are encouraged to contact the corresponding author to arrange the data transfer. The data that support the findings of this study are openlyavailableintheScienceDataBankathttps://doi.org/10.57760/ sciencedb.08478. Codeavailability CodeisavailableatPSRCHIVE(http://psrchive.sourceforge.net),DSPSR (http://dspsr.sourceforge.net)andPRESTO(https://github.com/scot- transom/presto). 26. Hotan, A. W., van Straten, W. & Manchester, R. N. PSRCHIVE and PSRFITS: an open approach to radio pulsar data storage and analysis. PASA 21, 302–309 (2004). 27. Astropy Collaboration. The Astropy Project: building an open-science project and status of the v2.0 core package. Astron. J 156, 123 (2018). 28. Ransom, S. PulsaR Exploration and Search TOolkit. Astrophysics Source Code Library http://ascl.net/1107.017 (2011). 29. Fender, R. et al. MERLIN observations of relativistic ejections from GRS 1915+105. Mon. Not. R. Astron. Soc. 304, 865–876 (1999). 30. van Straten, W. & Bailes, M. DSPSR: digital signal processing software for pulsar astronomy. PASA 28, 1–14 (2011). 31. van Straten, W., Manchester, R. N., Johnston, S. & Reynolds, J. E. PSRCHIVE and PSRFITS: definition of the Stokes parameters and instrumental basis conventions. PASA 27, 104–109 (2010). 32. Heiles, C. Cross-correlation spectropolarimetry in single-dish radio astronomy. Pub. Astron. Soc. Pacific 113, 1243–1246 (2001). 33. Heiles, C. et al. Mueller matrix parameters for radio telescopes and their observational determination. Pub. Astron. Soc. Pacific 113, 1274–1288 (2001). 34. Davidson, K. & Terzian, Y. Dispersion measures of pulsars. Astron. J. 74, 849–854 (1969). 35. Timmer, J. & Koenig, M. On generating power law noise. Astron. Astrophys. 300, 707 (1995). 36. Torrence, C. & Compo, G. P. A practical guide to wavelet analysis. Bull. Am. Meteorol. Soc. 79, 61–78 (1998). 37. Ding, Y. Z. et al. QPOs and orbital elements of X-ray binary 4U 0115+63 during the 2017 outburst observed by Insight-HXMT. Mon. Not. R. Astron. Soc. 503, 6045–6058 (2021). 38. Chen, X. et al. Wavelet analysis of MAXI J1535-571 with Insight-HXMT. Mon. Not. R. Astron. Soc. 513, 4875–4886 (2022). 39. Chen, X. et al. Wavelet analysis of the transient QPOs in MAXI J1535-571 with Insight-HXMT. Mon. Not. R. Astron. Soc. 517, 182–191 (2022). 40. Zhang, P. & Wang, Z. A radio quasi-periodic oscillation of 176 days in the radio-loud narrow- line Seyfert 1 Galaxy J0849+5108. Astrophys. J. 914, 1 (2021). 41. Ren, G. W. et al. Detection of a possible high-confidence radio quasi-periodic oscillation in the BL Lac PKS J2134-0153. Mon. Not. R. Astron. Soc. 506, 3791–3796 (2021). 42. Raiteri, C. M. et al. Optical and radio variability of the BL Lacertae object AO 0235+16: a possible 5-6 year periodicity. Astron. Astrophys. 377, 396–412 (2001). 43. Bhatta, G. Radio and gamma-ray variability in the BL lac PKS 0219-164: detection of quasi- periodic oscillations in the radio light curve. Astrophys. J. 847, 7 (2017). 44. Jaron, F. et al. Radio QPO in the gamma-ray-loud X-ray binary LS I +61∘ 303. Mon. Not. R. Astron. Soc. 471, L110 (2017). 45. Malzac, J. et al. A jet model for the fast IR variability of the black hole X-ray binary GX 339-4. Mon. Not. R. Astron. Soc. 480, 2054–2071 (2018). 46. Chen, L. & Zhang, B. Analytical solution of magnetically dominated astrophysical jets and winds: jet launching, acceleration, and collimation. Astrophys. J. 906, 105 (2021). 47. Zhou, J. et al. A 34.5 day quasi-periodic oscillation in γ-ray emission from the blazar PKS 2247-131. Nat. Comm. 9, 4599 (2018). 48. Sarkar, A. et al. Multiwaveband quasi-periodic oscillation in the blazar 3C 454.3. Mon. Not. R. Astron. Soc. 501, 50–61 (2021). 49. Jorstad, S. G. et al. Rapid quasi-periodic oscillations in the relativistic jet of BL Lacertae. Nature 609, 265–268 (2022). 50. Negoro, H. et al. MAXI/GSC observes GRS 1915+105 in the X-ray faintest state in the last 22 years. The Astronomer’s Telegram (9 July 2018); https://www.astronomerstelegram.org/? read=11828. 51. Neilsen, J. et al. A NICER view of a highly absorbed flare in GRS 1915+105. Astrophys. J. 902, 152 (2020). 52. Miller, J. M. et al. An obscured, Seyfert 2-like state of the stellar-mass black hole GRS 1915+105 caused by failed disk winds. Astrophys. J. 904, 30 (2020). 53. Koljonen, K. I. I. & Tomsick, J. A. The obscured X-ray binaries V404 Cyg, Cyg X-1, V4641 Sgr, and GRS1915+105. Astron. Astrophys. 639, A13 (2020). 54. Koljonen, K. I. I. & Hovatta, T. ALMA/NICER observations of GRS 1915+105 indicate a return to a hard state. Astron. Astrophys. 647, A173 (2021). 55. Ratheesh, A. et al. Exploring the accretion-ejection geometry of GRS1915+105 in the obscured state with future X-ray spectro-polarimetry. Astron. Astrophys. 655, A96 (2021). 56. Balakrishnan, M. et al. The novel obscured state of the stellar-mass black hole GRS 1915+105. Astrophys. J. 909, 41 (2021). 57. Reid, M. J. et al. A parallax distance to the microquasar GRS 1915+105 and a revised estimate of its black hole mass. Astrophys. J. 796, 2 (2014). 58. Motta, S. E. et al. Observations of a radio-bright, X-ray obscured GRS 1915+105. Mon. Not. R. Astron. Soc. 503, 152–161 (2021). 59. Miller-Jones, J. C. A. et al. Multiple relativistic outbursts of GRS1915+105: radio emission and internal shocks. Mon. Not. R. Astron. Soc. 363, 867–881 (2005). 60. Rushton, A., Spencer, R. E., Pooley, G. & Trushkin, S. A. A decade of high-resolution radio observations of GRS 1915+105. Mon. Not. R. Astron. Soc. 401, 2611–2621 (2010). 61. Longair, M. S. High Energy Astrophysics. Vol. 2(Cambridge Univ. Press,1994). 62. Curran, P. A. et al. The evolving polarized jet of black hole candidate Swift J1745-26. Mon. Not. R. Astron. Soc. 437, 3265–3273 (2014). Acknowledgements This work is supported by the National Key Research and Development Program of China (2021YFA0718500 and 2021YFA0718503), the NSFC (12133007, U1838103, U2031117, 12233002 and U2031205), the Youth Innovation Promotion Association CAS (2021055), the CAS Project for Young Scientists in Basic Research (YSBR-006) and the Cultivation Project for FAST Scientific Payoff and Research Achievement of CAMS-CAS. Author contributions W.W., as the principal investigator of the Five-Hundred-Meter Aperture Spherical Radio Telescope observations, led the data analysis and wrote the paper. P.T. and P.Z. did the data analysis. P.W., X.S., J.L. and Z. Zheng provided the help of the radio data analysis and software. W.W., B.Z., Z.D., F.Y., S.Z., Q.L. and X.W. constructed the scientific interpretation of the data and B.Z. contributed to the writing of the paper. P.W., P.J., D.L., Z. Zhu, Z.P. and H.G. aided with the Five-Hundred-Meter Aperture Spherical Radio Telescope observations. J.C., X.C. and N.S. provided the X-ray data. All authors have reviewed the results and manuscript. Competing interests The authors declare no competing interests. Additional information Supplementary information The online version contains supplementary material available at https://doi.org/10.1038/s41586-023-06336-6. Correspondence and requests for materials should be addressed to Wei Wang or Bing Zhang. Peer review information Nature thanks the anonymous reviewers for their contribution to the peer review of this work. Peer reviewer reports are available. Reprints and permissions information is available at http://www.nature.com/reprints.
- 11. ExtendedDataFig.2|AdemonstrationofRFI-mitigationexperimentusing thetwo-dimensionalwaveletalgorithm.a,signalintensityasafunctionof frequencyandtime(waterfall)plotoftherawdataofGRS1915+105between MJD59239.09766-59239.09997(bottomsubplot)andfrequency-averaged lightcurve(uppersubplot).b,thereddotsatthewaterfallplotrepresentthe maskedRFIcontaminateddatabyusingthetwo-dimensionalwaveletalgorithm and then fill these masked data by the median values. c, comparison of frequencybandpassfortherawdataandRFIremovalresult.d,comparison of histogramforrawdata(white)andRFIremoveddata(blue,theredlineisthe gaussianfittingwiththevalueofChi-squareislessthan5%).
- 14. Article ExtendedDataFig.5|Lightcurveanddynamicpowerspectrumwithless channels. Lightcurve,spectralindexevolutionanddynamicPDSoftheradio fluxwhichiscalibratedwithdirectlyremovingRFIpeaksfromthechannels 1400to2380.Thereare2700channelsleftafterchannelcuttingandRFI removing.QPOsignalsat ~ 5Hzarefaintercomparedtothecasewithabout 3400channels.TheEpochsA,BandChavethesamedefinitioninFig.1,with thetimerecordstartingfromJanuary25202101:35:00(UTC).Theindexα variesfrom − 0.6to − 0.3duringtheEpochs.
- 15. ExtendedDataFig.6|TheDMvalueofQPOsignals.Amplitude(A)andfull widthathalfmaximum(σ)ofthefittingLorentziansforthefoldedcurvesevolve withDM.ThepeakofA/σislocatedatDM ~ 255 ± 25pccm−3 ,whichisfittedviaa Gaussianfunction(greendashedline),wouldindicatethepossibledispersion measureofGRS1915+105.
- 16. Article ExtendedDataFig.7|Lightcurvesanddynamicalpowerspectrumduring theQPOphasein2022.Thelightcurvesoftotalintensityfluxdensity,LP,CP, PA,spectralindexαanddynamicPDSwithFASTobservationsfrom2022-06- 16:17:42:40to2021-06-16:17:47:30(UTC).ThetransientQPOat ~ 5Hzlasting about80secondswasdetected.Duringtheevent,theradiofluxwassteadyata levelaround350mJy;LPwasaround6.5%andincreasedslightlyduringthe observations;CPwasmeasuredat ~ − 1.3%,andthePAwasaround96∘ .The spectralindexαalsoevolvedfrom − 0.08to − 0.01.Allerrorbarsaregivenat the1σlevel.