SlideShare a Scribd company logo
1 of 117
Review Article
Potential role of sugar (fructose) in the epidemic of
hypertension,
obesity and the metabolic syndrome, diabetes, kidney disease,
and
cardiovascular disease1�3
Richard J Johnson, Mark S Segal, Yuri Sautin, Takahiko
Nakagawa, Daniel I Feig, Duk-Hee Kang, Michael S Gersch,
Steven Benner, and Laura G Sánchez-Lozada
ABSTRACT
Currently, we are experiencing an epidemic of cardiorenal
disease
characterized by increasing rates of obesity, hypertension, the
met-
abolic syndrome, type 2 diabetes, and kidney disease. Whereas
ex-
cessive caloric intake and physical inactivity are likely
important
factors driving the obesity epidemic, it is important to consider
additional mechanisms. We revisit an old hypothesis that sugar,
particularly excessive fructose intake, has a critical role in the
epi-
demic of cardiorenal disease. We also present evidence that the
unique ability of fructose to induce an increase in uric acid may
be a
major mechanism by which fructose can cause cardiorenal
disease.
Finally, we suggest that high intakes of fructose in African
Ameri-
cans may explain their greater predisposition to develop
cardiorenal
disease, and we provide a list of testable predictions to evaluate
this
hypothesis. Am J Clin Nutr 2007;86:899 –906.
KEY WORDS Fructose, uric acid, sugar, arteriosclerosis, en-
dothelial dysfunction, hypertension, obesity, chronic kidney dis-
ease, metabolic syndrome
INTRODUCTION
Despite our best efforts, the epidemic of cardiorenal disease
continues to increase at an alarming rate. Obesity affects one-
third of adults and one-sixth of children in the United States
and
continues to increase; although dietary interventions are often
initially successful, they often fail over time because of attrition
(1). Likewise, hypertension affects nearly one-third of the pop-
ulation, but despite the presence of effective antihypertensive
agents, nearly two-thirds of these patients remain either un-
treated or are treated ineffectively (2). Furthermore, even if the
hypertension is controlled, these subjects continue to have in-
creased cardiovascular mortality (3). Diabetes, a complication
of
obesity, now affects 7% of our population, with approximately
one-third doomed to develop various complications such as ret-
inopathy or nephropathy (4). Kidney disease also continues to
increase at a deplorable rate, a consequence of the increasing
frequency of hypertension and diabetes (5). Today, nearly 20
million Americans have stage 1 kidney disease or greater (de-
fined as the presence of microalbuminuria or a glomerular fil-
tration rate �90 mL�min�1�1.73 m�2; 6), and, although
treat-
ments such as angiotensin-converting enzyme inhibitors are
beneficial, they act primarily to delay the progression to renal
failure as opposed to halting the process (7).
It is our opinion that the potential mechanisms underlying the
epidemic should be carefully reappraised. On the basis of both
the experimental studies performed in our laboratories and an
extensive review of the literature, we revisit an old hypothesis
that a simple dietary substance may have a significant role in
driving the epidemic. Interestingly, reappraising the role of
sugar
and its influence in the development of cardiorenal disease may
lead to a new understanding of why certain populations, such as
African Americans, Native Americans, Maori, and Australian
Aborigines, are at greater risk of developing the disease.
Similar
to the relation between high intakes of salt or protein and the
risk
of developing kidney disease or to the relation between a high-
fat
diet and the atherosclerotic phenotype, we propose that sugars
containing fructose may play a major role in the development of
hypertension, obesity, and the metabolic syndrome and in the
subsequent development of kidney disease. Although physical
inactivity and overeating are major contributors to the obesity
epidemic, we present evidence that fructose may be the “caries”
at the epidemic’s root.
THE EPIDEMIC OF CARDIORENAL DISEASE
If the goal is to understand the causes of the epidemic, it is
important to first review the literature to understand the timing
and origins of the epidemic of cardiorenal disease. This type of
epidemiologic analysis may provide insights into the potential
etiologies that can then be tested in the experimental setting.
After the introduction of the inflatable cuff for blood pressure
measurement by Riva Rocci in the late 1800s, population-based
studies were performed throughout the world (reviewed in 8). A
1 From the Division of Nephrology and Department of
Medicine, Univer-
sity of Florida, Gainesville, FL (RJJ, MSS, YS, TN, and MSG);
the Division
of Pediatric Nephrology, Texas Children’s Hospital, Baylor
College of Med-
icine, Houston, TX (DIF); the Division of Nephrology, Ewha
Woman’s
University College of Medicine, Seoul, Korea (D-HK); the
Foundation for
Applied Molecular Evolution, Gainesville, FL (SB); and the
Instituto Na-
cional de Cardiologia Ignacio Chavez, Mexico City, Mexico
(LGS-L).
2 Supported by NIH grants DK-52121, HL-68607, and HL-
79352 (to RJJ)
and by a grant from the Korea Health 21 R&D Project, Ministry
of Health &
Welfare, Republic of Korea (A050626; to D-HK).
3 Address reprint requests to RJ Johnson, CG-98, 1600 Archer
Road,
Gainesville, FL 32610. E-mail: [email protected]
Received November 16, 2006.
Accepted for publication March 5, 2007.
899Am J Clin Nutr 2007;86:899 –906. Printed in USA. © 2007
American Society for Nutrition
a
t C
A
L
IF
O
R
N
IA
S
T
A
T
E
U
N
IV
E
R
S
IT
Y
N
O
R
T
H
R
ID
G
E
o
n
N
o
ve
m
b
e
r 1
7
, 2
0
1
6
a
jcn
.n
u
tritio
n
.o
rg
D
o
w
n
lo
a
d
e
d
fro
m
http://ajcn.nutrition.org/
study performed between 1907 and 1919 in �140 000 healthy
adults applying for life insurance in the New York region sug-
gested that a blood pressure of 140 (systolic)/90 (diastolic) mm
Hg was abnormal because it reflected only 5-6% of the popula-
tion in the United States (9); however, by nature, these early
studies may not have been representative of the general popula-
tion because they usually did not include subjects of lower so-
cioeconomic status who could not afford insurance or patients
who had been previously diagnosed with a disease.
Nevertheless,
on the basis of these early studies, a blood pressure of 140/90
mm
Hg was adopted as the definition of hypertension.
There has been a remarkable increase in the prevalence of
hypertension in the US population since the early 1900s. In a
study performed in 1939 of �11 000 residents in the Chicago
area, only 11-13% of the adult population had blood pressures
in
the hypertensive range (10); this increased to 25% in 1975 (11),
to 28% in 1990 (12), and to 31% (61 million people) in 2004
(13).
Similar observations were noted in other countries. Hyperten-
sion was initially rare in all parts of the world except in Europe,
particularly in England, France, Germany, and the United States
(14 –16). In studies conducted as late as 1940, hypertension ap-
pears to have been almost nonexistent in non-Western peoples,
including studies performed in Native Americans, Australian
Aborigines, Maori, Alaskan Eskimos, Asians, and African
blacks (reviewed in 8). However, with the introduction of a
Western culture and diet, there has been a significant change.
The
prevalence of hypertension has been increasing throughout the
world, and the greatest relative increase has been observed in
groups with less socioeconomic support (8).
Not surprisingly, a rise in hypertension is paralleled by in-
creasing rates of obesity and diabetes. In a study of Civil War
veterans, obesity [defined as a body mass index (BMI; in
kg/m2)
�30] was observed in only 3.4% of 50- to 59-y-old male
veterans
in 1890, but this percentage rose slightly to 5.9% by 1900 (17).
Obesity rates continued to increase during the early 1900s,
reach-
ing 14.5% in 1976 –1980, 22.5% in 1988 –1994, and 30.4% in
1999 –2002 (4, 18). Similarly, Osler (19) estimated a
prevalence
of 2–3 cases of diabetes per 100 000 persons in the population
in
1893; however, today, type 2 diabetes affects �7% of our pop-
ulation and is estimated to double in prevalence by 2020. The
increases in the rates of obesity and diabetes are being observed
throughout the world (20). As with hypertension, these condi-
tions are greatest among the less privileged in societies such as
African Americans, Native Americans, and Hispanics in the
United States; the Maori in New Zealand; and Aborigines in
Australia (20).
There has also been a remarkable increase in chronic kidney
disease (4, 21). The incidence of end-stage renal disease in the
United States has increased 4-fold between 1980 and 2002 (21),
and similar increases are being observed throughout the world.
Most of the increase is due to diabetes and hypertension. The
incidence of end-stage renal disease in the United States has
increased 4-fold between 1980 and 2002 (21), and similar in-
creases are being observed throughout the world. Most of the
increase is due to diabetes and hypertension.
The increase in hypertension and diabetes translates into in-
creased rates of stroke, heart failure, and myocardial infarction.
Indeed, there has also been a remarkable increase in cardiovas-
cular disease throughout the world. Coronary artery disease was
once considered rare and was observed primarily in Europe and
in the United States (22). By 1929, Platt (23) noted that
coronary
disease had increased in frequency such that it was commonly
observed by the family practitioner; by 1940, cardiology was
initiated as a discipline in the United States. By 1950, there
were
only 500 cardiologists in the United States, and, by 1960, the
World Health Organization pronounced a world epidemic of
cardiovascular disease. Today, there are �25 000 cardiologists
in the United States performing �1 million coronary
angiograms
yearly, and �720 000 cardiovascular surgeries are performed
an-
nually (4). Cardiovascular disease is currently the major cause
of
death in the United States, accounting for 37% of all deaths, and
is
considered a contributing factor in an additional 21% of the
popu-
lation (4). Similar increases in coronary artery disease and
cardio-
vascular mortality have also been observed in other countries
(20).
Some have argued that there is no cardiovascular epidemic,
because the absolute number of cardiovascular deaths in the
United States and the calculated rates per population are cur-
rently decreasing (4). It has also been stated that the increase in
hypertension simply reflects the increase in the aging
population,
because the average life span has increased from 47 y in 1900 to
77 y today (24). Furthermore, the increasing longevity of the
population has been used as an argument that the increase in
obesity may not be a disadvantage. However, these arguments
are lacking. First, the observed decline in cardiovascular mor-
tality rates is probably not due to a decrease in cardiovascular
disease, but rather to the fact that we have developed better
ways
to control cardiovascular disease after it has developed. Today,
we have antihypertensive agents, statins, antiplatelet drugs, and
a host of surgical and nonsurgical treatments for those with cor-
onary artery disease. Whereas it is true that an aging population
will likely mean higher rates of hypertension, we are now ob-
serving hypertension in adolescents that cannot be explained by
an aging population (13). Furthermore, in the 1939 study (10),
only 12–13% of 50- to 55-y-old men had hypertension (and only
1.6% had systolic blood pressures �140 mm Hg); today, age-
matched men have a hypertension frequency of 31%. Finally,
the
comment that obesity is an advantage because people are living
longer negates the fact that, in the general population, longevity
is greater in persons with a normal BMI than in those with a
high
BMI (25). It is more likely that increased longevity relates to
better hygiene, a reduction in malnutrition, the introduction of
antibiotics, and the increasing affluence of the world
population.
THE PARALLEL EPIDEMIC OF SUGAR
CONSUMPTION
Whereas today the intake of foods containing table sugar (su-
crose) occurs with almost every meal, the introduction of sugar
into the diet is relatively recent. Before the introduction of
sugar,
the primary sweetener had been honey, but because it was rela-
tively rare and not mass produced, the majority of people (espe-
cially the poorer classes) had no sweeteners at all in their
normal
diet (26).
Sugar derived from sugar cane was first developed in New
Guinea and in the Indian subcontinent and was a rare and
expen-
sive commodity that was introduced into Europe via Venice,
Italy, and other trading ports during the Middle Ages. During
this
time, only royalty or the very wealthy could afford this luxury.
However, by the late 1400s, Spain and Portugal began growing
sugar cane in the Canary Islands, in Madeira, and in Silo Tome;
this led to such wealth that King Emmanuel I of Portugal, “the
900 JOHNSON ET AL
a
t C
A
L
IF
O
R
N
IA
S
T
A
T
E
U
N
IV
E
R
S
IT
Y
N
O
R
T
H
R
ID
G
E
o
n
N
o
ve
m
b
e
r 1
7
, 2
0
1
6
a
jcn
.n
u
tritio
n
.o
rg
D
o
w
n
lo
a
d
e
d
fro
m
http://ajcn.nutrition.org/
Fortunate” (1469 –1521), sent life-sized sugar effigies of the
Cardinals and the Pope to the Vatican in 1513 as a gift (27).
The discovery of the New World provided a mechanism for
expanding sugar production. Christopher Columbus brought
sugar
cane to Santo Domingo on the island of Hispaniola (which is
now
Haiti and the Dominican Republic) on his second voyage in
1493;
shortly thereafter, sugar plantations were established in the
Carib-
bean islands, in the Guiana coasts, in Brazil, and eventually in
the
southern United States. Although initially an attempt was made
to
use Native Americans to work the plantations, a Catholic priest,
Bartholomew de las Casas, requested King Ferdinand of Spain
for
the protection of the local Taino Indians because of the large
num-
bers who had been killed or who were dying from smallpox or
other
diseases. So, in 1505, the first ship of African slaves departed
for
America to work the plantations. The next three and a half
centuries
witnessed the infamous “Triangle Trade,” in which ships would
sail
to Africa, loaded with manufactured goods such as brass,
copper,
lead, salt, and gunpowder, which would be used to purchase
slaves
who were then shipped across the famed “Middle Passage” to
the
sugar plantations in the Caribbean and southern states. It is
estimated
that between 10 and 20 million Africans were brought to
America
during this period.
Whereas initially Portugal and Spain were the major importers
of sugar, the capture of the Spanish settlement of Kingston,
Jamaica, by the English in 1655 resulted in much of the sugar
being exported to England. Sugar was such a desirable commod-
ity that England began to hoard the sugar for its own people.
Whereas in 1660, England exported 67% of its sugar to the rest
of Europe, by 1753, this dropped to 5.5% (28). The increase in
sugar production resulted in its increased availability to the
pub-
lic. Before the introduction of sugar, the primary diet was car-
bohydrate based, but it was primarily starch, consisting of a diet
rich in barley, wheat, oats, and rye. Sugar had been used
primarily
as a costly medicinal. However, with the increased availability
of
sugar, it could also be used to sweeten chocolates, teas, and
cakes.
The average per capita sugar intake in England was 4 lb (1.8 kg)
in 1700 and 18 lb (8.1 kg) in 1800, and it increased even more
after the prime minister, William Gladstone, removed the sugar
tax in 1874, which led to a mean consumption of 100 lb (45 kg)
in 1950 (29; Figure 1).
The blockade of sugar importation to Europe by the British
navy after 1700 caused a shortage of sugar to these countries.
As
a consequence, techniques were developed to extract sugar from
beets, and by the beginning of the 18th century, a thriving sugar
beet industry was developing in Germany, France, and Austria.
The combined production of sugar from sugar cane and beets
led
to a marked increase in world sugar production, from 250 000
tons in 1800 to 8 million tons in 1900 (33).
Sugar consumption continued to increase in the 1900s, with an
overall doubling in the United States and the United Kingdom
between 1900 and 1967 (34). By 1993, �110 million tons of
sugar were produced worldwide (33). Whereas sugar intake con-
tinues to be marked in the industrialized nations, it is in the
developing countries that the greatest increase in the rates of
sugar consumption has been observed (35 ). By the early 1970s,
an additional sweetener, high-fructose corn syrup (HFCS), was
introduced in the United States, which had certain advantages
over table sugar with relation to shelf life and cost. This sweet-
ener, the composition of which is similar to that of sucrose, is
used extensively to sweeten soft drinks, fruit punches, pastries,
and processed foods. The combination of table sugar and HFCS
has resulted in an additional 30% increase in overall sweetener
intake over the past 40 y, mostly in soft drinks. Currently, con-
sumption of these sweeteners is almost 150 lb (67.6 kg) per
person per year (36), which has resulted in the ingestion of
�500
kcal/d (37; Figure 1).
ARE THESE EPIDEMICS RELATED?
Keys (38) is credited with the discovery of an association of
Western diets with the development of coronary artery disease.
Keys focused on the relative increase in fat intake with a
decrease
in total carbohydrate intake, and this general finding (“nutrition
transition”) has been confirmed in numerous studies, which has
led to the widespread recognition of the importance of fat intake
in the development of heart disease. However, Yudkin (39)
showed in the early 1960s that the Western diets high in fat are
also high in sugar, and he proposed that sugar intake may also
play an underlying role in the cardiovascular epidemic. In addi-
tion, recent history in the United States has shown that,
although
a low-fat intake has been promoted, rates of obesity have con-
tinued to increase as sugar consumption has continued. In addi-
tion, recent studies showing that a low-carbohydrate, high-fat
diet has no adverse cardiovascular effects (40, 41) suggest that
it
is time to revisit the causes of the cardiorenal disease epidemic.
In 2002, Havel’s group (37) made the case that the fructose
content of sugar may be the critical component associated with
the risks of obesity and heart disease. Sucrose is a disaccharide
consisting of 50% fructose and 50% glucose, and HFCS is also a
mixture of free fructose and glucose of approximately the same
proportion (55:45).
There are some striking epidemiologic associations between
sugar intake and the epidemic of cardiorenal disease. For exam-
ple, obesity was initially seen primarily in the wealthy, who
would have been the only ones able to afford sugar. Also, the
first
documentation of hypertension, diabetes, and obesity occurred
in the very countries (England, France, and Germany) where
sugar first became available to the public. The rise in sugar
intake
in the United Kingdom and the United States (Figure 1) also
correlates with the rise in obesity rates observed in these coun-
tries. Furthermore, the later introduction of sugar to developing
countries also correlates with the later rise in their rates of
obesity
and heart disease. A series of epidemiologic studies linked the
FIGURE 1. Sugar intake per capita in the United Kingdom from
1700 to
1978 (30, 31; E) and in the United States from 1975 to 2000
(32; �) is
compared with obesity rates in the United States in non-
Hispanic white men
aged 60 – 69 y (17; F). Values for 1880-1910 are based on
studies conducted
in male Civil War veterans aged 50 –59 y (18).
SUGAR AND THE CARDIORENAL DISEASE EPIDEMIC 901
a
t C
A
L
IF
O
R
N
IA
S
T
A
T
E
U
N
IV
E
R
S
IT
Y
N
O
R
T
H
R
ID
G
E
o
n
N
o
ve
m
b
e
r 1
7
, 2
0
1
6
a
jcn
.n
u
tritio
n
.o
rg
D
o
w
n
lo
a
d
e
d
fro
m
http://ajcn.nutrition.org/
ingestion of soft drinks to obesity, hypertension, and diabetes
(42, 43) and the consumption of fruit juice and fruit punch to
obesity in children (44, 45). Although these epidemiologic as-
sociations suggest a potential causal role, are there any direct
experimental data to show that sucrose or fructose can induce
obesity or hypertension?
SUGAR (FRUCTOSE) STUDIES IN HUMANS AND
EXPERIMENTAL ANIMAL MODELS
Clinical studies have confirmed that sucrose (and particularly
fructose) can induce weight gain and features of the metabolic
syndrome. For example, serum triacylglycerols increased in
young men receiving a diet supplemented with 200 g sucrose/d,
whereas concentrations did not increase when starch was the
primary carbohydrate (46). Hyperinsulinemia developed in one-
third of these subjects (30). In another study, the administration
of sucrose supplements resulted in weight gain, a significant
rise
in serum triacylglycerols, and a rise in systolic blood pressure
(47). An increase in blood pressure was also observed in healthy
adults fed a diet of 33% sucrose for 6 wk but not when diets of
5%
or 18% sucrose were fed (48). Others have also reported that
diets
enriched in either sucrose (49) or fructose (50) cause impaired
glucose tolerance and insulin resistance. Notably, most of these
diets provided fructose in the range of 400 – 800 kcal/d, which
is
within the upper range of what is currently being ingested in the
United States.
Rodents also develop features of the metabolic syndrome after
ingesting sucrose. As in humans, it was shown that the active
ingredient is fructose rather than glucose: feeding fructose to
rats
resulted in the metabolic syndrome, whereas equivalent amounts
of glucose or starch did not induce these features (51). In
addition
to the metabolic syndrome, the administration of fructose re-
sulted in the development of renal hypertrophy, afferent arterio-
lar thickening, glomerular hypertension, and cortical vasocon-
striction (52). Furthermore, feeding fructose to rats with chronic
renal disease (rats that have had five-sixths of their renal mass
removed) resulted in an increased progression of the disease, as
evidenced by worsening proteinuria, renal function, and glomer-
ulosclerosis (53). Worsening of renal function was not observed
in rat pairs fed dextrose (53).
It has been argued that the fructose studies in rodents should
not be compared with human studies because the doses of fruc-
tose administered to rodents are not physiologic, inasmuch as
they usually account for 60-70% of the diet. However, we re-
cently found that lower doses of fructose (10% given in the
water,
resulting in one-half of the caloric intake, compared with the
classic 60% fructose diet) can also induce hypertension and
renal
microvascular changes, although they are less severe (52).
MECHANISMS FOR FRUCTOSE-INDUCED
METABOLIC SYNDROME
Fructose may cause obesity via several different mechanisms.
First, Havel’s group (54) conducted a clinical study that found
that fructose may not cause the level of satiety equivalent to
that
of a glucose-based meal. Specifically, the differences in the ef-
fect of fructose and glucose consumption (consumed as bever-
ages with 3 meals) on ad libitum food intake and hunger rating
were observed on the day after the exposure to the sweetened
beverages. The mechanism was related to the inability of
fructose
to acutely stimulate insulin and leptin and to inhibit ghrelin, all
factors that are known to affect the satiety center in the central
nervous system. Yudkin (34) also argued that the sweetness of
fructose (or sucrose) often makes food more palatable, and, in-
deed, the food industry has capitalized on this by frequently
adding HFCS or sugar to normally nonsweetened foods (such as
crackers) to enhance the taste. This may stimulate more food
intake. Furthermore, mice fed fructose-sweetened water gain
more weight than do mice given the same calories as starch,
which suggests that fructose may also slow the basal metabolic
rate (55 ).
One unique aspect of fructose is that it is the only sugar that
raises uric acid concentrations, and this can be shown in both
humans (56) and rodents (57). Fructose enters hepatocytes and
other cells (including tubular cells, adipocytes, and intestinal
epithelial cells), where it is completely metabolized by fructoki-
nase with the consumption of ATP; unlike in glucose metabo-
lism, there is no negative regulatory mechanism to prevent the
depletion of ATP. As a consequence, lactic acid and uric acid
are generated in the process, and uric acid concentrations may
rise by 1– 4 mg/dL after the ingestion of a large fructose-based
meal (58).
Although the rise in uric acid concentrations has historically
been viewed as simply a potential risk factor for inducing gout,
recent studies suggest that this may be a key mechanism to
explain how fructose causes cardiovascular disease. In addition,
it also provides a mechanism to explain why rodents are rela-
tively resistant to the effects of fructose (see below).
FRUCTOSE-INDUCED HYPERURICEMIA AS A
MECHANISM FOR CARDIORENAL DISEASE
Nakagawa et al (51) recently showed in experimental animals
that lowering uric acid concentrations could largely prevent fea-
tures of the metabolic syndrome induced by fructose, including
weight gain, hypertriacylglycerolemia, hyperinsulinemia and in-
sulin resistance, and hypertension. The protective effect of low-
ering uric acid concentrations on the development of the meta-
bolic syndrome was shown regardless of whether the uric acid
concentrations were lowered by using a xanthine oxidase inhib-
itor or a uricosuric agent (51).
These studies were surprising, because most authorities had
considered uric acid to be either biologically inert or an
important
antioxidant in the plasma (59). However, uric acid was found to
have numerous deleterious biologic functions. For example, uric
acid stimulates both vascular smooth muscle cell proliferation
and the release of chemotactic and inflammatory substances
(60 – 62), induces monocyte chemotaxis (63), inhibits endothe-
lial cell proliferation and migration (64, 65), and causes
oxidative
stress in adipocytes, which results in the impaired secretion of
adiponectin (66).
In animals, the effect of elevated uric acid concentrations is
even more pronounced. For example, mildly hyperuricemic rats
develop hypertension because of the inhibition of nitric oxide
synthase in the macula densa, the stimulation of intrarenal
renin,
and a reduction in endothelial nitric oxide bioavailability (67).
Over
time, hyperuricemic rats develop renal arteriosclerosis that then
causes the animals to develop a salt-sensitive form of
hypertension
(62). Hyperuricemic rats also develop slowly progressive renal
dis-
ease with renal vasoconstriction and glomerular hypertension
(68).
902 JOHNSON ET AL
a
t C
A
L
IF
O
R
N
IA
S
T
A
T
E
U
N
IV
E
R
S
IT
Y
N
O
R
T
H
R
ID
G
E
o
n
N
o
ve
m
b
e
r 1
7
, 2
0
1
6
a
jcn
.n
u
tritio
n
.o
rg
D
o
w
n
lo
a
d
e
d
fro
m
http://ajcn.nutrition.org/
An increase in uric acid in animals with preexistent renal
disease
accelerates the progression of the disease (69).
Whereas human diseases such as obesity, renal disease, and
cardiovascular diseases likely have complex and multifactorial
origins, recent studies have suggested that uric acid is an inde-
pendent risk factor for these diseases. Uric acid has now been
found to be an independent predictor of hypertension in 15 of
16
published studies, including a recent report by the Framingham
Heart Study group (70 – 85). Uric acid is also an independent
predictor of obesity (86), hyperinsulinemia (87), and renal dis-
ease (88). Furthermore, uric acid concentrations are elevated in
the vast majority (89%) of adolescents with new-onset hyper-
tension, and in pilot studies, the lowering of uric acid
concentra-
tions was found to reduce blood pressure in these subjects (89,
90). A recent prospective, controlled trial also reported that the
lowering of uric acid concentrations in patients with hyperuri-
cemia and renal disease resulted in significantly slower renal
progression and a significant (13 mm Hg) fall in systolic blood
pressure that was not observed in the controls (91). Whereas
more clinical studies are clearly needed, these data suggest that
uric acid may contribute to the cardiorenal disease epidemic.
The mechanism by which uric acid causes these effects may
involve a reduction in the concentrations of endothelial nitric
oxide. Uric acid potently reduces the concentrations of endothe-
lial nitric oxide in vitro and in vivo in experimental animals
(64,
65). Hyperuricemia in humans is also strongly associated with
endothelial dysfunction (92, 93), and lowering uric acid concen-
trations has consistently been shown to improve endothelial
function after several weeks (94 –98). In turn, a reduction in
endothelial nitric oxide predisposes animals to develop features
of the metabolic syndrome. For example, genetically modified
mice that lack endothelial nitric oxide synthase develop many
features of metabolic syndrome, including hypertension, hyper-
triacylglycerolemia, and insulin resistance (99).
Several potential mechanisms may explain how an impaired
production of endothelial nitric oxide results in features of the
metabolic syndrome. For example, a reduction in nitric oxide
results in systemic and intrarenal vasoconstriction, renal micro-
vascular disease, and systemic hypertension (100). Endothelial
nitric oxide is also critical in mediating the increase in blood
flow
to the skeletal muscle in response to insulin, and blocking nitric
oxide can result in higher blood insulin concentrations and pe-
ripheral insulin resistance (101). In turn, insulin stimulates the
secretion of hepatic triacylglycerol (102).
It should be noted that obesity itself can also induce insulin
resistance, in part by the intracellular accumulation of triacyl-
glycerols (102). Once renal arteriosclerosis develops, hyperten-
sion also becomes salt sensitive and renal dependent (103). Fi-
nally, the progressive loss of renal function and mass will result
in intrarenal hemodynamic changes that favor a continued de-
cline in renal function (104). Hence, fructose- and uric acid–
associated mechanisms are likely to be of more importance in
the
initial development of the metabolic syndrome phenotype and
may become less important once obesity, hypertension, and
renal
disease become established.
WHY ARE AFRICAN AMERICANS SUSCEPTIBLE TO
CARDIOVASCULAR DISEASE?
It is well known that African Americans have higher rates of
obesity, hypertension, diabetes, kidney disease, and heart
disease
(105). This increased rate of cardiorenal disease contrasts with
a
near absence of hypertension and obesity in studies performed
in
the early 20th century in blacks living in Africa (106, 107). It is
interesting to speculate that African Americans may also have
been exposed quite early to sugar. Early workers cut and
bundled
the sugar cane in the fields, pressed the cane in the local mills
to
get the sugary extract, and boiled this extract in the sugar
houses
to generate the sugar crystals and leftover molasses. Molasses
(which is sucrose) was a staple in the early African American
diet, and one wonders whether it may have played a role in the
increased frequency of hypertension that was noted in early ep-
idemiologic studies performed in the Caribbean and in
Louisiana
(108, 109). Recent studies also have documented that the sugar
intake of African Americans is greater than that of whites (110,
111). Similar high sugar intakes were noted in studies of Aus-
tralian Aborigines and Samoans living in New Zealand (112,
113). Furthermore, it is known that African Americans have
higher concentrations of uric acid (114); in the African
American
Study of Hypertension and Kidney Disease, the average uric
acid
concentration was 8.3 mg/dL (115).
Other explanations are also possible, including the preferential
survival during the early years of slavery of subjects with
higher
blood pressures, salt sensitivity, obesity and insulin resistance,
and better wound healing (116). Indeed, African Americans with
hypertension and renal disease have been found to have a higher
frequency of a polymorphism for transforming growth factor-�
(TGF-�) and elevated serum TGF-� concentrations (117).
TGF-� is a cytokine important in wound healing and was re-
cently shown to have a role in blood pressure (118). An increase
in TGF-� could also explain the rapid progression of microvas-
cular injury and renal disease characteristic of African Ameri-
cans (119) and, by inducing microvascular disease, could also
have a role in the induction of salt sensitivity (103).
A congenital mechanism has also been proposed. African
Americans have a higher frequency of low-birth-weight infants,
which has been linked to a low nephron number (120). In turn, a
low nephron number is associated with the later development of
hypertension, diabetes, and obesity (121). Interestingly, low-
birth-weight infants are known to develop early hyperuricemia
and endothelial dysfunction (122). Indeed, evidence that uric
acid may have a role in this condition is mounting (123).
Finally, an environmental mechanism also seems likely. Af-
rican Americans may be under more societal stress owing to
lower socioeconomic conditions (124). They also have diets
higher in sodium and lower in potassium (125).
CAVEATS
A key difficulty in proving that sugars play a participatory role
in the epidemic of cardiorenal disease is separating the effect of
fat intake and the effect of sugar intake. That is, survival for
thousands of years was based on our ability to store triacylglyc-
erol for survival during times when food was scarce. Since the
industrial revolution, food has been plentiful, and obesity has
increased because of the innate nature to store triacylglycerols
in
the face of excessive caloric intake. However, whereas an in-
creased intake of calories as fat can cause obesity and obesity
can
lead to insulin resistance, it is our hypothesis that only sugars
can
directly lead to insulin resistance. In addition, for the past 20 y,
there has been a push to lower fat intake, and the result of these
SUGAR AND THE CARDIORENAL DISEASE EPIDEMIC 903
a
t C
A
L
IF
O
R
N
IA
S
T
A
T
E
U
N
IV
E
R
S
IT
Y
N
O
R
T
H
R
ID
G
E
o
n
N
o
ve
m
b
e
r 1
7
, 2
0
1
6
a
jcn
.n
u
tritio
n
.o
rg
D
o
w
n
lo
a
d
e
d
fro
m
http://ajcn.nutrition.org/
programs has been a marked increase in the prevalence of obe-
sity. Interestingly, during this period, the level of fructose
intake
increased considerably.
Another difficulty in showing causation in human studies of
the effect of fructose on the incidence of cardiorenal disease,
independent of obesity, is that obesity and fructose intake track
together. Thus, whereas animal studies have shown a causal
effect of fructose on cardiorenal markers, independent of
obesity,
causation cannot be shown in human studies.
CONCLUSION
In conclusion, we propose that sugar intake, and particularly
that of fructose, may have an important participatory role in the
current cardiorenal disease epidemic and may also explain why
certain subgroups, such as African Americans, are particularly
prone to disease. This pathway may well be mediated, in part,
by
the unique ability of fructose to raise uric acid. This may also
explain why rodents are relatively resistant to fructose, because
these animals have lower uric acid concentrations owing to the
presence of an enzyme (uricase) that degrades uric acid to allan-
toin. Indeed, when uricase is inhibited in the rat, fructose will
cause a 5-fold greater increase in uric acid concentrations (57).
The observation that uric acid may play a key role in the
process suggests that other mechanisms that raise uric acid con-
centrations may also play a role in the epidemic. In this regard,
17th and 18th century England is also famous for the enormous
importation of fortified wines such as port and Madeira rich in
sugar and lead (126). Lead can also cause hyperuricemia and
hypertension. We have been able to block lead-induced hyper-
tension by lowering uric acid concentrations (126). This would
suggest that a low level of lead ingestion may act as an
additional
synergistic factor, particularly during the early part of the epi-
demic. Uric acid concentrations have increased within the gen-
eral population in parallel with the epidemic of cardiorenal dis-
ease (8, 127).
If the hypothesis is correct that fructose has a role in the
epidemic of cardiovascular disease, then a number of
predictions
should arise from future studies. First, fructose intake will be a
risk factor for hypertension, insulin resistance,
hypertriacylglyc-
erolemia, obesity, type 2 diabetes, preeclampsia, chronic kidney
disease, stroke, cardiovascular disease, and mortality. Second,
reducing uric acid in patients with uric acid concentrations �6.0
mg/dL will improve endothelial dysfunction, decrease systemic
vascular resistance, lower blood pressure, lower triacylglycerol
concentrations, improve body weight, lower the risk of the pro-
gression of renal disease, and reduce cardiovascular disease
risk.
Third, low-fructose diets coupled with mild purine restriction
will improve weight and reduce cardiovascular disease risk.
Fourth, fructokinase will be identified as a key enzyme
mediating
the cardiorenal disease syndrome; genetic polymorphisms will
be associated with cardiovascular disease risk, and blocking the
enzyme will provide a novel way to prevent cardiorenal disease.
Clearly, much more work needs to be done to prove or disprove
this hypothesis.
The authors’ responsibilities were as follows—RJJ, MSS, and
LGS-L:
primary preparation of the manuscript; and YS, TN, DIF, D-HK,
MSG, and
SB: generation of ideas incorporated into this manuscript and
the final ap-
proval of the manuscript. RJJ is a consultant for Nephromics
Inc. None of the
other authors had a conflict of interest.
REFERENCES
1. Foster GD, Wyatt HR, Hill JO, et al. A randomized trial of a
low-
carbohydrate diet for obesity. N Engl J Med 2003;348:2082–90.
2. Chobanian AV, Bakris GL, Black HR, et al. The Seventh
Report of the
Joint National Committee on Prevention, Detection, Evaluation,
and
Treatment of High Blood Pressure: the JNC 7 report. JAMA
2003;289:
2560 –72.
3. Alderman MH, Cohen H, Madhavan S, Kivlighn S. Serum
uric acid and
cardiovascular events in successfully treated hypertensive
patients.
Hypertension 1999;34:144 –50.
4. Heart disease and stroke statistics—2006 update. A report
from the
American Heart Association Statistics Committee and Stroke
Statistics
Subcommittee. Circulation 2006;113:e85.
5. US Renal Data System. USRDS 2004 annual data report: atlas
of
end-stage renal disease in the United States. Bethesda, MD:
National
Institutes of Health, National Institute of Diabetes and
Digestive and
Kidney Diseases, 2004.
6. Coresh J, Astor BC, Greene T, Eknoyan G, Levey AS.
Prevalence of
chronic kidney disease and decreased kidney function in the
adult US
population: Third National Health and Nutrition Examination
Survey.
Am J Kidney Dis 2003;41:1–12.
7. Ruggenenti P, Perna A, Gherardi G, et al. Renoprotective
properties of
ACE-inhibition in non-diabetic nephropathies with non-
nephrotic pro-
teinuria. Lancet 1999;354:359 – 64.
8. Johnson RJ, Titte S, Cade JR, Rideout BA, Oliver WJ. Uric
acid,
evolution and primitive cultures. Semin Nephrol 2005;25:3– 8.
9. Symonds B. The blood pressure of healthy men and women.
JAMA
1923;80:232– 6.
10. Robinson SC, Brucer M. Range of normal blood pressure. A
statistical
and clinical study of 11,383 persons. Arch Int Med 1939;64:409
– 44.
11. Taylor J. The hypertension detection and follow-up
program: a
progress report. Circ Res 1977;40(suppl):I106 –9.
12. Burt VL, Whelton P, Roccella EJ, et al. Prevalence of
hypertension in
the US adult population. Results from the Third National Health
and
Nutrition Examination Survey, 1988 –1991. Hypertension
1995;25:
305–13.
13. Fields LE, Burt VL, Cutler JA, Hughes J, Roccella EJ,
Sorlie P. The
burden of adult hypertension in the United States 1999 to 2000:
a rising
tide. Hypertension 2004;44:398 – 404.
14. Huchard H. Arteriolosclerosis: including its cardiac form.
JAMA 1909;
53:1129 –32.
15. Mahomed FA. On chronic Bright’s disease, and its essential
symptoms.
Lancet 1879;1:398 – 404.
16. Traube L. Uber den Zusammenhang von Herz-und
Nierenkrankheiten.
(The overriding connection between heart and kidney diseases.)
Berlin,
Germany: August Hirschwald, 1856 (in German).
17. Helmchen LA, Henderson RM. Changes in the distribution
of body
mass index of white US men, 1890 –2000. Ann Hum Biol
2004;31:
174 – 81.
18. Flegal KM, Troiano RP. Changes in the distribution of body
mass index
of adults and children in the US population. Int J Obes Relat
Metab
Disord 2000;24:807–18.
19. Osler W. The principles and practice of medicine. New
York, NY: D
Appleton, 1893.
20. Yusuf S, Reddy S, Ounpuu S, Anand S. Global burden of
cardiovas-
cular diseases: part I: general considerations, the epidemiologic
tran-
sition, risk factors, and impact of urbanization. Circulation
2001;104:
2746 –53.
21. US Renal Data System. USRDS 2006 annual data report:
atlas of
end-stage renal disease in the United States. Bethesda, MD:
National
Institute of Diabetes and Digestive and Kidney Diseases, 2006.
22. Hood P. A treatise on gout, rheumatism and the allied
affections. Lon-
don, United Kingdom: J and A Churchill, 1871.
23. Platt R. Coronary disease and modern stress. Lancet
1951;1:51.
24. Steiner H, Kispal G, Zollner A, Haid A, Neupert W, Lill R.
Heme
binding to a conserved Cys-Pro-Val motif is crucial for the
catalytic
function of mitochondrial heme lyases. J Biol Chem
1996;271:32605–
11.
25. Clinical guidelines on the identification, evaluation, and
treatment of
overweight and obesity in adults—The Evidence Report.
National In-
stitutes of Health. Obes Res 1998;6(suppl):51S–209S.
26. Revel JF. Culture and cuisine. New York, NY: Doubleday,
1982.
27. Galloway JH. The sugar cane industry. Cambridge, United
Kingdom:
Cambridge University Press, 1989.
904 JOHNSON ET AL
a
t C
A
L
IF
O
R
N
IA
S
T
A
T
E
U
N
IV
E
R
S
IT
Y
N
O
R
T
H
R
ID
G
E
o
n
N
o
ve
m
b
e
r 1
7
, 2
0
1
6
a
jcn
.n
u
tritio
n
.o
rg
D
o
w
n
lo
a
d
e
d
fro
m
http://ajcn.nutrition.org/
28. Sheridan RB. Sugar and slavery. Baltimore, MD: The Johns
Hopkins
University Press, 1973.
29. Deer N. The history of sugar. London, United Kingdom:
Chapman and
Hall, 1949-50.
30. Yudkin J. Sugar and disease. Nature 1972;239:197–9.
31. Deerr N. The history of sugar. London, United Kingdom:
Chapman and
Hall, 1950.
32. Hallfrisch J. Metabolic effects of dietary fructose. FASEB J
1990;4:
2652– 60.
33. Mintz SW. Sweetness and power: the place of sugar in
modern history.
New York, NY: Penguin Books, 1986.
34. Yudkin J. Evolutionary and historical changes in dietary
carbohydrates.
Am J Clin Nutr 1967;20:108 –15.
35. Jabara C, Valdes A. World sugar policies and developing
countries. In:
Marks SV, Maskus KE, eds. The economics and politics of
world sugar
policies. Ann Arbor, MI: The University of Michigan Press,
1993.
36. US Census Bureau. Statistical abstract of the United States.
2003;no
214.
37. Elliott SS, Keim NL, Stern JS, Teff K, Havel PJ. Fructose,
weight gain,
and the insulin resistance syndrome. Am J Clin Nutr
2002;76:911–22.
38. Keys A. Atherosclerosis: a problem in newer public health.
J Mt Sinai
Hosp N Y 1953;20:118 –39.
39. Yudkin J. Patterns and trends in carbohydrate consumption
and their
relation to disease. Proc Nutr Soc 1964;23:149 – 62.
40. Wood RJ, Fernandez ML, Sharman MJ, et al. Effects of a
carbohydrate-
restricted diet with and without supplemental soluble fiber on
plasma
low-density lipoprotein cholesterol and other clinical markers of
car-
diovascular risk. Metabolism 2007;56:58 – 67.
41. Sharman MJ, Gomez AL, Kraemer WJ, Volek JS. Very low-
carbohydrate and low-fat diets affect fasting lipids and
postprandial
lipemia differently in overweight men. J Nutr 2004;134:880 –5.
42. Bray GA, Nielsen SJ, Popkin BM. Consumption of high-
fructose corn
syrup in beverages may play a role in the epidemic of obesity.
Am J Clin
Nutr 2004;79:537– 43.
43. Schulze MB, Manson JE, Ludwig DS, et al. Sugar-
sweetened bever-
ages, weight gain, and incidence of type 2 diabetes in young and
middle-aged women. JAMA 2004;292:927–34.
44. Dennison BA, Rockwell HL, Baker SL. Excess fruit juice
consumption
by preschool-aged children is associated with short stature and
obesity.
Pediatrics 1997;99:15–22.
45. Ludwig DS, Peterson KE, Gortmaker SL. Relation between
consump-
tion of sugar-sweetened drinks and childhood obesity: a
prospective,
observational analysis. Lancet 2001;357:505– 8.
46. Akinyanju PA, Qureshi RU, Salter AJ, Yudkin J. Effect of
an “athero-
genic” diet containing starch or sucrose on the blood lipids of
young
men. Nature 1968;218:975–7.
47. Raben A, Vasilaras TH, Moller AC, Astrup A. Sucrose
compared with
artificial sweeteners: different effects on ad libitum food intake
and
body weight after 10 wk of supplementation in overweight
subjects.
Am J Clin Nutr 2002;76:721–9.
48. Israel KD, Michaelis OEt, Reiser S, Keeney M. Serum uric
acid, inor-
ganic phosphorus, and glutamic-oxalacetic transaminase and
blood
pressure in carbohydrate-sensitive adults consuming three
different
levels of sucrose. Ann Nutr Metab 1983;27:425–35.
49. Cohen AM, Teitelbaum A, Balogh M, Groen JJ. Effect of
interchanging
bread and sucrose as main source of carbohydrate in a low fat
diet on the
glucose tolerance curve of healthy volunteer subjects. Am J
Clin Nutr
1966;19:59 – 62.
50. Faeh D, Minehira K, Schwarz JM, Periasamy R, Park S,
Tappy L. Effect
of fructose overfeeding and fish oil administration on hepatic de
novo
lipogenesis and insulin sensitivity in healthy men. Diabetes
2005;54:
1907–13.
51. Nakagawa T, Hu H, Zharikov S, et al. A causal role for uric
acid in
fructose-induced metabolic syndrome. Am J Physiol Renal
Physiol
2006;290:F625–31.
52. Sanchez-Lozada LG, Tapia E, Jimenez A, et al. Fructose-
induced met-
abolic syndrome is associated with glomerular hypertension and
renal
microvascular damage in rats. Am J Physiol Renal Physiol
2007;292:
F423–9.
53. Gersch MS, Mu W, Cirillo P, et al. Fructose but not
dextrose accelerates
the progression of chronic kidney diesase. Am J Physiol Renal
Physiol
2007 Aug 1 (Epub ahead of print;
DOI:10.1152/ajprenal.00181.2007).
54. Teff KL, Elliott SS, Tschop M, et al. Dietary fructose
reduces circu-
lating insulin and leptin, attenuates postprandial suppression of
ghrelin,
and increases triglycerides in women. J Clin Endocrinol Metab
2004;
89:2963–72.
55. Jurgens H, Haass W, Castaneda TR, et al. Consuming
fructose-
sweetened beverages increases body adiposity in mice. Obes
Res 2005;
13:1146 –56.
56. Stirpe F, Della Corte E, Bonetti E, Abbondanza A, Abbati
A, De
Stefano F. Fructose-induced hyperuricaemia. Lancet
1970;2:1310 –1.
57. Stavric B, Johnson WJ, Clayman S, Gadd RE, Chartrand A.
Effect of
fructose administration on serum urate levels in the uricase
inhibited
rat. Experientia 1976;32:373– 4.
58. Perheentupa J, Raivio K. Fructose-induced hyperuricaemia.
Lancet
1967;2:528 –31.
59. Ames BN, Cathcart R, Schwiers E, Hochstein P. Uric acid
provides an
antioxidant defense in humans against oxidant- and radical-
caused
aging and cancer: a hypothesis. Proc Natl Acad Sci U S A
1981;78:
6858 – 62.
60. Mazzali M, Kanellis J, Han L, et al. Hyperuricemia induces
a primary
renal arteriolopathy in rats by a blood pressure-independent
mecha-
nism. Am J Physiol Renal Physiol 2002;282:F991–7.
61. Rao GN, Corson MA, Berk BC. Uric acid stimulates
vascular smooth
muscle cell proliferation by increasing platelet-derived growth
factor
A-chain expression. J Biol Chem 1991;266:8604 – 8.
62. Watanabe S, Kang DH, Feng L, et al. Uric acid, hominoid
evolution,
and the pathogenesis of salt-sensitivity. Hypertension
2002;40:355–
60.
63. Zare F, Magnusson M, Bergstrom T, et al. Uric acid, a
nucleic acid
degradation product, down-regulates dsRNA-triggered arthritis.
J Leu-
koc Biol 2006;79:482– 8.
64. Kang DH, Park SK, Lee IK, Johnson RJ. Uric acid-induced
C-reactive
protein expression: implication on cell proliferation and nitric
oxide
production of human vascular cells. J Am Soc Nephrol
2005;16:3553–
62.
65. Khosla UM, Zharikov S, Finch JL, et al. Hyperuricemia
induces endo-
thelial dysfunction. Kidney Int 2005;67:1739 – 42.
66. Sautin Y, Nakagawa T, Zharikov S, Johnson RJ. Adverse
effects of the
classic antioxidant uric acid in adipocytes: NADPH oxidase-
mediated
oxidative/nitrosative stress. Am J Physiol Cell Physiol
2007;293:
C584 –96.
67. Mazzali M, Hughes J, Kim YG, et al. Elevated uric acid
increases blood
pressure in the rat by a novel crystal-independent mechanism.
Hyper-
tension 2001;38:1101– 6.
68. Sanchez-Lozada LG, Tapia E, Avila-Casado C, et al. Mild
hyperuri-
cemia induces glomerular hypertension in normal rats. Am J
Physiol
Renal Physiol 2002;283:F1105–10.
69. Kang DH, Nakagawa T, Feng L, et al. A role for uric acid in
the
progression of renal disease. J Am Soc Nephrol 2002;13:2888 –
97.
70. Alper AB Jr, Chen W, Yau L, Srinivasan SR, Berenson GS,
Hamm LL.
Childhood uric acid predicts adult blood pressure: the Bogalusa
Heart
Study. Hypertension 2005;45:34 – 8.
71. Hunt SC, Stephenson SH, Hopkins PN, Williams RR.
Predictors of an
increased risk of future hypertension in Utah. A screening
analysis.
Hypertension 1991;17:969 –76.
72. Imazu M, Yamamoto H, Toyofuku M, et al.
Hyperinsulinemia for the
development of hypertension: data from the Hawaii-Los
Angeles-
Hiroshima Study. Hypertens Res 2001;24:531– 6.
73. Jossa F, Farinaro E, Panico S, et al. Serum uric acid and
hypertension:
the Olivetti heart study. J Hum Hypertens 1994;8:677– 81.
74. Masuo K, Kawaguchi H, Mikami H, Ogihara T, Tuck ML.
Serum uric
acid and plasma norepinephrine concentrations predict
subsequent
weight gain and blood pressure elevation. Hypertension
2003;42:474 –
80.
75. Nagahama K, Inoue T, Iseki K, et al Hyperuricemia as a
predictor of
hypertension in a screened cohort in Okinawa, Japan. Hypertens
Res
2004;27:835– 41.
76. Nakanishi N, Okamoto M, Yoshida H, Matsuo Y, Suzuki K,
Tatara K.
Serum uric acid and risk for development of hypertension and
impaired
fasting glucose or type II diabetes in Japanese male office
workers.
2003;18:523–30.
77. Selby JV, Friedman GD, Quesenberry CP Jr. Precursors of
essential
hypertension: pulmonary function, heart rate, uric acid, serum
choles-
terol, and other serum chemistries. Am J 1990;131:1017–27.
78. Sundstrom J, Sullivan L, D’Agostino RB, Levy D, Kannel
WB, Vasan
RS. Relations of serum uric acid to longitudinal blood pressure
tracking
and hypertension incidence. Hypertension 2005;45:28 –33.
SUGAR AND THE CARDIORENAL DISEASE EPIDEMIC 905
a
t C
A
L
IF
O
R
N
IA
S
T
A
T
E
U
N
IV
E
R
S
IT
Y
N
O
R
T
H
R
ID
G
E
o
n
N
o
ve
m
b
e
r 1
7
, 2
0
1
6
a
jcn
.n
u
tritio
n
.o
rg
D
o
w
n
lo
a
d
e
d
fro
m
http://ajcn.nutrition.org/
79. Taniguchi Y, Hayashi T, Tsumura K, Endo G, Fujii S,
Okada K. Serum
uric acid and the risk for hypertension and type 2 diabetes in
Japanese
men: the Osaka Health Survey. J Hypertens 2001;19:1209 –15.
80. Perlstein T, Gumieniak O, Williams G, et al. Uric acid and
the devel-
opment of hypertension: the Normative Aging Study.
Hypertension
2006;48:1031– 6.
81. Mellen PB, Bleyer AJ, Erlinger TP, et al. Serum uric acid
predicts
incident hypertension in a biethnic cohort: the Atherosclerosis
Risk in
Communities study. Hypertension 2006;48:1037– 42.
82. Dyer AR, Liu K, Walsh M, Kiefe C, Jacobs DR Jr, Bild DE.
Ten-year
incidence of elevated blood pressure and its predictors: the
CARDIA
study. Coronary Artery Risk Development in (Young) Adults. J
Hum
Hypertens 1999;13:13–21.
83. Shankar A, Klein R, Klein BE, Nieto FJ. The association
between
serum uric acid level and long-term incidence of hypertension:
population-based cohort study. J Hum Hypertens 2006;20:937–
45.
84. Krishnan E, Kwoh CK, Schumacher HR, Kuller L.
Hyperuricemia and
incidence of hypertension among men without metabolic
syndrome.
Hypertension 2007;49:298 –303.
85. Forman JP, Choi H, Curhan GC. Plasma uric acid level and
risk for
incident hypertension among men. J Am Soc Nephrol
2007;18:287–92.
86. Masuo K, Kawaguchi H, Mikami H, Ogihara T, Tuck ML.
Serum uric
acid and plasma norepinephrine concentrations predict
subsequent
weight gain and blood pressure elevation. Hypertension
2003;42:474 –
80.
87. Ford ES, Li C, Cook S, Choi HK. Serum concentrations of
uric acid and
the metabolic syndrome among US children and adolescents.
Circula-
tion 2007;115:2526 –32.
88. Iseki K, Oshiro S, Tozawa M, Iseki C, Ikemiya Y, Takishita
S. Signif-
icance of hyperuricemia on the early detection of renal failure
in a
cohort of screened subjects. Hypertens Res 2001;24:691–7.
89. Feig DI, Johnson RJ. Hyperuricemia in childhood primary
hyperten-
sion. Hypertension 2003;42:247–52.
90. Feig DI, Nakagawa T, Karumanchi SA, et al. Hypothesis:
uric acid,
nephron number, and the pathogenesis of essential hypertension.
Kid-
ney Int 2004;66:281–7.
91. Siu YP, Leung KT, Tong MK, Kwan TH. Use of allopurinol
in slowing
the progression of renal disease through its ability to lower
serum uric
acid level. Am J Kidney Dis 2006;47:51–9.
92. Erdogan D, Gullu H, Caliskan M, et al. Relationship of
serum uric acid
to measures of endothelial function and atherosclerosis in
healthy
adults. Int J Clin Pract 2005;59:1276 – 82.
93. Zoccali C, Maio R, Mallamaci F, Sesti G, Perticone F. Uric
acid and
endothelial dysfunction in essential hypertension. J Am Soc
Nephrol
2006;17:1466 –71.
94. Butler R, Morris AD, Belch JJ, Hill A, Struthers AD.
Allopurinol
normalizes endothelial dysfunction in type 2 diabetics with mild
hy-
pertension. Hypertension 2000;35:746 –51.
95. Doehner W, Schoene N, Rauchhaus M, et al. Effects of
xanthine oxi-
dase inhibition with allopurinol on endothelial function and
peripheral
blood flow in hyperuricemic patients with chronic heart failure:
results
from 2 placebo-controlled studies. Circulation 2002;105:2619 –
24.
96. Farquharson CA, Butler R, Hill A, Belch JJ, Struthers AD.
Allopurinol
improves endothelial dysfunction in chronic heart failure.
Circulation
2002;106:221– 6.
97. Guthikonda S, Sinkey C, Barenz T, Haynes WG. Xanthine
oxidase
inhibition reverses endothelial dysfunction in heavy smokers.
Circula-
tion 2003;107:416 –21.
98. Mercuro G, Vitale C, Cerquetani E, et al. Effect of
hyperuricemia upon
endothelial function in patients at increased cardiovascular risk.
Am J
Cardiol 2004;94:932–5.
99. Cook S, Hugli O, Egli M, et al. Clustering of cardiovascular
risk factors
mimicking the human metabolic syndrome X in eNOS null mice.
Swiss
Med Wkly 2003;133:360 –3.
100. Quiroz Y, Pons H, Gordon KL, et al. Mycophenolate
mofetil prevents
salt-sensitive hypertension resulting from nitric oxide synthesis
inhi-
bition. Am J Physiol Renal Physiol 2001;281:F38 – 47.
101. Roy D, Perreault M, Marette A. Insulin stimulation of
glucose uptake
in skeletal muscles and adipose tissues in vivo is NO dependent.
Am J
Physiol 1998;274:E692–9.
102. Zammit VA, Waterman IJ, Topping D, McKay G. Insulin
stimulation
of hepatic triacylglycerol secretion and the etiology of insulin
resis-
tance. J Nutr 2001;131:2074 –7.
103. Johnson RJ, Herrera-Acosta J, Schreiner GF, Rodriguez-
Iturbe B. Sub-
tle acquired renal injury as a mechanism of salt-sensitive
hypertension.
N Engl J Med 2002;346:913–23.
104. Klahr S, Schreiner G, Ichikawa I. The progression of renal
disease.
N Engl J Med 1988;318:1657– 66.
105. Dreeben O. Health status of African Americans. J Health
Soc Policy
2001;14:1–17.
106. Donnison C. Blood pressure in the African native. Lancet
1929;1:6 –7.
107. Williams A. The blood pressure of Africans. East Afr Med
J 1941;18:
109 –17.
108. Adams J. Some racial differences in blood pressure and
morbidity in a
group of white and colored workers. Am J Med Sci
1930;184:342–50.
109. Saunders G, Bancroft H. Blood pressure in African
Americans. Nutr
Rev 1942;23:410 –23.
110. Dresser C. Food consumption profiles of white and black
persons aged
1-74 years: United States 1971-1974 Vital and Health Statistics
Series
11, no 210. Hyattsville, MD: National Center for Health
Statistics,
1979.
111. Kerr GR, Amante P, Decker M, Callen PW. Supermarket
sales of
high-sugar products in predominantly black, Hispanic, and
white cen-
sus tracts of Houston, TX. Am J Clin Nutr 1983;37:622–31.
112. Bell AC, Swinburn BA, Amosa H, Scragg R, Sharpe SJ.
The impact of
modernisation on the diets of adults aged 20 – 40 years from
Samoan
church communities in Auckland. Asia Pac J Public Health
1999;11:
4 –9.
113. Lee AJ, O’Dea K, Mathews JD. Apparent dietary intake in
remote
aboriginal communities. Aust J Public Health 1994;18:190 –7.
114. Fang J, Alderman MH. Serum uric acid and cardiovascular
mortality
the NHANES I epidemiologic follow-up study, 1971–1992.
National
Health and Nutrition Examination Survey. JAMA
2000;283:2404 –10.
115. Norris KC, Greene T, Kopple J, et al. Baseline predictors
of renal
disease progression in the African American Study of
Hypertension
and Kidney Disease. J Am Soc Nephrol 2006;17:2928 –36.
116. Wilson TW, Grim CE. Biohistory of slavery and blood
pressure dif-
ferences in blacks today. A hypothesis. Hypertension
1991;17(suppl):
I122– 8.
117. Suthanthiran M, Li B, Song JO, et al. Transforming growth
factor-beta
1 hyperexpression in African-American hypertensives: a novel
medi-
ator of hypertension and/or target organ damage. Proc Natl
Acad Sci U
S A 2000;97:3479 – 84.
118. Zacchigna L, Vecchione C, Notte A, et al. Emilin1 links
TGF-beta
maturation to blood pressure homeostasis. Cell 2006;124:929 –
42.
119. Fogo A, Breyer JA, Smith MC, et al. Accuracy of the
diagnosis of
hypertensive nephrosclerosis in African Americans: a report
from the
African American Study of Kidney Disease (AASK) Trial.
AASK Pilot
Study Investigators. Kidney Int 1997;51:244 –52.
120. Zandi-Nejad K, Luyckx VA, Brenner BM. Adult
hypertension and
kidney disease: the role of fetal programming. Hypertension
2006;47:
502– 8.
121. Barker DJ, Osmond C, Golding J, Kuh D, Wadsworth ME.
Growth in
utero, blood pressure in childhood and adult life, and mortality
from
cardiovascular disease. BMJ 1989;298:564 –7.
122. Franco MC, Christofalo DM, Sawaya AL, Ajzen SA, Sesso
R. Effects
of low birth weight in 8- to 13-year-old children: implications
in en-
dothelial function and uric acid levels. Hypertension
2006;48:45–50.
123. Feig DI, Rodriguez-Iturbe B, Nakagawa T, Johnson RJ.
Nephron num-
ber, uric acid, and renal microvascular disease in the
pathogenesis of
essential hypertension. Hypertension 2006;48:25– 6.
124. Dressler WW. Hypertension in the African American
community: so-
cial, cultural, and psychological factors. Semin Nephrol
1996;16:71–
82.
125. Tucker K. Dietary patterns and blood pressure in African
Americans.
Nutr Rev 1999;57:356 – 8.
126. Ball GV. Two epidemics of gout. Bull Hist Med
1971;45:401– 8.
127. Roncal C, Mu W, Reungjui S, et al. Lead, at low levels,
accelerates
arteriolopathy and tubulointerstitial injury in chronic kidney
disease.
Am J Physiol Renal Physiol 2007 Aug 22 (Epub ahead of print;
DOI:
10.1152/ajprenal.00216.2007).
906 JOHNSON ET AL
a
t C
A
L
IF
O
R
N
IA
S
T
A
T
E
U
N
IV
E
R
S
IT
Y
N
O
R
T
H
R
ID
G
E
o
n
N
o
ve
m
b
e
r 1
7
, 2
0
1
6
a
jcn
.n
u
tritio
n
.o
rg
D
o
w
n
lo
a
d
e
d
fro
m
http://ajcn.nutrition.org/
Commentary
Consumption of high-fructose corn syrup in beverages may play
a
role in the epidemic of obesity1,2
George A Bray, Samara Joy Nielsen, and Barry M Popkin
ABSTRACT
Obesity is a major epidemic, but its causes are still unclear. In
this
article, we investigate the relation between the intake of high-
fructose corn syrup (HFCS) and the development of obesity. We
analyzed food consumption patterns by using US Department of
Agriculture food consumption tables from 1967 to 2000. The
con-
sumption of HFCS increased � 1000% between 1970 and 1990,
far
exceeding the changes in intake of any other food or food
group.
HFCS now represents � 40% of caloric sweeteners added to
foods
and beverages and is the sole caloric sweetener in soft drinks in
the
United States. Our most conservative estimate of the
consumption of
HFCS indicates a daily average of 132 kcal for all Americans
aged
� 2 y, and the top 20% of consumers of caloric sweeteners
ingest
316 kcal from HFCS/d. The increased use of HFCS in the
United States
mirrors the rapid increase in obesity. The digestion, absorption,
and
metabolism of fructose differ from those of glucose. Hepatic
metabo-
lism of fructose favors de novo lipogenesis. In addition, unlike
glucose,
fructose does not stimulate insulin secretion or enhance leptin
produc-
tion. Because insulin and leptin act as key afferent signals in
the regu-
lation of food intake and body weight, this suggests that dietary
fructose
may contribute to increased energy intake and weight gain.
Further-
more, calorically sweetened beverages may enhance caloric
overcon-
sumption. Thus, the increase in consumption of HFCS has a
temporal
relation to the epidemic of obesity, and the overconsumption of
HFCS
in calorically sweetened beverages may play a role in the
epidemic of
obesity. Am J Clin Nutr 2004;79:537– 43.
KEY WORDS Epidemiology, food intake, obesity, artificial
sweeteners, fructose
INTRODUCTION
As obesity has escalated to epidemic proportions around the
world, many causes, including dietary components, have been
suggested. Excessive caloric intake has been related to high-fat
foods, increased portion sizes, and diets high both in simple
sugars such as sucrose and in high-fructose corn syrup (HFCS)
as
a source of fructose (1–3). In this article, we discuss the
evidence
that a marked increase in the use of HFCS, and therefore in total
fructose consumption, preceded the obesity epidemic and may
be
an important contributor to this epidemic in the United States.
To provide a common frame of reference for the terms used in
this paper, the following definitions should be understood.
Sugar
is any free monosaccharide or disaccharide present in a food.
Sugars includes at least one sugar; composite sugars refers to
the
aggregate of all forms of sugars in a food and is thus
distinguish-
able from specific types of sugar, such as fructose, glucose, or
sucrose. Added sugar is sugar added to a food and includes
sweeteners such as sucrose, HFCS, honey, molasses, and other
syrups. Naturally occurring sugar is sugar occurring in food and
not added in processing, preparation, or at the table. Total
sugars
represents the total amount of sugars present in a food and in-
cludes both naturally occurring and added sugars. Free fructose
is fructose that exists in food as the monosaccharide. Fructose
refers to both the free and bound forms of fructose (4).
Added sweeteners are important components of our diet, rep-
resenting 318 kcal of dietary intake for the average American
aged � 2 y, or 16% of all caloric intake as measured by a na-
tionally representative survey in 1994 –1996 (5). Sweet corn-
based syrups were developed during the past 3 decades and now
represent close to one-half of the caloric sweeteners consumed
by
Americans (6, 7). HFCS made by enzymatic isomerization of
glucose to fructose was introduced as HFCS-42 (42% fructose)
and HFCS-55 (55% fructose) in 1967 and 1977, respectively,
and
opened a new frontier for the sweetener and soft drink
industries.
Using a glucose isomerase, the starch in corn can be efficiently
converted to glucose and then to various amounts of fructose.
The
hydrolysis of sucrose produces a 50:50 molar mixture of
fructose
and glucose. The development of these inexpensive, sweet corn-
based syrups made it profitable to replace sucrose (sugar) and
simple sugars with HFCS in our diet, and they now represent
40%
of all added caloric sweeteners (8). Fructose is sweeter than
sucrose. In comparative studies of sweetness, in which the
sweet-
ness of sucrose was set at 100, fructose had a sweetness of 173
and glucose had a sweetness of 74 (9). If the values noted above
are applied, HFCS-42 would be 1.16 times as sweet as sucrose,
and HFCS-55 would be 1.28 times as sweet as sucrose. This
contrasts with the estimates reported by Hanover and White
(10).
In their study, the sweetness of sucrose was set at 100 as in
reference 8. Fructose, however, had a sweetness of only 117,
whereas a 50:50 mixture of fructose and sucrose had a
sweetness
of 128. It is difficult to see why fructose and sucrose combined
would be sweeter than either one alone and as sweet as HFCS-
55.
On the basis of data in Agriculture Handbook no. 8 from the US
Department of Agriculture (USDA) (11), a cola beverage in
1963
1 From the Pennington Biomedical Research Center, Louisiana
State Uni-
versity, Baton Rouge, LA (GAB), and the Department of
Nutrition, Univer-
sity of North Carolina, Chapel Hill (SJN and BMP).
2 Reprints not available. Address correspondence to GA Bray,
Pennington
Biomedical Research Center, 6400 Perkins Road, Baton Rouge,
LA 70808.
E-mail: [email protected]
Received October 3, 2003.
Accepted for publication December 15, 2003.
537Am J Clin Nutr 2004;79:537– 43. Printed in USA. © 2004
American Society for Clinical Nutrition
a
t C
A
L
IF
O
R
N
IA
S
T
A
T
E
U
N
IV
E
R
S
IT
Y
N
O
R
T
H
R
ID
G
E
o
n
N
o
ve
m
b
e
r 1
7
, 2
0
1
6
a
jcn
.n
u
tritio
n
.o
rg
D
o
w
n
lo
a
d
e
d
fro
m
http://ajcn.nutrition.org/
had 39 kcal/100 g, whereas a cola beverage in 2003 had 41 kcal/
100 g. Because the number of calories per 100 g has not
changed
substantially over the past 40 y, current beverages are probably
sweeter, depending on the temperature at which they are served.
HFCS has become a favorite substitute for sucrose in carbon-
ated beverages, baked goods, canned fruits, jams and jellies,
and
dairy products (10). The major user of HFCS in the world is the
United States; however, HFCS is now manufactured and used in
many countries throughout the world (7). In the United States,
HFCS is the major source of caloric sweeteners in soft drinks
and
many other sweetened beverages and is also included in numer-
ous other foods; therefore, HFCS constitutes a major source of
dietary fructose. Few data are available on foods containing
HFCS in countries other than the United States (7).
THE BIOLOGY
Absorption of fructose
The digestive and absorptive processes for glucose and fruc-
tose are different. When disaccharides such as sucrose or
maltose
enter the intestine, they are cleaved by disaccharidases. A
sodium-
glucose cotransporter absorbs the glucose that is formed from
cleav-
age of sucrose. Fructose, in contrast, is absorbed further down
in the
duodenum and jejunum by a non-sodium-dependent process.
After
absorption, glucose and fructose enter the portal circulation and
either are transported to the liver, where the fructose can be
taken up
and converted to glucose, or pass into the general circulation.
The
addition of small, catalytic amounts of fructose to orally
ingested
glucose increases hepatic glycogen synthesis in human subjects
and
reduces glycemic responses in subjects with type 2 diabetes
mellitus
(12), which suggests the importance of fructose in modulating
me-
tabolism in the liver. However, when large amounts of fructose
are
ingested, they provide a relatively unregulated source of carbon
precursors for hepatic lipogenesis.
Fructose and insulin release
Along with 2 peptides, glucose-dependent insulinotropic
polypeptide and glucagon-like peptide-1 released from the gas-
trointestinal tract, circulating glucose increases insulin release
from the pancreas (13, 14). Fructose does not stimulate insulin
secretion in vitro, probably because the � cells of the pancreas
lack the fructose transporter Glut-5 (15, 16). Thus, when
fructose
is given in vivo as part of a mixed meal, the increase in glucose
and insulin is much smaller than when a similar amount of glu-
cose is given. However, fructose produces a much larger
increase
in lactate and a small (1.7%) increase in diet-induced thermo-
genesis (17), which again suggests that glucose and fructose
have
different metabolic effects.
Insulin and leptin
Insulin release can modulate food intake by at least 2 mecha-
nisms. First, Schwartz et al (18) have argued that insulin con-
centrations in the central nervous system have a direct
inhibitory
effect on food intake. In addition, insulin may modify food
intake
by its effect on leptin secretion, which is mainly regulated by
insulin-induced changes in glucose metabolism in fat cells (19,
20). Insulin increases leptin release (21) with a time delay of
several hours. Thus, a low insulin concentration after ingestion
of
fructose would be associated with lower average leptin concen-
trations than would be seen after ingestion of glucose. Because
leptin inhibits food intake, the lower leptin concentrations
induced
by fructose would tend to enhance food intake. This is most
dramat-
ically illustrated in humans who lack leptin (22, 23). Persons
lacking
leptin (homozygotes) are massively obese (22), and
heterozygotes
with low but detectable serum leptin concentrations have
increased
adiposity (23), which indicates that low leptin concentrations
are
associated with increased hunger and gains in body fat.
Adminis-
tration of leptin to persons who lack it produces a dramatic
decrease
in food intake, as expected. Leptin also increases energy
expendi-
ture, and during reduced calorie intake, leptin attenuates the de-
creases in thyroid hormones and 24-h energy expenditure (24).
To
the extent that fructose increases in the diet, one might expect
less
insulin secretion and thus less leptin release and a reduction in
the
inhibitory effect of leptin on food intake, ie, an increase in food
intake. This was found in the preliminary studies reported by
Teff et
al (25). Consumption of high-fructose meals reduced 24-h
plasma
insulin and leptin concentrations and increased postprandial
fasting
triacylglycerol concentrations in women but did not suppress
circu-
lating ghrelin concentrations.
Fructose and metabolism
The metabolism of fructose differs from that of glucose in
several other ways as well (3). Glucose enters cells by a
transport
mechanism (Glut-4) that is insulin dependent in most tissues.
Insulin activates the insulin receptor, which in turn increases
the
density of glucose transporters on the cell surface and thus
facilitates
the entry of glucose. Once inside the cell, glucose is
phosphorylated
by glucokinase to become glucose-6-phosphate, from which the
intracellular metabolism of glucose begins. Intracellular
enzymes
can tightly control conversion of glucose-6-phosphate to the
glyc-
erol backbone of triacylglycerols through modulation by
phospho-
fructokinase. In contrast with glucose, fructose enters cells via
a
Glut-5 transporter that does not depend on insulin. This
transporter
is absent from pancreatic � cells and the brain, which indicates
limited entry of fructose into these tissues. Glucose provides
“sati-
ety” signals to the brain that fructose cannot provide because it
is not
transported into the brain. Once inside the cell, fructose is
phosphor-
ylated to form fructose-1-phosphate (26). In this configuration,
fruc-
tose is readily cleaved by aldolase to form trioses that are the
back-
bone for phospholipid and triacyglycerol synthesis. Fructose
also
provides carbon atoms for synthesis of long-chain fatty acids,
al-
though in humans, the quantity of these carbon atoms is small.
Thus,
fructose facilitates the biochemical formation of
triacylglycerols
more efficiently than does glucose (3). For example, when a
diet
containing 17% fructose was provided to healthy men and
women,
the men, but not the women, showed a highly significant
increase of
32% in plasma triacylglycerol concentrations (27).
Overconsumption of sweetened beverages
One model for producing obesity in rodents is to provide sweet-
ened (sucrose, maltose, etc) beverages for them to drink (28). In
this
setting, the desire for the calorically sweetened solution reduces
the
intake of solid food, but not by enough to prevent a positive
caloric
balance and the slow development of obesity. Adding the same
amount of sucrose or maltose as of a solid in the diet does not
produce the same response. Thus, in experimental animals,
sweet-
ened beverages appear to enhance caloric consumption.
Fructose and soft drinks
A similar argument about the role of overconsumption of
calorically sweetened beverages may apply to humans (29 –32).
538 BRAY ET AL
a
t C
A
L
IF
O
R
N
IA
S
T
A
T
E
U
N
IV
E
R
S
IT
Y
N
O
R
T
H
R
ID
G
E
o
n
N
o
ve
m
b
e
r 1
7
, 2
0
1
6
a
jcn
.n
u
tritio
n
.o
rg
D
o
w
n
lo
a
d
e
d
fro
m
http://ajcn.nutrition.org/
Mattes (29) reported that when humans ingest energy-containing
beverages, energy compensation is less precise than when solid
foods are ingested. In another study in humans, DiMeglio and
Mattes (30) found that when 15 healthy men and women were
given a carbohydrate load of 1880 kJ/d (450 kcal/d) as a calori-
cally sweetened soda for 4 wk, they gained significantly more
weight than when the same carbohydrate load was given in a
solid
form as jelly beans. Additional support for our hypothesis that
calorically sweetened beverages may contribute to the epidemic
of obesity comes from a longitudinal study in adolescents. Lud-
wig et al (31) showed that in adolescents participating in the
Planet Health project, the quantity of sugar-sweetened
beverages
ingested predicted initial body mass index (BMI; in kg/m2) and
gain in BMI during the follow-up period. Raben et al (32) de-
signed a randomized, double-blind study to compare the effect
of
calorically sweetened beverages with that of diet drinks on
weight gain in moderately overweight men and women. This
European study found that drinking calorically sweetened bev-
erages resulted in greater weight gain over the 10-wk study than
did drinking diet drinks. Compared with the subjects who con-
sumed diet drinks, those who consumed calorically sweetened
beverages did not compensate for this consumption by reducing
the intake of other beverages and foods and thus gained weight.
The beverages in this study were sweetened with sucrose,
whereas in the United States almost all calorically sweetened
beverages are sweetened with HFCS. Thus, we need a second
randomized controlled study that compares sucrose- and HFCS-
sweetened beverages. This could establish whether the form of
the caloric sweetener played a role in the weight gain observed
in
the study by Raben et al (32).
The results of the studies by Raben et al (32) and Ludwig et al
(31) suggest that the rapid increase in the intake of calorically
sweetened soft drinks could be a contributing factor to the epi-
demic of weight gain. Between 1970, when HFCS was intro-
duced into the marketplace, and 2000, the per capita
consumption
of HFCS in the United States increased from 0.292 kg ·
person�1
· y�1 (0.6 lb · person�1 · y�1) to 33.4 kg · person�1 · y�1
(73.5 lb
· person�1 · y�1), an increase of � 100-fold (8) (Table 1). The
total consumption of fructose increased nearly 30%. The con-
sumption of free fructose showed a greater increase, which re-
flected the increasing use of HFCS (Figure 1). During the same
interval, the consumption of sucrose decreased nearly 50%, and
TABLE 1
Availability of high-fructose corn syrup (HFCS) in the US
caloric sweetener supply1
Year HFCS Total caloric sweeteners
HFCS as percentage of total
caloric sweeteners
Percentage of HFCS
from HFCS-42
Percentage of HFCS from
HFCS-55
g � person�1 � d�1 g � person�1 � d�1 % % %
1966 0.0 165.9 0.0 — —
1970 0.8 175.1 0.4 100.0 0.0
1975 7.1 168.8 4.2 100.0 0.0
1980 27.3 176.0 15.5 71.2 28.8
1985 64.7 184.4 35.1 34.3 65.7
1990 71.0 195.7 36.3 41.0 59.0
1995 82.3 211.7 38.9 39.9 60.1
2000 91.6 218.0 42.0 38.8 61.2
1 Data from reference 8. HFCS-42 and HFCS-55, HFCS
containing 42% and 55% fructose, respectively.
FIGURE 1. Estimated intakes of total fructose (F), free fructose
(Œ), and high-fructose corn syrup (HFCS, �) in relation to
trends in the prevalence of
overweight (■) and obesity (x) in the United States. Data from
references 7 and 35.
HIGH-FRUCTOSE CORN SYRUP AND OBESITY 539
a
t C
A
L
IF
O
R
N
IA
S
T
A
T
E
U
N
IV
E
R
S
IT
Y
N
O
R
T
H
R
ID
G
E
o
n
N
o
ve
m
b
e
r 1
7
, 2
0
1
6
a
jcn
.n
u
tritio
n
.o
rg
D
o
w
n
lo
a
d
e
d
fro
m
http://ajcn.nutrition.org/
the intakes of sucrose and HFCS are now nearly identical. Al-
though this shift has clearly led to a major increase in free-
fructose consumption, it is unclear how much of the increase in
consumption of calorically sweetened soft drinks is a result of
the
shift to beverages in which one-half of the fructose is free
rather
than bound with glucose as in sucrose. A recent review
described
many facets of this issue (3).
HFCS USE AND INTAKE
Availability of HFCS in the food supply
In 1970 HFCS represented � 1% of all caloric sweeteners
available for consumption in the United States, but the HFCS
portion of the caloric sweetener market jumped rapidly in the
1980s and by 2000 represented 42.0% of all caloric sweeteners
(Table 1) (8). HFCS-42 was initially the only HFCS component,
but by the early 1980s, HFCS-55 had become the major source
and constituted 61.2% of all HFCS in 2000. These data are
based
on per capita food disappearance data. In the absence of direct
measures of HFCS intake, these data provide the best indirect
measure of the HFCS available for consumption in the United
States. The data are useful for studying trends but probably
over-
estimate intake patterns. Although it is useful to understand that
HFCS intake represents more than two-fifths of the total intake
of
caloric sweeteners in the United States, it is also important to
recognize that the proportion of HFCS in some foods is much
higher than that in other foods.
Foods containing HFCS
In the United States, HFCS is found in almost all foods con-
taining caloric sweeteners. These include most soft drinks and
fruit drinks, candied fruits and canned fruits, dairy desserts and
flavored yogurts, most baked goods, many cereals, and jellies.
Over 60% of the calories in apple juice, which is used as the
base
for many of the fruit drinks, come from fructose, and thus apple
juice is another source of fructose in the diet. Lists of HFCS-
containing foods can be obtained from organizations concerned
with HFCS-related allergies (33). It is clear that almost all
caloric
sweeteners used by manufacturers of soft drinks and fruit drinks
are HFCS (4, 34). In fact, about two-thirds of all HFCS
consumed
in the United States are in beverages. Aside from beverages,
there
is no definitive literature on the proportion of caloric
sweeteners
that is HFCS in other processed foods. HFCS is found in most
processed foods; however, the exact compositions are not avail-
able from either the manufacturer or any publicly available
food-
composition table.
Trends in obesity and HFCS availability
There are important similarities between the trend in HFCS
availability and the trends in the prevalence of obesity in the
United States (Figure 1). Using age-standardized, nationally
rep-
resentative measures of obesity at 5 time points from 1960 to
1999
(35) and data on the availability of HFCS collected annually
over
this same period, we graphed both patterns. The data on obesity
are
from the National Center for Health Statistics for the following
periods: 1960 –1962 (National Health Examination Survey I),
1971–1975 [National Health and Nutrition Examination Survey
(NHANES)], 1976 –1980 (NHANES II), 1988 –1994 (NHANES
III), and 1999 (NHANES 1999 –2000) (35). The HFCS data are
those from Table 1. The prevalence of overweight (BMI of 25–
29.9)
and the prevalence of obesity (BMI � 30) were fit with fourth-
order
polynomial curves so that the limited number of data points
could be
fitted into a curve to capture the US trends. We also included
esti-
mates of free-fructose intake and total fructose intake. Total
fructose
is the sum of free fructose and fructose that is part of the
disaccharide
sucrose. Free fructose is the monosaccharide in HFCS and is
also
obtained in small amounts from other sources. Free-fructose
intake
closely follows the intake of HFCS. Total fructose intake
increased
nearly 30% between 1970 and 2000.
Estimated HFCS consumption
The intake of caloric sweeteners in the United States has in-
creased rapidly, and nationally representative data from 1994 to
1998 from the USDA allow us to estimate an intake of 318
kcal/d
for the average US resident aged � 2 y. This value is one-sixth
of the intake of all calories and close to one-third of the intake
of
all carbohydrates and represents a significant increase over the
past
2 decades (Table 2). As the intake of caloric sweeteners
increased,
so did the fructose load, which increased from 158.5 to 228 kcal
·
person�1 · d�1 between 1977–1978 (36) and 1994 –1998 (38,
39).
Furthermore, as shown in Table 2, the major increase in the
intake of caloric sweeteners from 1977 to 1998 came from the
intake of soft drinks and fruit drinks, and these intake values
were
105 and 31 kcal · person�1 · d�1, respectively, of the total
added
sugar intake of 318 kcal · person�1 · d�1 in 1994 –1998.
More-
over, more than one-half of the increased caloric sweetener in-
take during this time period came from the intake of these bev-
erages. The intakes of these 2 types of beverages and of desserts
total about two-thirds of all caloric sweetener intake in the
United
States today (Table 2).
We have no way to directly measure total HFCS use. However,
one Food and Drug Administration study used very conservative
methods to estimate HFCS use for the nationally representative
dietary intake sample from 1977 to 1978 from the USDA (35).
Using measures of the proportion of HFCS in each food, Glins-
mann et al (40) created food category–wide estimates of the
proportion of caloric sweeteners that is HFCS. We applied those
same proportions to a set of food groups to estimate the use of
caloric sweeteners not only during 1977–1978 but also during
later periods. Using our conversion technique applied to the
initial 1977–1978 Nationwide Food Consumption Survey data,
we obtained results that were only 4 kcal higher than the esti-
mates of Glinsmann et al (39). This approach is based on HFCS
composition in the early 1980s. With the use of the USDA value
of 4.2 g HFCS/tsp (0.84 g/mL), the availability of HFCS in the
food supply in the early 1980s was only one-half of the current
availability on a gram per capita basis (as shown in Table 1).
Thus, we feel confident that we can use this approach to provide
a conservative lower limit of HFCS intake.
In Table 2, the 2 columns at the right contain our estimates of
HFCS intake and total fructose intake. On the basis of the trend
in intakes, our estimate of HFCS intake for the most recent
period
of measurement from 1994 –1998 is 132 kcal · person�1 · d�1
(37). This represents a shift between 1977–1978 and 1994 –
1998
from 4.5% of total calories to 6.7% of total calories, or from
10.1% of carbohydrates to 13.1% of carbohydrates (41). The
estimate of total fructose intake, which was obtained from the
intakes of sucrose and HFCS, would be somewhat higher if
we knew the fructose content of the fruit drinks.
540 BRAY ET AL
a
t C
A
L
IF
O
R
N
IA
S
T
A
T
E
U
N
IV
E
R
S
IT
Y
N
O
R
T
H
R
ID
G
E
o
n
N
o
ve
m
b
e
r 1
7
, 2
0
1
6
a
jcn
.n
u
tritio
n
.o
rg
D
o
w
n
lo
a
d
e
d
fro
m
http://ajcn.nutrition.org/
Distribution of HFCS intake matters!
We also explored the distribution of HFCS consumption by
examining quintiles of caloric sweetener intake among Ameri-
cans aged � 2 y (Table 3). Most of the increase in caloric
sweetener intake from the middle quintile to the upper quintile
came from increases in the intake of calorically sweetened bev-
erages, particularly soft drinks. Consumers in the top quintile,
which represents 20% of all Americans, consume � 11% of
their
calories from HFCS. Again, remember that this is a very conser-
vative estimate. This same group obtains almost one-half of its
carbohydrates from caloric sweeteners and one-fifth of its car-
bohydrates from HFCS.
DISCUSSION
Genetic factors play an important role in the development of
obesity (42). However, the rapidity with which the current epi-
demic of obesity has descended on the United States (35) and
TABLE 2
Trends in intakes of added sugar (sucrose) and high-fructose
corn syrup (HFCS) by Americans aged � 2 y1
Soft drinks Fruit drinks Desserts
Total added
sugar
Estimated HFCS
intake2
Estimated total fructose
intake3
Intake (kcal � person�1 � d�1)
1977–1978 52 18 54 235 80 158.5
1989–1991 744 19 474 242 95 170
1994–1998 1054,5 314,5 604,5 3184,5 132 228
Percentage of total energy (%)
1977–1978 2.9 1.0 3.0 13.1 4.5 8.8
1989–1991 4.14 1.1 2.64 13.5 5.3 9.4
1994–1998 5.34,5 1.64,5 3.04,5 16.04,5 6.7 11.5
Percentage of total carbohydrates (%)
1977–1978 6.5 2.3 6.8 29.5 10.1 19.8
1989–1991 8.54 2.2 5.44 27.8 10.9 19.5
1994–1998 10.44,5 3.14,5 5.94,5 31.54,5 13.1 22.8
1 Data from references 36 –39.
2 Coefficients derived from Glinsmann et al (40) were used to
estimate HFCS intake.
3 Estimated as 50% of sucrose � fructose in HFCS.
4 Significantly different from 1977–1978, P � 0.01 (t test).
5 Significantly different from 1989 –1991, P � 0.01 (t test).
TABLE 3
Distribution of consumption of added caloric sweeteners and
high-fructose corn syrup (HFCS) by quintile (Q) of added sugar
intake in persons aged � 2 y
(1994 –1996, 1998)1
Q1 (n � 3907) Q2 (n � 4259) Q3 (n � 4228) Q4 (n � 3645) Q5
(n � 2988) Total (n � 19 027) P for trend
Added caloric sweeteners
Intake (kcal � person�1 � d�1)
Soft drinks 6 31 69 129 290 105 0.022
Fruit drinks 4 14 26 43 69 31 0.003
Total 69 169 263 388 703 318 0.001
Percentage of total energy in kcal (%)
Soft drinks 0.4 1.9 3.7 6.0 10.2 5.3 0.004
Fruit drinks 0.3 0.8 1.4 2.0 2.4 1.6 0.0001
Total 4.9 10.2 14.0 18.1 24.7 16.0 0.0004
Percentage of carbohydrates (%)
Soft drinks 0.9 3.8 7.3 11.6 18.8 10.4 0.003
Fruit drinks 0.6 1.7 2.8 3.9 4.5 3.1 0.0004
Total 10.5 20.8 27.9 35.0 45.6 31.4 0.0002
HFCS
Intake (kcal � person�1 � d�1)
Soft drinks 4 22 49 91 205 74 0.022
Fruit drinks 3 10 18 30 49 22 0.004
Total 21 58 103 166 316 132 0.012
Percentage of total energy in kcal (%)
Soft drinks 0.3 1.3 2.6 4.2 7.2 3.7 0.005
Fruit drinks 0.2 0.6 1.0 1.4 1.7 1.1 �0.0001
Total 1.5 3.5 5.5 7.7 11.1 6.7 0.0007
Percentage of carbohydrates (%)
Soft drinks 0.6 2.7 5.2 8.2 13.3 7.3 0.003
Fruit drinks 0.4 1.2 1.9 2.7 3.2 2.2 0.0002
Total 3.2 7.2 10.9 14.9 20.5 13.1 0.0002
1 Data from references 38 and 39 (weighted to be nationally
representative).
HIGH-FRUCTOSE CORN SYRUP AND OBESITY 541
a
t C
A
L
IF
O
R
N
IA
S
T
A
T
E
U
N
IV
E
R
S
IT
Y
N
O
R
T
H
R
ID
G
E
o
n
N
o
ve
m
b
e
r 1
7
, 2
0
1
6
a
jcn
.n
u
tritio
n
.o
rg
D
o
w
n
lo
a
d
e
d
fro
m
http://ajcn.nutrition.org/
many other countries (43) makes environmental factors the more
likely explanation. From a public health perspective, the key
question is whether there are modifiable environmental agents
that could have triggered this epidemic and that might be
altered.
Several environmental agents, including reduced levels of phys-
ical activity (44), a decrease in smoking, increased portion size
(2), eating outside the home and at fast-food restaurants, and
changes in the types of food that are ingested (45), have been
suggested. In this article, we propose that the introduction of
HFCS and the increased intakes of soft drinks and other sweet-
ened beverages have led to increases in total caloric and
fructose
consumption that are important contributors to the current epi-
demic of obesity.
In this article, we address an important potential hypothesis by
which HFCS may have an environmental link with the epidemic
of obesity. When total calorie intake is fixed, ie, if a person eats
the same amount of fructose, glucose, or sucrose in a metaboli-
cally controlled setting, the response should be the same, and
this
was shown by McDevitt et al (46). This situation is not one in
which differences in taste and portion size are allowed to
operate.
However, many biological factors that we noted in this article
suggest that calorically sweetened beverages are associated with
overconsumption when the sweetener is in a liquid form (29 –
32).
The collective data suggest that overconsumption of beverages
sweetened with HFCS and containing � 50% free fructose and
the increased intake of total fructose may play a role in the
epidemic of obesity. Whether HFCS used in solid food produces
the same overconsumption as it does in beverages is unknown,
but we suspect that if the HFCS was entirely in the solid form,
it
would not pose the same problem (30). Total fructose, both free
fructose and fructose combined in sucrose, in both beverages
and
solid food may be viewed as a precursor to fat because of the
ease
with which the carbon skeleton of fructose can form the back-
bone for triacylglycerols and be used for the synthesis of long-
chain fatty acids (25). Additional clinical trials are clearly
needed
to buttress the conclusions of Raben et al (32) that beverages
containing sugar caused more weight gain over 10 wk than did
diet beverages.
There is a distinct likelihood that the increased consumption of
HFCS in beverages may be linked to the increase in obesity.
One
US study showed that beverages sweetened with HFCS are
linked with increased energy intake and weight gain (31). Fur-
thermore, we showed that the increase in the use of HFCS was
concurrent with the increase in obesity rates in the United
States.
HFCS was introduced into the food supply just before 1970 and
increased rapidly to constitute � 40% of the sweeteners used by
2000 (8). The increase in HFCS consumption just preceded the
rapid increase in the prevalence of obesity that occurred
between
the National Center for Health Statistics survey in 1976 –1980
and the next survey in 1988 –1994 (35) (Figure 1).
HFCS is used in soft drinks, and HFCS and apple juice, which
has 65% fructose, are used as the principal sweeteners for fruit
drinks. The increasing consumption of calorically sweetened
soft
drinks has been associated with a decrease in the intake of milk
(5, 8, 47, 48). This relation adds another mechanism by which
HFCS consumption in beverages may be related to the epidemic
of obesity. Per capita calcium intake decreased from 890 to
860 mg/d between 1970 and 1981 but has increased slowly since
then (8). This was a mean 3% decrease that probably reflected a
much larger decrease in calcium intake at the upper ends of the
skewed distribution for intake. In US teenagers, total calcium
intake decreased by � 50 mg/d (� 10%) between 1977 and 1996
(49). A convincing set of epidemiologic and clinical studies
suggests that dairy products may have a favorable effect on
body
weight and insulin resistance in both children and adults (50 –
52).
During the interval from 1970 to 1990, the intake of whole milk
decreased 58%. However, the intake of cheese, which is high in
fat, increased and partially offset the decrease in calcium intake
from milk (8). Because milk is a major source of dietary
calcium
for most humans, this decrease in milk intake may play an im-
portant role in the decrease in calcium in the diet.
One possible public health option is to address the sweet taste
preference of humans by reducing HFCS and, if sweetness is
needed, relying on artificial sweeteners to make up any differ-
ence in sweetness. It is becoming increasingly clear that soft
drink consumption may be an important contributor to the epi-
demic of obesity, in part through the larger portion sizes of
these
beverages and through the increased intake of fructose from
HFCS and sucrose (53). If HFCS acts as an agent in the disease,
then reducing exposure to this agent may help to reduce the
epidemic (54).
Some will question our measures of HFCS intake and avail-
ability. Our very conservative estimate of HFCS use and the
Food
and Drug Administration data showed high HFCS intakes for a
large segment of the US population (39).
In conclusion, we believe that an argument can now be made
that the use of HFCS in beverages should be reduced and that
HFCS should be replaced with alternative noncaloric sweeten-
ers. Sweetness is a preferred taste as well as an acquired one
that
may be enhanced by exposure to sweet foods. The hypothesis
that
providing sodas and juice drinks in which caloric sweeteners are
partially or completely replaced with noncaloric sweeteners will
help reduce the prevalence of obesity is worth testing. If the
intake of calorically sweetened beverages is contributing to the
current epidemic, then reducing the availability of these bever-
ages by removing soda machines from schools would be a strat-
egy worth considering, as would reducing the portion sizes of
sodas that are commercially available (55).
We thank Dan Blanchette for programming assistance, Tom
Swasey for
graphics support, and Frances Dancy for support in
administrative matters.
We also thank Linda Adair for thoughtful comments on an early
version of
this article.
REFERENCES
1. Bray GA, Popkin BM. Dietary fat intake does affect obesity!
Am J Clin
Nutr 1998;68:1157–73.
2. Young LR, Nestle M. The contribution of expanding portion
sizes to the
US obesity epidemic. Am J Public Health 2002;92:246 –9.
3. Elliott SS, Keim NL, Stern JS, Teff K, Havel PJ. Fructose,
weight gain,
and the insulin resistance syndrome. Am J Clin Nutr
2002;76:911–22.
4. Smith SM. High fructose corn syrup replaces sugar in
processed food.
Environ Nutr 1998;11:7– 8.
5. Nielsen SJ, Siega-Riz AM, Popkin BM. Trends in energy
intake in U.S.
between 1977 and 1996: similar shifts seen across age groups.
Obes Res
2002;10:370 – 8.
6. Higley NA, White JS. Trends in fructose availability and
consumption in
the United States. Food Technol 1991;45:118 –22.
7. Vuilleumier S. Worldwide production of high-fructose syrup
and crys-
talline fructose. Am J Clin Nutr 1993;58(suppl):733S– 6S.
8. Putnam JJ, Allshouse JE. Food consumption, prices and
expenditures,
1970 –97. US Department of Agriculture Economic Research
Service
statistical bulletin no. 965, April 1999. Washington, DC: US
Govern-
ment Printing Office, 1999.
9. Krause MV, Mahan LK. Food, nutrition and diet therapy. 7th
ed. Phil-
adelphia: WB Saunders Company, 1984.
542 BRAY ET AL
a
t C
A
L
IF
O
R
N
IA
S
T
A
T
E
U
N
IV
E
R
S
IT
Y
N
O
R
T
H
R
ID
G
E
o
n
N
o
ve
m
b
e
r 1
7
, 2
0
1
6
a
jcn
.n
u
tritio
n
.o
rg
D
o
w
n
lo
a
d
e
d
fro
m
http://ajcn.nutrition.org/
10. Hanover LM, White JS. Manufacturing, composition, and
applications
of fructose. Am J Clin Nutr 1993;58(suppl):724S–32S.
11. Watt BK, Merrill AL. Composition of foods: raw, processed,
prepared.
Agriculture handbook no. 8. Washington, DC: US Government
Printing
Office, 1963.
12. Petersen KF, Laurent D, Yu C, Cline GW, Shulman GI.
Stimulating
effects of low-dose fructose on insulin-stimulated hepatic
glycogen syn-
thesis in humans. Diabetes 2001;50:1263– 8.
13. Edwards DM, Todd JF, Mahmoudi M, et al. Glucagon-like
peptide 1 has
a physiological role in the control of postprandial glucose in
humans:
studies with the antagonist exendin 9 –39. Diabetes 1999;48:86
–93.
14. Vilsboll T, Krarup T, Madsbad S, Holst JJ. Both GLP-1 and
GIP are
insulinotropic at basal and postprandial glucose levels and
contribute
nearly equally to the incretin effect of a meal in healthy
subjects. Regul
Pept 2003;114:115–21.
15. Curry DL. Effects of mannose and fructose on the synthesis
and secretion
of insulin. Pancreas 1989;4:2–9.
16. Sato Y, Ito T, Udaka U, et al. Immunohistochemical
localization of
facilitated-diffusion glucose transporters in rat pancreatic islets.
Tissue
Cell 1996;28:637– 43.
17. Schwarz J-M, Schutz Y, Froidevaux F, et al. Thermogenesis
in men and
women induced by fructose vs glucose added to a meal. Am J
Clin Nutr
1989;49:667–74.
18. Schwartz MW, Woods SC, Porte D Jr, Seeley RJ, Baskin
DG. Central
nervous system control of food intake. Nature 2000;404:661–71.
19. Muller WM, Gregoire FM, Stanhope KL, et al. Evidence
that glucose
metabolism regulated leptin secretion from cultured rat
adipocytes. En-
docrinology 1998;39:551– 8.
20. Havel PJ. Control of energy homeostasis and insulin action
by adipocyte
hormones: leptin, acylation stimulating protein, and
adiponectin. Curr
Opin Lipidol 2002;13:51–9.
21. Saad MF, Khan A, Sharma A, et al. Physiological
insulinemia acutely
modulated plasma leptin. Diabetes 1998;47:544 –9.
22. Farooqi IS, Matarese G, Lord GM, et al. Beneficial effects
of leptin on
obesity, T cell hyporesponsiveness, and
neuroendocrine/metabolic dys-
function of human congenital leptin deficiency. J Clin Invest
2002;110:
1093–1103.
23. Farooqi IS, Keogh JM, Kamath S, et al. Partial leptin
deficiency and
human adiposity. Nature 2001;414:34 –5.
24. Rosenbaum M, Murphy EM, Heymsfield SB, Matthews DE,
Leibel RL.
Low dose leptin administration reverses effects of sustained
weight-
reduction on energy expenditure and circulating concentrations
of thy-
roid hormones. J Clin Endocrinol Metab 2002;87:2391– 4.
25. Teff K, Elliot S, Tschoep MR, et al. Consuming high
fructose meals
reduces 24 hour plasma insulin and leptin concentrations, does
not sup-
press circulating ghrelin, and increases postprandial and fasting
triglyc-
erides in women. Diabetes 2002;52(suppl):A408(abstr).
26. Mayes PA. Intermediary metabolism of fructose. Am J Clin
Nutr 1993;
58(suppl):754S– 65S.
27. Bantle JP, Raatz SK, Thomas W, Georgopoulos A. Effects
of dietary
fructose on plasma lipids in healthy subjects. Am J Clin Nutr
2000;72:
1128 –34.
28. Sclafani A. Starch and sugar tastes in rodents: an update.
Brain Res Bull
1991;27:383– 6.
29. Mattes RD. Dietary compensation by humans for
Review ArticlePotential role of sugar (fructose) in the ep.docx

More Related Content

Similar to Review ArticlePotential role of sugar (fructose) in the ep.docx

CVD Egypt Clinical Diabetes Reprint Summer 2010
CVD Egypt Clinical Diabetes Reprint Summer 2010CVD Egypt Clinical Diabetes Reprint Summer 2010
CVD Egypt Clinical Diabetes Reprint Summer 2010Mahmoud IBRAHIM
 
Diabet med 2009_sep_26(9)_864-71[1]
Diabet med 2009_sep_26(9)_864-71[1]Diabet med 2009_sep_26(9)_864-71[1]
Diabet med 2009_sep_26(9)_864-71[1]Manuel F. Miyamoto
 
Features of cardiovascular system activity in various climatic & geographical...
Features of cardiovascular system activity in various climatic & geographical...Features of cardiovascular system activity in various climatic & geographical...
Features of cardiovascular system activity in various climatic & geographical...SanskarVirmani
 
FINAL Paper Research (2)
FINAL Paper Research (2)FINAL Paper Research (2)
FINAL Paper Research (2)Nadine Massaad
 
Evans_Diabetes_2016
Evans_Diabetes_2016Evans_Diabetes_2016
Evans_Diabetes_2016Joseph Evans
 
Dm & liver
Dm &  liverDm &  liver
Dm & liveralaa wafa
 
The effects of_the_mediterranean_diet_on_chronic_d
The effects of_the_mediterranean_diet_on_chronic_dThe effects of_the_mediterranean_diet_on_chronic_d
The effects of_the_mediterranean_diet_on_chronic_dArnon Ngoenyuang
 
Epid of ncd + htn
Epid of ncd + htnEpid of ncd + htn
Epid of ncd + htnRupam Kumar
 
Economic Forecasting - Semester Project
Economic Forecasting - Semester ProjectEconomic Forecasting - Semester Project
Economic Forecasting - Semester ProjectNicholas Rothrauff
 
MWEBAZA VICTOR RESEACH PROPOSAL 2022.doc
MWEBAZA VICTOR RESEACH PROPOSAL 2022.docMWEBAZA VICTOR RESEACH PROPOSAL 2022.doc
MWEBAZA VICTOR RESEACH PROPOSAL 2022.docDr. MWEBAZA VICTOR
 
Diabetes-related Clinical Complications: Novel Approaches for Diagnosis and M...
Diabetes-related Clinical Complications: Novel Approaches for Diagnosis and M...Diabetes-related Clinical Complications: Novel Approaches for Diagnosis and M...
Diabetes-related Clinical Complications: Novel Approaches for Diagnosis and M...asclepiuspdfs
 
Running Head Obesity, Healthy Diet and Health .docx
Running Head Obesity, Healthy Diet and Health                  .docxRunning Head Obesity, Healthy Diet and Health                  .docx
Running Head Obesity, Healthy Diet and Health .docxtodd581
 
Running Head Obesity, Healthy Diet and Health .docx
Running Head Obesity, Healthy Diet and Health                  .docxRunning Head Obesity, Healthy Diet and Health                  .docx
Running Head Obesity, Healthy Diet and Health .docxglendar3
 
Running Head Obesity, Healthy Diet and Health .docx
Running Head Obesity, Healthy Diet and Health                  .docxRunning Head Obesity, Healthy Diet and Health                  .docx
Running Head Obesity, Healthy Diet and Health .docxjeanettehully
 
The prevalence of metabolic syndrome in Yemeni patients with hypothyroidism
The prevalence of metabolic syndrome in Yemeni patients with hypothyroidismThe prevalence of metabolic syndrome in Yemeni patients with hypothyroidism
The prevalence of metabolic syndrome in Yemeni patients with hypothyroidismFaculty of Medicine And Health Sciences
 

Similar to Review ArticlePotential role of sugar (fructose) in the ep.docx (20)

Systemic review
Systemic reviewSystemic review
Systemic review
 
CVD Egypt Clinical Diabetes Reprint Summer 2010
CVD Egypt Clinical Diabetes Reprint Summer 2010CVD Egypt Clinical Diabetes Reprint Summer 2010
CVD Egypt Clinical Diabetes Reprint Summer 2010
 
Epidemiology of obesity
Epidemiology of obesityEpidemiology of obesity
Epidemiology of obesity
 
Diabet med 2009_sep_26(9)_864-71[1]
Diabet med 2009_sep_26(9)_864-71[1]Diabet med 2009_sep_26(9)_864-71[1]
Diabet med 2009_sep_26(9)_864-71[1]
 
International Journal of Nephrology & Therapeutics
International Journal of Nephrology & TherapeuticsInternational Journal of Nephrology & Therapeutics
International Journal of Nephrology & Therapeutics
 
Features of cardiovascular system activity in various climatic & geographical...
Features of cardiovascular system activity in various climatic & geographical...Features of cardiovascular system activity in various climatic & geographical...
Features of cardiovascular system activity in various climatic & geographical...
 
Austin Medical Sciences
Austin Medical SciencesAustin Medical Sciences
Austin Medical Sciences
 
Austin Medical Sciences
Austin Medical SciencesAustin Medical Sciences
Austin Medical Sciences
 
FINAL Paper Research (2)
FINAL Paper Research (2)FINAL Paper Research (2)
FINAL Paper Research (2)
 
Evans_Diabetes_2016
Evans_Diabetes_2016Evans_Diabetes_2016
Evans_Diabetes_2016
 
Dm & liver
Dm &  liverDm &  liver
Dm & liver
 
The effects of_the_mediterranean_diet_on_chronic_d
The effects of_the_mediterranean_diet_on_chronic_dThe effects of_the_mediterranean_diet_on_chronic_d
The effects of_the_mediterranean_diet_on_chronic_d
 
Epid of ncd + htn
Epid of ncd + htnEpid of ncd + htn
Epid of ncd + htn
 
Economic Forecasting - Semester Project
Economic Forecasting - Semester ProjectEconomic Forecasting - Semester Project
Economic Forecasting - Semester Project
 
MWEBAZA VICTOR RESEACH PROPOSAL 2022.doc
MWEBAZA VICTOR RESEACH PROPOSAL 2022.docMWEBAZA VICTOR RESEACH PROPOSAL 2022.doc
MWEBAZA VICTOR RESEACH PROPOSAL 2022.doc
 
Diabetes-related Clinical Complications: Novel Approaches for Diagnosis and M...
Diabetes-related Clinical Complications: Novel Approaches for Diagnosis and M...Diabetes-related Clinical Complications: Novel Approaches for Diagnosis and M...
Diabetes-related Clinical Complications: Novel Approaches for Diagnosis and M...
 
Running Head Obesity, Healthy Diet and Health .docx
Running Head Obesity, Healthy Diet and Health                  .docxRunning Head Obesity, Healthy Diet and Health                  .docx
Running Head Obesity, Healthy Diet and Health .docx
 
Running Head Obesity, Healthy Diet and Health .docx
Running Head Obesity, Healthy Diet and Health                  .docxRunning Head Obesity, Healthy Diet and Health                  .docx
Running Head Obesity, Healthy Diet and Health .docx
 
Running Head Obesity, Healthy Diet and Health .docx
Running Head Obesity, Healthy Diet and Health                  .docxRunning Head Obesity, Healthy Diet and Health                  .docx
Running Head Obesity, Healthy Diet and Health .docx
 
The prevalence of metabolic syndrome in Yemeni patients with hypothyroidism
The prevalence of metabolic syndrome in Yemeni patients with hypothyroidismThe prevalence of metabolic syndrome in Yemeni patients with hypothyroidism
The prevalence of metabolic syndrome in Yemeni patients with hypothyroidism
 

More from ronak56

According to the textbook, the Federal Disaster Assistance Act of 19.docx
According to the textbook, the Federal Disaster Assistance Act of 19.docxAccording to the textbook, the Federal Disaster Assistance Act of 19.docx
According to the textbook, the Federal Disaster Assistance Act of 19.docxronak56
 
According to the Council on Social Work Education, Competency 5 Eng.docx
According to the Council on Social Work Education, Competency 5 Eng.docxAccording to the Council on Social Work Education, Competency 5 Eng.docx
According to the Council on Social Work Education, Competency 5 Eng.docxronak56
 
According to the text, economic outcomes measured by economic gr.docx
According to the text, economic outcomes measured by economic gr.docxAccording to the text, economic outcomes measured by economic gr.docx
According to the text, economic outcomes measured by economic gr.docxronak56
 
According to the Council on Social Work Education, Competency 5.docx
According to the Council on Social Work Education, Competency 5.docxAccording to the Council on Social Work Education, Competency 5.docx
According to the Council on Social Work Education, Competency 5.docxronak56
 
According to the Council for Exceptional Children (CEC), part of.docx
According to the Council for Exceptional Children (CEC), part of.docxAccording to the Council for Exceptional Children (CEC), part of.docx
According to the Council for Exceptional Children (CEC), part of.docxronak56
 
According to the article, Answer these two questions. Why did Ma.docx
According to the article, Answer these two questions. Why did Ma.docxAccording to the article, Answer these two questions. Why did Ma.docx
According to the article, Answer these two questions. Why did Ma.docxronak56
 
According to Neuman’s theory, a human being is a total person as a c.docx
According to Neuman’s theory, a human being is a total person as a c.docxAccording to Neuman’s theory, a human being is a total person as a c.docx
According to Neuman’s theory, a human being is a total person as a c.docxronak56
 
According to Rolando et al. (2012), alcohol socialization is the pr.docx
According to Rolando et al. (2012), alcohol socialization is the pr.docxAccording to Rolando et al. (2012), alcohol socialization is the pr.docx
According to Rolando et al. (2012), alcohol socialization is the pr.docxronak56
 
According to your readings, cloud computing represents one of th.docx
According to your readings, cloud computing represents one of th.docxAccording to your readings, cloud computing represents one of th.docx
According to your readings, cloud computing represents one of th.docxronak56
 
According to this idea that gender is socially constructed, answer.docx
According to this idea that gender is socially constructed, answer.docxAccording to this idea that gender is socially constructed, answer.docx
According to this idea that gender is socially constructed, answer.docxronak56
 
According to Thiel (2015, p. 40), CSR literature lacks consensus fo.docx
According to Thiel (2015, p. 40), CSR literature lacks consensus fo.docxAccording to Thiel (2015, p. 40), CSR literature lacks consensus fo.docx
According to Thiel (2015, p. 40), CSR literature lacks consensus fo.docxronak56
 
According to recent surveys, China, India, and the Philippines are t.docx
According to recent surveys, China, India, and the Philippines are t.docxAccording to recent surveys, China, India, and the Philippines are t.docx
According to recent surveys, China, India, and the Philippines are t.docxronak56
 
According to Rolando et al. (2012), alcohol socialization is th.docx
According to Rolando et al. (2012), alcohol socialization is th.docxAccording to Rolando et al. (2012), alcohol socialization is th.docx
According to Rolando et al. (2012), alcohol socialization is th.docxronak56
 
According to the author, Social Security is an essential program, .docx
According to the author, Social Security is an essential program, .docxAccording to the author, Social Security is an essential program, .docx
According to the author, Social Security is an essential program, .docxronak56
 
According to Morrish, the blame for the ever-growing problem of disc.docx
According to Morrish, the blame for the ever-growing problem of disc.docxAccording to Morrish, the blame for the ever-growing problem of disc.docx
According to Morrish, the blame for the ever-growing problem of disc.docxronak56
 
According to DuBrin (2015), Cultural intelligence is an outsiders .docx
According to DuBrin (2015), Cultural intelligence is an outsiders .docxAccording to DuBrin (2015), Cultural intelligence is an outsiders .docx
According to DuBrin (2015), Cultural intelligence is an outsiders .docxronak56
 
According to Edgar Schein, organizational culture are the shared.docx
According to Edgar Schein, organizational culture are the shared.docxAccording to Edgar Schein, organizational culture are the shared.docx
According to Edgar Schein, organizational culture are the shared.docxronak56
 
According to DuBrin (2015), the following strategies or tactics are .docx
According to DuBrin (2015), the following strategies or tactics are .docxAccording to DuBrin (2015), the following strategies or tactics are .docx
According to DuBrin (2015), the following strategies or tactics are .docxronak56
 
According to DuBrin (2015), the following strategies or tactics .docx
According to DuBrin (2015), the following strategies or tactics .docxAccording to DuBrin (2015), the following strategies or tactics .docx
According to DuBrin (2015), the following strategies or tactics .docxronak56
 
Access the Mental Measurements Yearbook, located in the Univer.docx
Access the Mental Measurements Yearbook, located in the Univer.docxAccess the Mental Measurements Yearbook, located in the Univer.docx
Access the Mental Measurements Yearbook, located in the Univer.docxronak56
 

More from ronak56 (20)

According to the textbook, the Federal Disaster Assistance Act of 19.docx
According to the textbook, the Federal Disaster Assistance Act of 19.docxAccording to the textbook, the Federal Disaster Assistance Act of 19.docx
According to the textbook, the Federal Disaster Assistance Act of 19.docx
 
According to the Council on Social Work Education, Competency 5 Eng.docx
According to the Council on Social Work Education, Competency 5 Eng.docxAccording to the Council on Social Work Education, Competency 5 Eng.docx
According to the Council on Social Work Education, Competency 5 Eng.docx
 
According to the text, economic outcomes measured by economic gr.docx
According to the text, economic outcomes measured by economic gr.docxAccording to the text, economic outcomes measured by economic gr.docx
According to the text, economic outcomes measured by economic gr.docx
 
According to the Council on Social Work Education, Competency 5.docx
According to the Council on Social Work Education, Competency 5.docxAccording to the Council on Social Work Education, Competency 5.docx
According to the Council on Social Work Education, Competency 5.docx
 
According to the Council for Exceptional Children (CEC), part of.docx
According to the Council for Exceptional Children (CEC), part of.docxAccording to the Council for Exceptional Children (CEC), part of.docx
According to the Council for Exceptional Children (CEC), part of.docx
 
According to the article, Answer these two questions. Why did Ma.docx
According to the article, Answer these two questions. Why did Ma.docxAccording to the article, Answer these two questions. Why did Ma.docx
According to the article, Answer these two questions. Why did Ma.docx
 
According to Neuman’s theory, a human being is a total person as a c.docx
According to Neuman’s theory, a human being is a total person as a c.docxAccording to Neuman’s theory, a human being is a total person as a c.docx
According to Neuman’s theory, a human being is a total person as a c.docx
 
According to Rolando et al. (2012), alcohol socialization is the pr.docx
According to Rolando et al. (2012), alcohol socialization is the pr.docxAccording to Rolando et al. (2012), alcohol socialization is the pr.docx
According to Rolando et al. (2012), alcohol socialization is the pr.docx
 
According to your readings, cloud computing represents one of th.docx
According to your readings, cloud computing represents one of th.docxAccording to your readings, cloud computing represents one of th.docx
According to your readings, cloud computing represents one of th.docx
 
According to this idea that gender is socially constructed, answer.docx
According to this idea that gender is socially constructed, answer.docxAccording to this idea that gender is socially constructed, answer.docx
According to this idea that gender is socially constructed, answer.docx
 
According to Thiel (2015, p. 40), CSR literature lacks consensus fo.docx
According to Thiel (2015, p. 40), CSR literature lacks consensus fo.docxAccording to Thiel (2015, p. 40), CSR literature lacks consensus fo.docx
According to Thiel (2015, p. 40), CSR literature lacks consensus fo.docx
 
According to recent surveys, China, India, and the Philippines are t.docx
According to recent surveys, China, India, and the Philippines are t.docxAccording to recent surveys, China, India, and the Philippines are t.docx
According to recent surveys, China, India, and the Philippines are t.docx
 
According to Rolando et al. (2012), alcohol socialization is th.docx
According to Rolando et al. (2012), alcohol socialization is th.docxAccording to Rolando et al. (2012), alcohol socialization is th.docx
According to Rolando et al. (2012), alcohol socialization is th.docx
 
According to the author, Social Security is an essential program, .docx
According to the author, Social Security is an essential program, .docxAccording to the author, Social Security is an essential program, .docx
According to the author, Social Security is an essential program, .docx
 
According to Morrish, the blame for the ever-growing problem of disc.docx
According to Morrish, the blame for the ever-growing problem of disc.docxAccording to Morrish, the blame for the ever-growing problem of disc.docx
According to Morrish, the blame for the ever-growing problem of disc.docx
 
According to DuBrin (2015), Cultural intelligence is an outsiders .docx
According to DuBrin (2015), Cultural intelligence is an outsiders .docxAccording to DuBrin (2015), Cultural intelligence is an outsiders .docx
According to DuBrin (2015), Cultural intelligence is an outsiders .docx
 
According to Edgar Schein, organizational culture are the shared.docx
According to Edgar Schein, organizational culture are the shared.docxAccording to Edgar Schein, organizational culture are the shared.docx
According to Edgar Schein, organizational culture are the shared.docx
 
According to DuBrin (2015), the following strategies or tactics are .docx
According to DuBrin (2015), the following strategies or tactics are .docxAccording to DuBrin (2015), the following strategies or tactics are .docx
According to DuBrin (2015), the following strategies or tactics are .docx
 
According to DuBrin (2015), the following strategies or tactics .docx
According to DuBrin (2015), the following strategies or tactics .docxAccording to DuBrin (2015), the following strategies or tactics .docx
According to DuBrin (2015), the following strategies or tactics .docx
 
Access the Mental Measurements Yearbook, located in the Univer.docx
Access the Mental Measurements Yearbook, located in the Univer.docxAccess the Mental Measurements Yearbook, located in the Univer.docx
Access the Mental Measurements Yearbook, located in the Univer.docx
 

Recently uploaded

Industrial Policy - 1948, 1956, 1973, 1977, 1980, 1991
Industrial Policy - 1948, 1956, 1973, 1977, 1980, 1991Industrial Policy - 1948, 1956, 1973, 1977, 1980, 1991
Industrial Policy - 1948, 1956, 1973, 1977, 1980, 1991RKavithamani
 
The basics of sentences session 2pptx copy.pptx
The basics of sentences session 2pptx copy.pptxThe basics of sentences session 2pptx copy.pptx
The basics of sentences session 2pptx copy.pptxheathfieldcps1
 
Q4-W6-Restating Informational Text Grade 3
Q4-W6-Restating Informational Text Grade 3Q4-W6-Restating Informational Text Grade 3
Q4-W6-Restating Informational Text Grade 3JemimahLaneBuaron
 
_Math 4-Q4 Week 5.pptx Steps in Collecting Data
_Math 4-Q4 Week 5.pptx Steps in Collecting Data_Math 4-Q4 Week 5.pptx Steps in Collecting Data
_Math 4-Q4 Week 5.pptx Steps in Collecting DataJhengPantaleon
 
microwave assisted reaction. General introduction
microwave assisted reaction. General introductionmicrowave assisted reaction. General introduction
microwave assisted reaction. General introductionMaksud Ahmed
 
Hybridoma Technology ( Production , Purification , and Application )
Hybridoma Technology  ( Production , Purification , and Application  ) Hybridoma Technology  ( Production , Purification , and Application  )
Hybridoma Technology ( Production , Purification , and Application ) Sakshi Ghasle
 
Introduction to AI in Higher Education_draft.pptx
Introduction to AI in Higher Education_draft.pptxIntroduction to AI in Higher Education_draft.pptx
Introduction to AI in Higher Education_draft.pptxpboyjonauth
 
Call Girls in Dwarka Mor Delhi Contact Us 9654467111
Call Girls in Dwarka Mor Delhi Contact Us 9654467111Call Girls in Dwarka Mor Delhi Contact Us 9654467111
Call Girls in Dwarka Mor Delhi Contact Us 9654467111Sapana Sha
 
Contemporary philippine arts from the regions_PPT_Module_12 [Autosaved] (1).pptx
Contemporary philippine arts from the regions_PPT_Module_12 [Autosaved] (1).pptxContemporary philippine arts from the regions_PPT_Module_12 [Autosaved] (1).pptx
Contemporary philippine arts from the regions_PPT_Module_12 [Autosaved] (1).pptxRoyAbrique
 
Grant Readiness 101 TechSoup and Remy Consulting
Grant Readiness 101 TechSoup and Remy ConsultingGrant Readiness 101 TechSoup and Remy Consulting
Grant Readiness 101 TechSoup and Remy ConsultingTechSoup
 
Micromeritics - Fundamental and Derived Properties of Powders
Micromeritics - Fundamental and Derived Properties of PowdersMicromeritics - Fundamental and Derived Properties of Powders
Micromeritics - Fundamental and Derived Properties of PowdersChitralekhaTherkar
 
“Oh GOSH! Reflecting on Hackteria's Collaborative Practices in a Global Do-It...
“Oh GOSH! Reflecting on Hackteria's Collaborative Practices in a Global Do-It...“Oh GOSH! Reflecting on Hackteria's Collaborative Practices in a Global Do-It...
“Oh GOSH! Reflecting on Hackteria's Collaborative Practices in a Global Do-It...Marc Dusseiller Dusjagr
 
BASLIQ CURRENT LOOKBOOK LOOKBOOK(1) (1).pdf
BASLIQ CURRENT LOOKBOOK  LOOKBOOK(1) (1).pdfBASLIQ CURRENT LOOKBOOK  LOOKBOOK(1) (1).pdf
BASLIQ CURRENT LOOKBOOK LOOKBOOK(1) (1).pdfSoniaTolstoy
 
Organic Name Reactions for the students and aspirants of Chemistry12th.pptx
Organic Name Reactions  for the students and aspirants of Chemistry12th.pptxOrganic Name Reactions  for the students and aspirants of Chemistry12th.pptx
Organic Name Reactions for the students and aspirants of Chemistry12th.pptxVS Mahajan Coaching Centre
 
Alper Gobel In Media Res Media Component
Alper Gobel In Media Res Media ComponentAlper Gobel In Media Res Media Component
Alper Gobel In Media Res Media ComponentInMediaRes1
 
Arihant handbook biology for class 11 .pdf
Arihant handbook biology for class 11 .pdfArihant handbook biology for class 11 .pdf
Arihant handbook biology for class 11 .pdfchloefrazer622
 
Incoming and Outgoing Shipments in 1 STEP Using Odoo 17
Incoming and Outgoing Shipments in 1 STEP Using Odoo 17Incoming and Outgoing Shipments in 1 STEP Using Odoo 17
Incoming and Outgoing Shipments in 1 STEP Using Odoo 17Celine George
 
Accessible design: Minimum effort, maximum impact
Accessible design: Minimum effort, maximum impactAccessible design: Minimum effort, maximum impact
Accessible design: Minimum effort, maximum impactdawncurless
 
APM Welcome, APM North West Network Conference, Synergies Across Sectors
APM Welcome, APM North West Network Conference, Synergies Across SectorsAPM Welcome, APM North West Network Conference, Synergies Across Sectors
APM Welcome, APM North West Network Conference, Synergies Across SectorsAssociation for Project Management
 

Recently uploaded (20)

Industrial Policy - 1948, 1956, 1973, 1977, 1980, 1991
Industrial Policy - 1948, 1956, 1973, 1977, 1980, 1991Industrial Policy - 1948, 1956, 1973, 1977, 1980, 1991
Industrial Policy - 1948, 1956, 1973, 1977, 1980, 1991
 
The basics of sentences session 2pptx copy.pptx
The basics of sentences session 2pptx copy.pptxThe basics of sentences session 2pptx copy.pptx
The basics of sentences session 2pptx copy.pptx
 
Q4-W6-Restating Informational Text Grade 3
Q4-W6-Restating Informational Text Grade 3Q4-W6-Restating Informational Text Grade 3
Q4-W6-Restating Informational Text Grade 3
 
_Math 4-Q4 Week 5.pptx Steps in Collecting Data
_Math 4-Q4 Week 5.pptx Steps in Collecting Data_Math 4-Q4 Week 5.pptx Steps in Collecting Data
_Math 4-Q4 Week 5.pptx Steps in Collecting Data
 
microwave assisted reaction. General introduction
microwave assisted reaction. General introductionmicrowave assisted reaction. General introduction
microwave assisted reaction. General introduction
 
Hybridoma Technology ( Production , Purification , and Application )
Hybridoma Technology  ( Production , Purification , and Application  ) Hybridoma Technology  ( Production , Purification , and Application  )
Hybridoma Technology ( Production , Purification , and Application )
 
Introduction to AI in Higher Education_draft.pptx
Introduction to AI in Higher Education_draft.pptxIntroduction to AI in Higher Education_draft.pptx
Introduction to AI in Higher Education_draft.pptx
 
Call Girls in Dwarka Mor Delhi Contact Us 9654467111
Call Girls in Dwarka Mor Delhi Contact Us 9654467111Call Girls in Dwarka Mor Delhi Contact Us 9654467111
Call Girls in Dwarka Mor Delhi Contact Us 9654467111
 
Contemporary philippine arts from the regions_PPT_Module_12 [Autosaved] (1).pptx
Contemporary philippine arts from the regions_PPT_Module_12 [Autosaved] (1).pptxContemporary philippine arts from the regions_PPT_Module_12 [Autosaved] (1).pptx
Contemporary philippine arts from the regions_PPT_Module_12 [Autosaved] (1).pptx
 
Grant Readiness 101 TechSoup and Remy Consulting
Grant Readiness 101 TechSoup and Remy ConsultingGrant Readiness 101 TechSoup and Remy Consulting
Grant Readiness 101 TechSoup and Remy Consulting
 
Micromeritics - Fundamental and Derived Properties of Powders
Micromeritics - Fundamental and Derived Properties of PowdersMicromeritics - Fundamental and Derived Properties of Powders
Micromeritics - Fundamental and Derived Properties of Powders
 
Staff of Color (SOC) Retention Efforts DDSD
Staff of Color (SOC) Retention Efforts DDSDStaff of Color (SOC) Retention Efforts DDSD
Staff of Color (SOC) Retention Efforts DDSD
 
“Oh GOSH! Reflecting on Hackteria's Collaborative Practices in a Global Do-It...
“Oh GOSH! Reflecting on Hackteria's Collaborative Practices in a Global Do-It...“Oh GOSH! Reflecting on Hackteria's Collaborative Practices in a Global Do-It...
“Oh GOSH! Reflecting on Hackteria's Collaborative Practices in a Global Do-It...
 
BASLIQ CURRENT LOOKBOOK LOOKBOOK(1) (1).pdf
BASLIQ CURRENT LOOKBOOK  LOOKBOOK(1) (1).pdfBASLIQ CURRENT LOOKBOOK  LOOKBOOK(1) (1).pdf
BASLIQ CURRENT LOOKBOOK LOOKBOOK(1) (1).pdf
 
Organic Name Reactions for the students and aspirants of Chemistry12th.pptx
Organic Name Reactions  for the students and aspirants of Chemistry12th.pptxOrganic Name Reactions  for the students and aspirants of Chemistry12th.pptx
Organic Name Reactions for the students and aspirants of Chemistry12th.pptx
 
Alper Gobel In Media Res Media Component
Alper Gobel In Media Res Media ComponentAlper Gobel In Media Res Media Component
Alper Gobel In Media Res Media Component
 
Arihant handbook biology for class 11 .pdf
Arihant handbook biology for class 11 .pdfArihant handbook biology for class 11 .pdf
Arihant handbook biology for class 11 .pdf
 
Incoming and Outgoing Shipments in 1 STEP Using Odoo 17
Incoming and Outgoing Shipments in 1 STEP Using Odoo 17Incoming and Outgoing Shipments in 1 STEP Using Odoo 17
Incoming and Outgoing Shipments in 1 STEP Using Odoo 17
 
Accessible design: Minimum effort, maximum impact
Accessible design: Minimum effort, maximum impactAccessible design: Minimum effort, maximum impact
Accessible design: Minimum effort, maximum impact
 
APM Welcome, APM North West Network Conference, Synergies Across Sectors
APM Welcome, APM North West Network Conference, Synergies Across SectorsAPM Welcome, APM North West Network Conference, Synergies Across Sectors
APM Welcome, APM North West Network Conference, Synergies Across Sectors
 

Review ArticlePotential role of sugar (fructose) in the ep.docx

  • 1. Review Article Potential role of sugar (fructose) in the epidemic of hypertension, obesity and the metabolic syndrome, diabetes, kidney disease, and cardiovascular disease1�3 Richard J Johnson, Mark S Segal, Yuri Sautin, Takahiko Nakagawa, Daniel I Feig, Duk-Hee Kang, Michael S Gersch, Steven Benner, and Laura G Sánchez-Lozada ABSTRACT Currently, we are experiencing an epidemic of cardiorenal disease characterized by increasing rates of obesity, hypertension, the met- abolic syndrome, type 2 diabetes, and kidney disease. Whereas ex- cessive caloric intake and physical inactivity are likely important factors driving the obesity epidemic, it is important to consider additional mechanisms. We revisit an old hypothesis that sugar, particularly excessive fructose intake, has a critical role in the epi- demic of cardiorenal disease. We also present evidence that the unique ability of fructose to induce an increase in uric acid may be a major mechanism by which fructose can cause cardiorenal disease. Finally, we suggest that high intakes of fructose in African Ameri-
  • 2. cans may explain their greater predisposition to develop cardiorenal disease, and we provide a list of testable predictions to evaluate this hypothesis. Am J Clin Nutr 2007;86:899 –906. KEY WORDS Fructose, uric acid, sugar, arteriosclerosis, en- dothelial dysfunction, hypertension, obesity, chronic kidney dis- ease, metabolic syndrome INTRODUCTION Despite our best efforts, the epidemic of cardiorenal disease continues to increase at an alarming rate. Obesity affects one- third of adults and one-sixth of children in the United States and continues to increase; although dietary interventions are often initially successful, they often fail over time because of attrition (1). Likewise, hypertension affects nearly one-third of the pop- ulation, but despite the presence of effective antihypertensive agents, nearly two-thirds of these patients remain either un- treated or are treated ineffectively (2). Furthermore, even if the hypertension is controlled, these subjects continue to have in- creased cardiovascular mortality (3). Diabetes, a complication of obesity, now affects 7% of our population, with approximately one-third doomed to develop various complications such as ret- inopathy or nephropathy (4). Kidney disease also continues to increase at a deplorable rate, a consequence of the increasing frequency of hypertension and diabetes (5). Today, nearly 20 million Americans have stage 1 kidney disease or greater (de- fined as the presence of microalbuminuria or a glomerular fil- tration rate �90 mL�min�1�1.73 m�2; 6), and, although treat- ments such as angiotensin-converting enzyme inhibitors are beneficial, they act primarily to delay the progression to renal
  • 3. failure as opposed to halting the process (7). It is our opinion that the potential mechanisms underlying the epidemic should be carefully reappraised. On the basis of both the experimental studies performed in our laboratories and an extensive review of the literature, we revisit an old hypothesis that a simple dietary substance may have a significant role in driving the epidemic. Interestingly, reappraising the role of sugar and its influence in the development of cardiorenal disease may lead to a new understanding of why certain populations, such as African Americans, Native Americans, Maori, and Australian Aborigines, are at greater risk of developing the disease. Similar to the relation between high intakes of salt or protein and the risk of developing kidney disease or to the relation between a high- fat diet and the atherosclerotic phenotype, we propose that sugars containing fructose may play a major role in the development of hypertension, obesity, and the metabolic syndrome and in the subsequent development of kidney disease. Although physical inactivity and overeating are major contributors to the obesity epidemic, we present evidence that fructose may be the “caries” at the epidemic’s root. THE EPIDEMIC OF CARDIORENAL DISEASE If the goal is to understand the causes of the epidemic, it is important to first review the literature to understand the timing and origins of the epidemic of cardiorenal disease. This type of epidemiologic analysis may provide insights into the potential etiologies that can then be tested in the experimental setting. After the introduction of the inflatable cuff for blood pressure measurement by Riva Rocci in the late 1800s, population-based
  • 4. studies were performed throughout the world (reviewed in 8). A 1 From the Division of Nephrology and Department of Medicine, Univer- sity of Florida, Gainesville, FL (RJJ, MSS, YS, TN, and MSG); the Division of Pediatric Nephrology, Texas Children’s Hospital, Baylor College of Med- icine, Houston, TX (DIF); the Division of Nephrology, Ewha Woman’s University College of Medicine, Seoul, Korea (D-HK); the Foundation for Applied Molecular Evolution, Gainesville, FL (SB); and the Instituto Na- cional de Cardiologia Ignacio Chavez, Mexico City, Mexico (LGS-L). 2 Supported by NIH grants DK-52121, HL-68607, and HL- 79352 (to RJJ) and by a grant from the Korea Health 21 R&D Project, Ministry of Health & Welfare, Republic of Korea (A050626; to D-HK). 3 Address reprint requests to RJ Johnson, CG-98, 1600 Archer Road, Gainesville, FL 32610. E-mail: [email protected] Received November 16, 2006. Accepted for publication March 5, 2007. 899Am J Clin Nutr 2007;86:899 –906. Printed in USA. © 2007 American Society for Nutrition a t C A
  • 7. D o w n lo a d e d fro m http://ajcn.nutrition.org/ study performed between 1907 and 1919 in �140 000 healthy adults applying for life insurance in the New York region sug- gested that a blood pressure of 140 (systolic)/90 (diastolic) mm Hg was abnormal because it reflected only 5-6% of the popula- tion in the United States (9); however, by nature, these early studies may not have been representative of the general popula- tion because they usually did not include subjects of lower so- cioeconomic status who could not afford insurance or patients who had been previously diagnosed with a disease. Nevertheless, on the basis of these early studies, a blood pressure of 140/90 mm Hg was adopted as the definition of hypertension. There has been a remarkable increase in the prevalence of hypertension in the US population since the early 1900s. In a
  • 8. study performed in 1939 of �11 000 residents in the Chicago area, only 11-13% of the adult population had blood pressures in the hypertensive range (10); this increased to 25% in 1975 (11), to 28% in 1990 (12), and to 31% (61 million people) in 2004 (13). Similar observations were noted in other countries. Hyperten- sion was initially rare in all parts of the world except in Europe, particularly in England, France, Germany, and the United States (14 –16). In studies conducted as late as 1940, hypertension ap- pears to have been almost nonexistent in non-Western peoples, including studies performed in Native Americans, Australian Aborigines, Maori, Alaskan Eskimos, Asians, and African blacks (reviewed in 8). However, with the introduction of a Western culture and diet, there has been a significant change. The prevalence of hypertension has been increasing throughout the world, and the greatest relative increase has been observed in groups with less socioeconomic support (8). Not surprisingly, a rise in hypertension is paralleled by in- creasing rates of obesity and diabetes. In a study of Civil War veterans, obesity [defined as a body mass index (BMI; in kg/m2) �30] was observed in only 3.4% of 50- to 59-y-old male veterans in 1890, but this percentage rose slightly to 5.9% by 1900 (17). Obesity rates continued to increase during the early 1900s, reach- ing 14.5% in 1976 –1980, 22.5% in 1988 –1994, and 30.4% in 1999 –2002 (4, 18). Similarly, Osler (19) estimated a prevalence of 2–3 cases of diabetes per 100 000 persons in the population in 1893; however, today, type 2 diabetes affects �7% of our pop-
  • 9. ulation and is estimated to double in prevalence by 2020. The increases in the rates of obesity and diabetes are being observed throughout the world (20). As with hypertension, these condi- tions are greatest among the less privileged in societies such as African Americans, Native Americans, and Hispanics in the United States; the Maori in New Zealand; and Aborigines in Australia (20). There has also been a remarkable increase in chronic kidney disease (4, 21). The incidence of end-stage renal disease in the United States has increased 4-fold between 1980 and 2002 (21), and similar increases are being observed throughout the world. Most of the increase is due to diabetes and hypertension. The incidence of end-stage renal disease in the United States has increased 4-fold between 1980 and 2002 (21), and similar in- creases are being observed throughout the world. Most of the increase is due to diabetes and hypertension. The increase in hypertension and diabetes translates into in- creased rates of stroke, heart failure, and myocardial infarction. Indeed, there has also been a remarkable increase in cardiovas- cular disease throughout the world. Coronary artery disease was once considered rare and was observed primarily in Europe and in the United States (22). By 1929, Platt (23) noted that coronary disease had increased in frequency such that it was commonly observed by the family practitioner; by 1940, cardiology was initiated as a discipline in the United States. By 1950, there were only 500 cardiologists in the United States, and, by 1960, the World Health Organization pronounced a world epidemic of cardiovascular disease. Today, there are �25 000 cardiologists in the United States performing �1 million coronary angiograms yearly, and �720 000 cardiovascular surgeries are performed
  • 10. an- nually (4). Cardiovascular disease is currently the major cause of death in the United States, accounting for 37% of all deaths, and is considered a contributing factor in an additional 21% of the popu- lation (4). Similar increases in coronary artery disease and cardio- vascular mortality have also been observed in other countries (20). Some have argued that there is no cardiovascular epidemic, because the absolute number of cardiovascular deaths in the United States and the calculated rates per population are cur- rently decreasing (4). It has also been stated that the increase in hypertension simply reflects the increase in the aging population, because the average life span has increased from 47 y in 1900 to 77 y today (24). Furthermore, the increasing longevity of the population has been used as an argument that the increase in obesity may not be a disadvantage. However, these arguments are lacking. First, the observed decline in cardiovascular mor- tality rates is probably not due to a decrease in cardiovascular disease, but rather to the fact that we have developed better ways to control cardiovascular disease after it has developed. Today, we have antihypertensive agents, statins, antiplatelet drugs, and a host of surgical and nonsurgical treatments for those with cor- onary artery disease. Whereas it is true that an aging population will likely mean higher rates of hypertension, we are now ob- serving hypertension in adolescents that cannot be explained by an aging population (13). Furthermore, in the 1939 study (10), only 12–13% of 50- to 55-y-old men had hypertension (and only 1.6% had systolic blood pressures �140 mm Hg); today, age- matched men have a hypertension frequency of 31%. Finally,
  • 11. the comment that obesity is an advantage because people are living longer negates the fact that, in the general population, longevity is greater in persons with a normal BMI than in those with a high BMI (25). It is more likely that increased longevity relates to better hygiene, a reduction in malnutrition, the introduction of antibiotics, and the increasing affluence of the world population. THE PARALLEL EPIDEMIC OF SUGAR CONSUMPTION Whereas today the intake of foods containing table sugar (su- crose) occurs with almost every meal, the introduction of sugar into the diet is relatively recent. Before the introduction of sugar, the primary sweetener had been honey, but because it was rela- tively rare and not mass produced, the majority of people (espe- cially the poorer classes) had no sweeteners at all in their normal diet (26). Sugar derived from sugar cane was first developed in New Guinea and in the Indian subcontinent and was a rare and expen- sive commodity that was introduced into Europe via Venice, Italy, and other trading ports during the Middle Ages. During this time, only royalty or the very wealthy could afford this luxury. However, by the late 1400s, Spain and Portugal began growing sugar cane in the Canary Islands, in Madeira, and in Silo Tome; this led to such wealth that King Emmanuel I of Portugal, “the 900 JOHNSON ET AL
  • 14. n .o rg D o w n lo a d e d fro m http://ajcn.nutrition.org/ Fortunate” (1469 –1521), sent life-sized sugar effigies of the Cardinals and the Pope to the Vatican in 1513 as a gift (27). The discovery of the New World provided a mechanism for expanding sugar production. Christopher Columbus brought sugar cane to Santo Domingo on the island of Hispaniola (which is now Haiti and the Dominican Republic) on his second voyage in 1493; shortly thereafter, sugar plantations were established in the Carib-
  • 15. bean islands, in the Guiana coasts, in Brazil, and eventually in the southern United States. Although initially an attempt was made to use Native Americans to work the plantations, a Catholic priest, Bartholomew de las Casas, requested King Ferdinand of Spain for the protection of the local Taino Indians because of the large num- bers who had been killed or who were dying from smallpox or other diseases. So, in 1505, the first ship of African slaves departed for America to work the plantations. The next three and a half centuries witnessed the infamous “Triangle Trade,” in which ships would sail to Africa, loaded with manufactured goods such as brass, copper, lead, salt, and gunpowder, which would be used to purchase slaves who were then shipped across the famed “Middle Passage” to the sugar plantations in the Caribbean and southern states. It is estimated that between 10 and 20 million Africans were brought to America during this period. Whereas initially Portugal and Spain were the major importers of sugar, the capture of the Spanish settlement of Kingston, Jamaica, by the English in 1655 resulted in much of the sugar being exported to England. Sugar was such a desirable commod- ity that England began to hoard the sugar for its own people. Whereas in 1660, England exported 67% of its sugar to the rest of Europe, by 1753, this dropped to 5.5% (28). The increase in
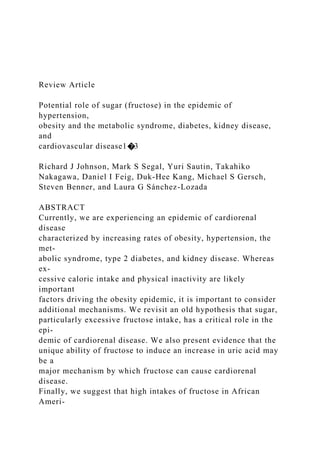
  • 16. sugar production resulted in its increased availability to the pub- lic. Before the introduction of sugar, the primary diet was car- bohydrate based, but it was primarily starch, consisting of a diet rich in barley, wheat, oats, and rye. Sugar had been used primarily as a costly medicinal. However, with the increased availability of sugar, it could also be used to sweeten chocolates, teas, and cakes. The average per capita sugar intake in England was 4 lb (1.8 kg) in 1700 and 18 lb (8.1 kg) in 1800, and it increased even more after the prime minister, William Gladstone, removed the sugar tax in 1874, which led to a mean consumption of 100 lb (45 kg) in 1950 (29; Figure 1). The blockade of sugar importation to Europe by the British navy after 1700 caused a shortage of sugar to these countries. As a consequence, techniques were developed to extract sugar from beets, and by the beginning of the 18th century, a thriving sugar beet industry was developing in Germany, France, and Austria. The combined production of sugar from sugar cane and beets led to a marked increase in world sugar production, from 250 000 tons in 1800 to 8 million tons in 1900 (33). Sugar consumption continued to increase in the 1900s, with an overall doubling in the United States and the United Kingdom between 1900 and 1967 (34). By 1993, �110 million tons of sugar were produced worldwide (33). Whereas sugar intake con- tinues to be marked in the industrialized nations, it is in the developing countries that the greatest increase in the rates of sugar consumption has been observed (35 ). By the early 1970s, an additional sweetener, high-fructose corn syrup (HFCS), was
  • 17. introduced in the United States, which had certain advantages over table sugar with relation to shelf life and cost. This sweet- ener, the composition of which is similar to that of sucrose, is used extensively to sweeten soft drinks, fruit punches, pastries, and processed foods. The combination of table sugar and HFCS has resulted in an additional 30% increase in overall sweetener intake over the past 40 y, mostly in soft drinks. Currently, con- sumption of these sweeteners is almost 150 lb (67.6 kg) per person per year (36), which has resulted in the ingestion of �500 kcal/d (37; Figure 1). ARE THESE EPIDEMICS RELATED? Keys (38) is credited with the discovery of an association of Western diets with the development of coronary artery disease. Keys focused on the relative increase in fat intake with a decrease in total carbohydrate intake, and this general finding (“nutrition transition”) has been confirmed in numerous studies, which has led to the widespread recognition of the importance of fat intake in the development of heart disease. However, Yudkin (39) showed in the early 1960s that the Western diets high in fat are also high in sugar, and he proposed that sugar intake may also play an underlying role in the cardiovascular epidemic. In addi- tion, recent history in the United States has shown that, although a low-fat intake has been promoted, rates of obesity have con- tinued to increase as sugar consumption has continued. In addi- tion, recent studies showing that a low-carbohydrate, high-fat diet has no adverse cardiovascular effects (40, 41) suggest that it is time to revisit the causes of the cardiorenal disease epidemic. In 2002, Havel’s group (37) made the case that the fructose content of sugar may be the critical component associated with the risks of obesity and heart disease. Sucrose is a disaccharide
  • 18. consisting of 50% fructose and 50% glucose, and HFCS is also a mixture of free fructose and glucose of approximately the same proportion (55:45). There are some striking epidemiologic associations between sugar intake and the epidemic of cardiorenal disease. For exam- ple, obesity was initially seen primarily in the wealthy, who would have been the only ones able to afford sugar. Also, the first documentation of hypertension, diabetes, and obesity occurred in the very countries (England, France, and Germany) where sugar first became available to the public. The rise in sugar intake in the United Kingdom and the United States (Figure 1) also correlates with the rise in obesity rates observed in these coun- tries. Furthermore, the later introduction of sugar to developing countries also correlates with the later rise in their rates of obesity and heart disease. A series of epidemiologic studies linked the FIGURE 1. Sugar intake per capita in the United Kingdom from 1700 to 1978 (30, 31; E) and in the United States from 1975 to 2000 (32; �) is compared with obesity rates in the United States in non- Hispanic white men aged 60 – 69 y (17; F). Values for 1880-1910 are based on studies conducted in male Civil War veterans aged 50 –59 y (18). SUGAR AND THE CARDIORENAL DISEASE EPIDEMIC 901 a t C A
  • 21. D o w n lo a d e d fro m http://ajcn.nutrition.org/ ingestion of soft drinks to obesity, hypertension, and diabetes (42, 43) and the consumption of fruit juice and fruit punch to obesity in children (44, 45). Although these epidemiologic as- sociations suggest a potential causal role, are there any direct experimental data to show that sucrose or fructose can induce obesity or hypertension? SUGAR (FRUCTOSE) STUDIES IN HUMANS AND EXPERIMENTAL ANIMAL MODELS Clinical studies have confirmed that sucrose (and particularly fructose) can induce weight gain and features of the metabolic syndrome. For example, serum triacylglycerols increased in young men receiving a diet supplemented with 200 g sucrose/d, whereas concentrations did not increase when starch was the primary carbohydrate (46). Hyperinsulinemia developed in one-
  • 22. third of these subjects (30). In another study, the administration of sucrose supplements resulted in weight gain, a significant rise in serum triacylglycerols, and a rise in systolic blood pressure (47). An increase in blood pressure was also observed in healthy adults fed a diet of 33% sucrose for 6 wk but not when diets of 5% or 18% sucrose were fed (48). Others have also reported that diets enriched in either sucrose (49) or fructose (50) cause impaired glucose tolerance and insulin resistance. Notably, most of these diets provided fructose in the range of 400 – 800 kcal/d, which is within the upper range of what is currently being ingested in the United States. Rodents also develop features of the metabolic syndrome after ingesting sucrose. As in humans, it was shown that the active ingredient is fructose rather than glucose: feeding fructose to rats resulted in the metabolic syndrome, whereas equivalent amounts of glucose or starch did not induce these features (51). In addition to the metabolic syndrome, the administration of fructose re- sulted in the development of renal hypertrophy, afferent arterio- lar thickening, glomerular hypertension, and cortical vasocon- striction (52). Furthermore, feeding fructose to rats with chronic renal disease (rats that have had five-sixths of their renal mass removed) resulted in an increased progression of the disease, as evidenced by worsening proteinuria, renal function, and glomer- ulosclerosis (53). Worsening of renal function was not observed in rat pairs fed dextrose (53). It has been argued that the fructose studies in rodents should not be compared with human studies because the doses of fruc- tose administered to rodents are not physiologic, inasmuch as
  • 23. they usually account for 60-70% of the diet. However, we re- cently found that lower doses of fructose (10% given in the water, resulting in one-half of the caloric intake, compared with the classic 60% fructose diet) can also induce hypertension and renal microvascular changes, although they are less severe (52). MECHANISMS FOR FRUCTOSE-INDUCED METABOLIC SYNDROME Fructose may cause obesity via several different mechanisms. First, Havel’s group (54) conducted a clinical study that found that fructose may not cause the level of satiety equivalent to that of a glucose-based meal. Specifically, the differences in the ef- fect of fructose and glucose consumption (consumed as bever- ages with 3 meals) on ad libitum food intake and hunger rating were observed on the day after the exposure to the sweetened beverages. The mechanism was related to the inability of fructose to acutely stimulate insulin and leptin and to inhibit ghrelin, all factors that are known to affect the satiety center in the central nervous system. Yudkin (34) also argued that the sweetness of fructose (or sucrose) often makes food more palatable, and, in- deed, the food industry has capitalized on this by frequently adding HFCS or sugar to normally nonsweetened foods (such as crackers) to enhance the taste. This may stimulate more food intake. Furthermore, mice fed fructose-sweetened water gain more weight than do mice given the same calories as starch, which suggests that fructose may also slow the basal metabolic rate (55 ). One unique aspect of fructose is that it is the only sugar that raises uric acid concentrations, and this can be shown in both
  • 24. humans (56) and rodents (57). Fructose enters hepatocytes and other cells (including tubular cells, adipocytes, and intestinal epithelial cells), where it is completely metabolized by fructoki- nase with the consumption of ATP; unlike in glucose metabo- lism, there is no negative regulatory mechanism to prevent the depletion of ATP. As a consequence, lactic acid and uric acid are generated in the process, and uric acid concentrations may rise by 1– 4 mg/dL after the ingestion of a large fructose-based meal (58). Although the rise in uric acid concentrations has historically been viewed as simply a potential risk factor for inducing gout, recent studies suggest that this may be a key mechanism to explain how fructose causes cardiovascular disease. In addition, it also provides a mechanism to explain why rodents are rela- tively resistant to the effects of fructose (see below). FRUCTOSE-INDUCED HYPERURICEMIA AS A MECHANISM FOR CARDIORENAL DISEASE Nakagawa et al (51) recently showed in experimental animals that lowering uric acid concentrations could largely prevent fea- tures of the metabolic syndrome induced by fructose, including weight gain, hypertriacylglycerolemia, hyperinsulinemia and in- sulin resistance, and hypertension. The protective effect of low- ering uric acid concentrations on the development of the meta- bolic syndrome was shown regardless of whether the uric acid concentrations were lowered by using a xanthine oxidase inhib- itor or a uricosuric agent (51). These studies were surprising, because most authorities had considered uric acid to be either biologically inert or an important antioxidant in the plasma (59). However, uric acid was found to have numerous deleterious biologic functions. For example, uric acid stimulates both vascular smooth muscle cell proliferation
  • 25. and the release of chemotactic and inflammatory substances (60 – 62), induces monocyte chemotaxis (63), inhibits endothe- lial cell proliferation and migration (64, 65), and causes oxidative stress in adipocytes, which results in the impaired secretion of adiponectin (66). In animals, the effect of elevated uric acid concentrations is even more pronounced. For example, mildly hyperuricemic rats develop hypertension because of the inhibition of nitric oxide synthase in the macula densa, the stimulation of intrarenal renin, and a reduction in endothelial nitric oxide bioavailability (67). Over time, hyperuricemic rats develop renal arteriosclerosis that then causes the animals to develop a salt-sensitive form of hypertension (62). Hyperuricemic rats also develop slowly progressive renal dis- ease with renal vasoconstriction and glomerular hypertension (68). 902 JOHNSON ET AL a t C A L IF O R N IA
  • 28. a d e d fro m http://ajcn.nutrition.org/ An increase in uric acid in animals with preexistent renal disease accelerates the progression of the disease (69). Whereas human diseases such as obesity, renal disease, and cardiovascular diseases likely have complex and multifactorial origins, recent studies have suggested that uric acid is an inde- pendent risk factor for these diseases. Uric acid has now been found to be an independent predictor of hypertension in 15 of 16 published studies, including a recent report by the Framingham Heart Study group (70 – 85). Uric acid is also an independent predictor of obesity (86), hyperinsulinemia (87), and renal dis- ease (88). Furthermore, uric acid concentrations are elevated in the vast majority (89%) of adolescents with new-onset hyper- tension, and in pilot studies, the lowering of uric acid concentra- tions was found to reduce blood pressure in these subjects (89, 90). A recent prospective, controlled trial also reported that the lowering of uric acid concentrations in patients with hyperuri- cemia and renal disease resulted in significantly slower renal progression and a significant (13 mm Hg) fall in systolic blood pressure that was not observed in the controls (91). Whereas more clinical studies are clearly needed, these data suggest that
  • 29. uric acid may contribute to the cardiorenal disease epidemic. The mechanism by which uric acid causes these effects may involve a reduction in the concentrations of endothelial nitric oxide. Uric acid potently reduces the concentrations of endothe- lial nitric oxide in vitro and in vivo in experimental animals (64, 65). Hyperuricemia in humans is also strongly associated with endothelial dysfunction (92, 93), and lowering uric acid concen- trations has consistently been shown to improve endothelial function after several weeks (94 –98). In turn, a reduction in endothelial nitric oxide predisposes animals to develop features of the metabolic syndrome. For example, genetically modified mice that lack endothelial nitric oxide synthase develop many features of metabolic syndrome, including hypertension, hyper- triacylglycerolemia, and insulin resistance (99). Several potential mechanisms may explain how an impaired production of endothelial nitric oxide results in features of the metabolic syndrome. For example, a reduction in nitric oxide results in systemic and intrarenal vasoconstriction, renal micro- vascular disease, and systemic hypertension (100). Endothelial nitric oxide is also critical in mediating the increase in blood flow to the skeletal muscle in response to insulin, and blocking nitric oxide can result in higher blood insulin concentrations and pe- ripheral insulin resistance (101). In turn, insulin stimulates the secretion of hepatic triacylglycerol (102). It should be noted that obesity itself can also induce insulin resistance, in part by the intracellular accumulation of triacyl- glycerols (102). Once renal arteriosclerosis develops, hyperten- sion also becomes salt sensitive and renal dependent (103). Fi- nally, the progressive loss of renal function and mass will result in intrarenal hemodynamic changes that favor a continued de- cline in renal function (104). Hence, fructose- and uric acid–
  • 30. associated mechanisms are likely to be of more importance in the initial development of the metabolic syndrome phenotype and may become less important once obesity, hypertension, and renal disease become established. WHY ARE AFRICAN AMERICANS SUSCEPTIBLE TO CARDIOVASCULAR DISEASE? It is well known that African Americans have higher rates of obesity, hypertension, diabetes, kidney disease, and heart disease (105). This increased rate of cardiorenal disease contrasts with a near absence of hypertension and obesity in studies performed in the early 20th century in blacks living in Africa (106, 107). It is interesting to speculate that African Americans may also have been exposed quite early to sugar. Early workers cut and bundled the sugar cane in the fields, pressed the cane in the local mills to get the sugary extract, and boiled this extract in the sugar houses to generate the sugar crystals and leftover molasses. Molasses (which is sucrose) was a staple in the early African American diet, and one wonders whether it may have played a role in the increased frequency of hypertension that was noted in early ep- idemiologic studies performed in the Caribbean and in Louisiana (108, 109). Recent studies also have documented that the sugar intake of African Americans is greater than that of whites (110, 111). Similar high sugar intakes were noted in studies of Aus- tralian Aborigines and Samoans living in New Zealand (112,
  • 31. 113). Furthermore, it is known that African Americans have higher concentrations of uric acid (114); in the African American Study of Hypertension and Kidney Disease, the average uric acid concentration was 8.3 mg/dL (115). Other explanations are also possible, including the preferential survival during the early years of slavery of subjects with higher blood pressures, salt sensitivity, obesity and insulin resistance, and better wound healing (116). Indeed, African Americans with hypertension and renal disease have been found to have a higher frequency of a polymorphism for transforming growth factor-� (TGF-�) and elevated serum TGF-� concentrations (117). TGF-� is a cytokine important in wound healing and was re- cently shown to have a role in blood pressure (118). An increase in TGF-� could also explain the rapid progression of microvas- cular injury and renal disease characteristic of African Ameri- cans (119) and, by inducing microvascular disease, could also have a role in the induction of salt sensitivity (103). A congenital mechanism has also been proposed. African Americans have a higher frequency of low-birth-weight infants, which has been linked to a low nephron number (120). In turn, a low nephron number is associated with the later development of hypertension, diabetes, and obesity (121). Interestingly, low- birth-weight infants are known to develop early hyperuricemia and endothelial dysfunction (122). Indeed, evidence that uric acid may have a role in this condition is mounting (123). Finally, an environmental mechanism also seems likely. Af- rican Americans may be under more societal stress owing to lower socioeconomic conditions (124). They also have diets higher in sodium and lower in potassium (125).
  • 32. CAVEATS A key difficulty in proving that sugars play a participatory role in the epidemic of cardiorenal disease is separating the effect of fat intake and the effect of sugar intake. That is, survival for thousands of years was based on our ability to store triacylglyc- erol for survival during times when food was scarce. Since the industrial revolution, food has been plentiful, and obesity has increased because of the innate nature to store triacylglycerols in the face of excessive caloric intake. However, whereas an in- creased intake of calories as fat can cause obesity and obesity can lead to insulin resistance, it is our hypothesis that only sugars can directly lead to insulin resistance. In addition, for the past 20 y, there has been a push to lower fat intake, and the result of these SUGAR AND THE CARDIORENAL DISEASE EPIDEMIC 903 a t C A L IF O R N IA S T
  • 35. fro m http://ajcn.nutrition.org/ programs has been a marked increase in the prevalence of obe- sity. Interestingly, during this period, the level of fructose intake increased considerably. Another difficulty in showing causation in human studies of the effect of fructose on the incidence of cardiorenal disease, independent of obesity, is that obesity and fructose intake track together. Thus, whereas animal studies have shown a causal effect of fructose on cardiorenal markers, independent of obesity, causation cannot be shown in human studies. CONCLUSION In conclusion, we propose that sugar intake, and particularly that of fructose, may have an important participatory role in the current cardiorenal disease epidemic and may also explain why certain subgroups, such as African Americans, are particularly prone to disease. This pathway may well be mediated, in part, by the unique ability of fructose to raise uric acid. This may also explain why rodents are relatively resistant to fructose, because these animals have lower uric acid concentrations owing to the presence of an enzyme (uricase) that degrades uric acid to allan- toin. Indeed, when uricase is inhibited in the rat, fructose will cause a 5-fold greater increase in uric acid concentrations (57).
  • 36. The observation that uric acid may play a key role in the process suggests that other mechanisms that raise uric acid con- centrations may also play a role in the epidemic. In this regard, 17th and 18th century England is also famous for the enormous importation of fortified wines such as port and Madeira rich in sugar and lead (126). Lead can also cause hyperuricemia and hypertension. We have been able to block lead-induced hyper- tension by lowering uric acid concentrations (126). This would suggest that a low level of lead ingestion may act as an additional synergistic factor, particularly during the early part of the epi- demic. Uric acid concentrations have increased within the gen- eral population in parallel with the epidemic of cardiorenal dis- ease (8, 127). If the hypothesis is correct that fructose has a role in the epidemic of cardiovascular disease, then a number of predictions should arise from future studies. First, fructose intake will be a risk factor for hypertension, insulin resistance, hypertriacylglyc- erolemia, obesity, type 2 diabetes, preeclampsia, chronic kidney disease, stroke, cardiovascular disease, and mortality. Second, reducing uric acid in patients with uric acid concentrations �6.0 mg/dL will improve endothelial dysfunction, decrease systemic vascular resistance, lower blood pressure, lower triacylglycerol concentrations, improve body weight, lower the risk of the pro- gression of renal disease, and reduce cardiovascular disease risk. Third, low-fructose diets coupled with mild purine restriction will improve weight and reduce cardiovascular disease risk. Fourth, fructokinase will be identified as a key enzyme mediating the cardiorenal disease syndrome; genetic polymorphisms will be associated with cardiovascular disease risk, and blocking the enzyme will provide a novel way to prevent cardiorenal disease.
  • 37. Clearly, much more work needs to be done to prove or disprove this hypothesis. The authors’ responsibilities were as follows—RJJ, MSS, and LGS-L: primary preparation of the manuscript; and YS, TN, DIF, D-HK, MSG, and SB: generation of ideas incorporated into this manuscript and the final ap- proval of the manuscript. RJJ is a consultant for Nephromics Inc. None of the other authors had a conflict of interest. REFERENCES 1. Foster GD, Wyatt HR, Hill JO, et al. A randomized trial of a low- carbohydrate diet for obesity. N Engl J Med 2003;348:2082–90. 2. Chobanian AV, Bakris GL, Black HR, et al. The Seventh Report of the Joint National Committee on Prevention, Detection, Evaluation, and Treatment of High Blood Pressure: the JNC 7 report. JAMA 2003;289: 2560 –72. 3. Alderman MH, Cohen H, Madhavan S, Kivlighn S. Serum uric acid and cardiovascular events in successfully treated hypertensive patients. Hypertension 1999;34:144 –50. 4. Heart disease and stroke statistics—2006 update. A report from the American Heart Association Statistics Committee and Stroke
  • 38. Statistics Subcommittee. Circulation 2006;113:e85. 5. US Renal Data System. USRDS 2004 annual data report: atlas of end-stage renal disease in the United States. Bethesda, MD: National Institutes of Health, National Institute of Diabetes and Digestive and Kidney Diseases, 2004. 6. Coresh J, Astor BC, Greene T, Eknoyan G, Levey AS. Prevalence of chronic kidney disease and decreased kidney function in the adult US population: Third National Health and Nutrition Examination Survey. Am J Kidney Dis 2003;41:1–12. 7. Ruggenenti P, Perna A, Gherardi G, et al. Renoprotective properties of ACE-inhibition in non-diabetic nephropathies with non- nephrotic pro- teinuria. Lancet 1999;354:359 – 64. 8. Johnson RJ, Titte S, Cade JR, Rideout BA, Oliver WJ. Uric acid, evolution and primitive cultures. Semin Nephrol 2005;25:3– 8. 9. Symonds B. The blood pressure of healthy men and women. JAMA 1923;80:232– 6. 10. Robinson SC, Brucer M. Range of normal blood pressure. A statistical and clinical study of 11,383 persons. Arch Int Med 1939;64:409
  • 39. – 44. 11. Taylor J. The hypertension detection and follow-up program: a progress report. Circ Res 1977;40(suppl):I106 –9. 12. Burt VL, Whelton P, Roccella EJ, et al. Prevalence of hypertension in the US adult population. Results from the Third National Health and Nutrition Examination Survey, 1988 –1991. Hypertension 1995;25: 305–13. 13. Fields LE, Burt VL, Cutler JA, Hughes J, Roccella EJ, Sorlie P. The burden of adult hypertension in the United States 1999 to 2000: a rising tide. Hypertension 2004;44:398 – 404. 14. Huchard H. Arteriolosclerosis: including its cardiac form. JAMA 1909; 53:1129 –32. 15. Mahomed FA. On chronic Bright’s disease, and its essential symptoms. Lancet 1879;1:398 – 404. 16. Traube L. Uber den Zusammenhang von Herz-und Nierenkrankheiten. (The overriding connection between heart and kidney diseases.) Berlin, Germany: August Hirschwald, 1856 (in German). 17. Helmchen LA, Henderson RM. Changes in the distribution of body
  • 40. mass index of white US men, 1890 –2000. Ann Hum Biol 2004;31: 174 – 81. 18. Flegal KM, Troiano RP. Changes in the distribution of body mass index of adults and children in the US population. Int J Obes Relat Metab Disord 2000;24:807–18. 19. Osler W. The principles and practice of medicine. New York, NY: D Appleton, 1893. 20. Yusuf S, Reddy S, Ounpuu S, Anand S. Global burden of cardiovas- cular diseases: part I: general considerations, the epidemiologic tran- sition, risk factors, and impact of urbanization. Circulation 2001;104: 2746 –53. 21. US Renal Data System. USRDS 2006 annual data report: atlas of end-stage renal disease in the United States. Bethesda, MD: National Institute of Diabetes and Digestive and Kidney Diseases, 2006. 22. Hood P. A treatise on gout, rheumatism and the allied affections. Lon- don, United Kingdom: J and A Churchill, 1871. 23. Platt R. Coronary disease and modern stress. Lancet 1951;1:51. 24. Steiner H, Kispal G, Zollner A, Haid A, Neupert W, Lill R. Heme
  • 41. binding to a conserved Cys-Pro-Val motif is crucial for the catalytic function of mitochondrial heme lyases. J Biol Chem 1996;271:32605– 11. 25. Clinical guidelines on the identification, evaluation, and treatment of overweight and obesity in adults—The Evidence Report. National In- stitutes of Health. Obes Res 1998;6(suppl):51S–209S. 26. Revel JF. Culture and cuisine. New York, NY: Doubleday, 1982. 27. Galloway JH. The sugar cane industry. Cambridge, United Kingdom: Cambridge University Press, 1989. 904 JOHNSON ET AL a t C A L IF O R N IA S
  • 44. e d fro m http://ajcn.nutrition.org/ 28. Sheridan RB. Sugar and slavery. Baltimore, MD: The Johns Hopkins University Press, 1973. 29. Deer N. The history of sugar. London, United Kingdom: Chapman and Hall, 1949-50. 30. Yudkin J. Sugar and disease. Nature 1972;239:197–9. 31. Deerr N. The history of sugar. London, United Kingdom: Chapman and Hall, 1950. 32. Hallfrisch J. Metabolic effects of dietary fructose. FASEB J 1990;4: 2652– 60. 33. Mintz SW. Sweetness and power: the place of sugar in modern history. New York, NY: Penguin Books, 1986. 34. Yudkin J. Evolutionary and historical changes in dietary carbohydrates. Am J Clin Nutr 1967;20:108 –15. 35. Jabara C, Valdes A. World sugar policies and developing
  • 45. countries. In: Marks SV, Maskus KE, eds. The economics and politics of world sugar policies. Ann Arbor, MI: The University of Michigan Press, 1993. 36. US Census Bureau. Statistical abstract of the United States. 2003;no 214. 37. Elliott SS, Keim NL, Stern JS, Teff K, Havel PJ. Fructose, weight gain, and the insulin resistance syndrome. Am J Clin Nutr 2002;76:911–22. 38. Keys A. Atherosclerosis: a problem in newer public health. J Mt Sinai Hosp N Y 1953;20:118 –39. 39. Yudkin J. Patterns and trends in carbohydrate consumption and their relation to disease. Proc Nutr Soc 1964;23:149 – 62. 40. Wood RJ, Fernandez ML, Sharman MJ, et al. Effects of a carbohydrate- restricted diet with and without supplemental soluble fiber on plasma low-density lipoprotein cholesterol and other clinical markers of car- diovascular risk. Metabolism 2007;56:58 – 67. 41. Sharman MJ, Gomez AL, Kraemer WJ, Volek JS. Very low- carbohydrate and low-fat diets affect fasting lipids and postprandial lipemia differently in overweight men. J Nutr 2004;134:880 –5.
  • 46. 42. Bray GA, Nielsen SJ, Popkin BM. Consumption of high- fructose corn syrup in beverages may play a role in the epidemic of obesity. Am J Clin Nutr 2004;79:537– 43. 43. Schulze MB, Manson JE, Ludwig DS, et al. Sugar- sweetened bever- ages, weight gain, and incidence of type 2 diabetes in young and middle-aged women. JAMA 2004;292:927–34. 44. Dennison BA, Rockwell HL, Baker SL. Excess fruit juice consumption by preschool-aged children is associated with short stature and obesity. Pediatrics 1997;99:15–22. 45. Ludwig DS, Peterson KE, Gortmaker SL. Relation between consump- tion of sugar-sweetened drinks and childhood obesity: a prospective, observational analysis. Lancet 2001;357:505– 8. 46. Akinyanju PA, Qureshi RU, Salter AJ, Yudkin J. Effect of an “athero- genic” diet containing starch or sucrose on the blood lipids of young men. Nature 1968;218:975–7. 47. Raben A, Vasilaras TH, Moller AC, Astrup A. Sucrose compared with artificial sweeteners: different effects on ad libitum food intake and body weight after 10 wk of supplementation in overweight subjects.
  • 47. Am J Clin Nutr 2002;76:721–9. 48. Israel KD, Michaelis OEt, Reiser S, Keeney M. Serum uric acid, inor- ganic phosphorus, and glutamic-oxalacetic transaminase and blood pressure in carbohydrate-sensitive adults consuming three different levels of sucrose. Ann Nutr Metab 1983;27:425–35. 49. Cohen AM, Teitelbaum A, Balogh M, Groen JJ. Effect of interchanging bread and sucrose as main source of carbohydrate in a low fat diet on the glucose tolerance curve of healthy volunteer subjects. Am J Clin Nutr 1966;19:59 – 62. 50. Faeh D, Minehira K, Schwarz JM, Periasamy R, Park S, Tappy L. Effect of fructose overfeeding and fish oil administration on hepatic de novo lipogenesis and insulin sensitivity in healthy men. Diabetes 2005;54: 1907–13. 51. Nakagawa T, Hu H, Zharikov S, et al. A causal role for uric acid in fructose-induced metabolic syndrome. Am J Physiol Renal Physiol 2006;290:F625–31. 52. Sanchez-Lozada LG, Tapia E, Jimenez A, et al. Fructose- induced met- abolic syndrome is associated with glomerular hypertension and renal
  • 48. microvascular damage in rats. Am J Physiol Renal Physiol 2007;292: F423–9. 53. Gersch MS, Mu W, Cirillo P, et al. Fructose but not dextrose accelerates the progression of chronic kidney diesase. Am J Physiol Renal Physiol 2007 Aug 1 (Epub ahead of print; DOI:10.1152/ajprenal.00181.2007). 54. Teff KL, Elliott SS, Tschop M, et al. Dietary fructose reduces circu- lating insulin and leptin, attenuates postprandial suppression of ghrelin, and increases triglycerides in women. J Clin Endocrinol Metab 2004; 89:2963–72. 55. Jurgens H, Haass W, Castaneda TR, et al. Consuming fructose- sweetened beverages increases body adiposity in mice. Obes Res 2005; 13:1146 –56. 56. Stirpe F, Della Corte E, Bonetti E, Abbondanza A, Abbati A, De Stefano F. Fructose-induced hyperuricaemia. Lancet 1970;2:1310 –1. 57. Stavric B, Johnson WJ, Clayman S, Gadd RE, Chartrand A. Effect of fructose administration on serum urate levels in the uricase inhibited rat. Experientia 1976;32:373– 4.
  • 49. 58. Perheentupa J, Raivio K. Fructose-induced hyperuricaemia. Lancet 1967;2:528 –31. 59. Ames BN, Cathcart R, Schwiers E, Hochstein P. Uric acid provides an antioxidant defense in humans against oxidant- and radical- caused aging and cancer: a hypothesis. Proc Natl Acad Sci U S A 1981;78: 6858 – 62. 60. Mazzali M, Kanellis J, Han L, et al. Hyperuricemia induces a primary renal arteriolopathy in rats by a blood pressure-independent mecha- nism. Am J Physiol Renal Physiol 2002;282:F991–7. 61. Rao GN, Corson MA, Berk BC. Uric acid stimulates vascular smooth muscle cell proliferation by increasing platelet-derived growth factor A-chain expression. J Biol Chem 1991;266:8604 – 8. 62. Watanabe S, Kang DH, Feng L, et al. Uric acid, hominoid evolution, and the pathogenesis of salt-sensitivity. Hypertension 2002;40:355– 60. 63. Zare F, Magnusson M, Bergstrom T, et al. Uric acid, a nucleic acid degradation product, down-regulates dsRNA-triggered arthritis. J Leu- koc Biol 2006;79:482– 8.
  • 50. 64. Kang DH, Park SK, Lee IK, Johnson RJ. Uric acid-induced C-reactive protein expression: implication on cell proliferation and nitric oxide production of human vascular cells. J Am Soc Nephrol 2005;16:3553– 62. 65. Khosla UM, Zharikov S, Finch JL, et al. Hyperuricemia induces endo- thelial dysfunction. Kidney Int 2005;67:1739 – 42. 66. Sautin Y, Nakagawa T, Zharikov S, Johnson RJ. Adverse effects of the classic antioxidant uric acid in adipocytes: NADPH oxidase- mediated oxidative/nitrosative stress. Am J Physiol Cell Physiol 2007;293: C584 –96. 67. Mazzali M, Hughes J, Kim YG, et al. Elevated uric acid increases blood pressure in the rat by a novel crystal-independent mechanism. Hyper- tension 2001;38:1101– 6. 68. Sanchez-Lozada LG, Tapia E, Avila-Casado C, et al. Mild hyperuri- cemia induces glomerular hypertension in normal rats. Am J Physiol Renal Physiol 2002;283:F1105–10. 69. Kang DH, Nakagawa T, Feng L, et al. A role for uric acid in the progression of renal disease. J Am Soc Nephrol 2002;13:2888 –
  • 51. 97. 70. Alper AB Jr, Chen W, Yau L, Srinivasan SR, Berenson GS, Hamm LL. Childhood uric acid predicts adult blood pressure: the Bogalusa Heart Study. Hypertension 2005;45:34 – 8. 71. Hunt SC, Stephenson SH, Hopkins PN, Williams RR. Predictors of an increased risk of future hypertension in Utah. A screening analysis. Hypertension 1991;17:969 –76. 72. Imazu M, Yamamoto H, Toyofuku M, et al. Hyperinsulinemia for the development of hypertension: data from the Hawaii-Los Angeles- Hiroshima Study. Hypertens Res 2001;24:531– 6. 73. Jossa F, Farinaro E, Panico S, et al. Serum uric acid and hypertension: the Olivetti heart study. J Hum Hypertens 1994;8:677– 81. 74. Masuo K, Kawaguchi H, Mikami H, Ogihara T, Tuck ML. Serum uric acid and plasma norepinephrine concentrations predict subsequent weight gain and blood pressure elevation. Hypertension 2003;42:474 – 80. 75. Nagahama K, Inoue T, Iseki K, et al Hyperuricemia as a predictor of hypertension in a screened cohort in Okinawa, Japan. Hypertens Res
  • 52. 2004;27:835– 41. 76. Nakanishi N, Okamoto M, Yoshida H, Matsuo Y, Suzuki K, Tatara K. Serum uric acid and risk for development of hypertension and impaired fasting glucose or type II diabetes in Japanese male office workers. 2003;18:523–30. 77. Selby JV, Friedman GD, Quesenberry CP Jr. Precursors of essential hypertension: pulmonary function, heart rate, uric acid, serum choles- terol, and other serum chemistries. Am J 1990;131:1017–27. 78. Sundstrom J, Sullivan L, D’Agostino RB, Levy D, Kannel WB, Vasan RS. Relations of serum uric acid to longitudinal blood pressure tracking and hypertension incidence. Hypertension 2005;45:28 –33. SUGAR AND THE CARDIORENAL DISEASE EPIDEMIC 905 a t C A L IF O R N IA
  • 55. a d e d fro m http://ajcn.nutrition.org/ 79. Taniguchi Y, Hayashi T, Tsumura K, Endo G, Fujii S, Okada K. Serum uric acid and the risk for hypertension and type 2 diabetes in Japanese men: the Osaka Health Survey. J Hypertens 2001;19:1209 –15. 80. Perlstein T, Gumieniak O, Williams G, et al. Uric acid and the devel- opment of hypertension: the Normative Aging Study. Hypertension 2006;48:1031– 6. 81. Mellen PB, Bleyer AJ, Erlinger TP, et al. Serum uric acid predicts incident hypertension in a biethnic cohort: the Atherosclerosis Risk in Communities study. Hypertension 2006;48:1037– 42. 82. Dyer AR, Liu K, Walsh M, Kiefe C, Jacobs DR Jr, Bild DE. Ten-year incidence of elevated blood pressure and its predictors: the CARDIA study. Coronary Artery Risk Development in (Young) Adults. J Hum
  • 56. Hypertens 1999;13:13–21. 83. Shankar A, Klein R, Klein BE, Nieto FJ. The association between serum uric acid level and long-term incidence of hypertension: population-based cohort study. J Hum Hypertens 2006;20:937– 45. 84. Krishnan E, Kwoh CK, Schumacher HR, Kuller L. Hyperuricemia and incidence of hypertension among men without metabolic syndrome. Hypertension 2007;49:298 –303. 85. Forman JP, Choi H, Curhan GC. Plasma uric acid level and risk for incident hypertension among men. J Am Soc Nephrol 2007;18:287–92. 86. Masuo K, Kawaguchi H, Mikami H, Ogihara T, Tuck ML. Serum uric acid and plasma norepinephrine concentrations predict subsequent weight gain and blood pressure elevation. Hypertension 2003;42:474 – 80. 87. Ford ES, Li C, Cook S, Choi HK. Serum concentrations of uric acid and the metabolic syndrome among US children and adolescents. Circula- tion 2007;115:2526 –32. 88. Iseki K, Oshiro S, Tozawa M, Iseki C, Ikemiya Y, Takishita S. Signif- icance of hyperuricemia on the early detection of renal failure
  • 57. in a cohort of screened subjects. Hypertens Res 2001;24:691–7. 89. Feig DI, Johnson RJ. Hyperuricemia in childhood primary hyperten- sion. Hypertension 2003;42:247–52. 90. Feig DI, Nakagawa T, Karumanchi SA, et al. Hypothesis: uric acid, nephron number, and the pathogenesis of essential hypertension. Kid- ney Int 2004;66:281–7. 91. Siu YP, Leung KT, Tong MK, Kwan TH. Use of allopurinol in slowing the progression of renal disease through its ability to lower serum uric acid level. Am J Kidney Dis 2006;47:51–9. 92. Erdogan D, Gullu H, Caliskan M, et al. Relationship of serum uric acid to measures of endothelial function and atherosclerosis in healthy adults. Int J Clin Pract 2005;59:1276 – 82. 93. Zoccali C, Maio R, Mallamaci F, Sesti G, Perticone F. Uric acid and endothelial dysfunction in essential hypertension. J Am Soc Nephrol 2006;17:1466 –71. 94. Butler R, Morris AD, Belch JJ, Hill A, Struthers AD. Allopurinol normalizes endothelial dysfunction in type 2 diabetics with mild hy- pertension. Hypertension 2000;35:746 –51.
  • 58. 95. Doehner W, Schoene N, Rauchhaus M, et al. Effects of xanthine oxi- dase inhibition with allopurinol on endothelial function and peripheral blood flow in hyperuricemic patients with chronic heart failure: results from 2 placebo-controlled studies. Circulation 2002;105:2619 – 24. 96. Farquharson CA, Butler R, Hill A, Belch JJ, Struthers AD. Allopurinol improves endothelial dysfunction in chronic heart failure. Circulation 2002;106:221– 6. 97. Guthikonda S, Sinkey C, Barenz T, Haynes WG. Xanthine oxidase inhibition reverses endothelial dysfunction in heavy smokers. Circula- tion 2003;107:416 –21. 98. Mercuro G, Vitale C, Cerquetani E, et al. Effect of hyperuricemia upon endothelial function in patients at increased cardiovascular risk. Am J Cardiol 2004;94:932–5. 99. Cook S, Hugli O, Egli M, et al. Clustering of cardiovascular risk factors mimicking the human metabolic syndrome X in eNOS null mice. Swiss Med Wkly 2003;133:360 –3. 100. Quiroz Y, Pons H, Gordon KL, et al. Mycophenolate mofetil prevents
  • 59. salt-sensitive hypertension resulting from nitric oxide synthesis inhi- bition. Am J Physiol Renal Physiol 2001;281:F38 – 47. 101. Roy D, Perreault M, Marette A. Insulin stimulation of glucose uptake in skeletal muscles and adipose tissues in vivo is NO dependent. Am J Physiol 1998;274:E692–9. 102. Zammit VA, Waterman IJ, Topping D, McKay G. Insulin stimulation of hepatic triacylglycerol secretion and the etiology of insulin resis- tance. J Nutr 2001;131:2074 –7. 103. Johnson RJ, Herrera-Acosta J, Schreiner GF, Rodriguez- Iturbe B. Sub- tle acquired renal injury as a mechanism of salt-sensitive hypertension. N Engl J Med 2002;346:913–23. 104. Klahr S, Schreiner G, Ichikawa I. The progression of renal disease. N Engl J Med 1988;318:1657– 66. 105. Dreeben O. Health status of African Americans. J Health Soc Policy 2001;14:1–17. 106. Donnison C. Blood pressure in the African native. Lancet 1929;1:6 –7. 107. Williams A. The blood pressure of Africans. East Afr Med J 1941;18:
  • 60. 109 –17. 108. Adams J. Some racial differences in blood pressure and morbidity in a group of white and colored workers. Am J Med Sci 1930;184:342–50. 109. Saunders G, Bancroft H. Blood pressure in African Americans. Nutr Rev 1942;23:410 –23. 110. Dresser C. Food consumption profiles of white and black persons aged 1-74 years: United States 1971-1974 Vital and Health Statistics Series 11, no 210. Hyattsville, MD: National Center for Health Statistics, 1979. 111. Kerr GR, Amante P, Decker M, Callen PW. Supermarket sales of high-sugar products in predominantly black, Hispanic, and white cen- sus tracts of Houston, TX. Am J Clin Nutr 1983;37:622–31. 112. Bell AC, Swinburn BA, Amosa H, Scragg R, Sharpe SJ. The impact of modernisation on the diets of adults aged 20 – 40 years from Samoan church communities in Auckland. Asia Pac J Public Health 1999;11: 4 –9. 113. Lee AJ, O’Dea K, Mathews JD. Apparent dietary intake in remote aboriginal communities. Aust J Public Health 1994;18:190 –7.
  • 61. 114. Fang J, Alderman MH. Serum uric acid and cardiovascular mortality the NHANES I epidemiologic follow-up study, 1971–1992. National Health and Nutrition Examination Survey. JAMA 2000;283:2404 –10. 115. Norris KC, Greene T, Kopple J, et al. Baseline predictors of renal disease progression in the African American Study of Hypertension and Kidney Disease. J Am Soc Nephrol 2006;17:2928 –36. 116. Wilson TW, Grim CE. Biohistory of slavery and blood pressure dif- ferences in blacks today. A hypothesis. Hypertension 1991;17(suppl): I122– 8. 117. Suthanthiran M, Li B, Song JO, et al. Transforming growth factor-beta 1 hyperexpression in African-American hypertensives: a novel medi- ator of hypertension and/or target organ damage. Proc Natl Acad Sci U S A 2000;97:3479 – 84. 118. Zacchigna L, Vecchione C, Notte A, et al. Emilin1 links TGF-beta maturation to blood pressure homeostasis. Cell 2006;124:929 – 42. 119. Fogo A, Breyer JA, Smith MC, et al. Accuracy of the diagnosis of hypertensive nephrosclerosis in African Americans: a report
  • 62. from the African American Study of Kidney Disease (AASK) Trial. AASK Pilot Study Investigators. Kidney Int 1997;51:244 –52. 120. Zandi-Nejad K, Luyckx VA, Brenner BM. Adult hypertension and kidney disease: the role of fetal programming. Hypertension 2006;47: 502– 8. 121. Barker DJ, Osmond C, Golding J, Kuh D, Wadsworth ME. Growth in utero, blood pressure in childhood and adult life, and mortality from cardiovascular disease. BMJ 1989;298:564 –7. 122. Franco MC, Christofalo DM, Sawaya AL, Ajzen SA, Sesso R. Effects of low birth weight in 8- to 13-year-old children: implications in en- dothelial function and uric acid levels. Hypertension 2006;48:45–50. 123. Feig DI, Rodriguez-Iturbe B, Nakagawa T, Johnson RJ. Nephron num- ber, uric acid, and renal microvascular disease in the pathogenesis of essential hypertension. Hypertension 2006;48:25– 6. 124. Dressler WW. Hypertension in the African American community: so- cial, cultural, and psychological factors. Semin Nephrol 1996;16:71– 82.
  • 63. 125. Tucker K. Dietary patterns and blood pressure in African Americans. Nutr Rev 1999;57:356 – 8. 126. Ball GV. Two epidemics of gout. Bull Hist Med 1971;45:401– 8. 127. Roncal C, Mu W, Reungjui S, et al. Lead, at low levels, accelerates arteriolopathy and tubulointerstitial injury in chronic kidney disease. Am J Physiol Renal Physiol 2007 Aug 22 (Epub ahead of print; DOI: 10.1152/ajprenal.00216.2007). 906 JOHNSON ET AL a t C A L IF O R N IA S T A T
  • 66. http://ajcn.nutrition.org/ Commentary Consumption of high-fructose corn syrup in beverages may play a role in the epidemic of obesity1,2 George A Bray, Samara Joy Nielsen, and Barry M Popkin ABSTRACT Obesity is a major epidemic, but its causes are still unclear. In this article, we investigate the relation between the intake of high- fructose corn syrup (HFCS) and the development of obesity. We analyzed food consumption patterns by using US Department of Agriculture food consumption tables from 1967 to 2000. The con- sumption of HFCS increased � 1000% between 1970 and 1990, far exceeding the changes in intake of any other food or food group. HFCS now represents � 40% of caloric sweeteners added to foods and beverages and is the sole caloric sweetener in soft drinks in the United States. Our most conservative estimate of the consumption of HFCS indicates a daily average of 132 kcal for all Americans aged � 2 y, and the top 20% of consumers of caloric sweeteners ingest
  • 67. 316 kcal from HFCS/d. The increased use of HFCS in the United States mirrors the rapid increase in obesity. The digestion, absorption, and metabolism of fructose differ from those of glucose. Hepatic metabo- lism of fructose favors de novo lipogenesis. In addition, unlike glucose, fructose does not stimulate insulin secretion or enhance leptin produc- tion. Because insulin and leptin act as key afferent signals in the regu- lation of food intake and body weight, this suggests that dietary fructose may contribute to increased energy intake and weight gain. Further- more, calorically sweetened beverages may enhance caloric overcon- sumption. Thus, the increase in consumption of HFCS has a temporal relation to the epidemic of obesity, and the overconsumption of HFCS in calorically sweetened beverages may play a role in the epidemic of obesity. Am J Clin Nutr 2004;79:537– 43. KEY WORDS Epidemiology, food intake, obesity, artificial sweeteners, fructose INTRODUCTION As obesity has escalated to epidemic proportions around the world, many causes, including dietary components, have been suggested. Excessive caloric intake has been related to high-fat foods, increased portion sizes, and diets high both in simple sugars such as sucrose and in high-fructose corn syrup (HFCS)
  • 68. as a source of fructose (1–3). In this article, we discuss the evidence that a marked increase in the use of HFCS, and therefore in total fructose consumption, preceded the obesity epidemic and may be an important contributor to this epidemic in the United States. To provide a common frame of reference for the terms used in this paper, the following definitions should be understood. Sugar is any free monosaccharide or disaccharide present in a food. Sugars includes at least one sugar; composite sugars refers to the aggregate of all forms of sugars in a food and is thus distinguish- able from specific types of sugar, such as fructose, glucose, or sucrose. Added sugar is sugar added to a food and includes sweeteners such as sucrose, HFCS, honey, molasses, and other syrups. Naturally occurring sugar is sugar occurring in food and not added in processing, preparation, or at the table. Total sugars represents the total amount of sugars present in a food and in- cludes both naturally occurring and added sugars. Free fructose is fructose that exists in food as the monosaccharide. Fructose refers to both the free and bound forms of fructose (4). Added sweeteners are important components of our diet, rep- resenting 318 kcal of dietary intake for the average American aged � 2 y, or 16% of all caloric intake as measured by a na- tionally representative survey in 1994 –1996 (5). Sweet corn- based syrups were developed during the past 3 decades and now represent close to one-half of the caloric sweeteners consumed by Americans (6, 7). HFCS made by enzymatic isomerization of
  • 69. glucose to fructose was introduced as HFCS-42 (42% fructose) and HFCS-55 (55% fructose) in 1967 and 1977, respectively, and opened a new frontier for the sweetener and soft drink industries. Using a glucose isomerase, the starch in corn can be efficiently converted to glucose and then to various amounts of fructose. The hydrolysis of sucrose produces a 50:50 molar mixture of fructose and glucose. The development of these inexpensive, sweet corn- based syrups made it profitable to replace sucrose (sugar) and simple sugars with HFCS in our diet, and they now represent 40% of all added caloric sweeteners (8). Fructose is sweeter than sucrose. In comparative studies of sweetness, in which the sweet- ness of sucrose was set at 100, fructose had a sweetness of 173 and glucose had a sweetness of 74 (9). If the values noted above are applied, HFCS-42 would be 1.16 times as sweet as sucrose, and HFCS-55 would be 1.28 times as sweet as sucrose. This contrasts with the estimates reported by Hanover and White (10). In their study, the sweetness of sucrose was set at 100 as in reference 8. Fructose, however, had a sweetness of only 117, whereas a 50:50 mixture of fructose and sucrose had a sweetness of 128. It is difficult to see why fructose and sucrose combined would be sweeter than either one alone and as sweet as HFCS- 55. On the basis of data in Agriculture Handbook no. 8 from the US Department of Agriculture (USDA) (11), a cola beverage in 1963 1 From the Pennington Biomedical Research Center, Louisiana State Uni-
  • 70. versity, Baton Rouge, LA (GAB), and the Department of Nutrition, Univer- sity of North Carolina, Chapel Hill (SJN and BMP). 2 Reprints not available. Address correspondence to GA Bray, Pennington Biomedical Research Center, 6400 Perkins Road, Baton Rouge, LA 70808. E-mail: [email protected] Received October 3, 2003. Accepted for publication December 15, 2003. 537Am J Clin Nutr 2004;79:537– 43. Printed in USA. © 2004 American Society for Clinical Nutrition a t C A L IF O R N IA S T A T E U
  • 73. http://ajcn.nutrition.org/ had 39 kcal/100 g, whereas a cola beverage in 2003 had 41 kcal/ 100 g. Because the number of calories per 100 g has not changed substantially over the past 40 y, current beverages are probably sweeter, depending on the temperature at which they are served. HFCS has become a favorite substitute for sucrose in carbon- ated beverages, baked goods, canned fruits, jams and jellies, and dairy products (10). The major user of HFCS in the world is the United States; however, HFCS is now manufactured and used in many countries throughout the world (7). In the United States, HFCS is the major source of caloric sweeteners in soft drinks and many other sweetened beverages and is also included in numer- ous other foods; therefore, HFCS constitutes a major source of dietary fructose. Few data are available on foods containing HFCS in countries other than the United States (7). THE BIOLOGY Absorption of fructose The digestive and absorptive processes for glucose and fruc- tose are different. When disaccharides such as sucrose or maltose enter the intestine, they are cleaved by disaccharidases. A sodium- glucose cotransporter absorbs the glucose that is formed from cleav- age of sucrose. Fructose, in contrast, is absorbed further down in the duodenum and jejunum by a non-sodium-dependent process.
  • 74. After absorption, glucose and fructose enter the portal circulation and either are transported to the liver, where the fructose can be taken up and converted to glucose, or pass into the general circulation. The addition of small, catalytic amounts of fructose to orally ingested glucose increases hepatic glycogen synthesis in human subjects and reduces glycemic responses in subjects with type 2 diabetes mellitus (12), which suggests the importance of fructose in modulating me- tabolism in the liver. However, when large amounts of fructose are ingested, they provide a relatively unregulated source of carbon precursors for hepatic lipogenesis. Fructose and insulin release Along with 2 peptides, glucose-dependent insulinotropic polypeptide and glucagon-like peptide-1 released from the gas- trointestinal tract, circulating glucose increases insulin release from the pancreas (13, 14). Fructose does not stimulate insulin secretion in vitro, probably because the � cells of the pancreas lack the fructose transporter Glut-5 (15, 16). Thus, when fructose is given in vivo as part of a mixed meal, the increase in glucose and insulin is much smaller than when a similar amount of glu- cose is given. However, fructose produces a much larger increase in lactate and a small (1.7%) increase in diet-induced thermo- genesis (17), which again suggests that glucose and fructose have different metabolic effects.
  • 75. Insulin and leptin Insulin release can modulate food intake by at least 2 mecha- nisms. First, Schwartz et al (18) have argued that insulin con- centrations in the central nervous system have a direct inhibitory effect on food intake. In addition, insulin may modify food intake by its effect on leptin secretion, which is mainly regulated by insulin-induced changes in glucose metabolism in fat cells (19, 20). Insulin increases leptin release (21) with a time delay of several hours. Thus, a low insulin concentration after ingestion of fructose would be associated with lower average leptin concen- trations than would be seen after ingestion of glucose. Because leptin inhibits food intake, the lower leptin concentrations induced by fructose would tend to enhance food intake. This is most dramat- ically illustrated in humans who lack leptin (22, 23). Persons lacking leptin (homozygotes) are massively obese (22), and heterozygotes with low but detectable serum leptin concentrations have increased adiposity (23), which indicates that low leptin concentrations are associated with increased hunger and gains in body fat. Adminis- tration of leptin to persons who lack it produces a dramatic decrease in food intake, as expected. Leptin also increases energy expendi- ture, and during reduced calorie intake, leptin attenuates the de-
  • 76. creases in thyroid hormones and 24-h energy expenditure (24). To the extent that fructose increases in the diet, one might expect less insulin secretion and thus less leptin release and a reduction in the inhibitory effect of leptin on food intake, ie, an increase in food intake. This was found in the preliminary studies reported by Teff et al (25). Consumption of high-fructose meals reduced 24-h plasma insulin and leptin concentrations and increased postprandial fasting triacylglycerol concentrations in women but did not suppress circu- lating ghrelin concentrations. Fructose and metabolism The metabolism of fructose differs from that of glucose in several other ways as well (3). Glucose enters cells by a transport mechanism (Glut-4) that is insulin dependent in most tissues. Insulin activates the insulin receptor, which in turn increases the density of glucose transporters on the cell surface and thus facilitates the entry of glucose. Once inside the cell, glucose is phosphorylated by glucokinase to become glucose-6-phosphate, from which the intracellular metabolism of glucose begins. Intracellular enzymes can tightly control conversion of glucose-6-phosphate to the glyc- erol backbone of triacylglycerols through modulation by phospho-
  • 77. fructokinase. In contrast with glucose, fructose enters cells via a Glut-5 transporter that does not depend on insulin. This transporter is absent from pancreatic � cells and the brain, which indicates limited entry of fructose into these tissues. Glucose provides “sati- ety” signals to the brain that fructose cannot provide because it is not transported into the brain. Once inside the cell, fructose is phosphor- ylated to form fructose-1-phosphate (26). In this configuration, fruc- tose is readily cleaved by aldolase to form trioses that are the back- bone for phospholipid and triacyglycerol synthesis. Fructose also provides carbon atoms for synthesis of long-chain fatty acids, al- though in humans, the quantity of these carbon atoms is small. Thus, fructose facilitates the biochemical formation of triacylglycerols more efficiently than does glucose (3). For example, when a diet containing 17% fructose was provided to healthy men and women, the men, but not the women, showed a highly significant increase of 32% in plasma triacylglycerol concentrations (27). Overconsumption of sweetened beverages One model for producing obesity in rodents is to provide sweet- ened (sucrose, maltose, etc) beverages for them to drink (28). In this
  • 78. setting, the desire for the calorically sweetened solution reduces the intake of solid food, but not by enough to prevent a positive caloric balance and the slow development of obesity. Adding the same amount of sucrose or maltose as of a solid in the diet does not produce the same response. Thus, in experimental animals, sweet- ened beverages appear to enhance caloric consumption. Fructose and soft drinks A similar argument about the role of overconsumption of calorically sweetened beverages may apply to humans (29 –32). 538 BRAY ET AL a t C A L IF O R N IA S T A T
  • 81. http://ajcn.nutrition.org/ Mattes (29) reported that when humans ingest energy-containing beverages, energy compensation is less precise than when solid foods are ingested. In another study in humans, DiMeglio and Mattes (30) found that when 15 healthy men and women were given a carbohydrate load of 1880 kJ/d (450 kcal/d) as a calori- cally sweetened soda for 4 wk, they gained significantly more weight than when the same carbohydrate load was given in a solid form as jelly beans. Additional support for our hypothesis that calorically sweetened beverages may contribute to the epidemic of obesity comes from a longitudinal study in adolescents. Lud- wig et al (31) showed that in adolescents participating in the Planet Health project, the quantity of sugar-sweetened beverages ingested predicted initial body mass index (BMI; in kg/m2) and gain in BMI during the follow-up period. Raben et al (32) de- signed a randomized, double-blind study to compare the effect of calorically sweetened beverages with that of diet drinks on weight gain in moderately overweight men and women. This European study found that drinking calorically sweetened bev- erages resulted in greater weight gain over the 10-wk study than did drinking diet drinks. Compared with the subjects who con- sumed diet drinks, those who consumed calorically sweetened beverages did not compensate for this consumption by reducing the intake of other beverages and foods and thus gained weight. The beverages in this study were sweetened with sucrose, whereas in the United States almost all calorically sweetened beverages are sweetened with HFCS. Thus, we need a second randomized controlled study that compares sucrose- and HFCS-
  • 82. sweetened beverages. This could establish whether the form of the caloric sweetener played a role in the weight gain observed in the study by Raben et al (32). The results of the studies by Raben et al (32) and Ludwig et al (31) suggest that the rapid increase in the intake of calorically sweetened soft drinks could be a contributing factor to the epi- demic of weight gain. Between 1970, when HFCS was intro- duced into the marketplace, and 2000, the per capita consumption of HFCS in the United States increased from 0.292 kg · person�1 · y�1 (0.6 lb · person�1 · y�1) to 33.4 kg · person�1 · y�1 (73.5 lb · person�1 · y�1), an increase of � 100-fold (8) (Table 1). The total consumption of fructose increased nearly 30%. The con- sumption of free fructose showed a greater increase, which re- flected the increasing use of HFCS (Figure 1). During the same interval, the consumption of sucrose decreased nearly 50%, and TABLE 1 Availability of high-fructose corn syrup (HFCS) in the US caloric sweetener supply1 Year HFCS Total caloric sweeteners HFCS as percentage of total caloric sweeteners Percentage of HFCS from HFCS-42 Percentage of HFCS from HFCS-55
  • 83. g � person�1 � d�1 g � person�1 � d�1 % % % 1966 0.0 165.9 0.0 — — 1970 0.8 175.1 0.4 100.0 0.0 1975 7.1 168.8 4.2 100.0 0.0 1980 27.3 176.0 15.5 71.2 28.8 1985 64.7 184.4 35.1 34.3 65.7 1990 71.0 195.7 36.3 41.0 59.0 1995 82.3 211.7 38.9 39.9 60.1 2000 91.6 218.0 42.0 38.8 61.2 1 Data from reference 8. HFCS-42 and HFCS-55, HFCS containing 42% and 55% fructose, respectively. FIGURE 1. Estimated intakes of total fructose (F), free fructose (Œ), and high-fructose corn syrup (HFCS, �) in relation to trends in the prevalence of overweight (■) and obesity (x) in the United States. Data from references 7 and 35. HIGH-FRUCTOSE CORN SYRUP AND OBESITY 539 a t C A L IF O R N IA S
  • 86. e d fro m http://ajcn.nutrition.org/ the intakes of sucrose and HFCS are now nearly identical. Al- though this shift has clearly led to a major increase in free- fructose consumption, it is unclear how much of the increase in consumption of calorically sweetened soft drinks is a result of the shift to beverages in which one-half of the fructose is free rather than bound with glucose as in sucrose. A recent review described many facets of this issue (3). HFCS USE AND INTAKE Availability of HFCS in the food supply In 1970 HFCS represented � 1% of all caloric sweeteners available for consumption in the United States, but the HFCS portion of the caloric sweetener market jumped rapidly in the 1980s and by 2000 represented 42.0% of all caloric sweeteners (Table 1) (8). HFCS-42 was initially the only HFCS component, but by the early 1980s, HFCS-55 had become the major source and constituted 61.2% of all HFCS in 2000. These data are based on per capita food disappearance data. In the absence of direct measures of HFCS intake, these data provide the best indirect measure of the HFCS available for consumption in the United
  • 87. States. The data are useful for studying trends but probably over- estimate intake patterns. Although it is useful to understand that HFCS intake represents more than two-fifths of the total intake of caloric sweeteners in the United States, it is also important to recognize that the proportion of HFCS in some foods is much higher than that in other foods. Foods containing HFCS In the United States, HFCS is found in almost all foods con- taining caloric sweeteners. These include most soft drinks and fruit drinks, candied fruits and canned fruits, dairy desserts and flavored yogurts, most baked goods, many cereals, and jellies. Over 60% of the calories in apple juice, which is used as the base for many of the fruit drinks, come from fructose, and thus apple juice is another source of fructose in the diet. Lists of HFCS- containing foods can be obtained from organizations concerned with HFCS-related allergies (33). It is clear that almost all caloric sweeteners used by manufacturers of soft drinks and fruit drinks are HFCS (4, 34). In fact, about two-thirds of all HFCS consumed in the United States are in beverages. Aside from beverages, there is no definitive literature on the proportion of caloric sweeteners that is HFCS in other processed foods. HFCS is found in most processed foods; however, the exact compositions are not avail- able from either the manufacturer or any publicly available food- composition table. Trends in obesity and HFCS availability
  • 88. There are important similarities between the trend in HFCS availability and the trends in the prevalence of obesity in the United States (Figure 1). Using age-standardized, nationally rep- resentative measures of obesity at 5 time points from 1960 to 1999 (35) and data on the availability of HFCS collected annually over this same period, we graphed both patterns. The data on obesity are from the National Center for Health Statistics for the following periods: 1960 –1962 (National Health Examination Survey I), 1971–1975 [National Health and Nutrition Examination Survey (NHANES)], 1976 –1980 (NHANES II), 1988 –1994 (NHANES III), and 1999 (NHANES 1999 –2000) (35). The HFCS data are those from Table 1. The prevalence of overweight (BMI of 25– 29.9) and the prevalence of obesity (BMI � 30) were fit with fourth- order polynomial curves so that the limited number of data points could be fitted into a curve to capture the US trends. We also included esti- mates of free-fructose intake and total fructose intake. Total fructose is the sum of free fructose and fructose that is part of the disaccharide sucrose. Free fructose is the monosaccharide in HFCS and is also obtained in small amounts from other sources. Free-fructose intake closely follows the intake of HFCS. Total fructose intake increased nearly 30% between 1970 and 2000.
  • 89. Estimated HFCS consumption The intake of caloric sweeteners in the United States has in- creased rapidly, and nationally representative data from 1994 to 1998 from the USDA allow us to estimate an intake of 318 kcal/d for the average US resident aged � 2 y. This value is one-sixth of the intake of all calories and close to one-third of the intake of all carbohydrates and represents a significant increase over the past 2 decades (Table 2). As the intake of caloric sweeteners increased, so did the fructose load, which increased from 158.5 to 228 kcal · person�1 · d�1 between 1977–1978 (36) and 1994 –1998 (38, 39). Furthermore, as shown in Table 2, the major increase in the intake of caloric sweeteners from 1977 to 1998 came from the intake of soft drinks and fruit drinks, and these intake values were 105 and 31 kcal · person�1 · d�1, respectively, of the total added sugar intake of 318 kcal · person�1 · d�1 in 1994 –1998. More- over, more than one-half of the increased caloric sweetener in- take during this time period came from the intake of these bev- erages. The intakes of these 2 types of beverages and of desserts total about two-thirds of all caloric sweetener intake in the United States today (Table 2). We have no way to directly measure total HFCS use. However, one Food and Drug Administration study used very conservative
  • 90. methods to estimate HFCS use for the nationally representative dietary intake sample from 1977 to 1978 from the USDA (35). Using measures of the proportion of HFCS in each food, Glins- mann et al (40) created food category–wide estimates of the proportion of caloric sweeteners that is HFCS. We applied those same proportions to a set of food groups to estimate the use of caloric sweeteners not only during 1977–1978 but also during later periods. Using our conversion technique applied to the initial 1977–1978 Nationwide Food Consumption Survey data, we obtained results that were only 4 kcal higher than the esti- mates of Glinsmann et al (39). This approach is based on HFCS composition in the early 1980s. With the use of the USDA value of 4.2 g HFCS/tsp (0.84 g/mL), the availability of HFCS in the food supply in the early 1980s was only one-half of the current availability on a gram per capita basis (as shown in Table 1). Thus, we feel confident that we can use this approach to provide a conservative lower limit of HFCS intake. In Table 2, the 2 columns at the right contain our estimates of HFCS intake and total fructose intake. On the basis of the trend in intakes, our estimate of HFCS intake for the most recent period of measurement from 1994 –1998 is 132 kcal · person�1 · d�1 (37). This represents a shift between 1977–1978 and 1994 – 1998 from 4.5% of total calories to 6.7% of total calories, or from 10.1% of carbohydrates to 13.1% of carbohydrates (41). The estimate of total fructose intake, which was obtained from the intakes of sucrose and HFCS, would be somewhat higher if we knew the fructose content of the fruit drinks. 540 BRAY ET AL a t C
  • 93. rg D o w n lo a d e d fro m http://ajcn.nutrition.org/ Distribution of HFCS intake matters! We also explored the distribution of HFCS consumption by examining quintiles of caloric sweetener intake among Ameri- cans aged � 2 y (Table 3). Most of the increase in caloric sweetener intake from the middle quintile to the upper quintile came from increases in the intake of calorically sweetened bev- erages, particularly soft drinks. Consumers in the top quintile, which represents 20% of all Americans, consume � 11% of their calories from HFCS. Again, remember that this is a very conser- vative estimate. This same group obtains almost one-half of its carbohydrates from caloric sweeteners and one-fifth of its car-
  • 94. bohydrates from HFCS. DISCUSSION Genetic factors play an important role in the development of obesity (42). However, the rapidity with which the current epi- demic of obesity has descended on the United States (35) and TABLE 2 Trends in intakes of added sugar (sucrose) and high-fructose corn syrup (HFCS) by Americans aged � 2 y1 Soft drinks Fruit drinks Desserts Total added sugar Estimated HFCS intake2 Estimated total fructose intake3 Intake (kcal � person�1 � d�1) 1977–1978 52 18 54 235 80 158.5 1989–1991 744 19 474 242 95 170 1994–1998 1054,5 314,5 604,5 3184,5 132 228 Percentage of total energy (%) 1977–1978 2.9 1.0 3.0 13.1 4.5 8.8 1989–1991 4.14 1.1 2.64 13.5 5.3 9.4 1994–1998 5.34,5 1.64,5 3.04,5 16.04,5 6.7 11.5 Percentage of total carbohydrates (%) 1977–1978 6.5 2.3 6.8 29.5 10.1 19.8 1989–1991 8.54 2.2 5.44 27.8 10.9 19.5
  • 95. 1994–1998 10.44,5 3.14,5 5.94,5 31.54,5 13.1 22.8 1 Data from references 36 –39. 2 Coefficients derived from Glinsmann et al (40) were used to estimate HFCS intake. 3 Estimated as 50% of sucrose � fructose in HFCS. 4 Significantly different from 1977–1978, P � 0.01 (t test). 5 Significantly different from 1989 –1991, P � 0.01 (t test). TABLE 3 Distribution of consumption of added caloric sweeteners and high-fructose corn syrup (HFCS) by quintile (Q) of added sugar intake in persons aged � 2 y (1994 –1996, 1998)1 Q1 (n � 3907) Q2 (n � 4259) Q3 (n � 4228) Q4 (n � 3645) Q5 (n � 2988) Total (n � 19 027) P for trend Added caloric sweeteners Intake (kcal � person�1 � d�1) Soft drinks 6 31 69 129 290 105 0.022 Fruit drinks 4 14 26 43 69 31 0.003 Total 69 169 263 388 703 318 0.001 Percentage of total energy in kcal (%) Soft drinks 0.4 1.9 3.7 6.0 10.2 5.3 0.004 Fruit drinks 0.3 0.8 1.4 2.0 2.4 1.6 0.0001 Total 4.9 10.2 14.0 18.1 24.7 16.0 0.0004 Percentage of carbohydrates (%) Soft drinks 0.9 3.8 7.3 11.6 18.8 10.4 0.003 Fruit drinks 0.6 1.7 2.8 3.9 4.5 3.1 0.0004 Total 10.5 20.8 27.9 35.0 45.6 31.4 0.0002 HFCS
  • 96. Intake (kcal � person�1 � d�1) Soft drinks 4 22 49 91 205 74 0.022 Fruit drinks 3 10 18 30 49 22 0.004 Total 21 58 103 166 316 132 0.012 Percentage of total energy in kcal (%) Soft drinks 0.3 1.3 2.6 4.2 7.2 3.7 0.005 Fruit drinks 0.2 0.6 1.0 1.4 1.7 1.1 �0.0001 Total 1.5 3.5 5.5 7.7 11.1 6.7 0.0007 Percentage of carbohydrates (%) Soft drinks 0.6 2.7 5.2 8.2 13.3 7.3 0.003 Fruit drinks 0.4 1.2 1.9 2.7 3.2 2.2 0.0002 Total 3.2 7.2 10.9 14.9 20.5 13.1 0.0002 1 Data from references 38 and 39 (weighted to be nationally representative). HIGH-FRUCTOSE CORN SYRUP AND OBESITY 541 a t C A L IF O R N IA S T
  • 99. d fro m http://ajcn.nutrition.org/ many other countries (43) makes environmental factors the more likely explanation. From a public health perspective, the key question is whether there are modifiable environmental agents that could have triggered this epidemic and that might be altered. Several environmental agents, including reduced levels of phys- ical activity (44), a decrease in smoking, increased portion size (2), eating outside the home and at fast-food restaurants, and changes in the types of food that are ingested (45), have been suggested. In this article, we propose that the introduction of HFCS and the increased intakes of soft drinks and other sweet- ened beverages have led to increases in total caloric and fructose consumption that are important contributors to the current epi- demic of obesity. In this article, we address an important potential hypothesis by which HFCS may have an environmental link with the epidemic of obesity. When total calorie intake is fixed, ie, if a person eats the same amount of fructose, glucose, or sucrose in a metaboli- cally controlled setting, the response should be the same, and this was shown by McDevitt et al (46). This situation is not one in which differences in taste and portion size are allowed to operate. However, many biological factors that we noted in this article suggest that calorically sweetened beverages are associated with
  • 100. overconsumption when the sweetener is in a liquid form (29 – 32). The collective data suggest that overconsumption of beverages sweetened with HFCS and containing � 50% free fructose and the increased intake of total fructose may play a role in the epidemic of obesity. Whether HFCS used in solid food produces the same overconsumption as it does in beverages is unknown, but we suspect that if the HFCS was entirely in the solid form, it would not pose the same problem (30). Total fructose, both free fructose and fructose combined in sucrose, in both beverages and solid food may be viewed as a precursor to fat because of the ease with which the carbon skeleton of fructose can form the back- bone for triacylglycerols and be used for the synthesis of long- chain fatty acids (25). Additional clinical trials are clearly needed to buttress the conclusions of Raben et al (32) that beverages containing sugar caused more weight gain over 10 wk than did diet beverages. There is a distinct likelihood that the increased consumption of HFCS in beverages may be linked to the increase in obesity. One US study showed that beverages sweetened with HFCS are linked with increased energy intake and weight gain (31). Fur- thermore, we showed that the increase in the use of HFCS was concurrent with the increase in obesity rates in the United States. HFCS was introduced into the food supply just before 1970 and increased rapidly to constitute � 40% of the sweeteners used by 2000 (8). The increase in HFCS consumption just preceded the rapid increase in the prevalence of obesity that occurred between the National Center for Health Statistics survey in 1976 –1980
  • 101. and the next survey in 1988 –1994 (35) (Figure 1). HFCS is used in soft drinks, and HFCS and apple juice, which has 65% fructose, are used as the principal sweeteners for fruit drinks. The increasing consumption of calorically sweetened soft drinks has been associated with a decrease in the intake of milk (5, 8, 47, 48). This relation adds another mechanism by which HFCS consumption in beverages may be related to the epidemic of obesity. Per capita calcium intake decreased from 890 to 860 mg/d between 1970 and 1981 but has increased slowly since then (8). This was a mean 3% decrease that probably reflected a much larger decrease in calcium intake at the upper ends of the skewed distribution for intake. In US teenagers, total calcium intake decreased by � 50 mg/d (� 10%) between 1977 and 1996 (49). A convincing set of epidemiologic and clinical studies suggests that dairy products may have a favorable effect on body weight and insulin resistance in both children and adults (50 – 52). During the interval from 1970 to 1990, the intake of whole milk decreased 58%. However, the intake of cheese, which is high in fat, increased and partially offset the decrease in calcium intake from milk (8). Because milk is a major source of dietary calcium for most humans, this decrease in milk intake may play an im- portant role in the decrease in calcium in the diet. One possible public health option is to address the sweet taste preference of humans by reducing HFCS and, if sweetness is needed, relying on artificial sweeteners to make up any differ- ence in sweetness. It is becoming increasingly clear that soft drink consumption may be an important contributor to the epi- demic of obesity, in part through the larger portion sizes of these
  • 102. beverages and through the increased intake of fructose from HFCS and sucrose (53). If HFCS acts as an agent in the disease, then reducing exposure to this agent may help to reduce the epidemic (54). Some will question our measures of HFCS intake and avail- ability. Our very conservative estimate of HFCS use and the Food and Drug Administration data showed high HFCS intakes for a large segment of the US population (39). In conclusion, we believe that an argument can now be made that the use of HFCS in beverages should be reduced and that HFCS should be replaced with alternative noncaloric sweeten- ers. Sweetness is a preferred taste as well as an acquired one that may be enhanced by exposure to sweet foods. The hypothesis that providing sodas and juice drinks in which caloric sweeteners are partially or completely replaced with noncaloric sweeteners will help reduce the prevalence of obesity is worth testing. If the intake of calorically sweetened beverages is contributing to the current epidemic, then reducing the availability of these bever- ages by removing soda machines from schools would be a strat- egy worth considering, as would reducing the portion sizes of sodas that are commercially available (55). We thank Dan Blanchette for programming assistance, Tom Swasey for graphics support, and Frances Dancy for support in administrative matters. We also thank Linda Adair for thoughtful comments on an early version of this article. REFERENCES
  • 103. 1. Bray GA, Popkin BM. Dietary fat intake does affect obesity! Am J Clin Nutr 1998;68:1157–73. 2. Young LR, Nestle M. The contribution of expanding portion sizes to the US obesity epidemic. Am J Public Health 2002;92:246 –9. 3. Elliott SS, Keim NL, Stern JS, Teff K, Havel PJ. Fructose, weight gain, and the insulin resistance syndrome. Am J Clin Nutr 2002;76:911–22. 4. Smith SM. High fructose corn syrup replaces sugar in processed food. Environ Nutr 1998;11:7– 8. 5. Nielsen SJ, Siega-Riz AM, Popkin BM. Trends in energy intake in U.S. between 1977 and 1996: similar shifts seen across age groups. Obes Res 2002;10:370 – 8. 6. Higley NA, White JS. Trends in fructose availability and consumption in the United States. Food Technol 1991;45:118 –22. 7. Vuilleumier S. Worldwide production of high-fructose syrup and crys- talline fructose. Am J Clin Nutr 1993;58(suppl):733S– 6S. 8. Putnam JJ, Allshouse JE. Food consumption, prices and expenditures, 1970 –97. US Department of Agriculture Economic Research Service
  • 104. statistical bulletin no. 965, April 1999. Washington, DC: US Govern- ment Printing Office, 1999. 9. Krause MV, Mahan LK. Food, nutrition and diet therapy. 7th ed. Phil- adelphia: WB Saunders Company, 1984. 542 BRAY ET AL a t C A L IF O R N IA S T A T E U N IV E
  • 107. of fructose. Am J Clin Nutr 1993;58(suppl):724S–32S. 11. Watt BK, Merrill AL. Composition of foods: raw, processed, prepared. Agriculture handbook no. 8. Washington, DC: US Government Printing Office, 1963. 12. Petersen KF, Laurent D, Yu C, Cline GW, Shulman GI. Stimulating effects of low-dose fructose on insulin-stimulated hepatic glycogen syn- thesis in humans. Diabetes 2001;50:1263– 8. 13. Edwards DM, Todd JF, Mahmoudi M, et al. Glucagon-like peptide 1 has a physiological role in the control of postprandial glucose in humans: studies with the antagonist exendin 9 –39. Diabetes 1999;48:86 –93. 14. Vilsboll T, Krarup T, Madsbad S, Holst JJ. Both GLP-1 and GIP are insulinotropic at basal and postprandial glucose levels and contribute nearly equally to the incretin effect of a meal in healthy subjects. Regul Pept 2003;114:115–21. 15. Curry DL. Effects of mannose and fructose on the synthesis and secretion of insulin. Pancreas 1989;4:2–9. 16. Sato Y, Ito T, Udaka U, et al. Immunohistochemical localization of facilitated-diffusion glucose transporters in rat pancreatic islets.
  • 108. Tissue Cell 1996;28:637– 43. 17. Schwarz J-M, Schutz Y, Froidevaux F, et al. Thermogenesis in men and women induced by fructose vs glucose added to a meal. Am J Clin Nutr 1989;49:667–74. 18. Schwartz MW, Woods SC, Porte D Jr, Seeley RJ, Baskin DG. Central nervous system control of food intake. Nature 2000;404:661–71. 19. Muller WM, Gregoire FM, Stanhope KL, et al. Evidence that glucose metabolism regulated leptin secretion from cultured rat adipocytes. En- docrinology 1998;39:551– 8. 20. Havel PJ. Control of energy homeostasis and insulin action by adipocyte hormones: leptin, acylation stimulating protein, and adiponectin. Curr Opin Lipidol 2002;13:51–9. 21. Saad MF, Khan A, Sharma A, et al. Physiological insulinemia acutely modulated plasma leptin. Diabetes 1998;47:544 –9. 22. Farooqi IS, Matarese G, Lord GM, et al. Beneficial effects of leptin on obesity, T cell hyporesponsiveness, and neuroendocrine/metabolic dys- function of human congenital leptin deficiency. J Clin Invest 2002;110: 1093–1103.
  • 109. 23. Farooqi IS, Keogh JM, Kamath S, et al. Partial leptin deficiency and human adiposity. Nature 2001;414:34 –5. 24. Rosenbaum M, Murphy EM, Heymsfield SB, Matthews DE, Leibel RL. Low dose leptin administration reverses effects of sustained weight- reduction on energy expenditure and circulating concentrations of thy- roid hormones. J Clin Endocrinol Metab 2002;87:2391– 4. 25. Teff K, Elliot S, Tschoep MR, et al. Consuming high fructose meals reduces 24 hour plasma insulin and leptin concentrations, does not sup- press circulating ghrelin, and increases postprandial and fasting triglyc- erides in women. Diabetes 2002;52(suppl):A408(abstr). 26. Mayes PA. Intermediary metabolism of fructose. Am J Clin Nutr 1993; 58(suppl):754S– 65S. 27. Bantle JP, Raatz SK, Thomas W, Georgopoulos A. Effects of dietary fructose on plasma lipids in healthy subjects. Am J Clin Nutr 2000;72: 1128 –34. 28. Sclafani A. Starch and sugar tastes in rodents: an update. Brain Res Bull 1991;27:383– 6. 29. Mattes RD. Dietary compensation by humans for