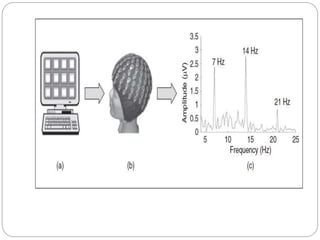
PRESENTED BY
ROHIT VIJAY
M.TECH
PGICE1650127
APPLICATION OF EEG WAVE
CONTENTS
 INTRODUCTION
 CLASSIFICATION OF APPLICATION
 DIAGNOSIS OF SLEEP DISORDERS
 BRAIN COMPUTER INTERFACES
 CRITICAL ISSUES
 REFERENCES
INTRODUCTION
 Electroencephalogram (EEG) is the recording of
electrical activity through electrode sensors placed on
the scalp. The electricity is recorded as waves that can
be classified as normal or abnormal.
 Different types of normal waves can indicate various
states or activity levels. Abnormal waves can indicate
medical problems.
CLASSIFICATION OF APPLICATION
 Two important applications of EEG wave :-
(1) Diagnosis of sleep disorders.
(2) Brain–Computer Interfaces.
DIAGNOSIS OF SLEEP DISORDERS
 A typical sleep recording has multiple channels of
EEG waves coming from the electrodes placed on the
subject’s head. Sample sleep recordings are shown in
Figure 1. In the left panel, the waves from a healthy
subject are stable at about zero and show relatively
high variability and low correlation. In the right panel,
the waves from a person with sleep difficulty show
less variability and higher correlation.
EEG signals from a healthy person and a person
with sleep difficulty
 Sleep staging:- Sleep staging is the pattern recognition
task of classifying the recordings into sleep stages
continuously over time; the task is performed by a sleep
stager. The stages include rapid-eye movement (REM)
sleep, four levels of non-REM sleep, and being awake.
 Sleep staging is crucial for the diagnosis and treatment of
sleep disorders.
 Statistical Analysis of Sleep EEG Data:- statistical
methods for performing sleep staging are auto regression,
Kullback-Leibler divergence-based nearest-neighbor
classification, and statistical modeling using a hidden
Markov model (HMM).
Logarithmic power spectral density of EEG
signals from a healthy person and a person with
sleep difficulty
Stage-specific average logarithmic power spectral
density of EEG signals from a healthy person
BRAIN COMPUTER INTERFACES
 BCIs translate human intentions into control signals to
establish a direct communication channel between the
human brain and output devices.
 Visual Evoked Potentials VEPs reflect the visual
information-processing mechanism in the brain.
 VEPs corresponding to low stimulus rates are
categorized as transient VEP (TVEP), and those
corresponding to rapidly repetitive stimulations are
categorized as steady-state VEP (SSVEP)
 A TVEP is a true transient response to a stimulus when
the relevant brain mechanisms are in resting states. It
does not depend on any previous trial. If the visual
stimulation is repeated with intervals shorter than the
duration of a TVEP, the responses evoked by each
stimulus will overlap each other, and an SSVEP is
generated.
 Analysis of the TVEP is based on temporal methods
such as template matching, whereas SSVEP detection
is usually performed by frequency analysis, e.g., power
spectral density (PSD) estimation.
SSVEP System Based on Frequency Feature
 Frequency coding and PSD analysis is the method
employed by most SSVEP-based BCI systems.
Figure 1 shows its basic diagram. Facing a number
of visual spots flickering at different frequencies,
the subject gazes at one of them, generating an
SSVEP with specific frequency components.
Figure 1(c) is the amplitude spectrum of the
SSVEP evoked by the visual spot flickering at 7
Hz. Spectrum peaks appear at 7 Hz, 14 Hz (second
harmonic), and 21 Hz (third harmonic). When the
peaks are detected, the flickering spot the subject is
watching can be identified, and the corresponding
command can then be executed.
 The SSVEP BCI based on frequency coding seems
to be rather simple in principle, but a number of
problems (such as selection of electrodes and
stimulating frequencies, algorithm of feature
extraction, and threshold setting) have to be solved
during its implementation. Among them, lead
position selection and frequency feature extraction
are the most important
 Lead Position :-To get SSVEPs with a high SNR
using the least number of electrodes is the goal of lead
selection. Only one bipolar lead is chosen as the input
in our system. From physiological knowledge, VEP
can be recorded with maximum amplitude at the
occipital region. So, the electrode giving the strongest
SSVEP, which is generally located in the occipital
region, is selected as the signal channel.
 The location of the reference channel is searched under
the following considerations: the amplitude of the
SSVEP in it should be lower, and its position should
lie in the vicinity of the signal channel so that the noise
component in it is similar to that in the signal channel.
A high SNR can then be gained when the potentials of
the two electrodes are subtracted
• Frequency Feature:- Because of the nonlinearity
during information transfer in visual system, strong
harmonics may often be found in the SSVEPs.
CRITICAL ISSUES
 Reducing the number of electrodes in BCI systems is a
critical issue for the successful development of
clinical applications of BCI technology.
 Size of epoch (a time window of fixed length of the
raw EEG data)
REFERENCES
 Medical Applications of EEG Wave Classification By
Wanli Min and Gang Luo.
 Brain Computer Interfaces Based on Visual Evoked
Potentials By Yijun Wang, xiaorong Gao, bo Hong,
Chuan Jia and Shangkai Gao.
THANK YOU

Application of eeg wave

  • 1.
  • 2.
    CONTENTS  INTRODUCTION  CLASSIFICATIONOF APPLICATION  DIAGNOSIS OF SLEEP DISORDERS  BRAIN COMPUTER INTERFACES  CRITICAL ISSUES  REFERENCES
  • 3.
    INTRODUCTION  Electroencephalogram (EEG)is the recording of electrical activity through electrode sensors placed on the scalp. The electricity is recorded as waves that can be classified as normal or abnormal.  Different types of normal waves can indicate various states or activity levels. Abnormal waves can indicate medical problems.
  • 4.
    CLASSIFICATION OF APPLICATION Two important applications of EEG wave :- (1) Diagnosis of sleep disorders. (2) Brain–Computer Interfaces.
  • 5.
    DIAGNOSIS OF SLEEPDISORDERS  A typical sleep recording has multiple channels of EEG waves coming from the electrodes placed on the subject’s head. Sample sleep recordings are shown in Figure 1. In the left panel, the waves from a healthy subject are stable at about zero and show relatively high variability and low correlation. In the right panel, the waves from a person with sleep difficulty show less variability and higher correlation.
  • 6.
    EEG signals froma healthy person and a person with sleep difficulty
  • 7.
     Sleep staging:-Sleep staging is the pattern recognition task of classifying the recordings into sleep stages continuously over time; the task is performed by a sleep stager. The stages include rapid-eye movement (REM) sleep, four levels of non-REM sleep, and being awake.  Sleep staging is crucial for the diagnosis and treatment of sleep disorders.  Statistical Analysis of Sleep EEG Data:- statistical methods for performing sleep staging are auto regression, Kullback-Leibler divergence-based nearest-neighbor classification, and statistical modeling using a hidden Markov model (HMM).
  • 8.
    Logarithmic power spectraldensity of EEG signals from a healthy person and a person with sleep difficulty
  • 9.
    Stage-specific average logarithmicpower spectral density of EEG signals from a healthy person
  • 10.
    BRAIN COMPUTER INTERFACES BCIs translate human intentions into control signals to establish a direct communication channel between the human brain and output devices.  Visual Evoked Potentials VEPs reflect the visual information-processing mechanism in the brain.  VEPs corresponding to low stimulus rates are categorized as transient VEP (TVEP), and those corresponding to rapidly repetitive stimulations are categorized as steady-state VEP (SSVEP)
  • 11.
     A TVEPis a true transient response to a stimulus when the relevant brain mechanisms are in resting states. It does not depend on any previous trial. If the visual stimulation is repeated with intervals shorter than the duration of a TVEP, the responses evoked by each stimulus will overlap each other, and an SSVEP is generated.  Analysis of the TVEP is based on temporal methods such as template matching, whereas SSVEP detection is usually performed by frequency analysis, e.g., power spectral density (PSD) estimation.
  • 12.
    SSVEP System Basedon Frequency Feature  Frequency coding and PSD analysis is the method employed by most SSVEP-based BCI systems. Figure 1 shows its basic diagram. Facing a number of visual spots flickering at different frequencies, the subject gazes at one of them, generating an SSVEP with specific frequency components. Figure 1(c) is the amplitude spectrum of the SSVEP evoked by the visual spot flickering at 7 Hz. Spectrum peaks appear at 7 Hz, 14 Hz (second harmonic), and 21 Hz (third harmonic). When the peaks are detected, the flickering spot the subject is watching can be identified, and the corresponding command can then be executed.
  • 14.
     The SSVEPBCI based on frequency coding seems to be rather simple in principle, but a number of problems (such as selection of electrodes and stimulating frequencies, algorithm of feature extraction, and threshold setting) have to be solved during its implementation. Among them, lead position selection and frequency feature extraction are the most important
  • 15.
     Lead Position:-To get SSVEPs with a high SNR using the least number of electrodes is the goal of lead selection. Only one bipolar lead is chosen as the input in our system. From physiological knowledge, VEP can be recorded with maximum amplitude at the occipital region. So, the electrode giving the strongest SSVEP, which is generally located in the occipital region, is selected as the signal channel.
  • 16.
     The locationof the reference channel is searched under the following considerations: the amplitude of the SSVEP in it should be lower, and its position should lie in the vicinity of the signal channel so that the noise component in it is similar to that in the signal channel. A high SNR can then be gained when the potentials of the two electrodes are subtracted • Frequency Feature:- Because of the nonlinearity during information transfer in visual system, strong harmonics may often be found in the SSVEPs.
  • 17.
    CRITICAL ISSUES  Reducingthe number of electrodes in BCI systems is a critical issue for the successful development of clinical applications of BCI technology.  Size of epoch (a time window of fixed length of the raw EEG data)
  • 18.
    REFERENCES  Medical Applicationsof EEG Wave Classification By Wanli Min and Gang Luo.  Brain Computer Interfaces Based on Visual Evoked Potentials By Yijun Wang, xiaorong Gao, bo Hong, Chuan Jia and Shangkai Gao.
  • 19.