BNAC Conference 16-17 April 2018 at Durham University
•Download as PPTX, PDF•
1 like•258 views

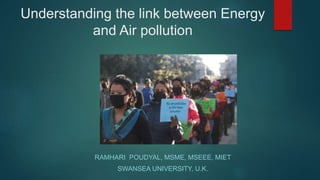
Understanding the link between Energy and Airpollution

Recommended
Recommended
More Related Content
What's hot
What's hot (20)
Similar to BNAC Conference 16-17 April 2018 at Durham University
Similar to BNAC Conference 16-17 April 2018 at Durham University (20)
More from Dr Ramhari Poudyal
More from Dr Ramhari Poudyal (14)
Recently uploaded
Recently uploaded (20)
BNAC Conference 16-17 April 2018 at Durham University
- 1. Understanding the link between Energy and Air pollution RAMHARI POUDYAL, MSME, MSEEE, MIET SWANSEA UNIVERSITY, U.K.
- 2. Air Pollution around the Globe Modern Societies are highly energy - dependent Huge challenge in the field of energy policy as it seeks to ensure the security of its energy supply and address climate change Global energy-related CO2 emissions rose by 1.4% in 2017, an increase of 460 million tones (Mt), and reached a historic high of 32.5 Giga tones WHO estimates that 3.5 million deaths each year due to air pollution Air pollution is responsible for increases in cardiovascular diseases, hospital admissions and mortality. The IEA’s World Energy Outlook (WEO) special report 2016 highlights the links between energy, air pollution, and population health.
- 3. Air Pollution around the Globe Air pollution is the fourth largest human health risk - 3.5 million premature deaths are linked to energy poverty - Due to the use of biomass for cooking and kerosene for lighting Air pollution related death in Nepal is 35,000 a year According to the survey of Central Bureau of Statistics on climate change and its health impacts, 19% households suffer from vector-borne diseases and 21% from water-borne diseases. According to the Environmental Performance Index, Nepal remains 149 among 180 countries in terms of air quality
- 4. Traditional energy source of Nepal
- 5. Global energy-related CO2 emissions Many people resort to use diesel generators for power during the load shedding while hospitals and healthcare clinics use these generators regularly. Running these backup generators increases the environmental pollution, indoor pollution, and noise pollution According to Associate Professor Bibek Baral of Kathmandu University “Diesel generators are throwing 1181 ton carbon Monoxide, 5378 ton nitrogen , P.S.-10 344 ton, sulphur Oxide 54 ton, black carbon 135 Ton and Organic carbon 11 ton.” (Annapurna Post 2014).
- 6. Factors for CO2 Emission from Fuels Source: UNEP, 2009 The emission factor for Nepal is 0.0014075 kg CO2/kWh of electricity Fuel Energy Basis Kg/GJ Mass Basis Kg/GJ Liquid Basis Kg/litre LPG 63.1 2984.63 1.61 Other Kerosene 71.9 3149.22 2.52 Oil Products Petrol/Diesel 74.1 3186.3 2.68 Residual Fuel oil 77.4 3126.96 2.94 Lubricant 73.3 2946.66 2.95 Other petroleum Product 73.3 2946.66 Coal Lignite 101 1201.9 Biomass Wood 112 1747.2 Charcoal 112 3304 Other primary solid biomass fuels, Rice Husk 100 1160
- 7. Classification of Pollutants Direct Pollutants Lead (Pb) Nitrogen Oxide (NOx) Sulphur Oxide (SOx) Carbon Mono Oxide (CO) Some Particulate Matter (PM) visible smoke from diesel truck and cars Indirect Pollutants Ozone Some Particulate Matter (PM in the atmosphere from chemical reactions, such as those involving (NOx) , (SOx) Global energy mix by 2040 Solar 10% Energy Efficiency 17% Biogas 19% Biomass 19% Hydro 19% waste - to - energy 6% Transport 4% Bio-fuels 4% Wind 2%
- 8. NOx Acid Rain Ground level ozone Smog Particles Global Warming Toxic Chemicals Visibility Impairment Water quality detoriatition Effects of Nitrogen Oxide (NOx)
- 9. World Oil Production and Price PV solar generation globally has grown from 3 GW in 2003 to 219 GW in 2015. It is expected to reach 430 GW by 2018. The wind generation is growing faster than the PV generation it increased from 39 GW in 2003 to 318 GW in 2013, and is predicted to reach about 600 GW by 2018 [15].
- 10. Rise in temperature by one degree Celsius increases 4.4%cases of diarrhoea One centimetre precipitation leads to 0.8% increase in diarrhoeal diseases.
- 11. Effects of Air Pollution Global Warming Climate change is primarily the consequence of the burning of fossil fuels such as coal, oil and natural gas. The other form of energy sources has indirect role in climate change and global warming. 2,323 glacier lake have been identified in Nepal. Out of these, 20 lakes are considered to be in danger of bursting their banks (moo et. al 2001) Greenhouse Gas Effect Scientist predicts that earth’s mean surface temperature will rise by 1.5 – 4.5 degree centigrade by 2050 if greenhouse gas continue to rise at the present rate Indoor Air Pollution Burning the low quality fuels has adverse impacts on the health of rural people, leading to the death of more than 7,500 women and children each year due to the indoor air pollution [9]. The children are also forced to spend plenty of their time to collect the energy resources, so they are deprived of education.
- 12. Cost of Air pollution Motor Vehicles 49% Utilities 27% Industrial Commercial Residential 19% All Other sources 5% Medical care Damage to crop Money and manpower for disposal Corrosion of metals and soiling of building Control device and research development
- 13. Situation of Kathmandu Metro city pollution Index 2018 ranked Kathmandu as the 5th most polluted city in the world.
- 14. Air Quality Index of Kathmandu Anti Pollution Rally in Kathmandu Air Quality Index of Kathmandu 0 20 40 60 80 100 120 140 160 180 Air Quality Index of Kathmandu
- 15. Air Quality Index of Kathmandu Air quality index of US, Embassy, Kathmandu Air Quality Index of Kathmandu
- 16. Solutions – Renewable energy
- 17. Cost of AC/DC Transmission Lines
- 18. % of Electric Power Lost in T&D, 08 -12 Percentage of electric power lost in transmission and distribution from 2008 thru 2012 for several regions and countries, including theft. The losses in developed regions like North America and the EU are largely due to resistive losses in electrical equipment, but the high losses in regions like Latin America and countries like India have a high component of theft in additional to losses due to technology.
- 19. Conclusion 1. Use Renewable electricity instead of coal and diesel 2. Use of eco-friendly vehicles instead of diesel/petrol engines 3. Use eco friendly mass transpiration - Electric Rail 4. Modification of industrial processes 5. Replace wood, coal by electricity and natural gas for cooking 6. Traffic management and replace the old vehicles 7. Establish Green belt 8. Health and Environment education about the impact of air pollution 9. Research and development work together with Engineer and health professional 10.Governments to create policy frameworks to catalyze the private sector investments in the transition towards a low-carbon energy economy 11.Construction of appropriate building standards and cluster homes and installations of industrial sites away from vulnerable areas
- 20. References 1. UNEP, 2009 2. moo et. al 2001 3. Picture credit Seto Pati, Nepali Times 4. International Energy Agency, 2017
- 21. Thank You for listening! Any Questions? rhpoudyal@gmail.com 847043@swansea.ac.uk
Editor's Notes
- http://www.iea.org/newsroom/news/2016/november/world-energy-outlook-2016.html