Feasibility Study of ‘INTEGRATED RESOURCE MANAGEMENT in Nepal’

१ फाल्गुन, २०७८ प्रविधिमार्फत फोहोर व्यवस्थापन गर्ने गरी पूर्वी चितवनका चार नगरपालिकालाई प्रस्ताव गरिएको छ । सफा उर्जा नामक गैरसहकारी संस्थाले चार पालिकाबाट निस्कने फोहोरको सामुहिक व्यवस्थापन गर्ने गरी प्रस्ताव गरेको हो । कार्यक्रममा सफा उर्जाका निर्देशक डा रामहरि पौडेलले फोहोर व्यवस्थापनमा पालिकाहरुको अवस्थाका कार्ययोजना प्रस्तुत गरेका थिए । https://echitwanpost.com/163834/2022021316/12/46/ फोहोरमैला व्यवस्थापनका चुनौतीः इतिहासदेखि वर्तमानसम्म https://www.onlinekhabar.com/2022/07/1160574 लेखक सफा ऊर्जाका निर्देशक हुन्। उक्त कम्पनीले हालसालै पूर्वी चितवनका चारवटा नगरपालिकामा (रत्ननगर, खैरहनी, कालिका र राप्तीमा फोहोर सम्बन्धी आधिकारिक तथ्यांकका लागि विस्तृत सर्भे गरेको छ। भरतपुर महानगरपालिकामा फलफूल मन्डीको फोहोरलाई व्यवस्थापन गरी प्रांगारिक मल बनाउने काम लिएसँगै मेडिकल वेस्टको बारेमा समेत वास्तविक सर्भे गर्दैछ।)

Recommended
Recommended
More Related Content
Similar to Feasibility Study of ‘INTEGRATED RESOURCE MANAGEMENT in Nepal’
Similar to Feasibility Study of ‘INTEGRATED RESOURCE MANAGEMENT in Nepal’ (20)
More from Dr Ramhari Poudyal
More from Dr Ramhari Poudyal (13)
Recently uploaded
Recently uploaded (20)
Feasibility Study of ‘INTEGRATED RESOURCE MANAGEMENT in Nepal’
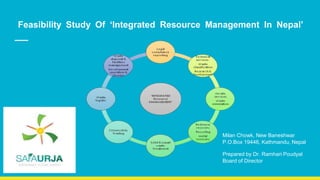
- 1. Feasibility Study Of ‘Integrated Resource Management In Nepal’ Milan Chowk, New Baneshwar P.O.Box 19446, Kathmandu, Nepal Prepared by Dr. Ramhari Poudyal Board of Director
- 2. Why We Are Here? विश्वका आधा जनसंख्या सहरी क्षेत्रमा बसोबास गर्दछन्। सन् २०५० सम्ममा ६.३ अबद मान्छे सहर पस्नेछन् राम्रो भविष्यको खोजीमा। यो ठ ू लो जनसंख्यालाई सहरमा कसरी व्यिस्थित गने भन्ने चुनौती यवतखेर विश्व समुर्ायमा र्ेस्खन्छ। The world generates 2.01 billion tonnes of municipal solid waste annually, with at least 33 % of that— extremely conservatively—not managed in an environmentally safe manner. 2
- 3. To save our mother nature “Let’s take care of our earth as the way she takes care of us” Worldwide, waste generated per person per day averages 0.74 kilogram but ranges widely, from 0.11 to 4.54 Kilograms. When looking forward, global waste is expected to grow to 3.40 billion tonnes by 2050 Solid waste–related emissions are anticipated to increase to 2.38 billion tonnes of CO2- equivalent per year by 2050 if no improvements are made in the sector. 3
- 4. There is a positive correlation between waste generation and income level. Daily per capita waste generation in high-income countries is projected to increase by 19 percent by 2050, compared to low and middle-income countries where it is expected to increase by approximately 40% or more. The total quantity of waste generated in low-income countries is expected to increase by more than three times by 2050. Plastic waste pollutes our land, rivers, oceans killing wildlife, damaging ecosystems, and harming job sources like fisheries and tourism? 4
- 5. Projected Waste Generation, By Region (Millions Of Tonnes/Year) 5
- 6. Waste Collection Rates, By Income Level (Percent) 6
- 7. Global Waste Composition (Percent) 7
- 8. Global Treatment And Disposal Of Waste (Percent) 8
- 9. नगरपालिकाहरूको डम्पिङ साइट पवछल्लो समय नेपालका वसमसारहरू अवतक्रमणको चपेटामा पर्ै गएका छन् । सहरी क्षेत्रका ओवसला र र्लर्ल क्षेत्र अवहले फोहोर विसजदन थिल बनेका छन् । अवधकांस नगरपावलकाहरूको डस्िङ साइट नर्ी, वकनार, धान खेत र र्लर्ल क्षेत्र बनेका छन् । यसले जलीय जैविक विविधतालाई असर गनुदको सािै त्यसमा आवित प्रजावतहरूलाई पवन असर गरेको भने हुन्छ । उद्योगको फोहोर नर्ीमा फाल्ने प्रिृवि बढ्र्ो छ । वसमसारमा आवित चराहरूको संख्या घट्र्ो छ । यसमा वनभदर रहने िन्यजन्तुहरू घट्न िालेका छन् । तराई क्षेत्रमा हुने नर्ीजन्य पर्ािदको अत्यवधक र्ोहनले पानीका स्रोतहरू सुक्न िालेका छन् । यसले त्यहााँ आउने चराप्रजावत लगायतका सरवसृप जीिहरूलाई पवन प्रत्यक्ष प्रभाि र्ेस्खएको छ । वसमसार क्षेत्र जीिनका नसदरी हुन् जहााँ भोवलको मानि जातीको भवबष्य फ ु ल्छ र फल्छ। कठै ! मानि जावत आफ्नै जीिनको नसदरी मासेर वबकासको छलांग मारेको गुड्डी हाकी रहेको छ। भत्काई रहेको छ पुरातात्वीक क्षेत्र, मासी रहेको छ वसमसार। पुरररहेको छ ऐवतहावसक पोखरीहरु, अवतक्रमण गरर रहेको छ सहरका हररत क्षेत्रहरु। https://nagariknews.nagariknetwork.com/opinion/735711-1644203308.html 9
- 10. Chitwan - Located In The Centre Of Nepal 10
- 11. स्माटट सहरमा पूर्ाटधारका तत्वहरू 11 –पयादप्त पानी आपूवतद –वबजुली आपूवतदको आश्वासन –सरसफाइ, ठोस फोहोर व्यिथिापनसवहत –र्क्ष सहरी गवतशीलता र सािदजवनक यातायात –वकफायती आिास, विशेष गरी गररबहरूका लावग –कडा आईटी कनेस्िवभटी र वडवजटलीकरण –शासन, विशेष गरी ई–शासन र नागररकको सहभावगता –हररयाली िातािरण र जैविक विविधता –नागररकहरूको सुरक्षा र सुरक्षा, विशेष गरी मवहला, बालबावलका, अपाङ्ग र बूढा मावनसहरू –स्वास्थ्य र वशक्षा । Rapid urbanisation and inexorable mass movement of people towards urban areas create an unsustainable setup. It is expected that by 2050 the world's population will reach 9.5 billion with more than 66 % living in cities.
- 12. Total Population Daily waste generation (ton/day) Ratnanagar 82,224 26.073 Rapti 67225 21.314 Kalika 49,138 15.585 Khairahani 66,033 20.936 Total 264,620 83.89 Average Waste Composition (% by weight)7 Organic 74 Reusable/Recyclables 23.67 Others (Including Hazardous Waste) 2.33 PROJECT LOCATION Province Province 3 Land Availability Yes 12 Silent Feature Of The Proposed Project
- 13. Proposed Site For Solid Waste Management 13 The proposed site for Resource Management is shown here in the Google map This location is very centre for the nearby municipalities as well. We have the contract for lease up to 25 years. We can extend the area according to our future requirements.
- 14. 14 Project Component / Technology Anaerobic Digestion • Mesophilic (35-38 degree Centigrade) / Thermophilic (above 50degree centigrade), • The methane gas will be compressed, bottled and sold to the local market • Compost will be formed and sold to the local market as organic fertiliser Market assessment Project Demand Scenario • There is pressure on municipalities to Improve and modernise the collection methods and disposal technology. • There is a need to reduce the pressure on waste disposal practices and prices • 80% reduction in the current volume of waste going to the landfill site, which will extend the life of the landfill site in the future. • The creation of renewable energy and other environmental benefits
- 15. Development Modality 1 DEVELOPMENT MODALITY Public-Private Partnership 2 Role of Government of Nepal ▪Facilitation ▪ Acquisition of land ▪ Security ▪ Project Monitoring 3 Roles Private Sector ▪ DPR ▪ Project Development ▪ Investment & Infrastructure development ▪ Operation and Management ▪ Project transfer after concession Period 4 Development Period a Pre-Construction Period b. Financial Closure c. Construction Period d. Concession Period ▪6 Months ▪ 6 Months ▪ 3 Years ▪ 25 Years 15
- 16. Financing Project 16 1 Total Project Cost (Including IDC) 5.50 Million (USD) 2 Interest Rate 12% 3 Equity IRR 15.08% 4 NPV Equity 0.345 Million (USD) 5 Debt Equity Ratio 70:30 Financing solid waste management systems is a significant challenge, even more so for ongoing operational costs than for capital investments, and operational costs need to be taken into account upfront. Lower-income countries spend less on waste operations in absolute terms, with costs of about $35 per tonne and sometimes higher, but these countries experience much more difficulty in recovering costs.
- 17. 17 Typically, local governments cover about 50% of investment costs for waste systems, and the remainder comes mainly from national government subsidies and the private sector.
- 18. Project Features 18 Name of Municipality Total Population Daily waste generation (ton/day) Ratnanagar 82,224 26.0714 Rapti 67,225 21.3115 Kalika 49,138 15.58 Khairahani 66,033 20.93 Total 264,620 83.88 Average Waste Organic 74 Composition (% by weight) Reusable/Recyclables 23.67 Others (Incl Hazardous Waste) 2.33 Project Components Source Segregation Collection Transportation Recycling Processing Disposal
- 20. WASTE GENERATION PER DAY 20
- 21. AVERAGE WASTE COMPOSITION (% By WEIGHT) 21
- 23. 23 Waste Minimization Pyramid Waste minimization plans will help minimize the waste from the preliminary stages and at source. Generally, 4R’s (Reduce, Reuse, Recycle and Recover) principles are in practice
- 24. 24 Tentative Land Requirement For Sanitary Landfill Site Management Municipality Total Population Total Waste organic matters (Food waste, vegetable/fruit waste, green leaves, animal excreta, slaughter waste, Straw, bamboo, woody waste, dry leaves, etc.) [74%] Reusable / recyclable (Metal, paper, glass, plastic) [28.15%] Others (including hazardous waste) [0.32%] Ratnanagar 82,224 26.07 19.29 6.17 0.61 Rapti 49,138 21.31 15.77 5.04 0.50 Kalika 49,138 15.58 11.53 3.69 0.36 Khairahani 66,033 20.93 15.49 4.95 0.49 Total 264,620 83.88 62.07 19.86 1.95
- 25. 25 Quantity And Composition Of Waste Product Quantity/day Approximate rate (NPR./KG) Possible Market /area of use Compressed Biogas(Kg) 2309 85 Restaurants, Hotels, etc. Sale of fertiliser (Kg) 993.12 15 Agro market Pesticides (liter) 8272.69 8 Agro Market Reusable & Recyclables (Kg) 16881 8 Scrap collection center and Industry
- 26. SWOT Analysis 26
- 27. ● Weakness Lack of awareness . Misconception about landfill site . Lack of environmental knowledge . Technical deficiency . Lack of funding ● Threats Opposition from the local people because of the lack of understanding to differentiate between processing and landfill. Lack of investment in infrastructure due to economic crisis . Poor management . Workers Strike 27
- 28. ● Opportunities Cost recovery of solid waste management related services . effective establishment of market for different end products Co-partnership with local waste management company like Obifert, Global partnership with young local various sector of experts. ● Strengths Improved hygiene and cleanliness . Source of Income for Sub-Metropolitan/Municipality (as some royalty has to be paid by the developer) . There will be no annual solid waste management cost for concerned authority . The partner municipalities have one kind of informal consent among themselves to develop the project . Source Segregation 28
- 29. 29 Project Requirement Particulars Amount in USD Land - Civil Structure 484,900 Machinery 4,315,608 Others 48,490 Interest During Construction 639,965 Total Project cost 5,488,962
- 31. 31 Investment Pattern Component Percentage Amount In USD Equity 30.00% 1,646,689 Debt 70.00% 3,842,273 Total 5,488,962
- 32. 32 The total Resource collection of Ratnanagr package % of composition Organic 62 74.00% Reusable/Recyclables 20 23.68% Inert 0 0.00% Others (Including Hazardous Waste) 2 2.32% Total 84
- 33. 33 Collection of the Resources Household Collection Efficiency From To Efficiency 0 year 3 year 0% 4 year 13 year 50% 14 year 28 year 60%
- 34. 34 Output Output Per day Output in KGS Output- Gas 2309 Output - organic fertilizer 993.12 Output- Reusable/Recycles 16881 Output – Pesticide 8272.69 The output is assumed to increase at the rate of 2.06% per annum, based on the population growth rate.
- 36. Map of Rapti 36
- 37. Map of Kalika 37
- 39. Conclusion 39 “A Journey of thousand miles begins with a single step.” - Chinese Proverb ● Without the first step, the aim of walking those millions of step will be just an aim and not an objective. ● Nepal is probably the most beautiful country of the world hence the overwhelming views of beautiful Himalayas and the cultural and traditional ethnicity.
- 40. Executive Summary 40 1. Resource management is one of the critical problems globally. 2. Municipalities in Nepal face Rapid Urbanization, rising population growth, skyrocketing modern throwaway culture, reduced landfill capacity, and increasing disposal costs have made this issue a foremost challenge in recent years. 3. This is going to be shoddier in the coming years. 4. So, we must recognise this challenge and prepare ourselves for a better future. 5. In light of the above situation, We Safa Urja is here to help our local municipalities to enhance the resource Management with very updated technologies of the world.
- 41. Executive Summary 41 6. The primary purpose of this study is to reflect the current scenario of waste management in proposed locations. 7. It includes Ratnanagar Municipality, Rapti Municipality, Kalika Municipality, and Khairahani Municipality of Province 3 and to document the technical and economic viability of the project. 8. The study included both primary and secondary data collection methods. 9. Preliminary data were collected through visiting each municipality and speaking to the local peoples, stakeholders, the mayors, deputy mayors and other local government officials, whereas the secondary data were collected from different sources like Government reports, Plan and policies of additional years from the Planning Commission, Central Statistical Bureau, Journal articles and other verifiable and credible sources.
- 42. 10. This project seems best suited to be developed in a public-private partnership (PPP) model where GON will help get the necessary land for the project, including the ground for developing transfer stations, processing plants, and landfill sites. 11. Furthermore, the developer also tries their best to get suitable lease land for the immediate starting of the project. 12. The developer will then develop the entire infrastructure necessary for the smooth implementation of the project and will operate the project for 25 years, which will then be transferred to GON in good operating condition. 13. The study looked into the technical and financial aspects of this project. 14. It concluded that the project is technically and financially viable with the total expected cost of around 5.5 Million USD (including interest component during construction period) and Equity IRR of 15.08%. P 42 Contd..
- 43. ● Within these years, Nepal’s lack of proper resource management and the Himalayas full of plastics and other non-degradable wastes have taken the spotlight over Nepal’s beautifulness. ● If a proper solution is not taken as soon as possible, Nepal’s proudness and economy could see a noticeable reduction. ● Lack of innovative initiatives in the country is a handicap that the young generation should start filling the breeze with. ● In light of above, we are here gathering more than 100 young local people come together to face this challenge. 43 Final Remarks
- 44. Contd.. ● Nepal hasn’t taken any initiative yet. With this scope, Resource Management as a long-term solution for the undergoing problem could one of the most effective, low cost and viable option. ● With an appropriate amount of agreements with the 4 municipalities, it has been proven that within a few years, the project will be totally amortized with the company obtaining important amount of benefits. ● This feasibility study concludes with the positive viability of the project obtaining interesting amount of benefits and helping the mother earth to remain as green as always. 44
- 45. Central Bureau of Statistics (CBS), 2011 (Population projected based on growth rate of Dhanusa District @ 1.35%). ADB, 2013, ResourceManagement in Nepal: Current Status and Policy Recommendations (average per capita waste generation taken 0.317 kg). Based on a study conducted by ADB in 2013, the total waste generation of Ratnanagar is 0.312tons/day. ADB, 2013, ResourceManagement in Nepal: Current Status and Policy Recommendations (average per capita waste generation taken 0.317 kg). ADB, 2013, ResourceManagement in Nepal: Current Status and Policy Recommendations Towards sustainable municipal organic waste management in south Asia, A guide book for policy makers and practitioners, ADB, 2011 Central Bureau of Statistics (CBS),2011, Population Monograph (Growth rate @2.06%) ADB, 2013, Solid Waste Management in Nepal: Current status and Policy Recommendations (average per capita waste generation taken 0.317 kg) ADB, 2013, Solid Waste Management in Nepal: Current status and Policy Recommendations ADB, 2013, Solid Waste Management in Nepal: Current status and Policy Recommendations ADB, 2013, Solid Waste Management in Nepal: Current status and Policy Recommendations World Bank, 2072, Public-Private Partnership Policy https://www.britannica.com/technology/solid-waste-management References