Monthly Economic Monitoring of Ukraine No 231, April 2024
Derivative Stock Market Report of 30th December 2013
1. DERIVATIVE REPORT
30th December 2013
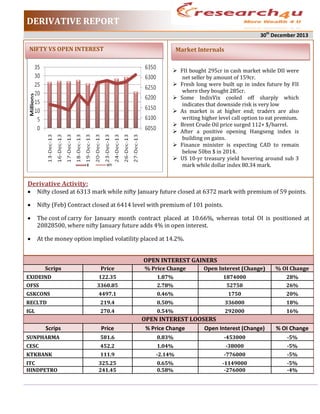
NIFTY VS OPEN INTEREST
Market Internals
FII bought 295cr in cash market while DII were
net seller by amount of 159cr.
Fresh long were built up in index future by FII
where they bought 285cr.
Some IndixVix cooled off sharply which
indicates that downside risk is very low
As market is at higher end; traders are also
writing higher level call option to eat premium.
Brent Crude Oil price surged 112+ $/barrel.
After a positive opening Hangseng index is
building on gains.
Finance minister is expecting CAD to remain
below 50bn $ in 2014.
US 10-yr treasury yield hovering around sub 3
mark while dollar index 80.34 mark.
Derivative Activity:
Nifty closed at 6313 mark while nifty January future closed at 6372 mark with premium of 59 points.
Nifty (Feb) Contract closed at 6414 level with premium of 101 points.
The cost of carry for January month contract placed at 10.66%, whereas total OI is positioned at
20828500, where nifty January future adds 4% in open interest.
At the money option implied volatility placed at 14.2%.
OPEN INTEREST GAINERS
Scrips
EXIDEIND
OFSS
GSKCONS
RECLTD
IGL
Price
122.35
3360.85
4497.1
219.4
270.4
% Price Change
1.87%
2.78%
0.46%
0.50%
0.54%
Open Interest (Change)
1874000
52750
1750
336000
292000
% OI Change
28%
26%
20%
18%
16%
OPEN INTEREST LOOSERS
% Price Change
Open Interest (Change)
% OI Change
Scrips
Price
SUNPHARMA
581.6
0.83%
-453000
-5%
CESC
452.2
1.04%
-38000
-5%
KTKBANK
111.9
-2.14%
-776000
-5%
ITC
HINDPETRO
325.25
241.45
0.65%
0.58%
-1149000
-276000
-5%
-4%
2. DERIVATIVE REPORT
30th December 2013
OPTION DATA ANALYSIS:
OI CONCENTRATION CHART
CHANGE IN OI
ON CALL OPTION FRONT:
On call option front highest open interest is positioned at 6300 mark which is important hurdle.
Short covering was seen at 6200 and 6300 mark.
ON PUT OPTION FRONT:
On put option front highest open interest has been shifted to 6200 level which has become base for
this series.
Aggressive writing was seen at 6200-6300 marks which accumulate 36 lacs total amount in open
interest.
IndiaVix cooled off by 3.38% which closed at 16.02 level.
PCR OI jumps to 1.08 mark while PCR volume stands at 1.02 mark.
VIX/PCR ratio stands at 14.83 level which shows confidence among the bulls.
3. DERIVATIVE REPORT
30th December 2013
TOATL VOLUME SUMMARY
FII STATISTICS Dec 27’13 (IN RS. Cr.)
Open Interest
Product
Net
Product
No of Contracts
Traded Value (Crs)
INDEX
FUTURES
179763
5583.58
424463
13427.66
2.88
301.28
918338
28965.88
3.90
STOCK
FUTURES
385489
13293.9
35.86
935610
30136.61
-0.02
INDEX
OPTIONS
1113369
35376.6
5.54
7670
238.72
1674.88
STOCK
OPTIONS
136396
4686.95
627.69
TOTAL
Values
285.01
INDEX
FUTURES
INDEX
OPTIONS
STOCK
FUTURES
STOCK
OPTIONS
Contracts
Change
(In %)
2286081.00
72768.88
1681.64
F&O TOTAL
1815017
58941
DERIVATIVE FOLIO
MOST ACTIVE NIFTY CALL OPTION
Symbol
NIFTY
NIFTY
NIFTY
NIFTY
NIFTY
Strike Price
6400
6500
6600
6300
6700
Traded Qty.
6110450
5717950
3963150
3179950
3162700
Open Interest
3115250
3864600
2691050
2245850
2376050
MOST ACTIVE STOCK CALL OPTION
Symbol
SBIN
RELIANCE
DLF
SBIN
TCS
Strike
Price
1800
900
180
1900
2200
Traded
Qty.
559500
765500
4904000
274875
208500
Open
Interest
329000
586250
1824000
175625
132500
MOST ACTIVE NIFTY PUT OPTION
Symbol
NIFTY
NIFTY
NIFTY
NIFTY
NIFTY
Strike Price
6300
6200
6100
6000
6400
Traded Qty.
5812200
4271550
3524100
2718700
1882750
Open Interest
3133850
3203250
3065150
2887150
1405950
MOST ACTIVE STOCK PUT OPTION
Symbol
SBIN
RELIANCE
SBIN
SBIN
TCS
Strike
Price
1750
880
1700
1800
2100
Traded
Qty.
199875
290500
129625
126500
112750
Open
Interest
92125
121750
81500
64125
52875
4. DERIVATIVE REPORT
30th December 2013
Disclaimer- The document is solely for the personal information of the intended recipient and must not be exceptionally used as the basis for any
investment decision. Nothing in this document should be construed as investment, Legal, taxation or financial advice. Everon Research. is not soliciting any
action based upon it. Each recipient of this document should make necessary investigations as they consider important to arrive at an independent
evaluation of an investment in the securities of the companies referred to in this document (including the merits and risks i nvolved).
This report has been made based on information that we consider reliable and are publicly available but we do not state that it is accurate or complete and
it should not be solely relied upon such, as this document is for. Everon Research, its affiliates, directors, its proprietary trading and investment businesses
may, from time to time, make investment decisions that are inconsistent with or contradictory to the recommendations expressed herein. The views
contained in this document are those of the analyst, and the company may or may not subscribe to all the views expressed within this document. Everon
Research or any of its affiliates/ group companies, or employees shall not be in any way held responsible for any loss or damage that may arise to any
person from any inadvertent error in the information contained in this report.
Everon Research has not independently verified the information contained in this document. Accordingly, we cannot testify, nor make any representation
or warranty, express or implied, to the accuracy, contents or data contained within this document. This document is being sup plied to you solely for your
information, and its contents, information or data may not be reproduced, redistributed or passed on, directly or indirectly.