
Recommended
More Related Content
What's hot
What's hot (20)
Similar to Commodity insight report gold & guarseed 12.07.16
Similar to Commodity insight report gold & guarseed 12.07.16 (20)
Recently uploaded
Recently uploaded (20)
Commodity insight report gold & guarseed 12.07.16
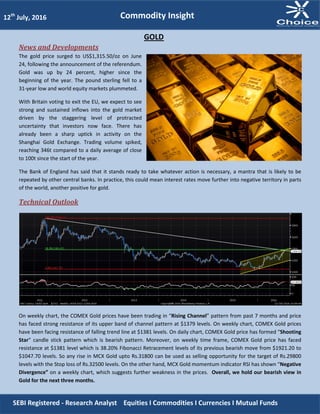
- 1. News and Developments The gold price surged to US$1,315.50/oz on June 24, following the announcement of the referendum. Gold was up by 24 percent, higher since the beginning of the year. The pound sterling fell to a 31-year low and world equity markets plummeted. With Britain voting to exit the EU, we expect to see strong and sustained inflows into the gold market driven by the staggering level of protracted uncertainty that investors now face. There has already been a sharp uptick in activity on the Shanghai Gold Exchange. Trading volume spiked, reaching 346t compared to a daily average of close to 100t since the start of the year. The Bank of England has said that it stands ready to take whatever action is necessary, a mantra that is likely to be repeated by other central banks. In practice, this could mean interest rates move further into negative territory in parts of the world, another positive for gold. Technical Outlook On weekly chart, the COMEX Gold prices have been trading in “Rising Channel” pattern from past 7 months and price has faced strong resistance of its upper band of channel pattern at $1379 levels. On weekly chart, COMEX Gold prices have been facing resistance of falling trend line at $1381 levels. On daily chart, COMEX Gold price has formed “Shooting Star” candle stick pattern which is bearish pattern. Moreover, on weekly time frame, COMEX Gold price has faced resistance at $1381 level which is 38.20% Fibonacci Retracement levels of its previous bearish move from $1921.20 to $1047.70 levels. So any rise in MCX Gold upto Rs.31800 can be used as selling opportunity for the target of Rs.29800 levels with the Stop loss of Rs.32500 levels. On the other hand, MCX Gold momentum indicator RSI has shown “Negative Divergence” on a weekly chart, which suggests further weakness in the prices. Overall, we hold our bearish view in Gold for the next three months. 12th July, 2016 SEBI Registered - Research Analyst Equities I Commodities I Currencies I Mutual Funds GOLD Commodity Insight
- 2. News and Developments Planting of crops has jumped 88 per cent in the past week in step with the monsoon's surge since the end of June, raising hopes of a much higher production and moderate prices of pulses and rice. Water level in reservoirs also increased, which is good for post- monsoon irrigation and hydropower generation. Planting of pulses jumped 131 per cent in a week, and is 26 per cent higher than last year even though this year's monsoon came late and was scanty till the middle of last month. Monsoon rainfall last week was 35% above what is touted to be normal, helping kharif sowing to exceed last year’s level in case of rice, pulses and sugarcane, although the overall sowing level was still 6% lower than a year ago, reports Sandip Das in New Delhi. Rains during the current season, which remained below normal until over a week ago, turned slightly above normal: As on July 7, the rains were 1% above the benchmark long-period average. This has also improved water levels in 91 large reservoirs, although the storage continues to be significantly low than this time last year. Analysts say that the sowing of kharif crops like paddy, pulses and oilseeds have picked up pace because of widespread rainfall. According to ministry of agriculture data released on Friday, the sowing was lagging by 23% last week. Technical Outlook NCDEX Guarseed prices have given a breakout of its “Falling Wedge” Rs.3200 levels. Breakout can be seen with bolstering volumes which indicates strong upside momentum in the prices. The price has taken support of its rising trend line at Rs.3120 levels on daily chart. It has major support at Rs.3000 levels which is also a 100 DEMA. Moreover, price has been trading above its 100 DEMA, which indicates short to medium term trend remains positive. As the NCDEX Guarseed looks strong on charts so every dip in prices till Rs. 3290 should be used as buying opportunity with a stop loss to be kept around Rs.3100 for the upside target of Rs.3700. Overall, we hold our bullish view in Guarseed for next three months. GUAR SEED 12th July, 2016 SEBI Registered - Research Analyst Equities I Commodities I Currencies I Mutual Funds Commodity Insight
- 3. SPDR Gold ETF Holdings Crop Calendar Commodity Country January February March April May June July August September October November December Guarseed India Sowing Growth Harvesting/Arrivals Commodity LTP WoW (%) MoM (%) Open Interest (Weekly) Spot Gold ($/oz) 1355 1.86 8.76 -- Spot Silver ($/oz) 20.37 2.63 17.01 -- MCX Gold (Rs./10 gms) 31532 2.58 8.99 -479 MCX Silver (Rs./kg) 47978 4.23 13.19 8252 NCDEX Guarseed (Rs./quintal) 3481 4.32 -2.25 -22160 SEBI Registered - Research Analyst Equities I Commodities I Currencies I Mutual Funds Commodity Insight12th July, 2016 Source: Bloomberg
- 4. This is solely for information of clients of Choice Broking and does not construe to be an investment advice. It is also not intended as an offer or solicitation for the purchase and sale of any financial instruments. Any action taken by you on the basis of the information contained herein is your responsibility alone and Choice Broking its subsidiaries or its employees or associates will not be liable in any manner for the consequences of such action taken by you. We have exercised due diligence in checking the correctness and authenticity of the information contained in this recommendation, but Choice Broking or any of its subsidiaries or associates or employees shall not be in any way responsible for any loss or damage that may arise to any person from any inadvertent error in the information contained in this recommendation or any action taken on basis of this information. Technical analysis studies market psychology, price patterns and volume levels. It is used to forecast future price and market movements. Technical analysis is complementary to fundamental analysis and news sources. The recommendations issued herewith might be contrary to recommendations issued by Choice Broking in the company research undertaken as the recommendations stated in this report is derived purely from technical analysis. Choice Broking has based this document on information obtained from sources it believes to be reliable but which it has not independently verified; Choice Broking makes no guarantee, representation or warranty and accepts no responsibility or liability as to its accuracy or completeness. The opinions contained within the report are based upon publicly available information at the time of publication and are subject to change without notice. The information and any disclosures provided herein are in summary form and have been prepared for informational purposes. The recommendations and suggested price levels are intended purely for trading purposes. The recommendations are valid for the day of the report however trading trends and volumes might vary substantially on an intraday basis and the recommendations may be subject to change. The information and any disclosures provided herein may be considered confidential. Any use, distribution, modification, copying, forwarding or disclosure by any person is strictly prohibited. The information and any disclosures provided herein do not constitute a solicitation or offer to purchase or sell any security or other financial product or instrument. The current performance may be unaudited. Past performance does not guarantee future returns. There can be no assurance that investments will achieve any targeted rates of return, and there is no guarantee against the loss of your entire investment. POTENTIAL CONFLICT OF INTEREST DISCLOSURE (as on date of report) Disclosure of interest statement – • Analyst interest of the stock /Instrument(s): - No. • Firm interest of the stock / Instrument (s): - No. Disclaimer Contact Us www.choiceindia.comcustomercare@choiceindia.com Commodity Insight12th July, 2016 SEBI Registered - Research Analyst Equities I Commodities I Currencies I Mutual Funds Anish Vyas Digitally signed by Anish Vyas DN: cn=Anish Vyas, o=Choice Merchandise Broking Pvt. Ltd, ou=Sr. Research Associate, email=anish.vyas@choiceindia.com, c=IN Date: 2016.07.12 13:50:54 +05'30'