chapter 5 intial material balance from slide share.pdf
Gas Chromatography
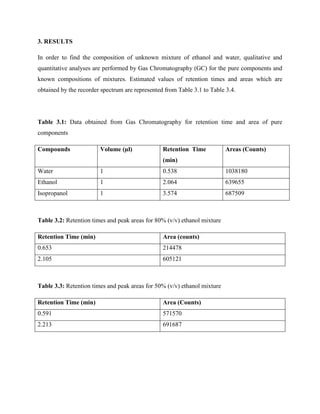
1. 3. RESULTS
In order to find the composition of unknown mixture of ethanol and water, qualitative and
quantitative analyses are performed by Gas Chromatography (GC) for the pure components and
known compositions of mixtures. Estimated values of retention times and areas which are
obtained by the recorder spectrum are represented from Table 3.1 to Table 3.4.
Table 3.1: Data obtained from Gas Chromatography for retention time and area of pure
components
Compounds Volume (µl) Retention Time Areas (Counts)
(min)
Water 1 0.538 1038180
Ethanol 1 2.064 639655
Isopropanol 1 3.574 687509
Table 3.2: Retention times and peak areas for 80% (v/v) ethanol mixture
Retention Time (min) Area (counts)
0.653 214478
2.105 605121
Table 3.3: Retention times and peak areas for 50% (v/v) ethanol mixture
Retention Time (min) Area (Counts)
0.591 571570
2.213 691687
2. Table 3.4: Retention times and peak areas for 20% (v/v) ethanol mixture
Retention Time (min) Area (counts)
0.539 883126
2.370 148383
By using the second peaks obtained from the sample analysis of known compositions, calibration
curves for ethanol and water are drawn. The physical representations of the curves are given in
Graphs 3.1 and 3.2.In order to draw the ethanol mixture calibration curve, data are taken from 1
(v/v) to 0 (v/v) such as shown in Table 3.5.
Table 3.5: Data for calibration curve of ethanol
Concentration (v/v) Area (counts)
1 639655
0.8 605121
0.5 391687
0.2 148383
0 0
800000
700000
600000
500000
Area
y = 69910x
400000 R² = 0.976
300000
200000
100000
0
0 0.2 0.4 0.6 0.8 1 1.2
Concentration (v/v)
Graph 3.1: Calibration curve for ethanol
3. Table 3.6: Data for calibration curve of water
Concentration Area
(v/v) (counts)
1 1038180
0.8 605121
0.5 391687
0.2 148383
0 0
1200000
1000000
800000
600000
Area
y = 90559x
400000 R² = 0.945
200000
0
0 0.2 0.4 0.6 0.8 1 1.2
Concentration (v/v)
Graph 3.2: Calibration curve for water
The retention time and areas are obtained for the mixture which has an unknown composition are
given in Table 3.7.
Table 3. 7: Retention times and peak areas for unknown ethanol-water mixture
Retention Time (min) Area (counts)
0.619 453465
2.187 464297
4. From Graphs 3.1 and 3.2, equations relating ethanol and water concentration to areas of related
peaks are found as follows respectively;
y = 699105x (ethanol)
y = 905594x (water)
First peak of unknown is used to calculate the concentration of water. Second peak of unknown
is used to calculate the concentration of ethanol.
For water,
453465 = 905594x (water conc.)
Water concentration in unknown sample = 0.50 (v/v)
For ethanol,
464297 = 699105x (ethanol conc.)
Ethanol concentration in unknown sample = 0.664 (v/v)