Download as KEY, PPTX
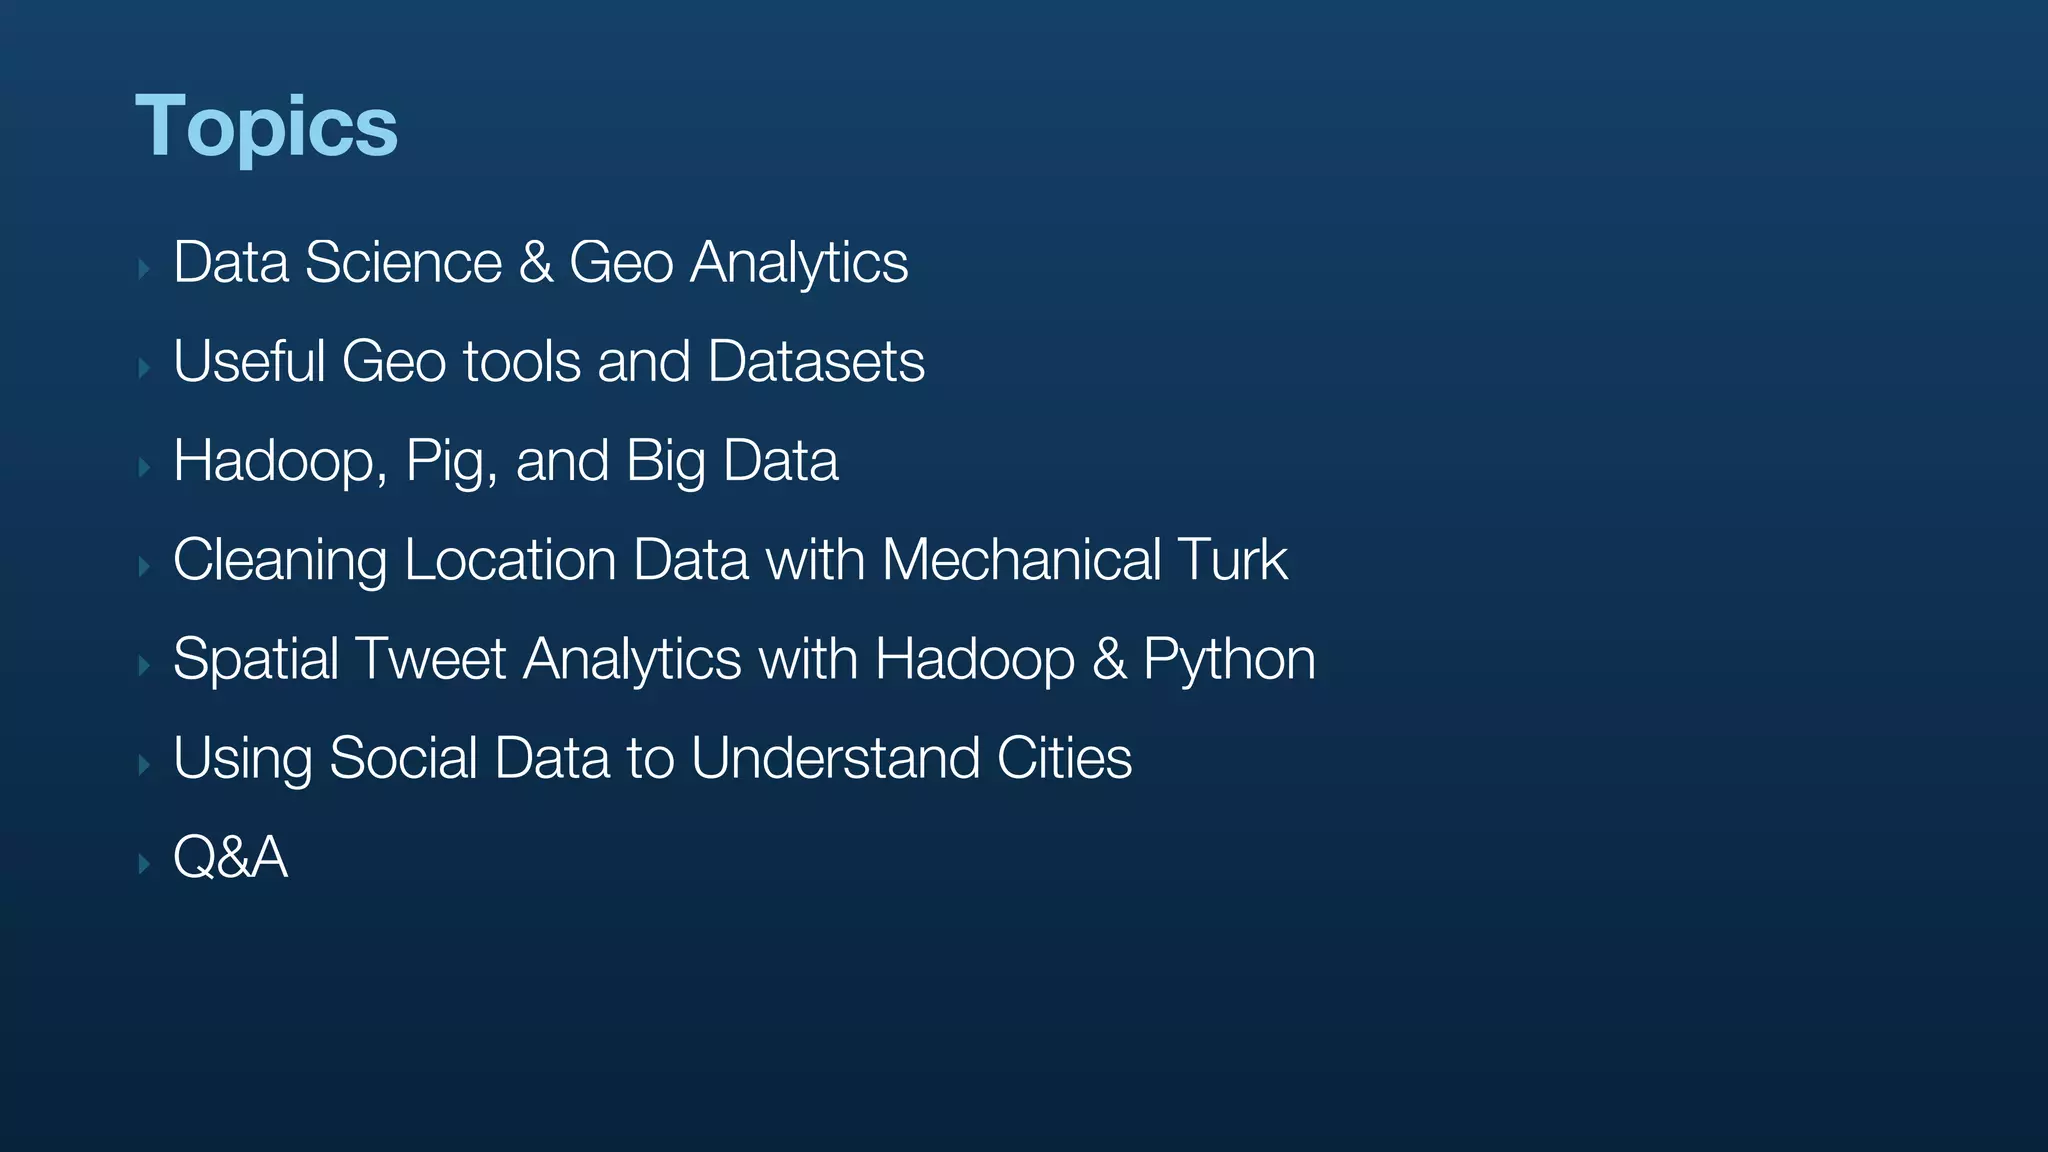
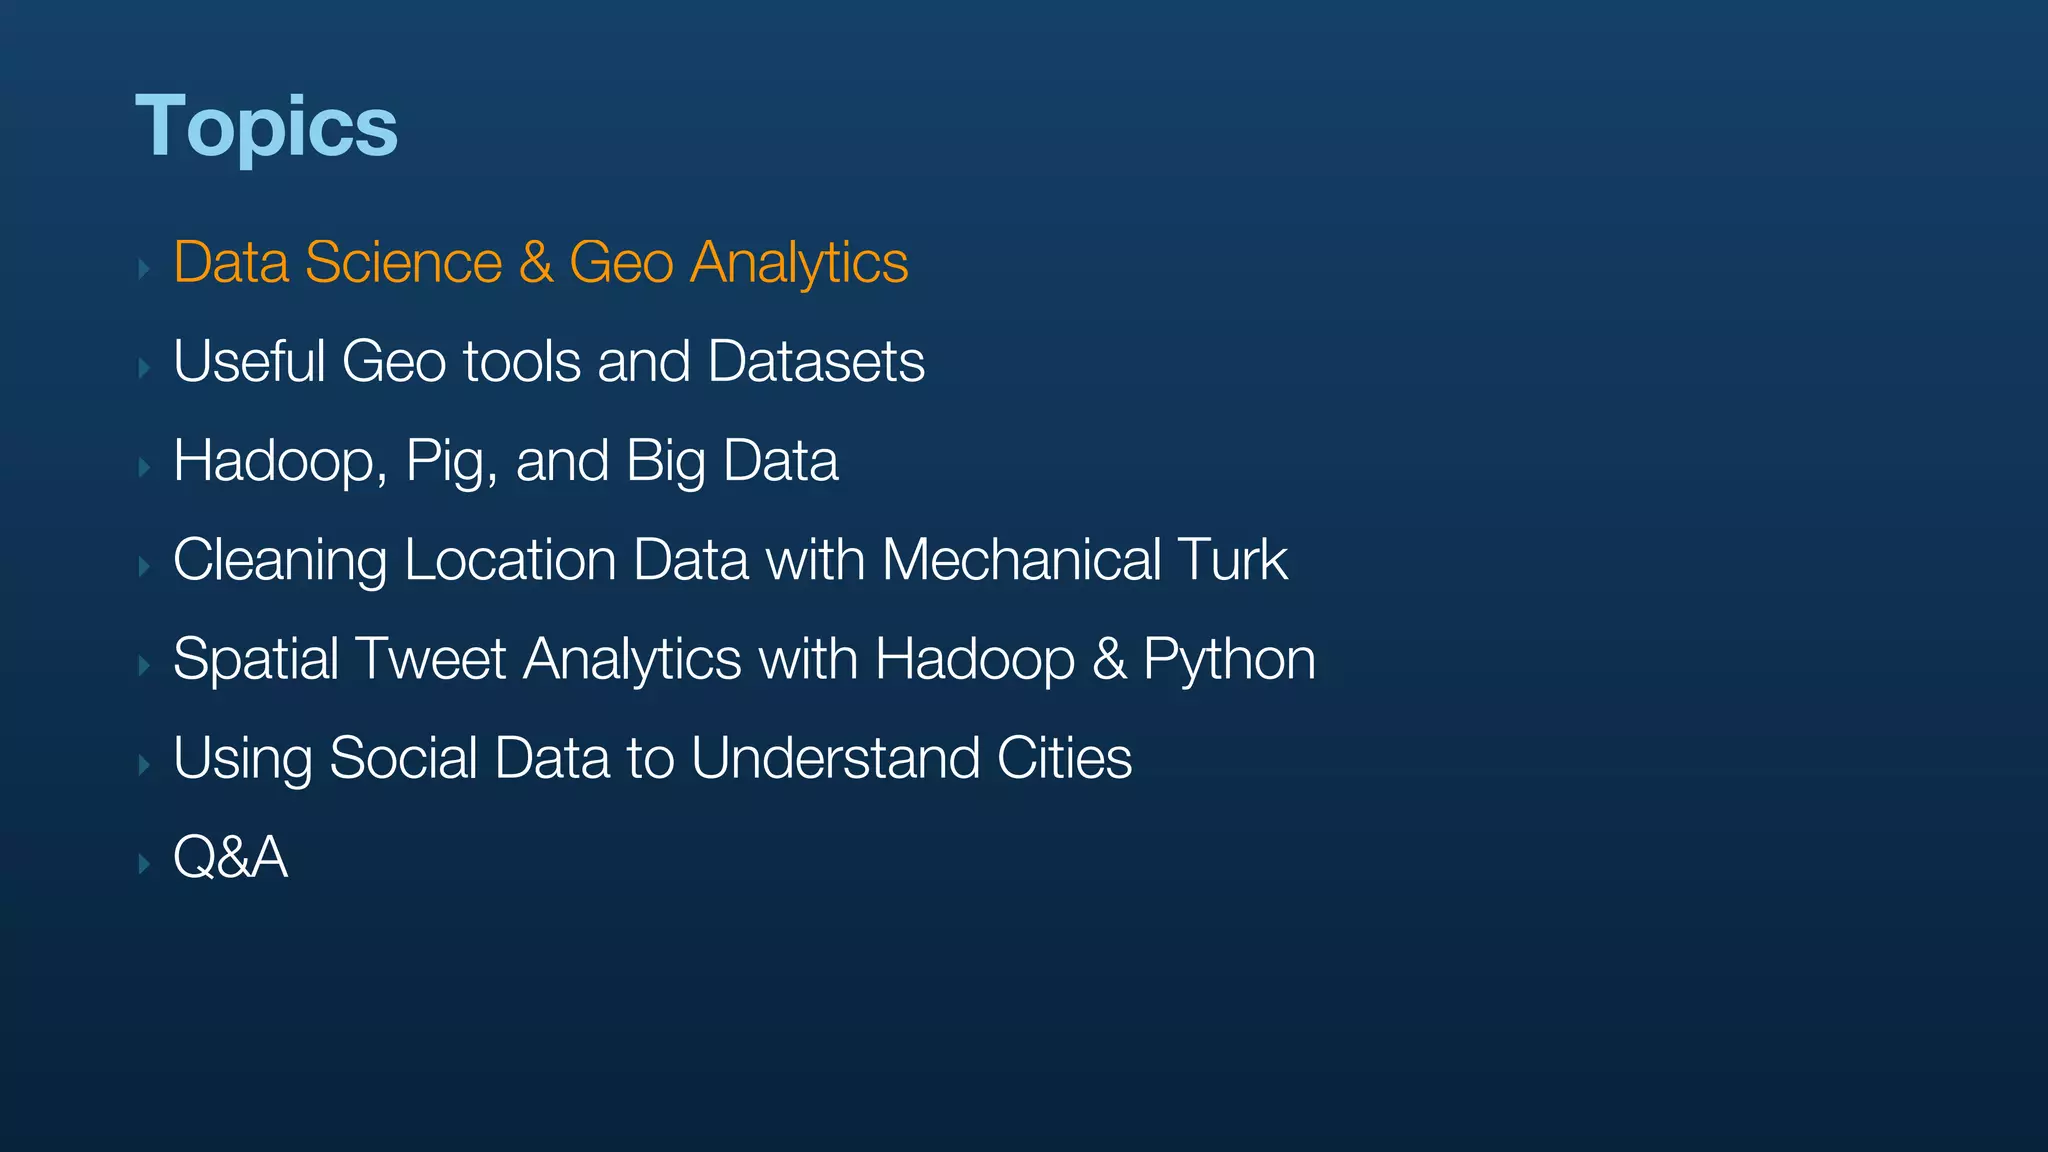


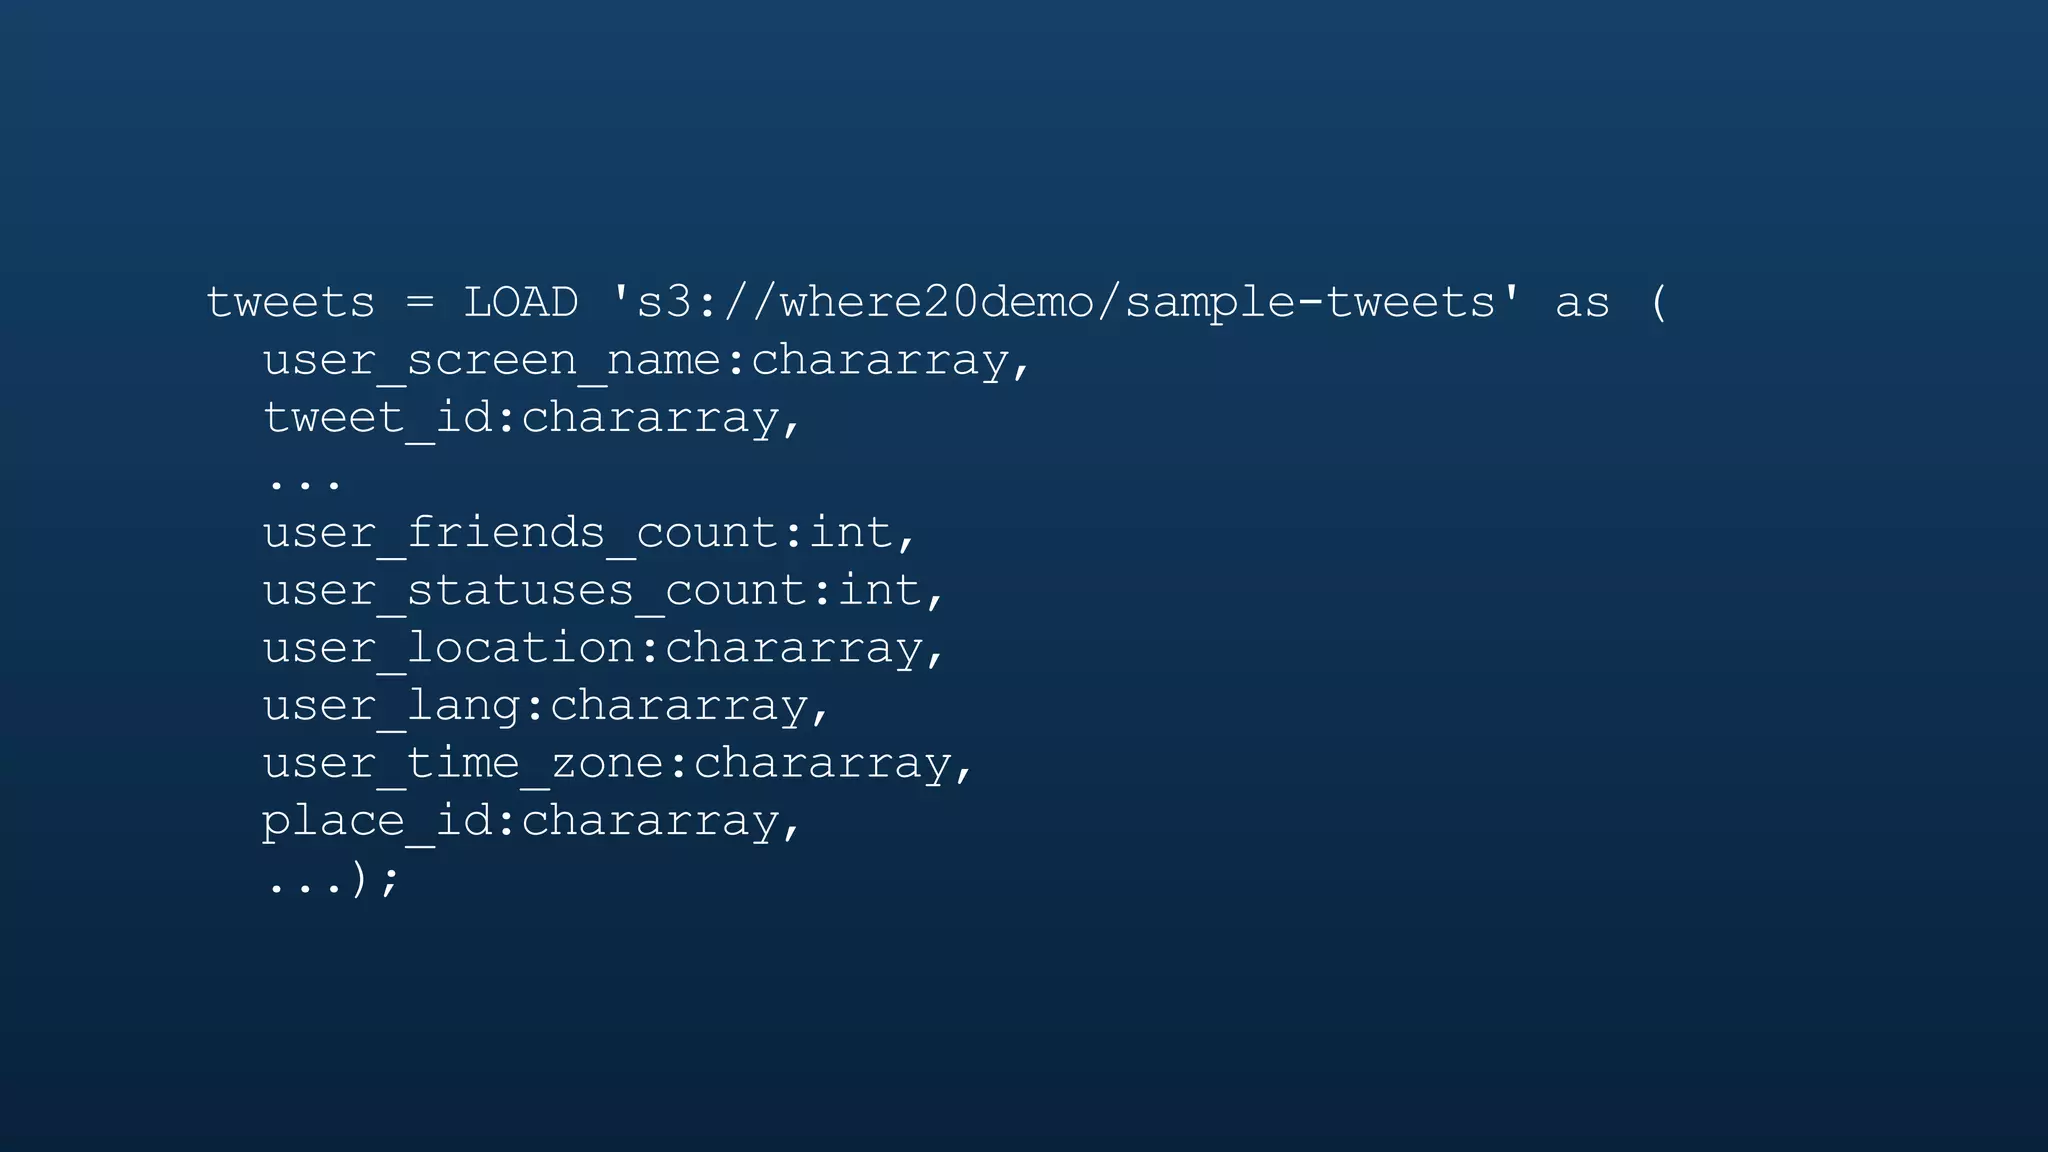
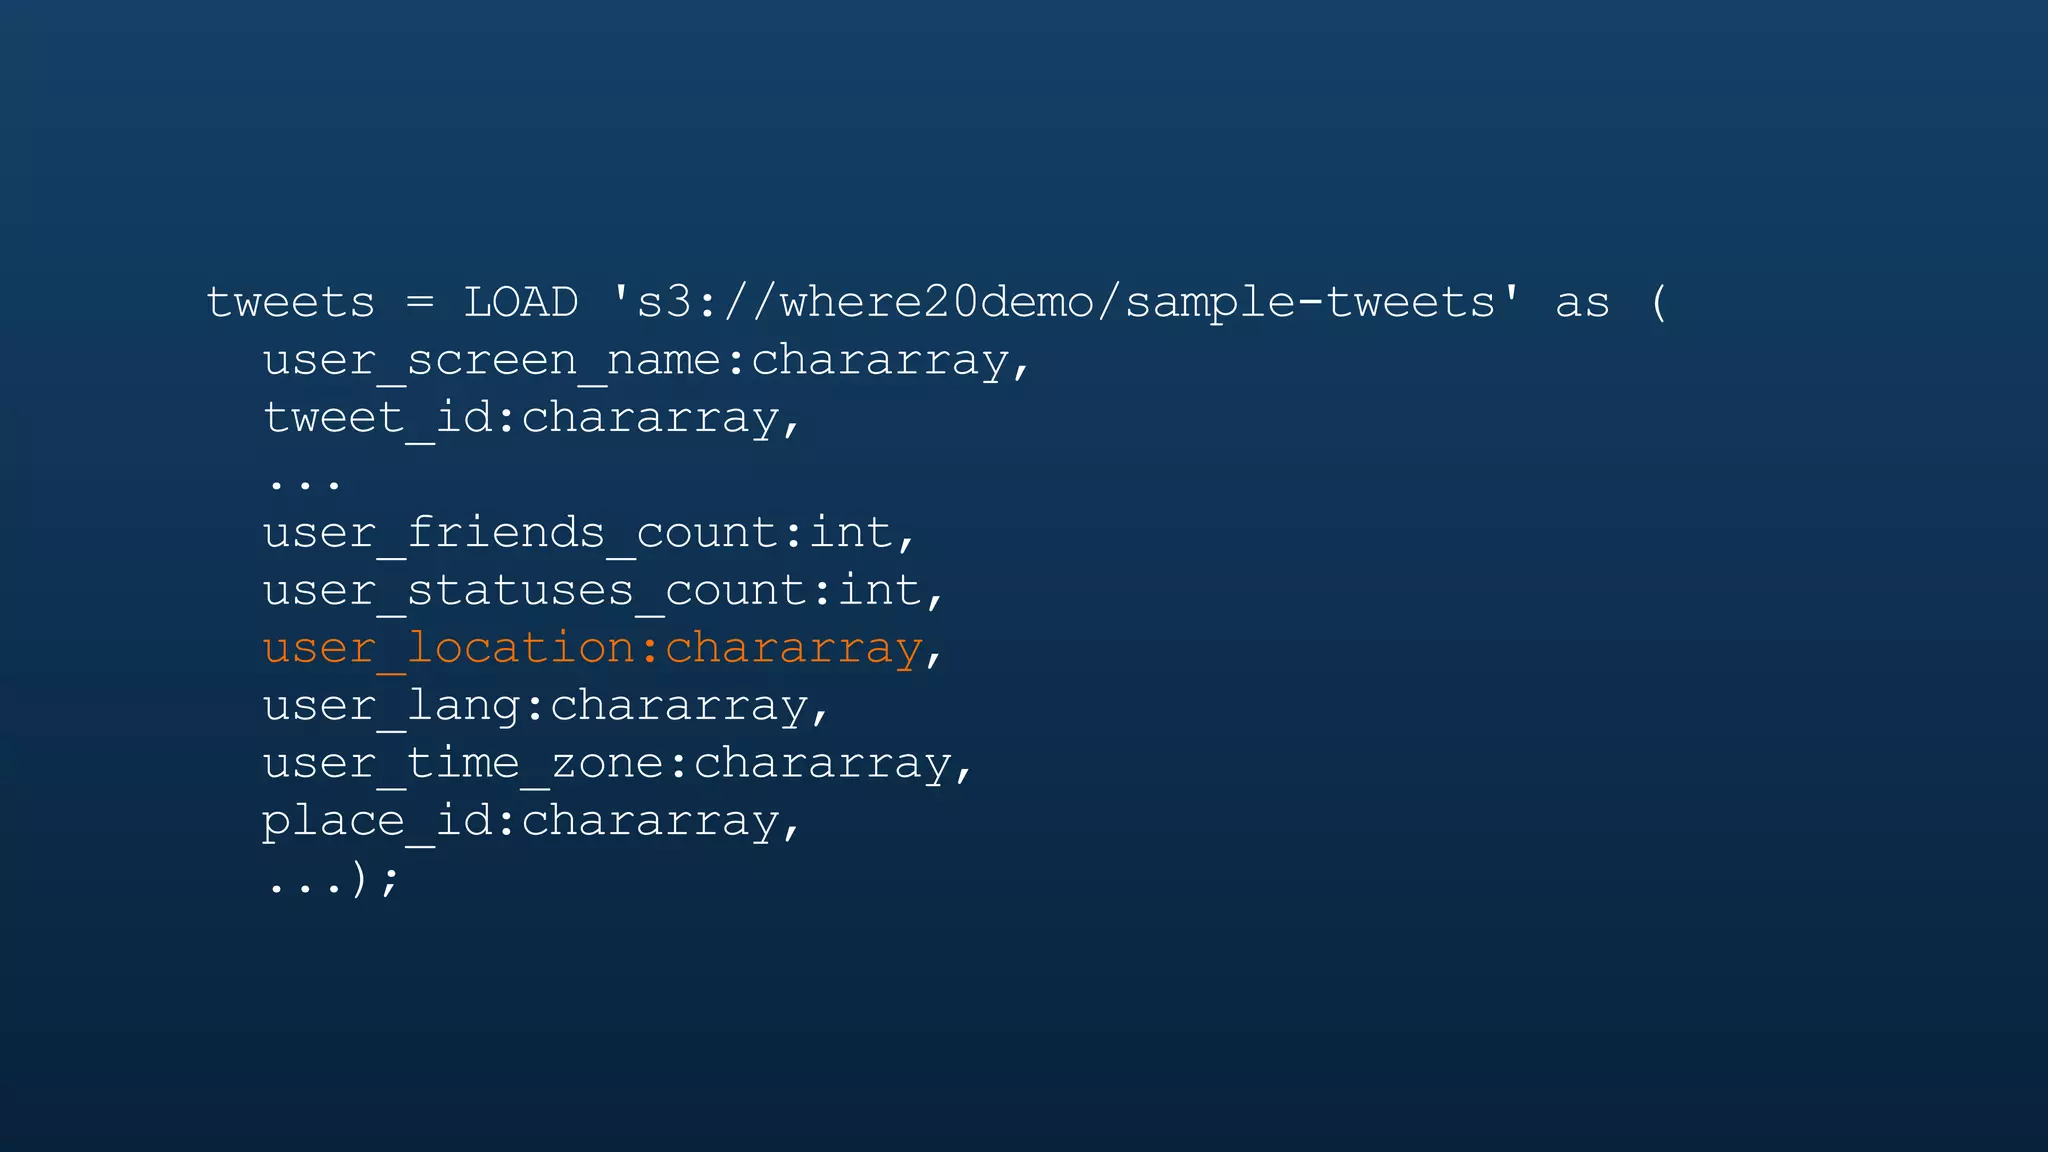
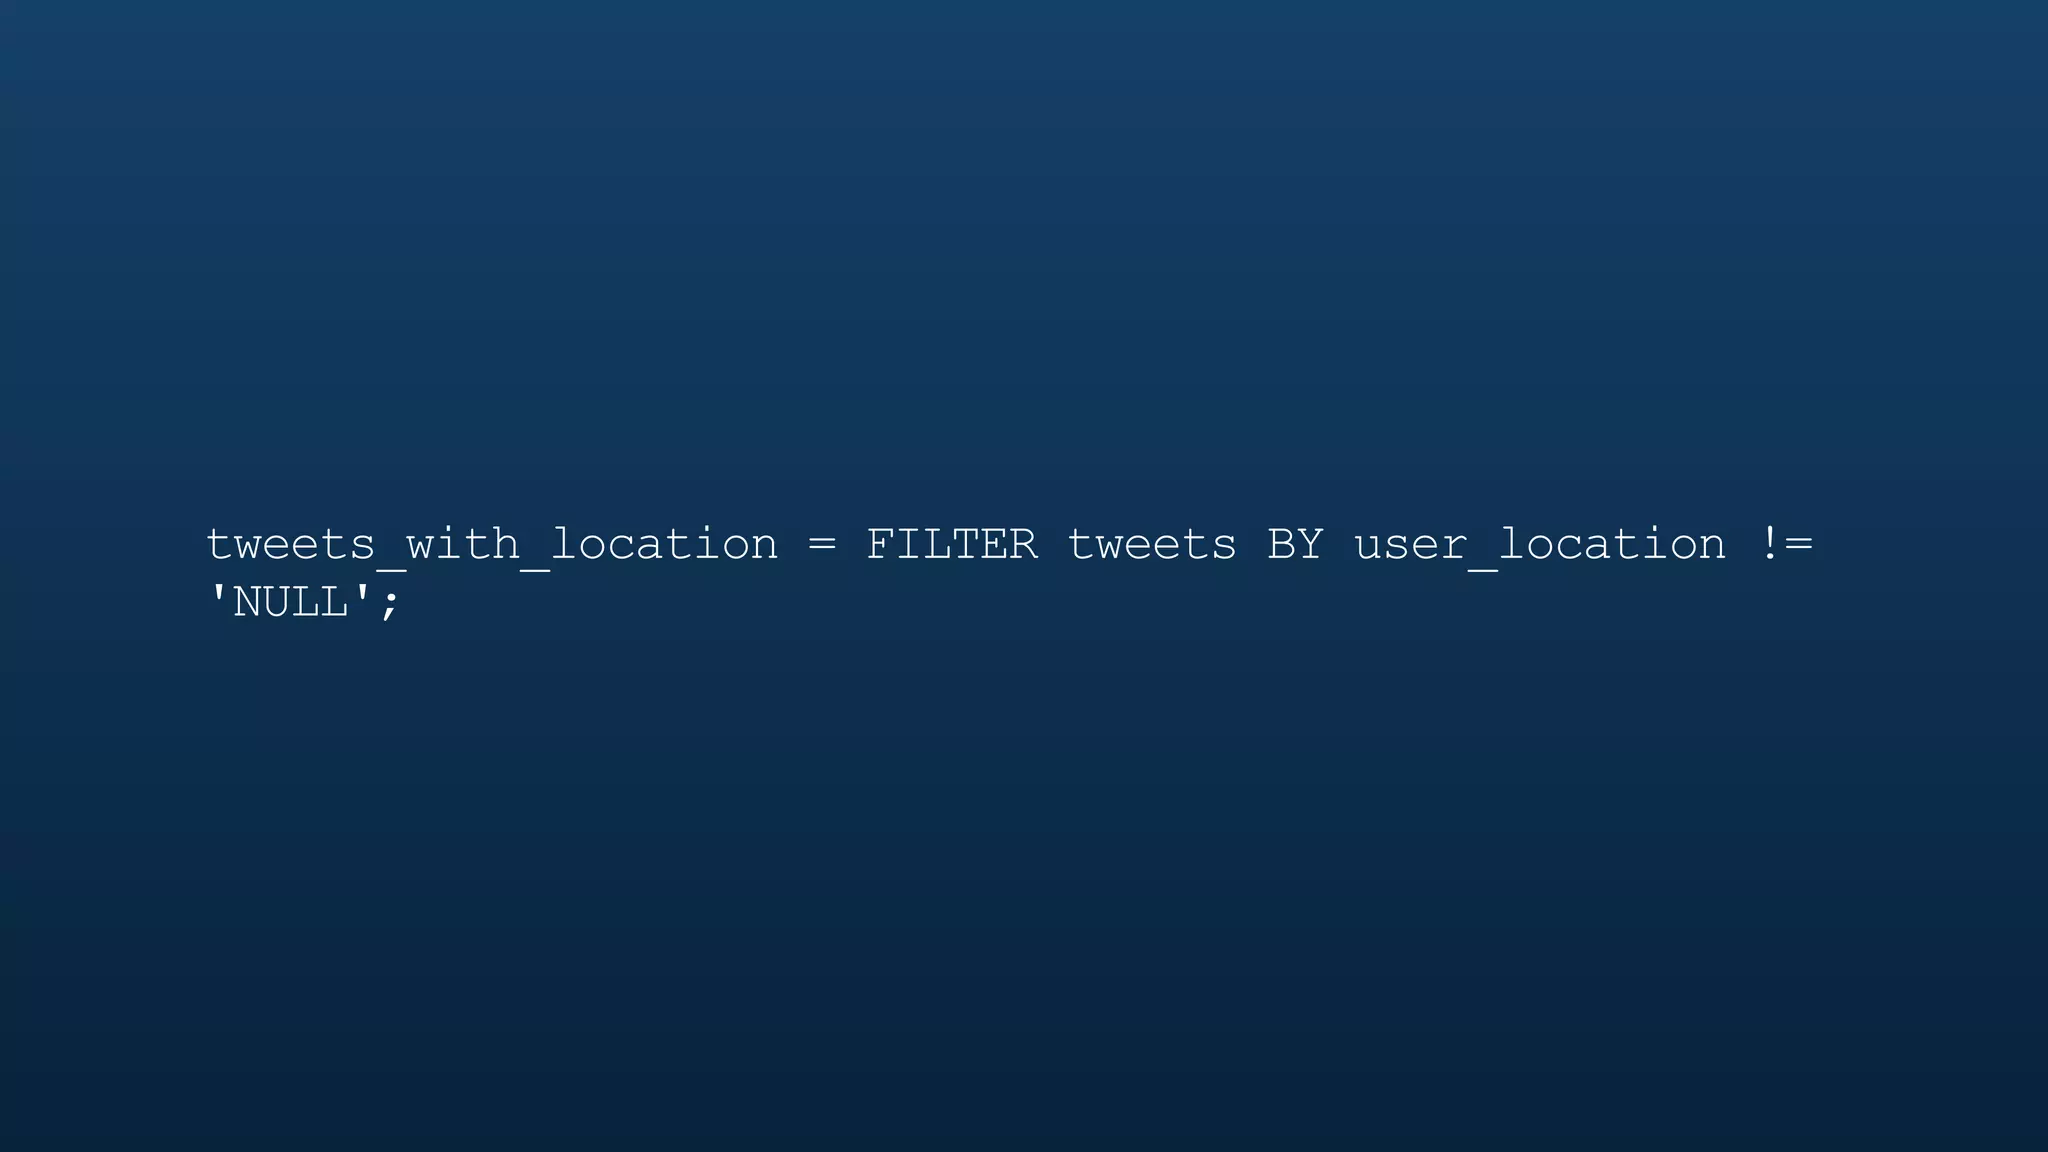
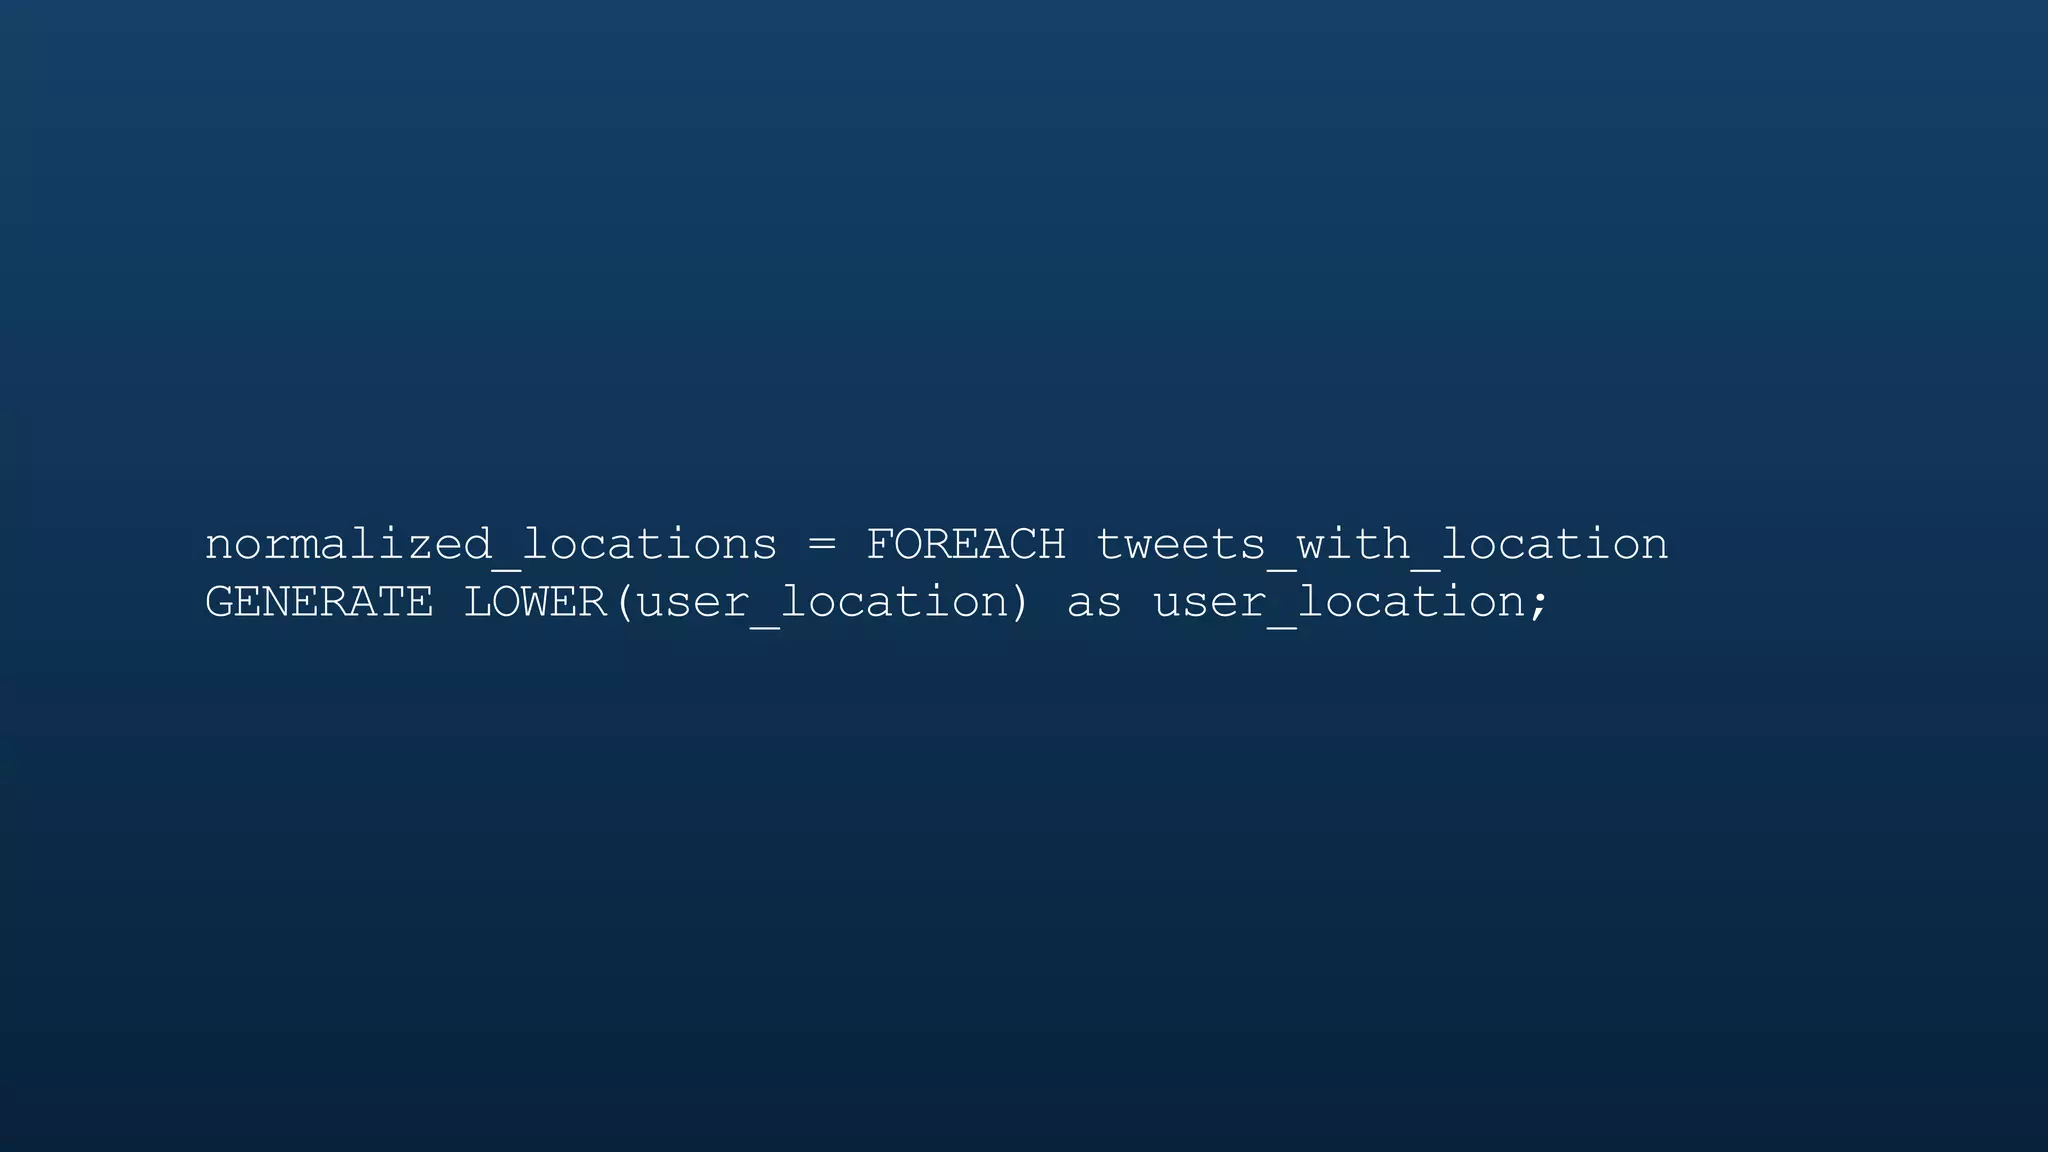
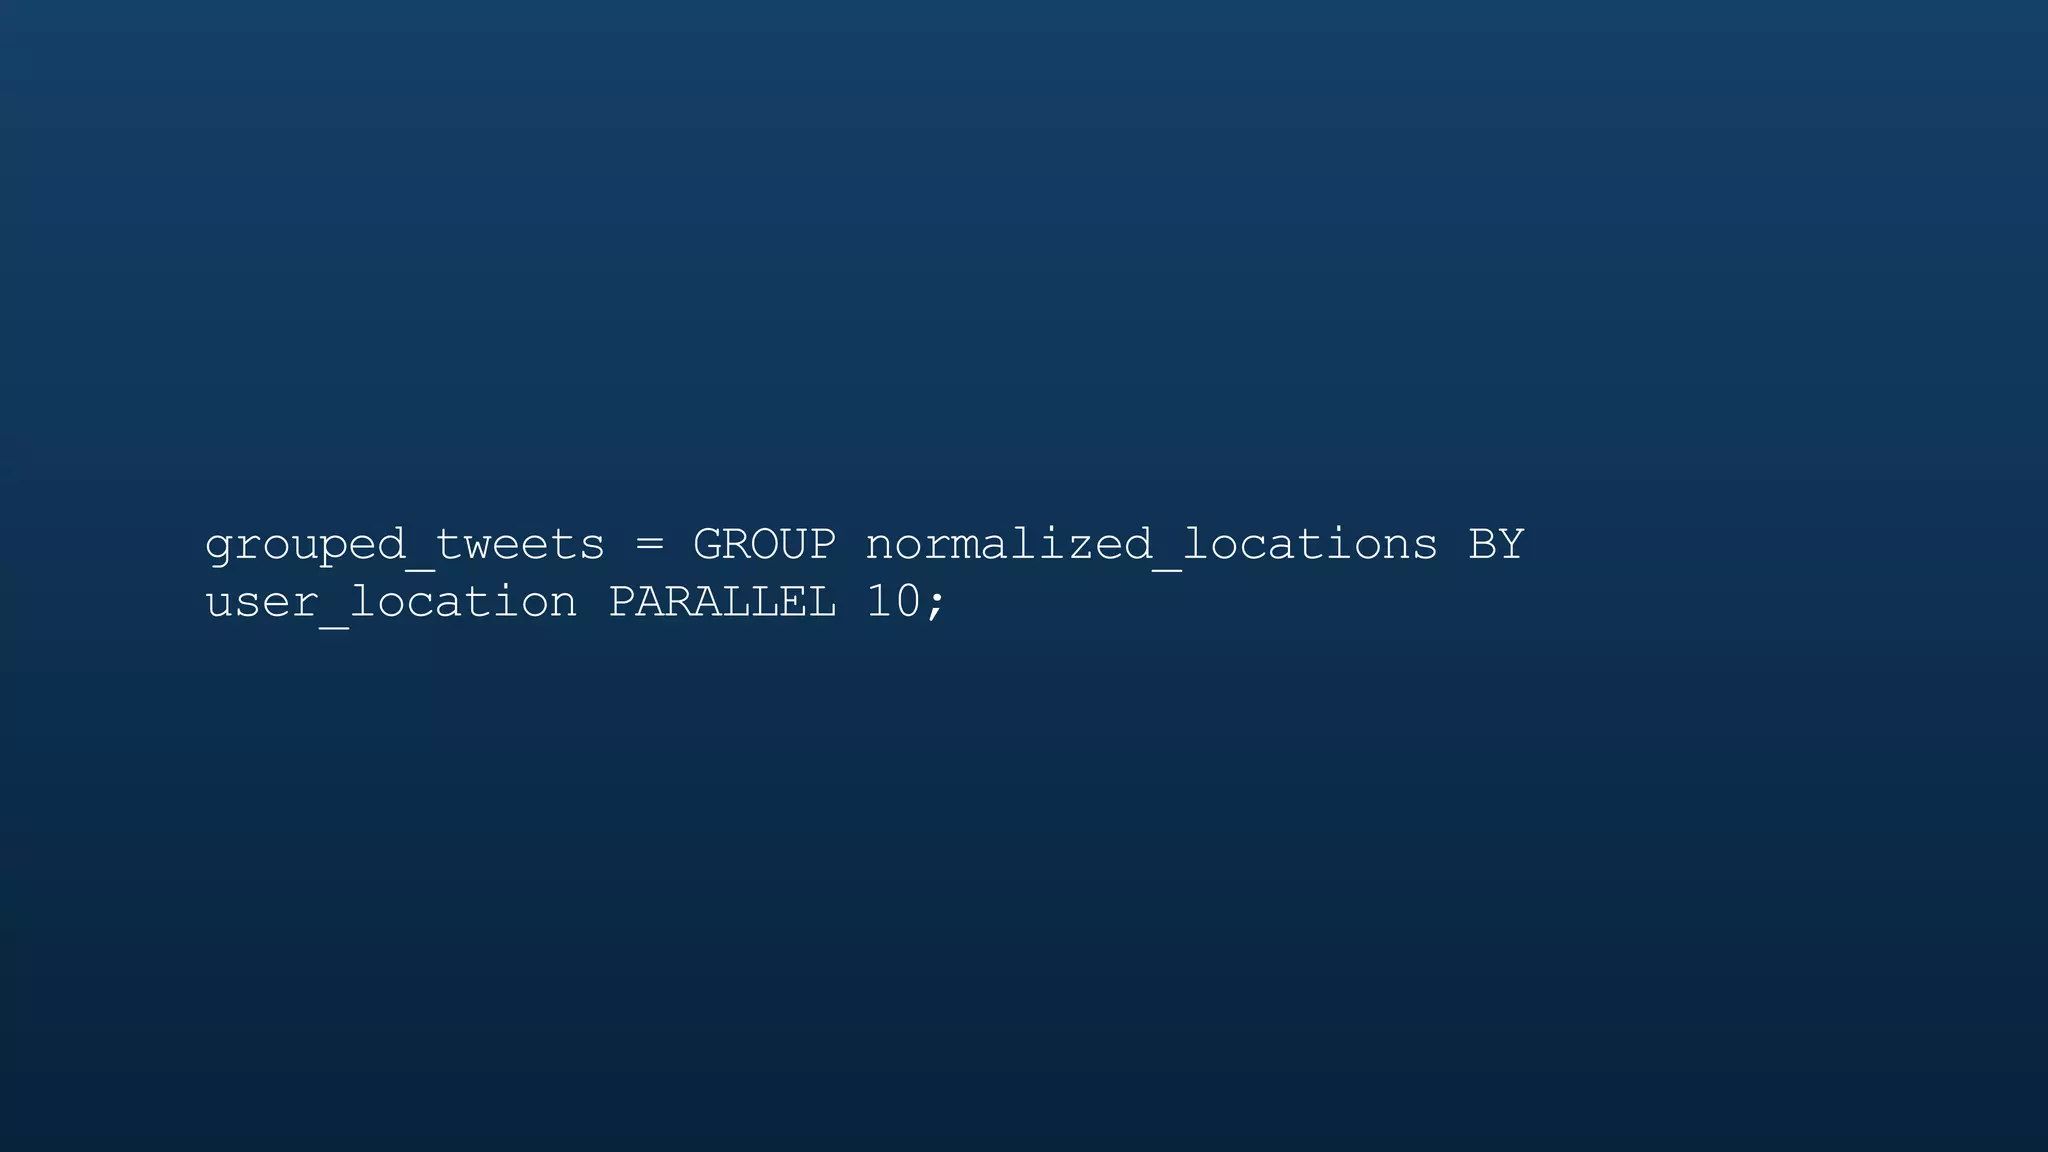
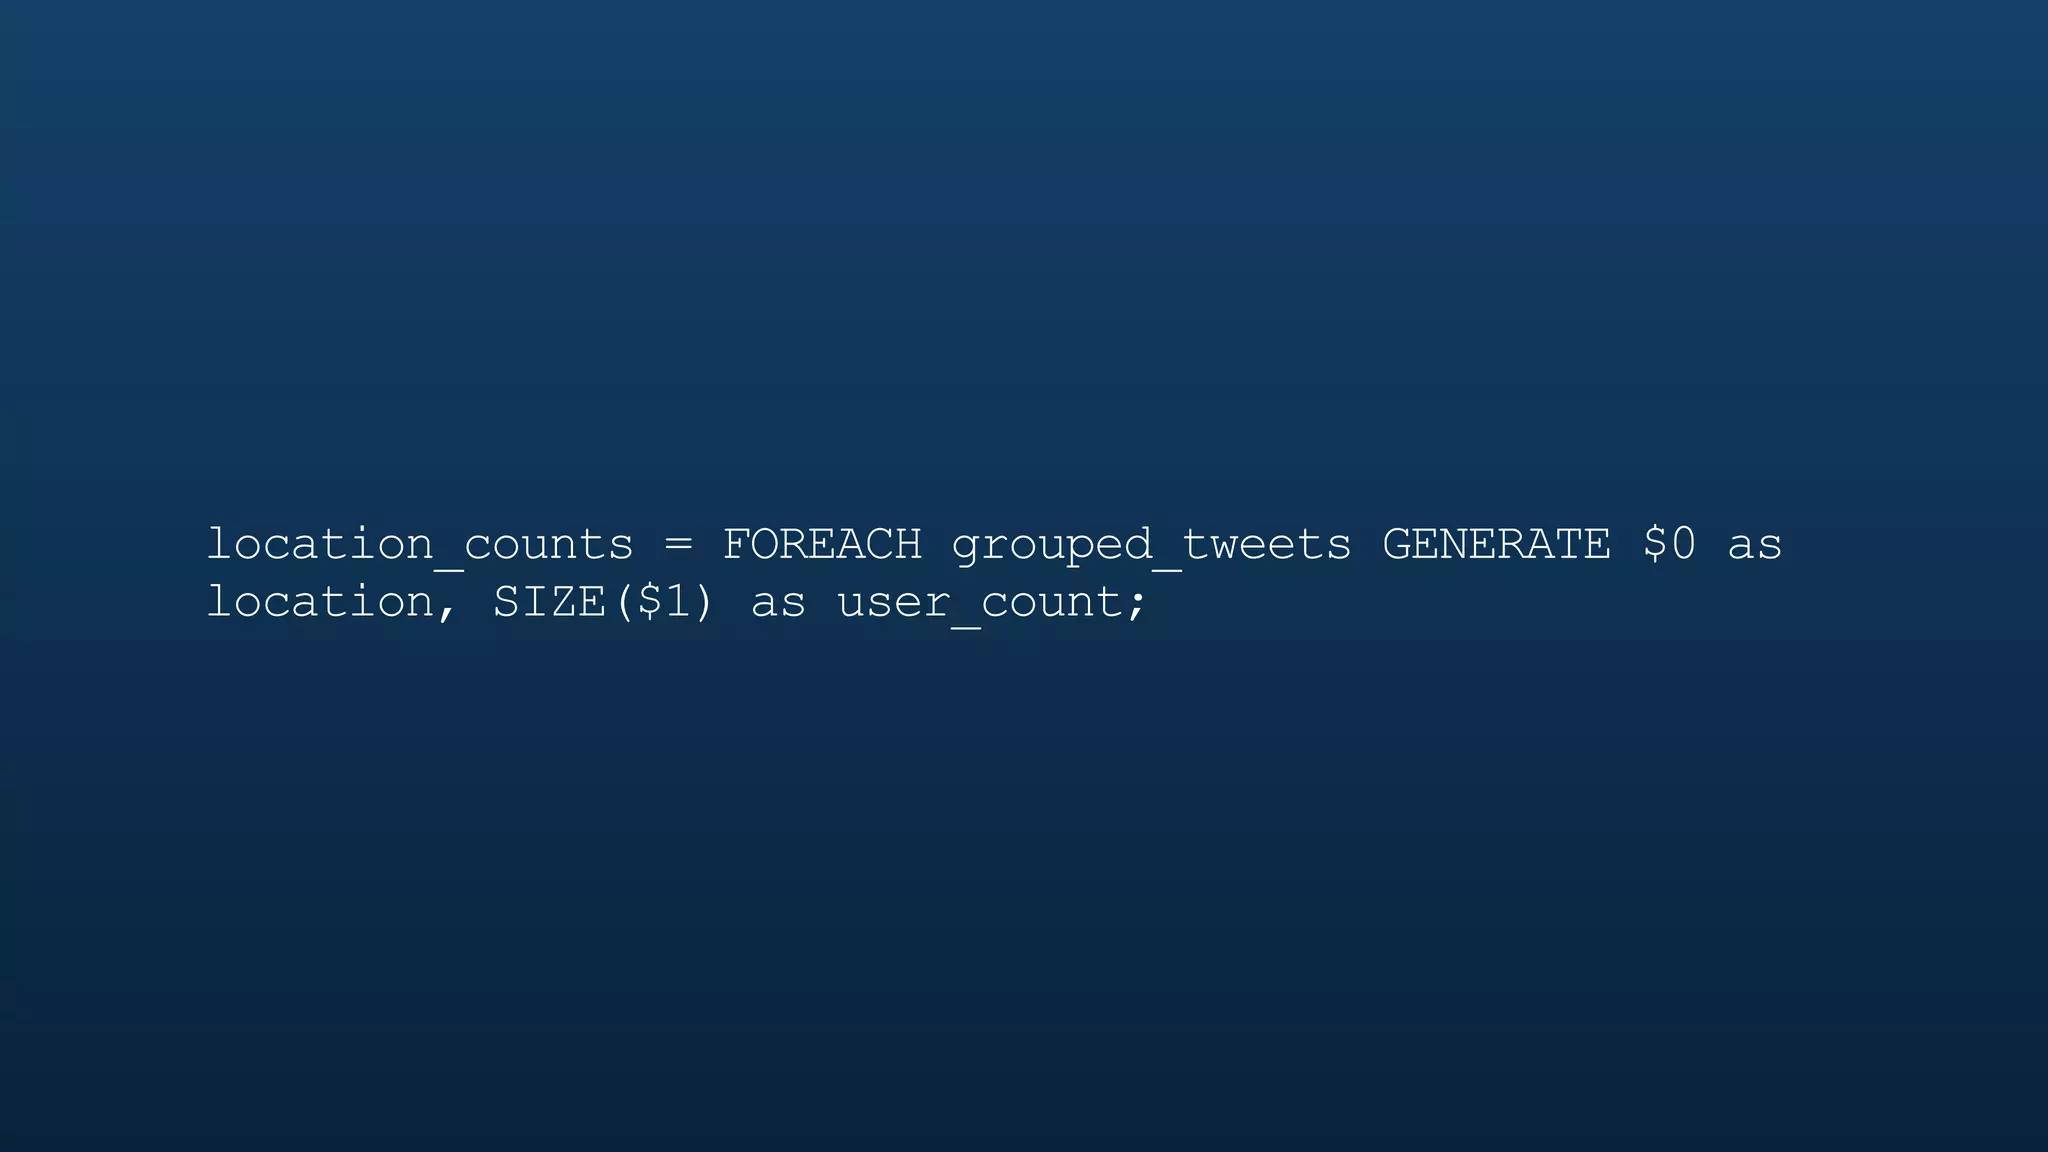
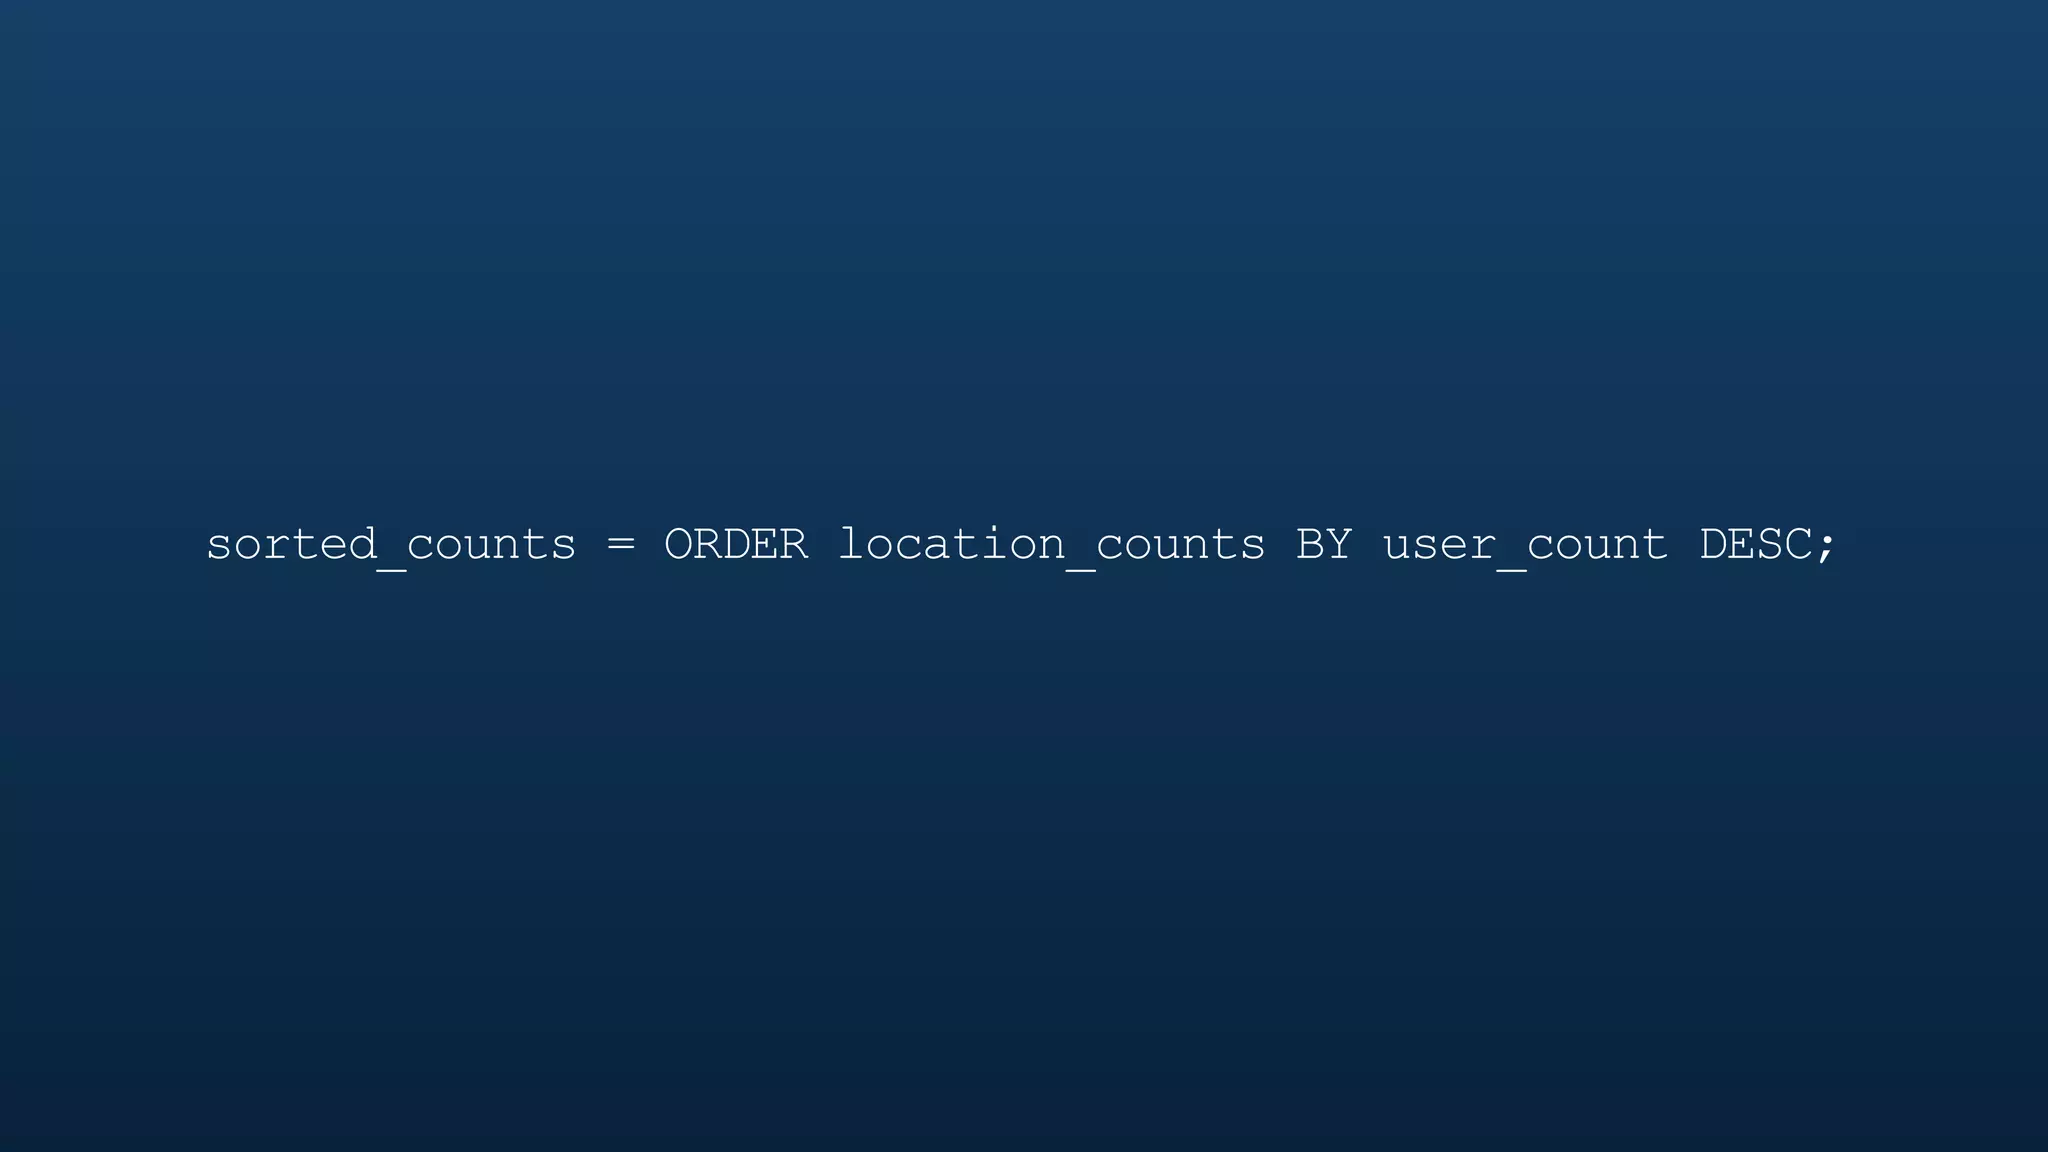
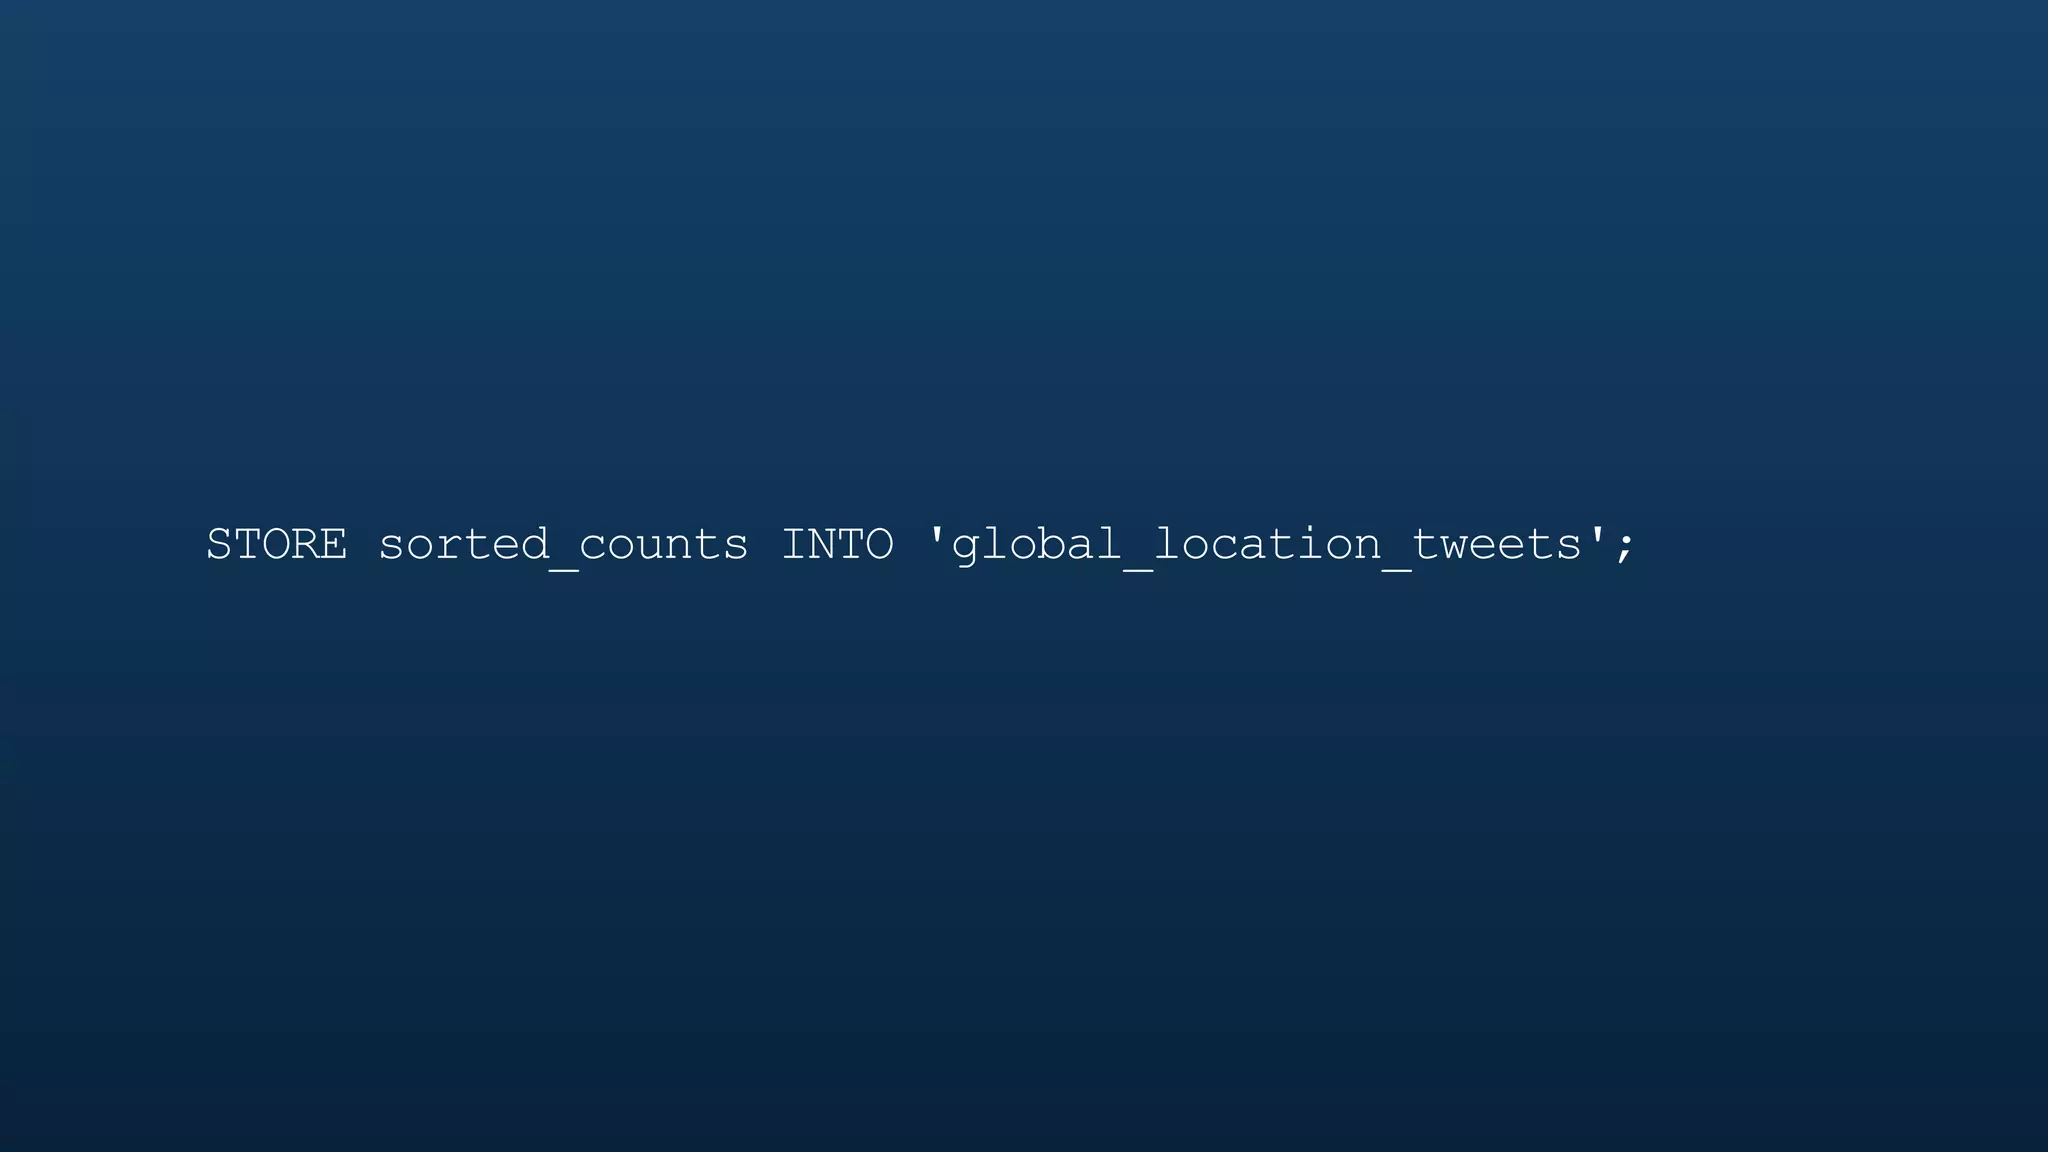

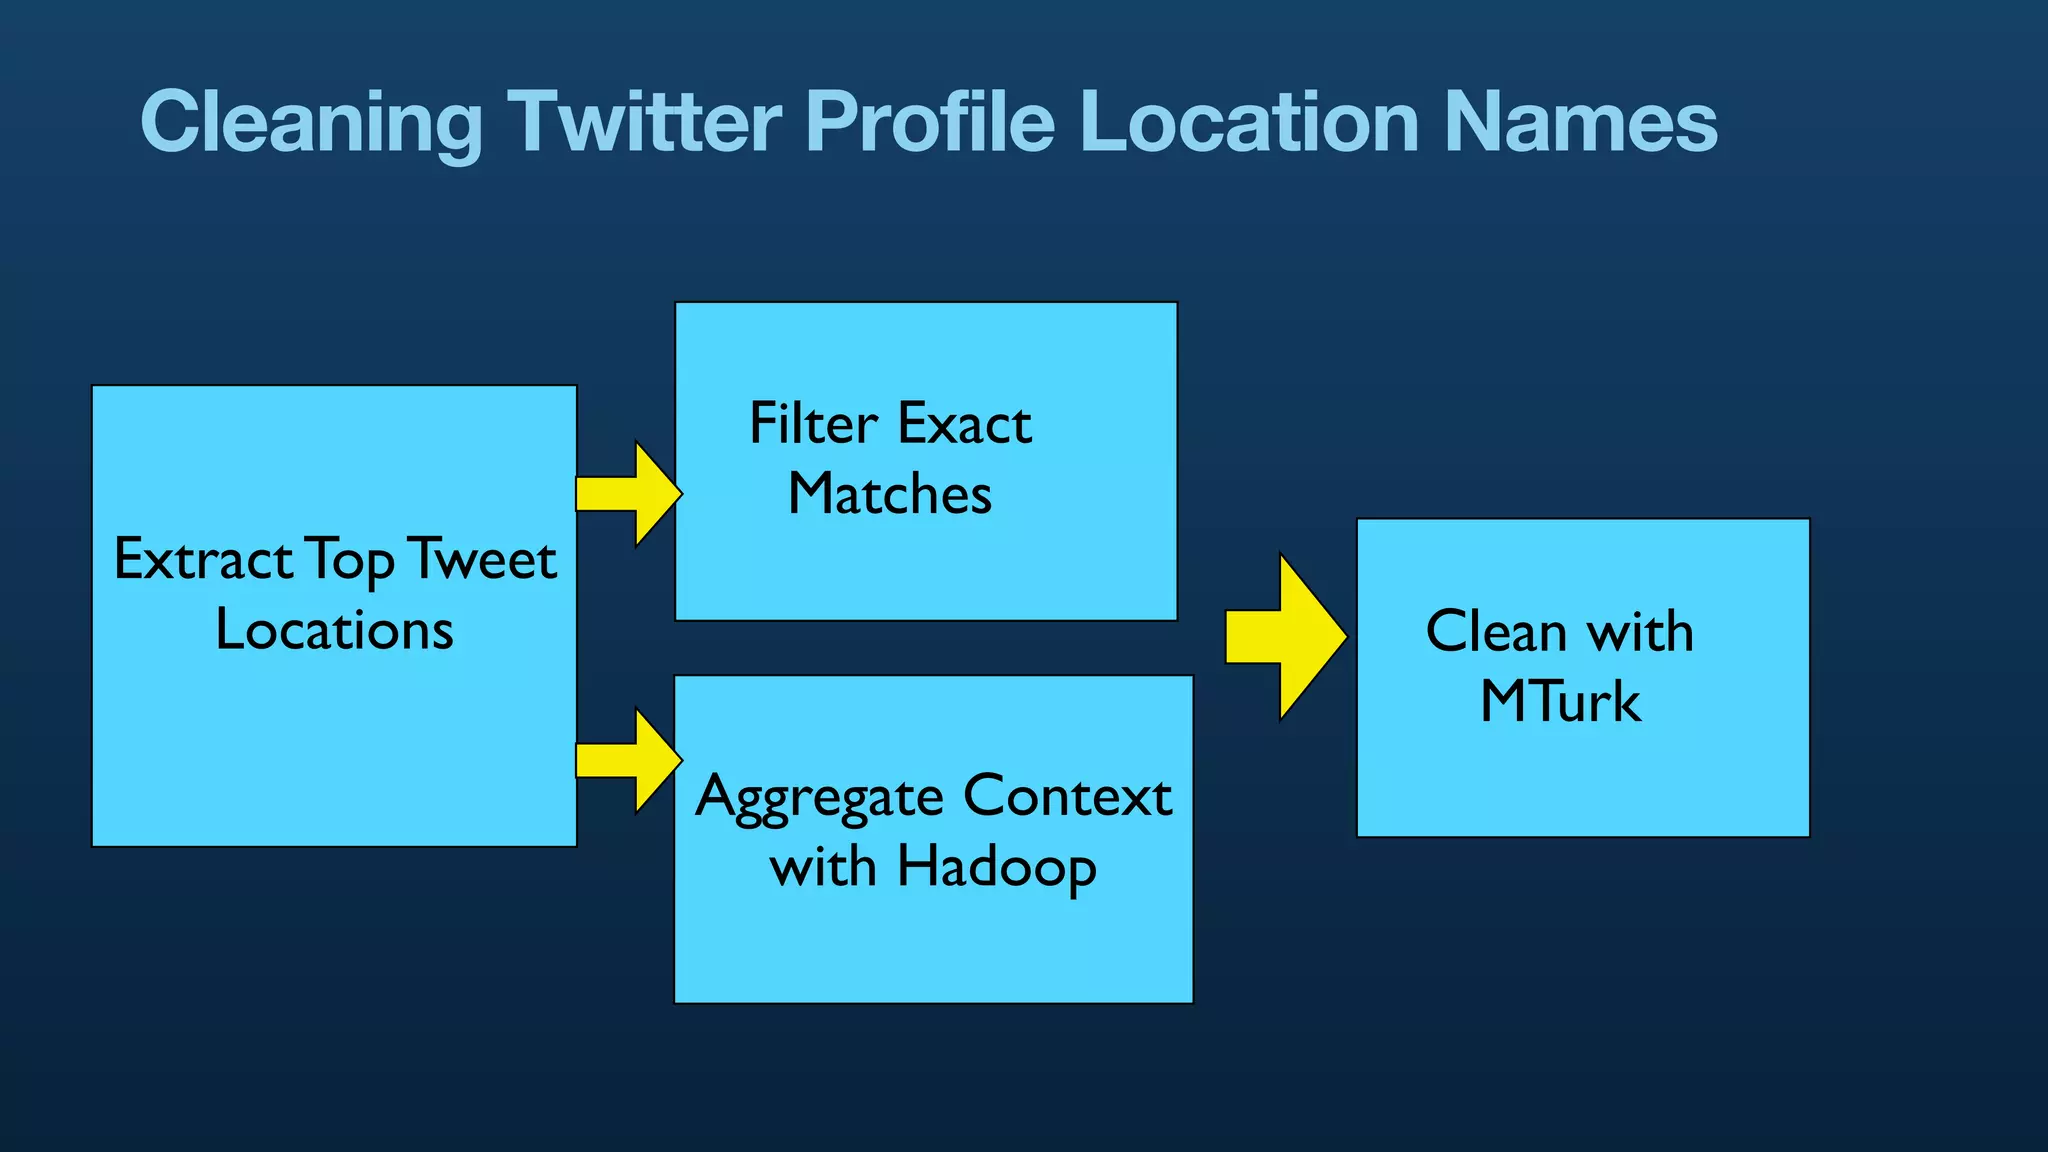
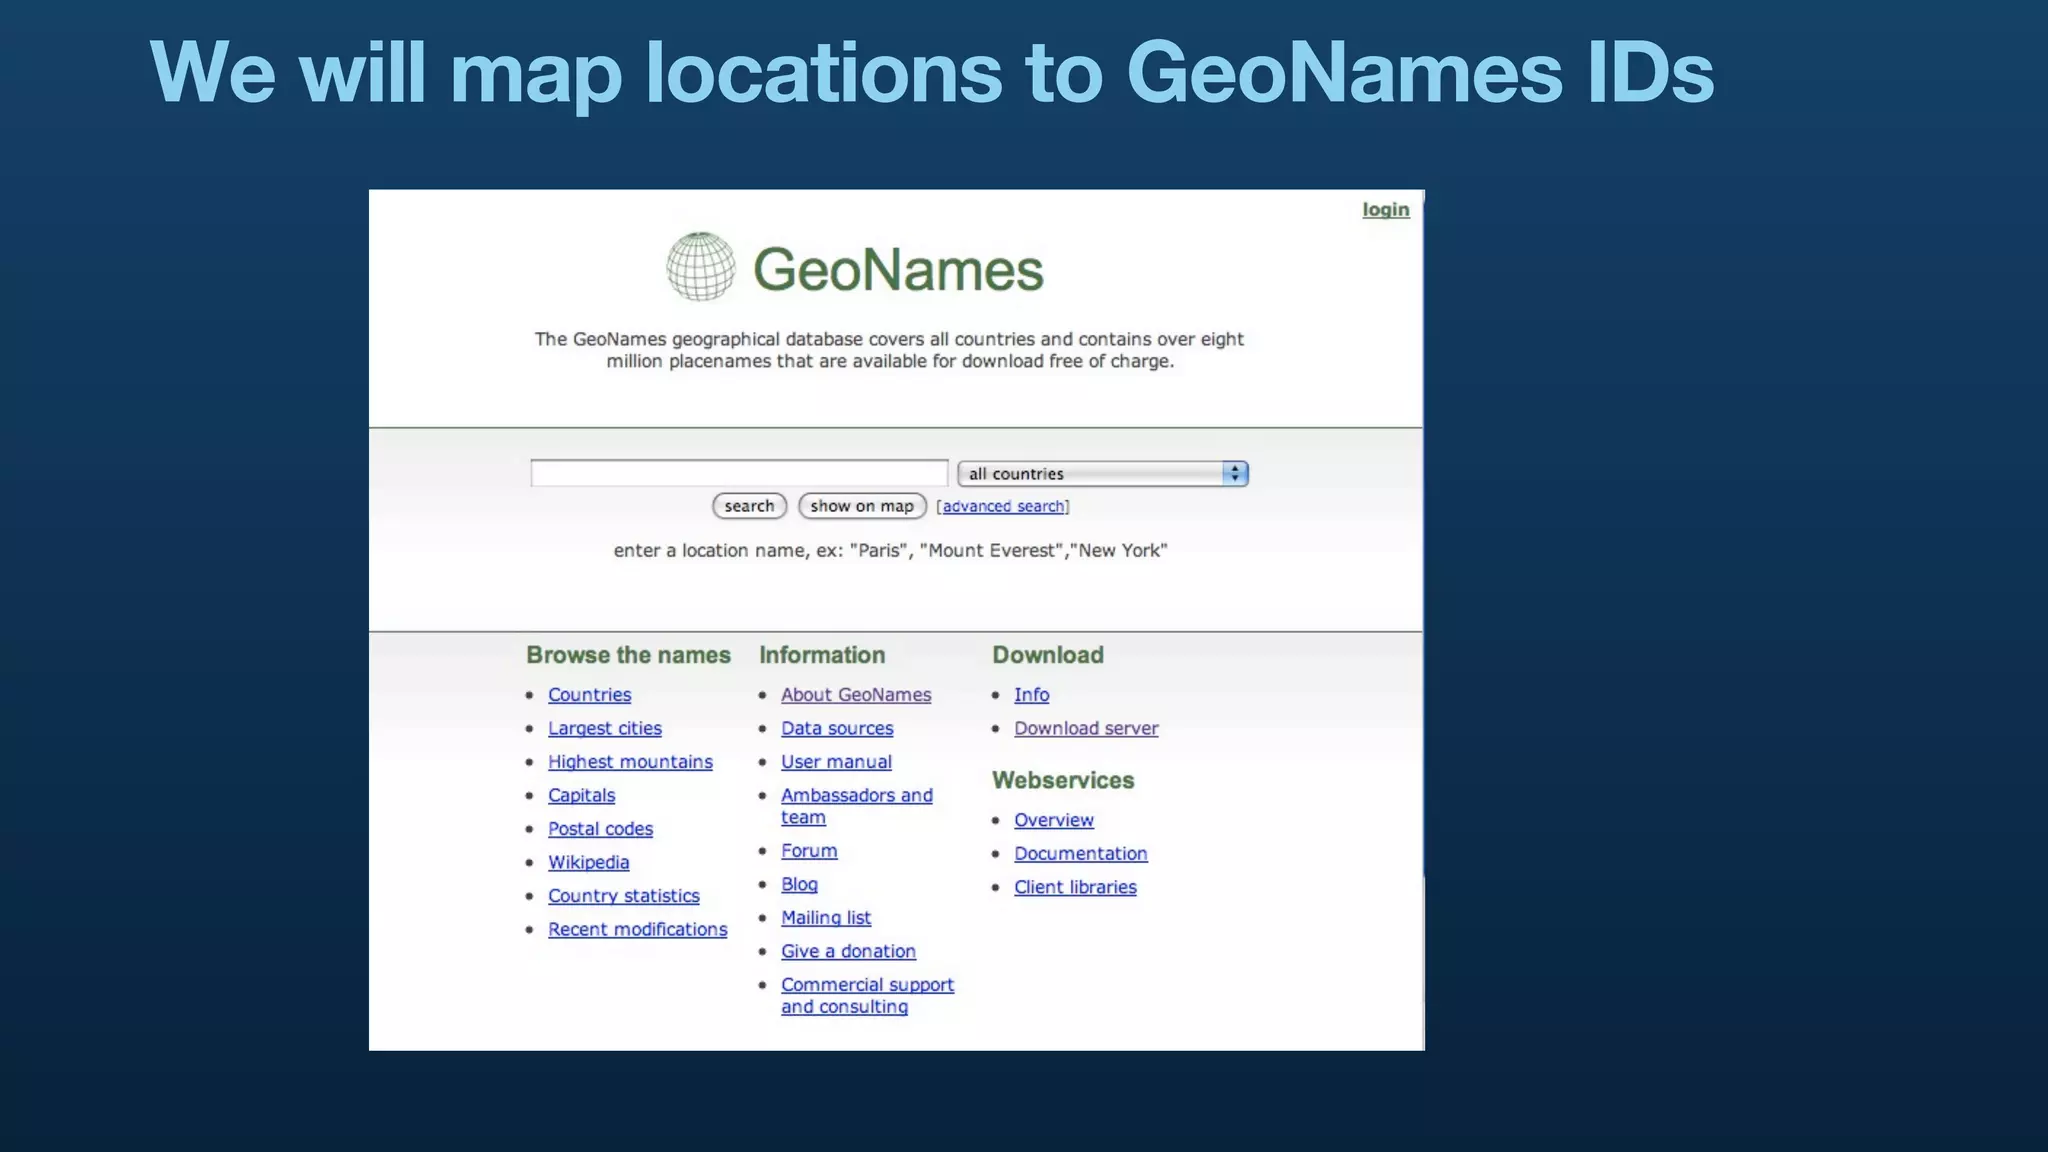
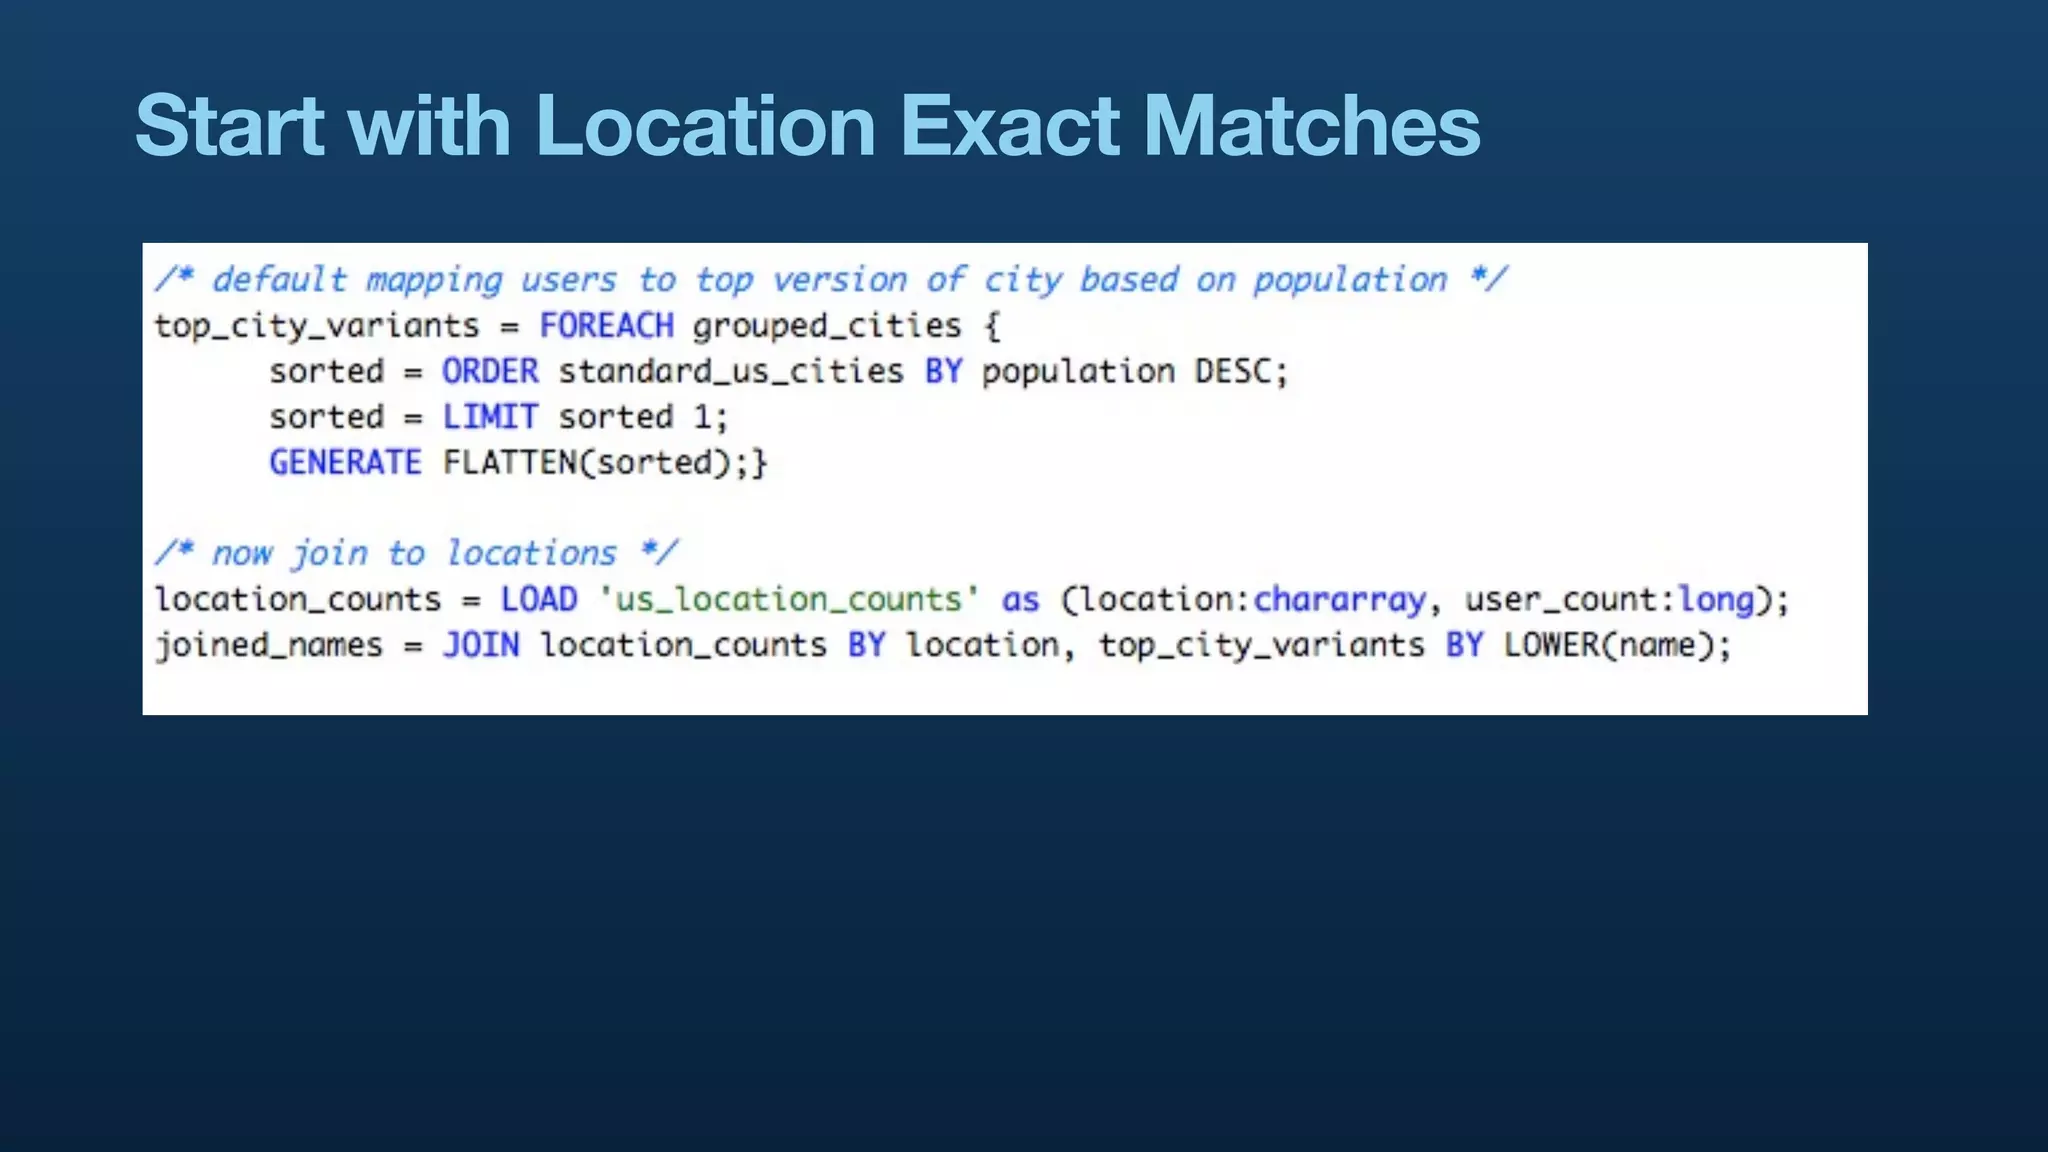
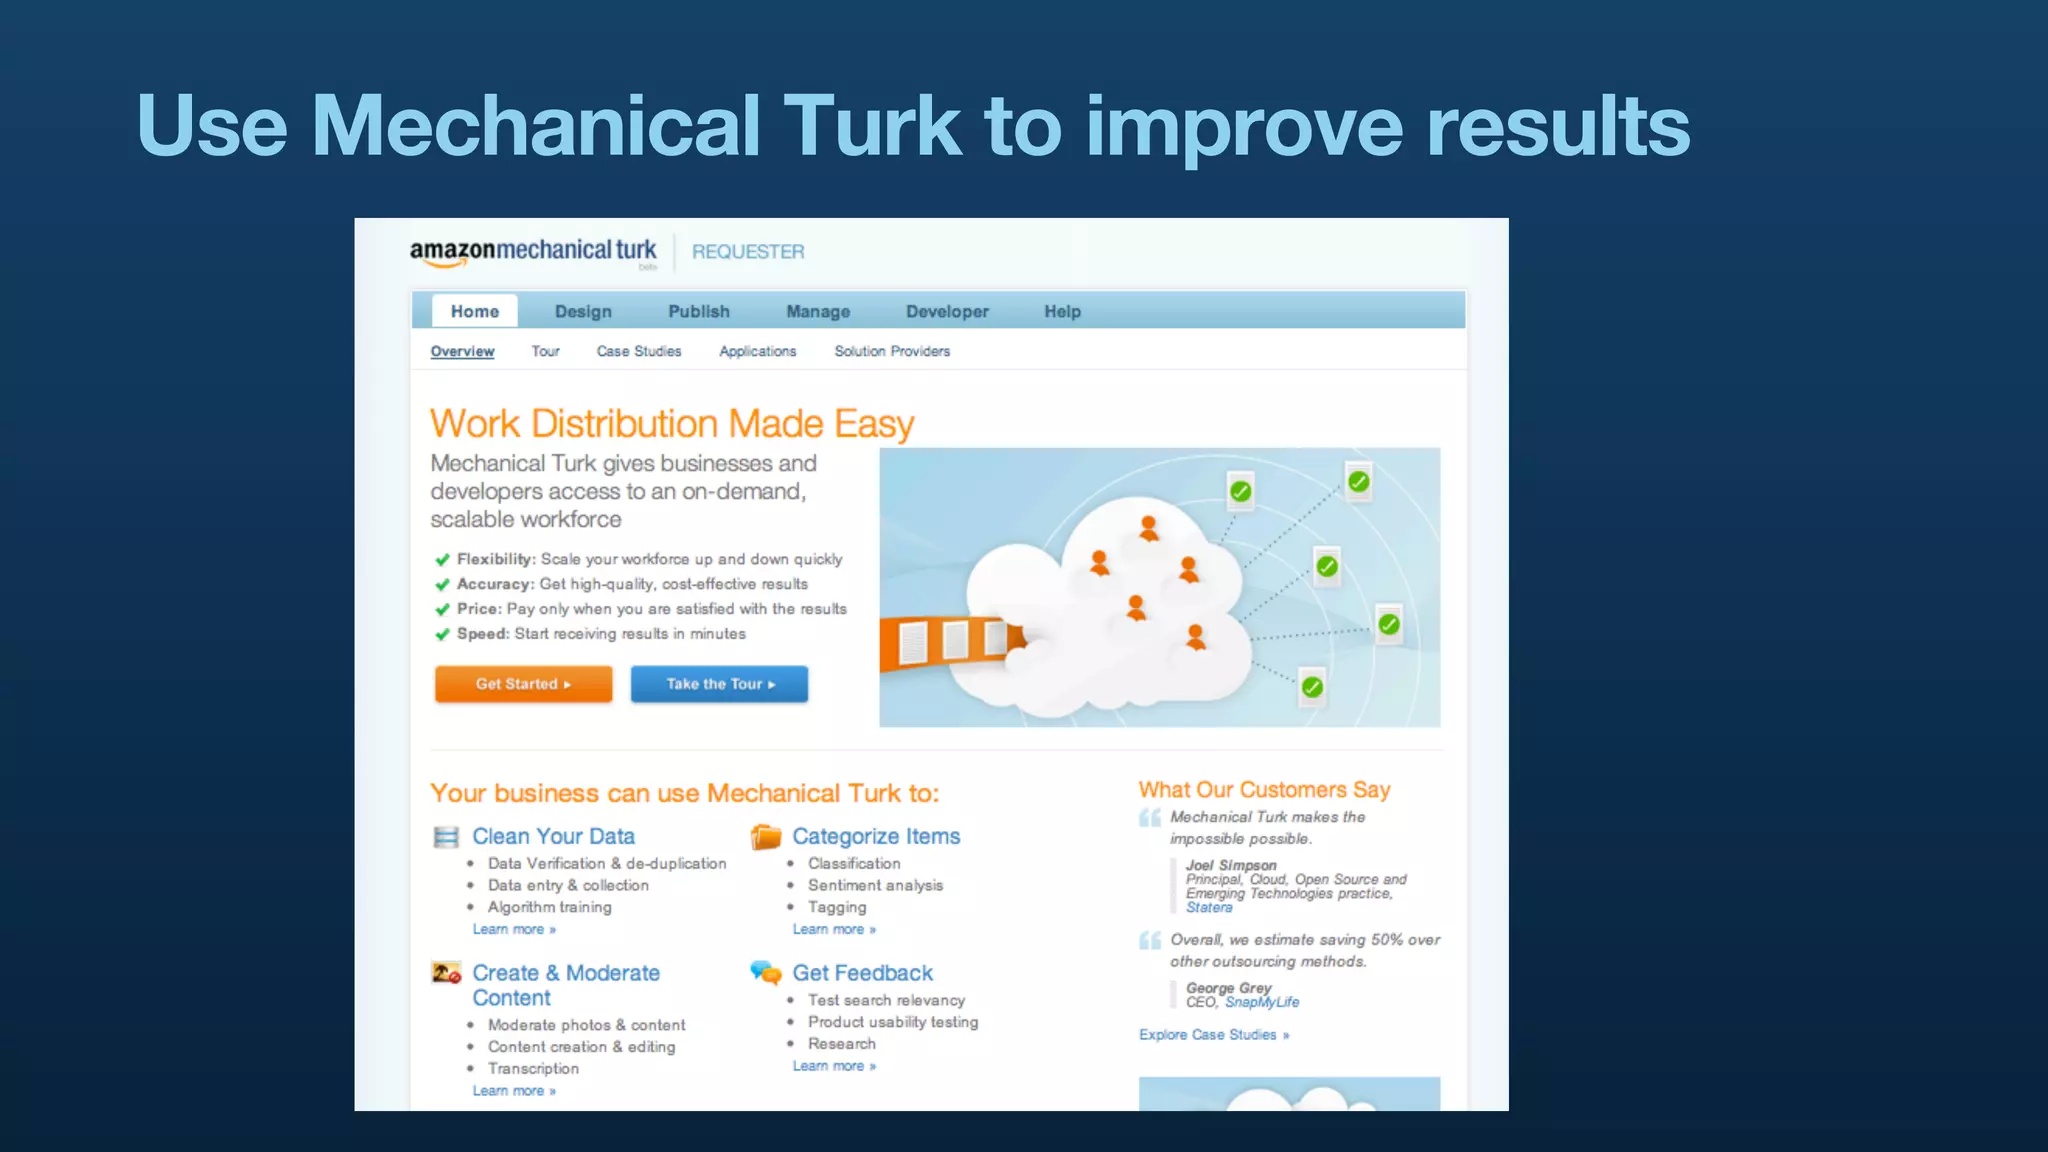
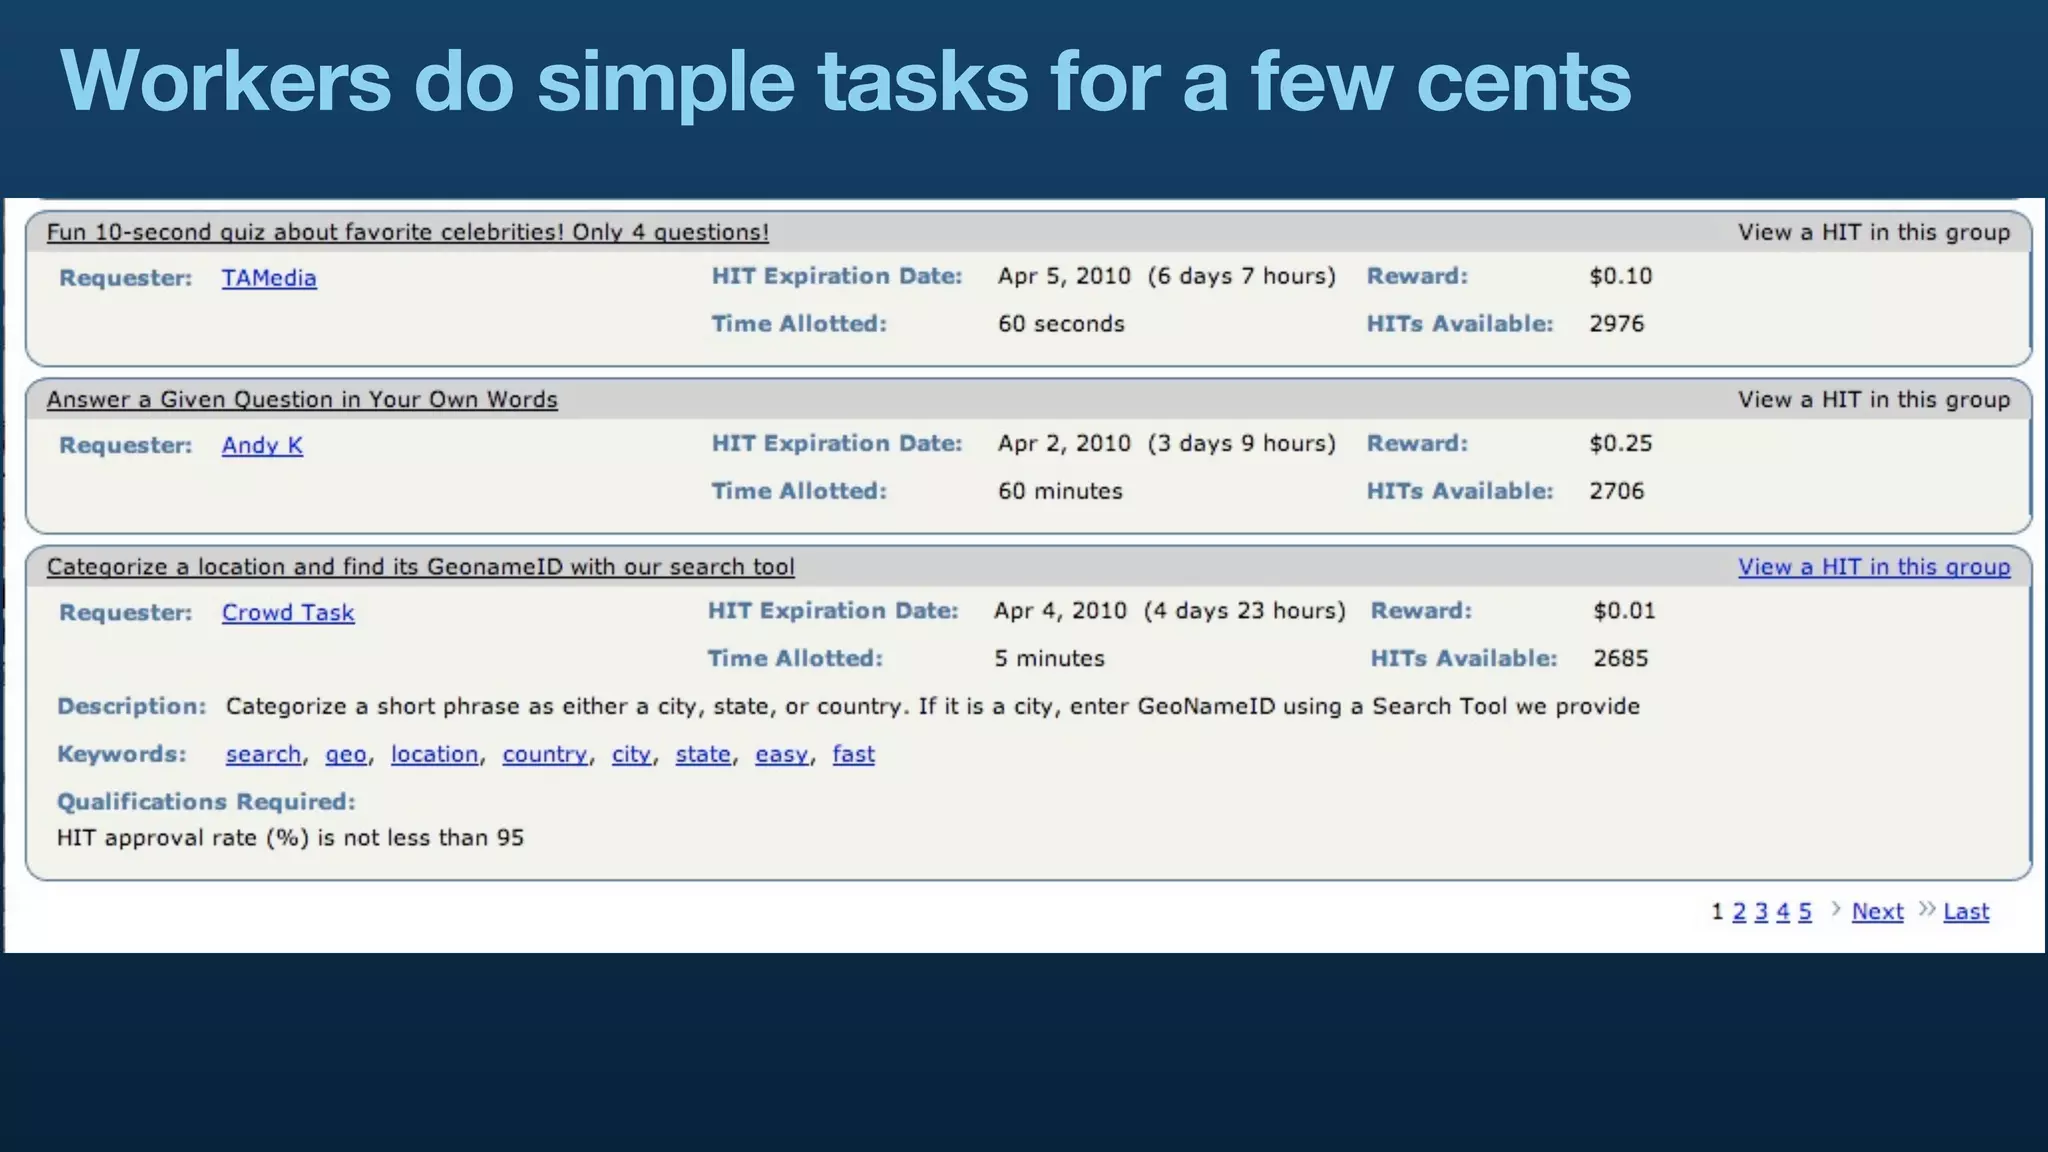
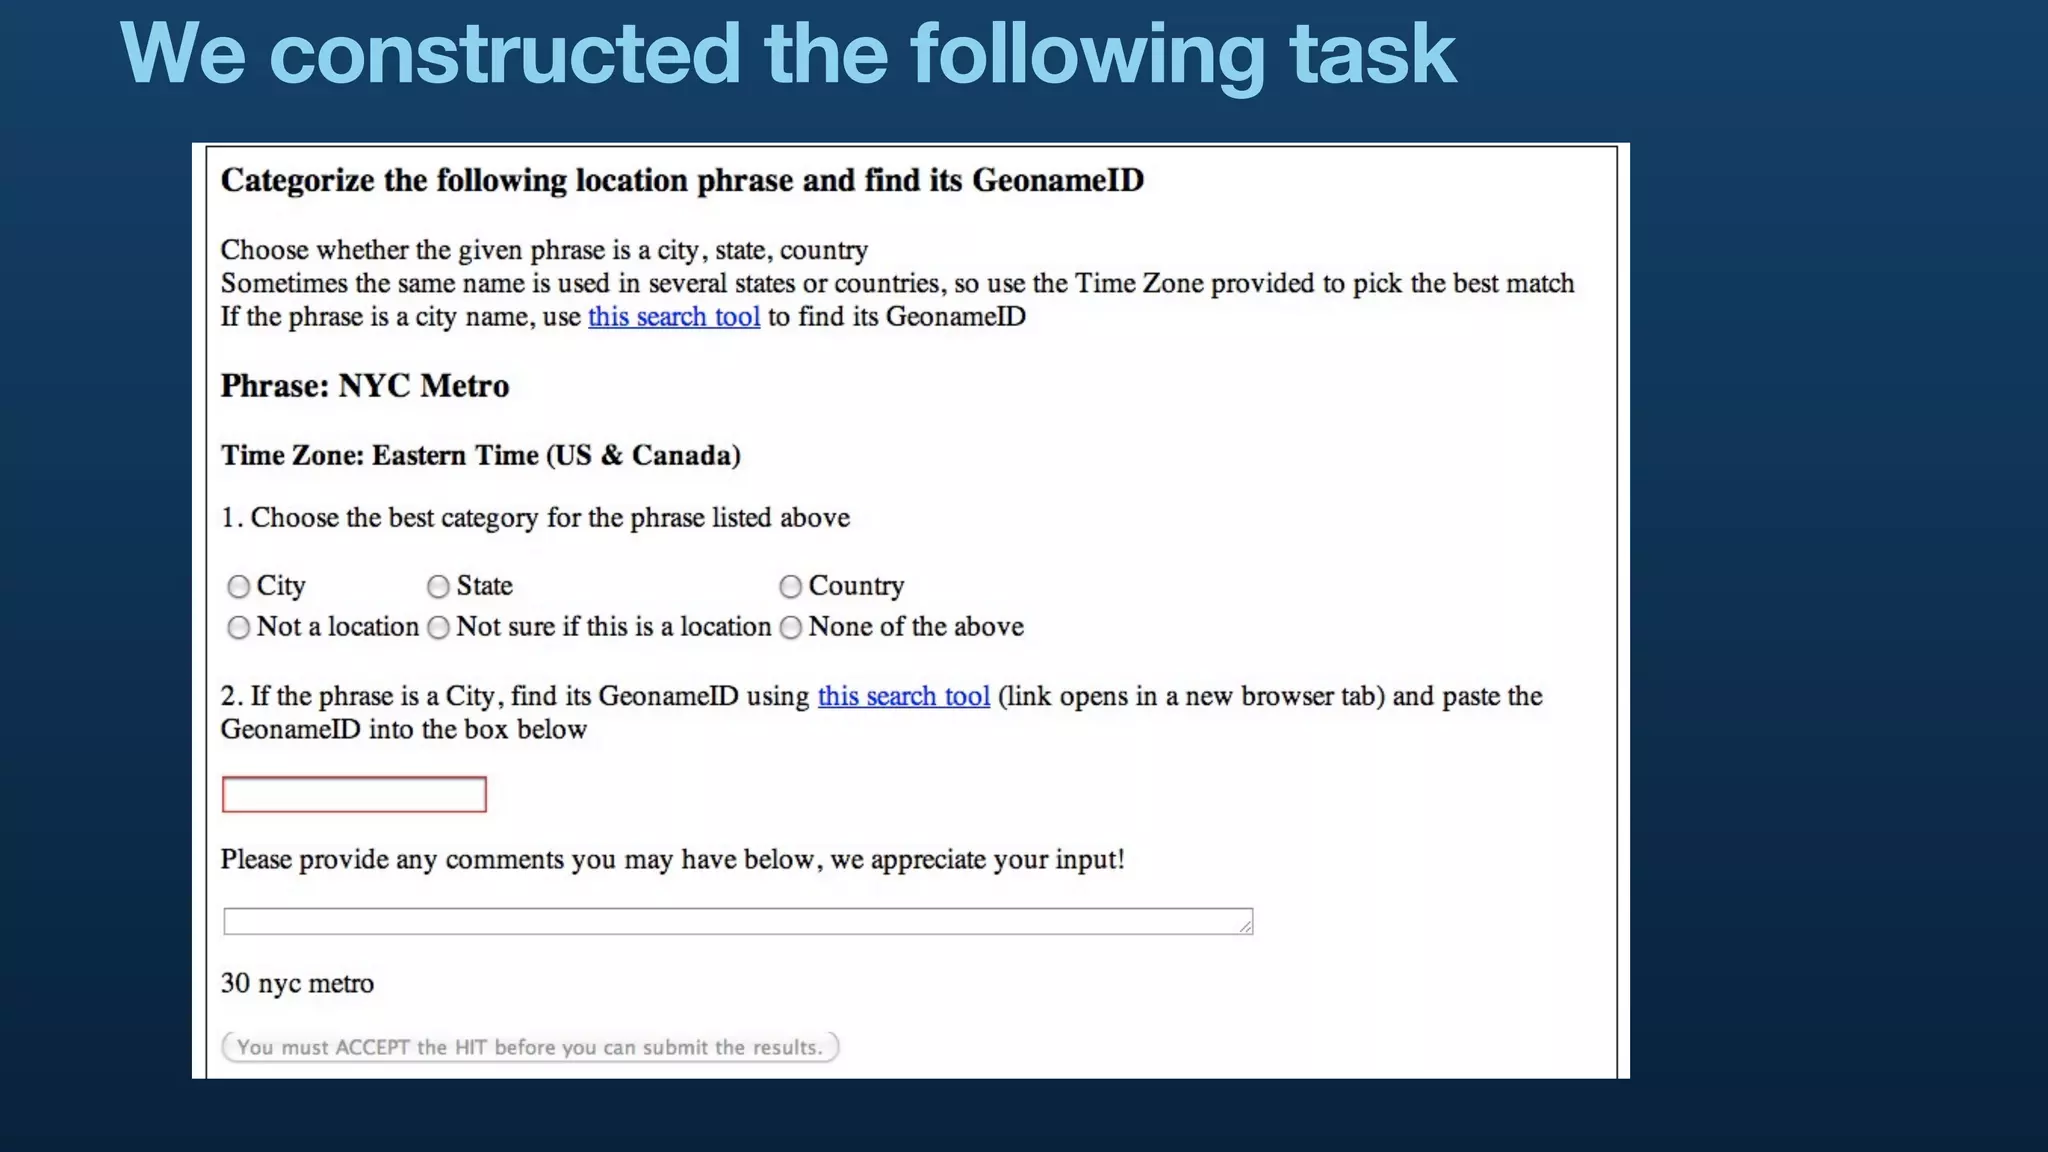
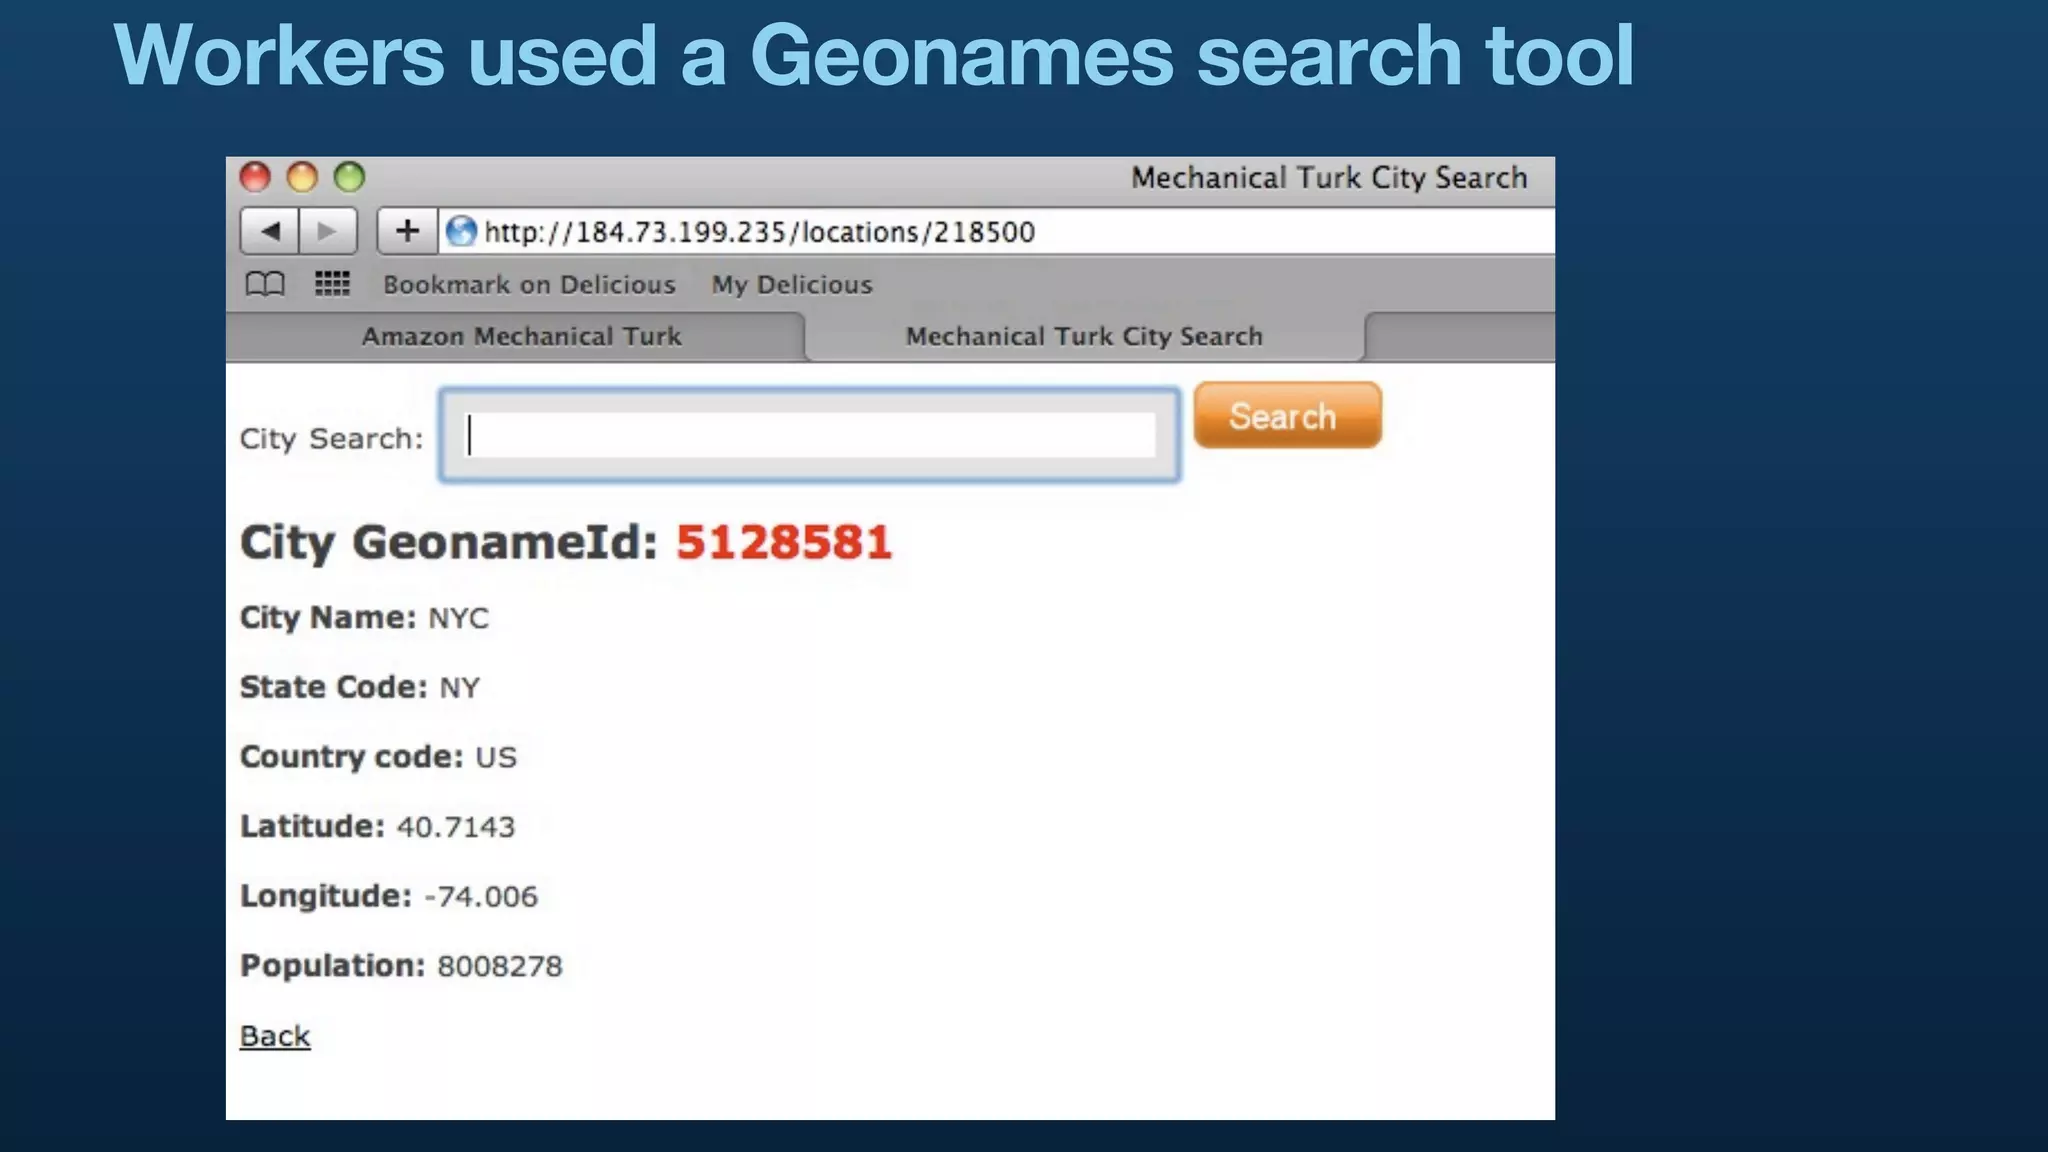
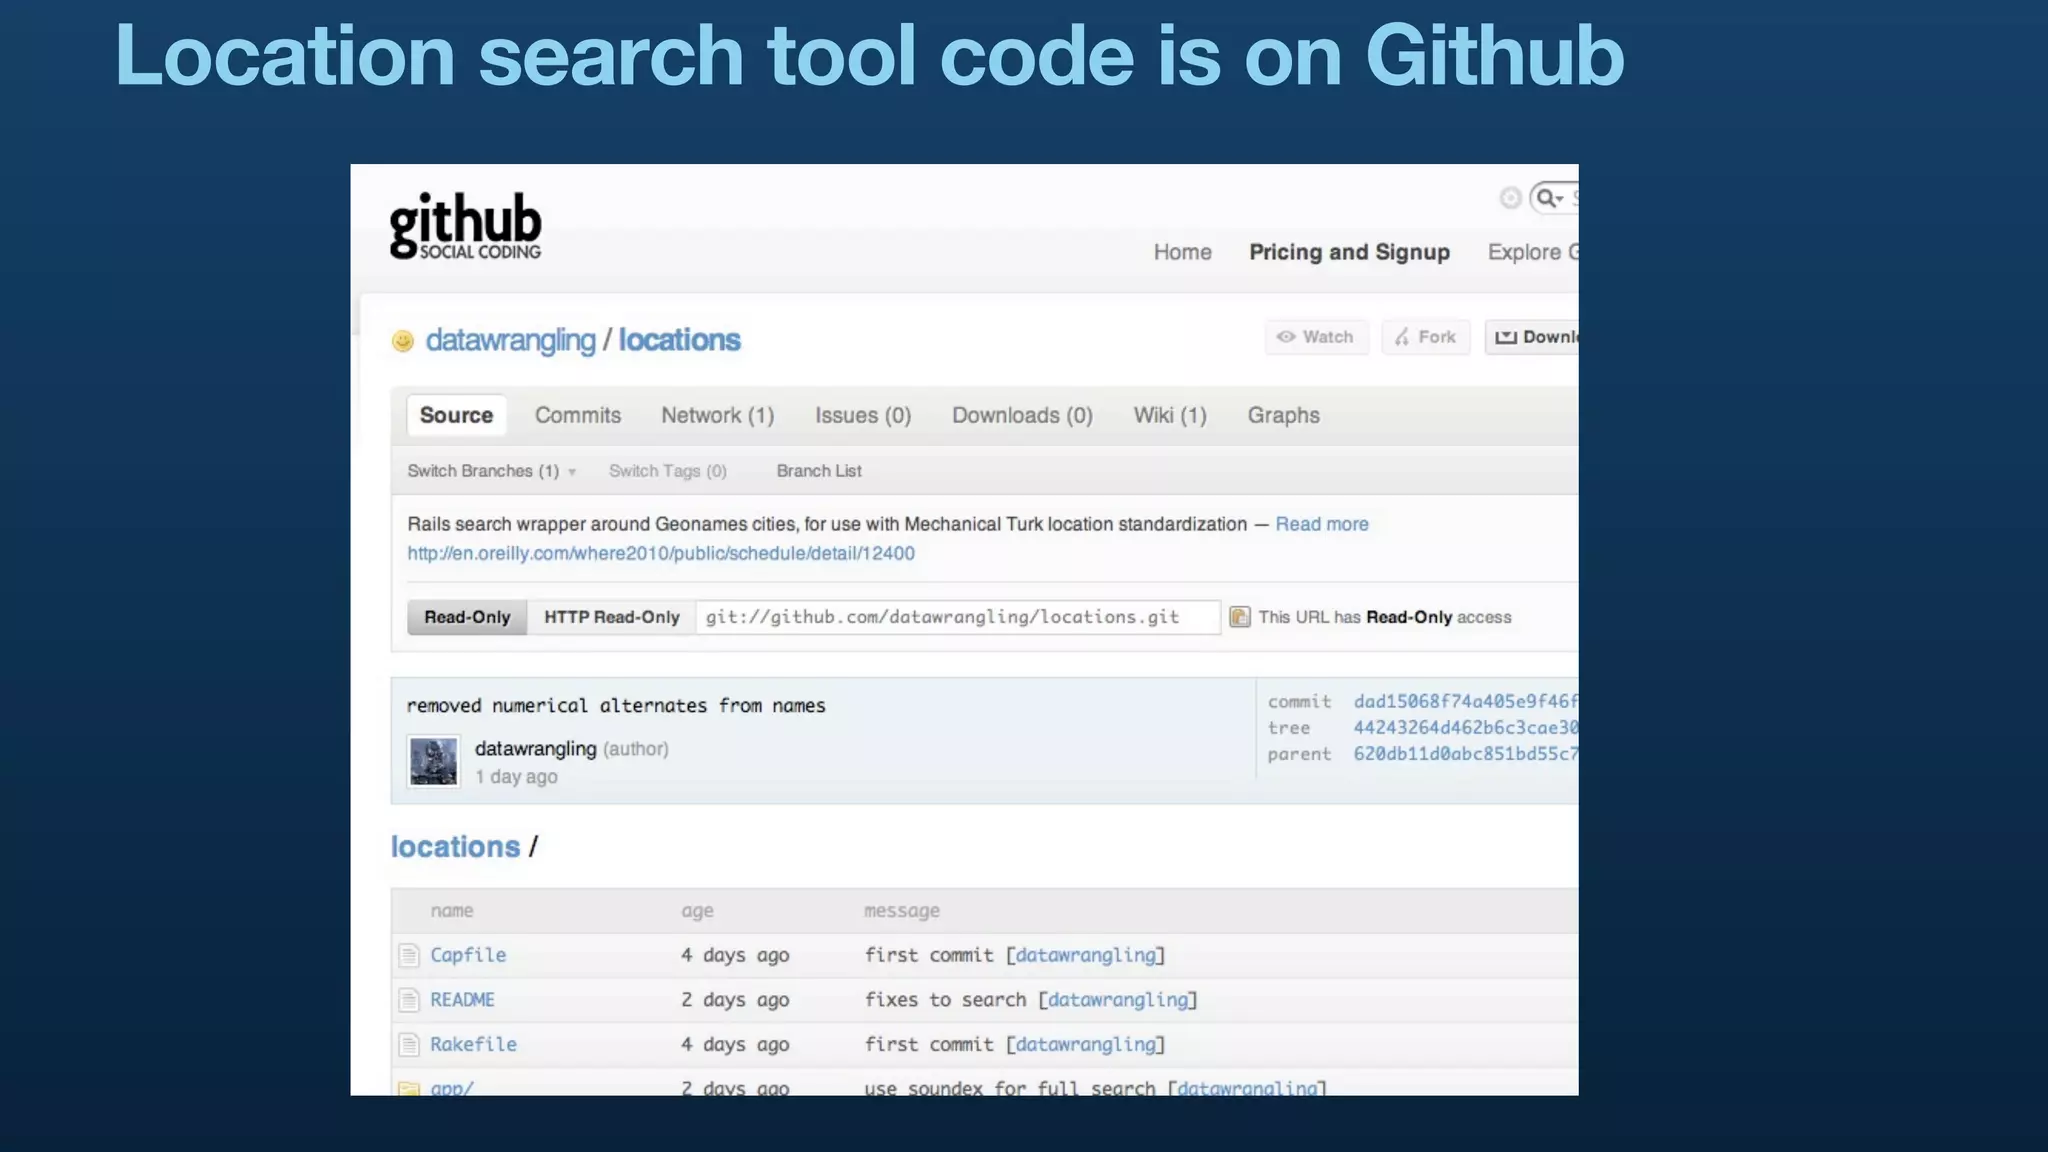
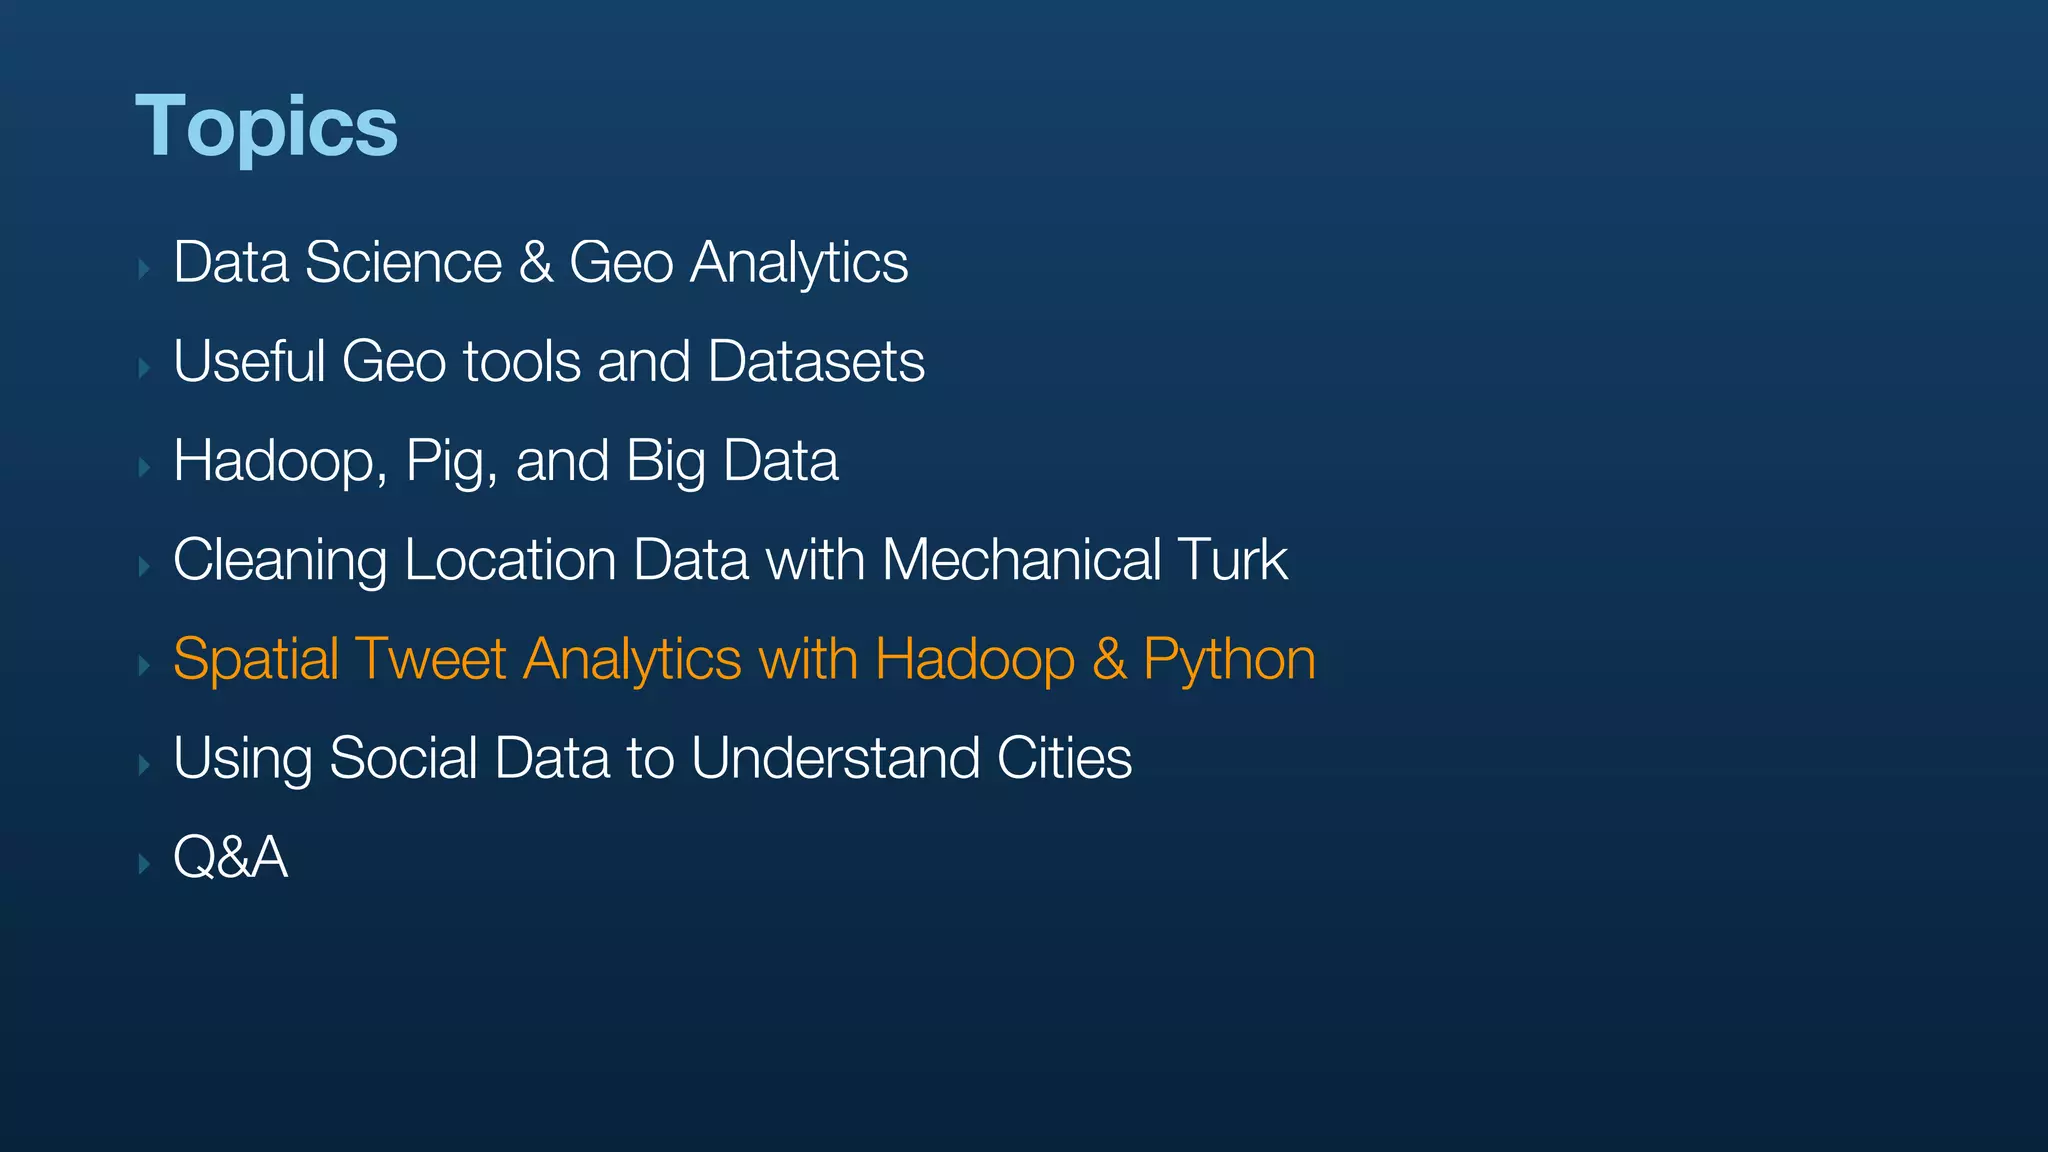
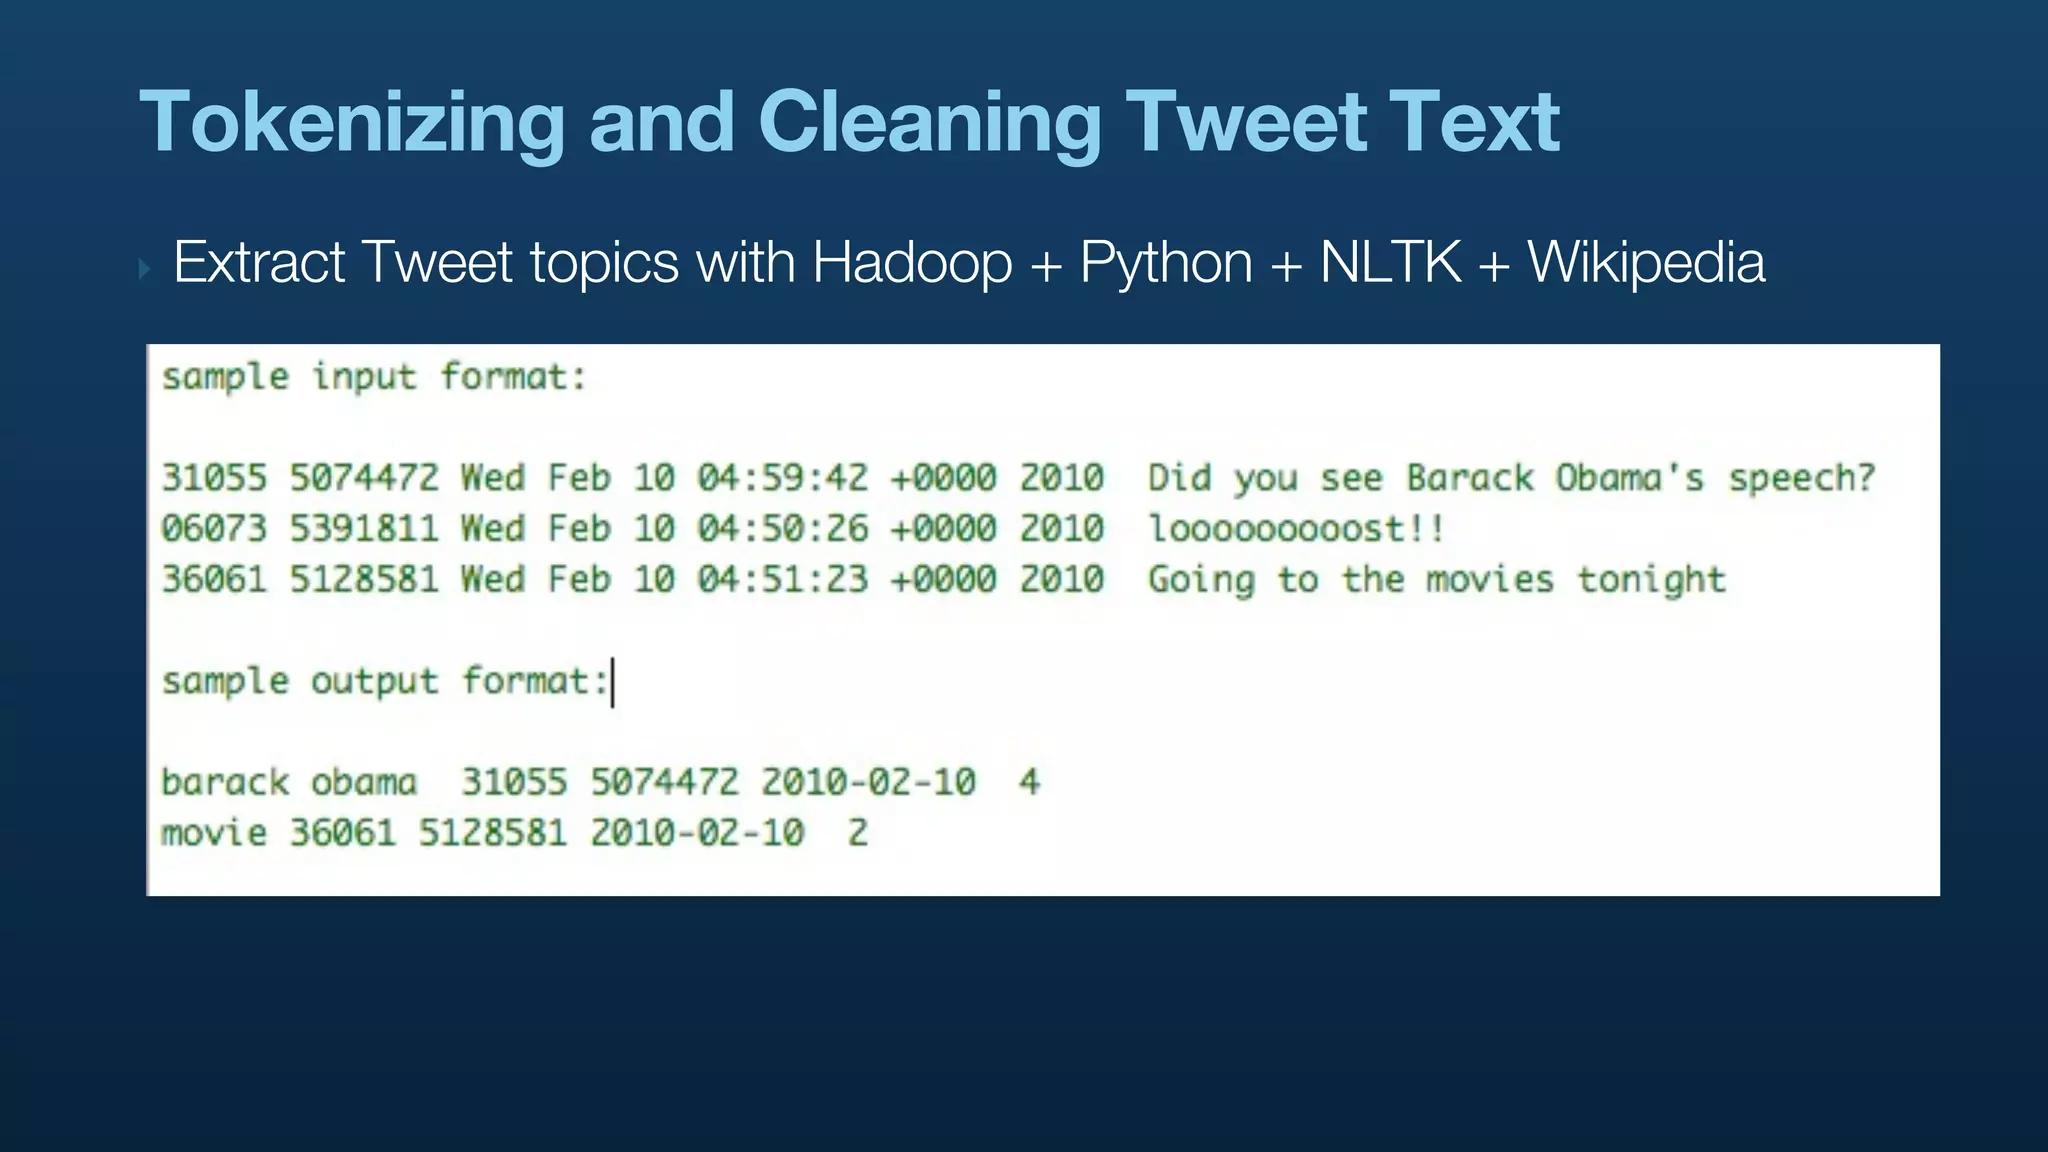
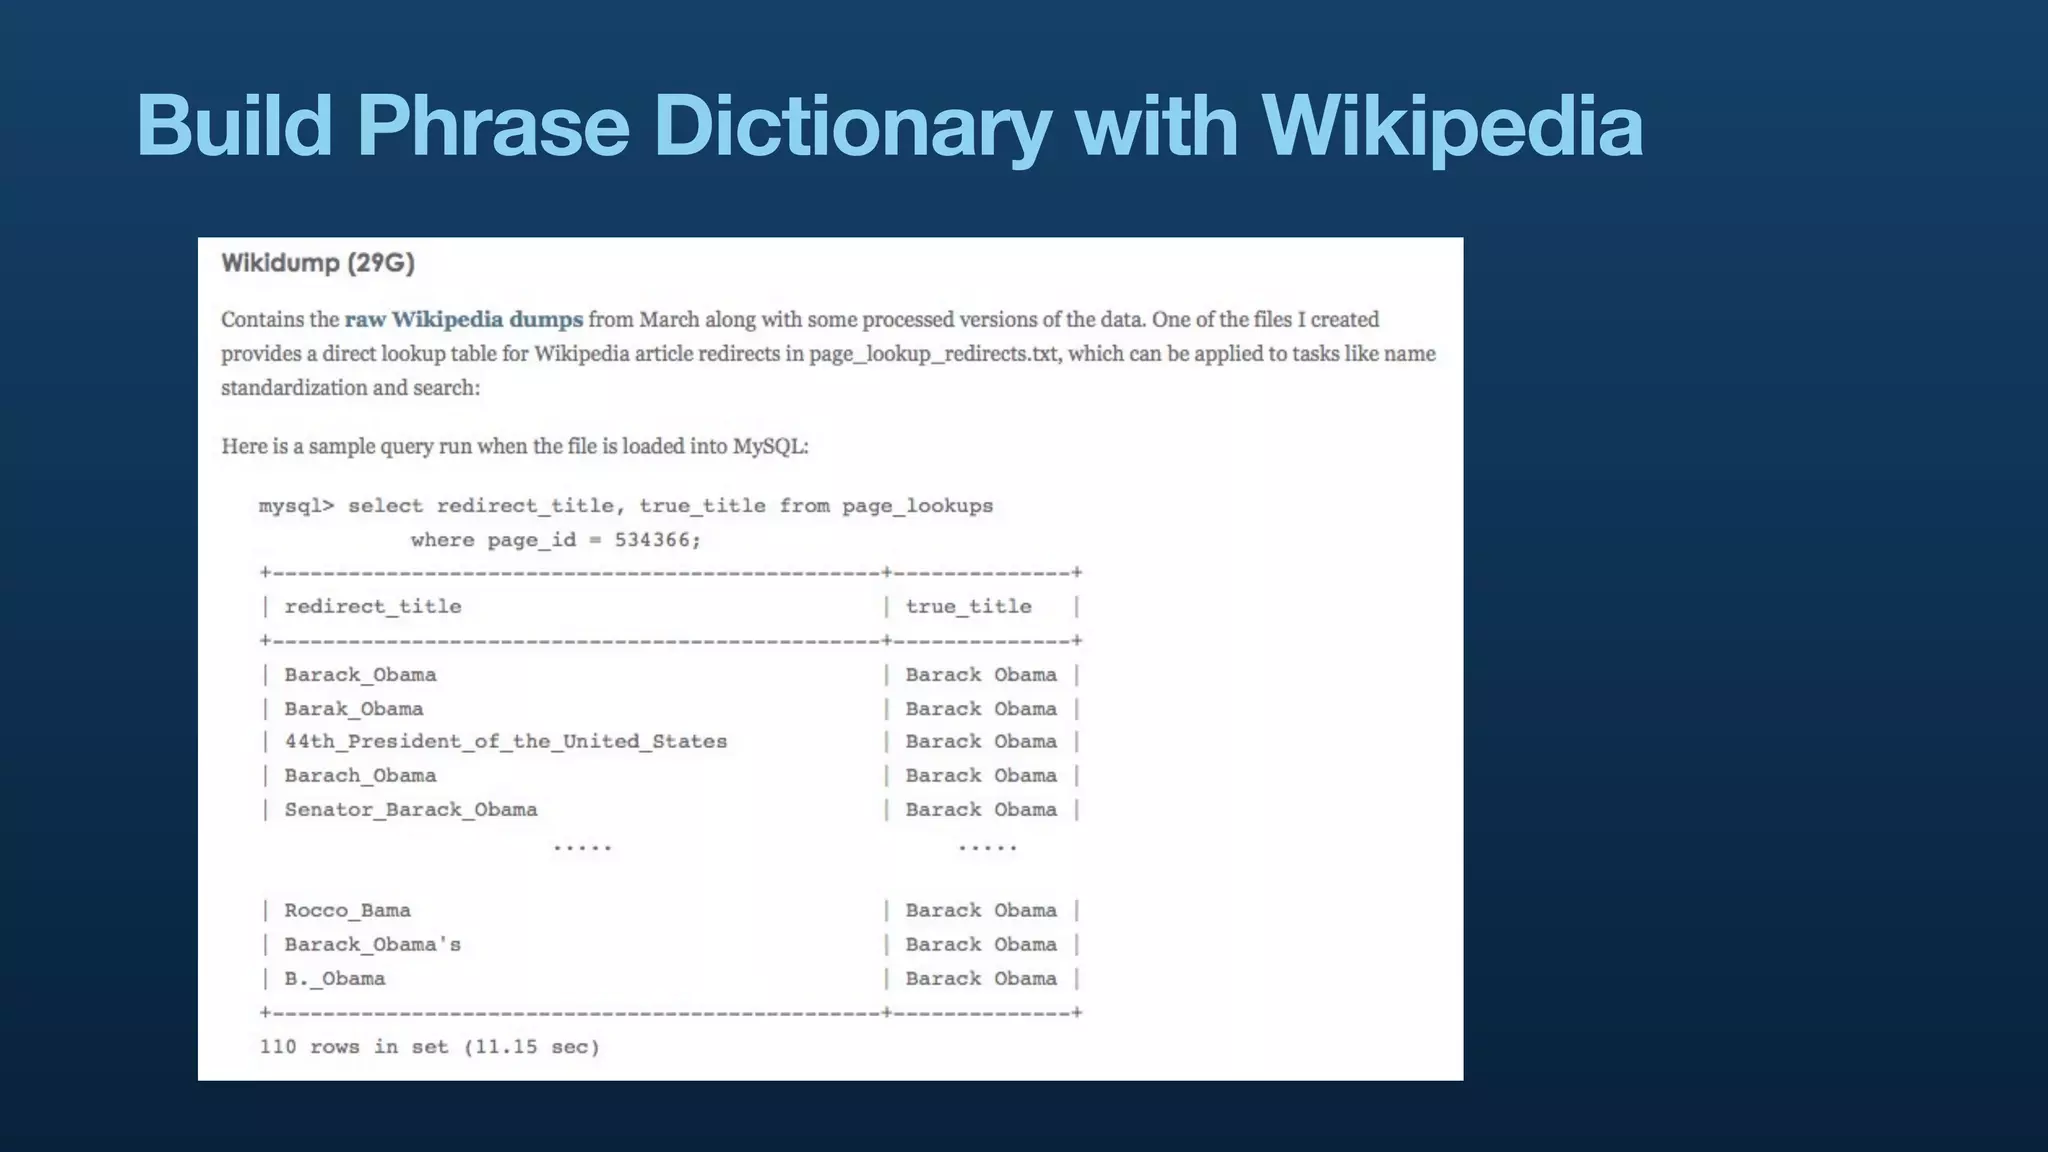
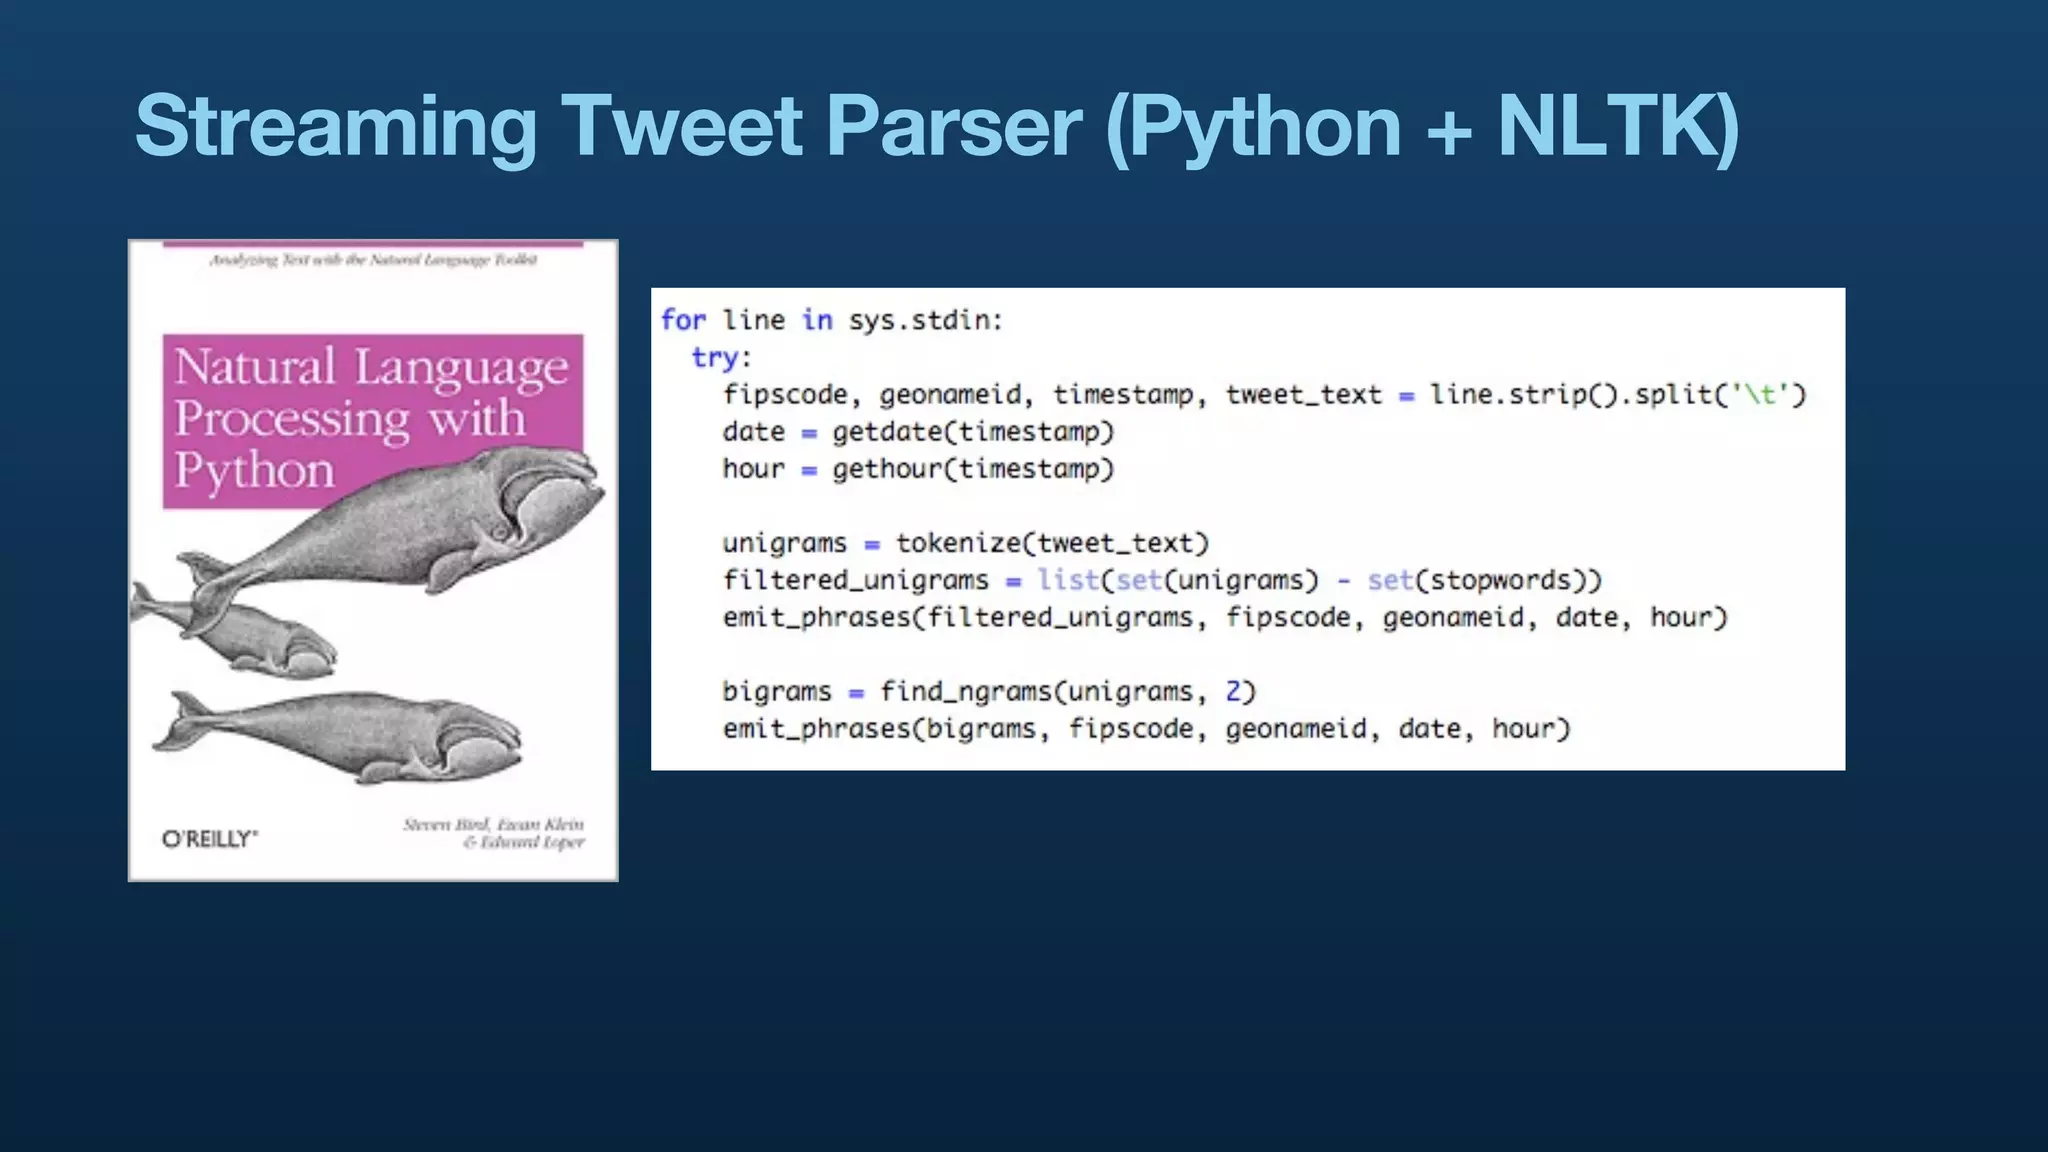
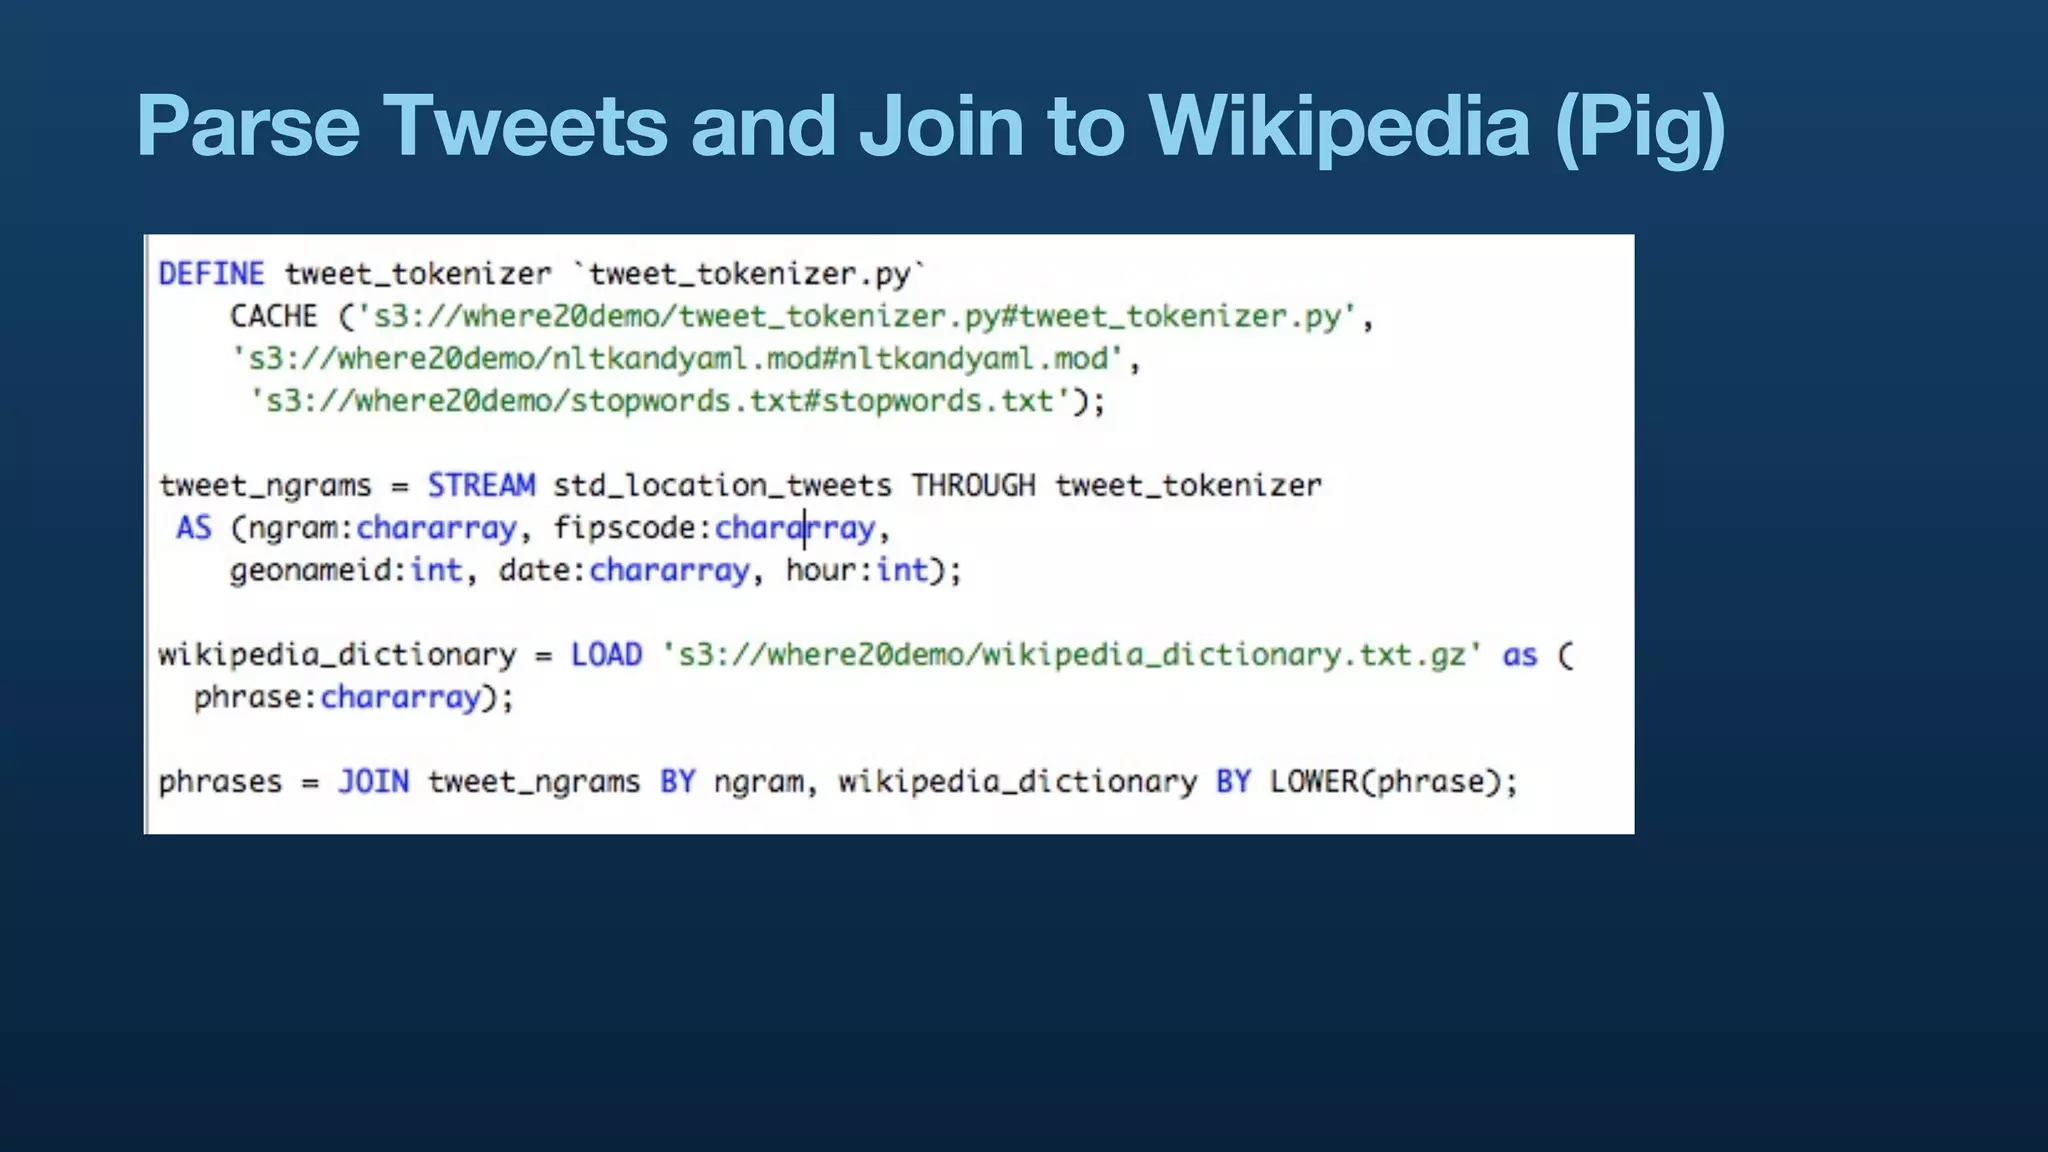
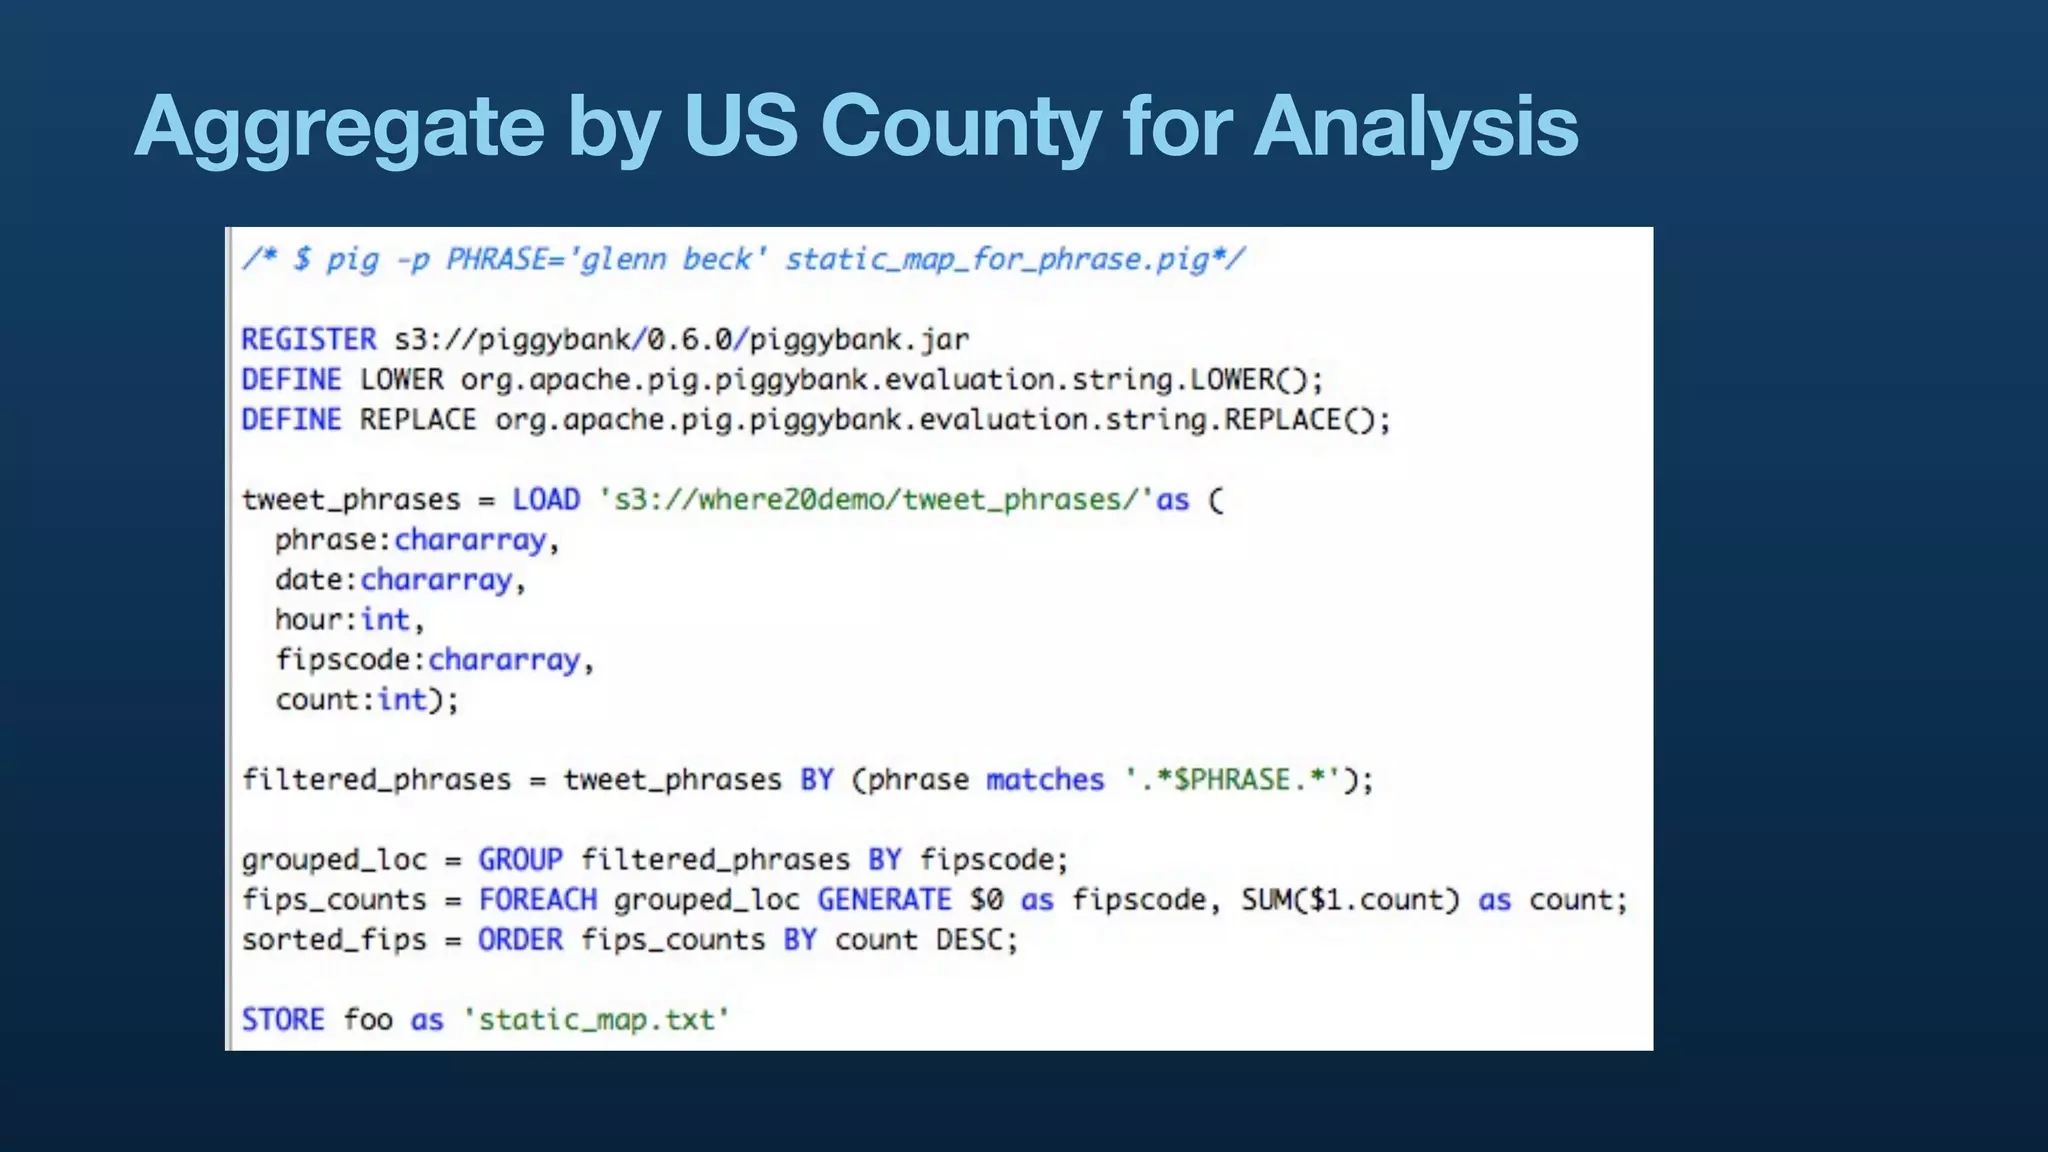
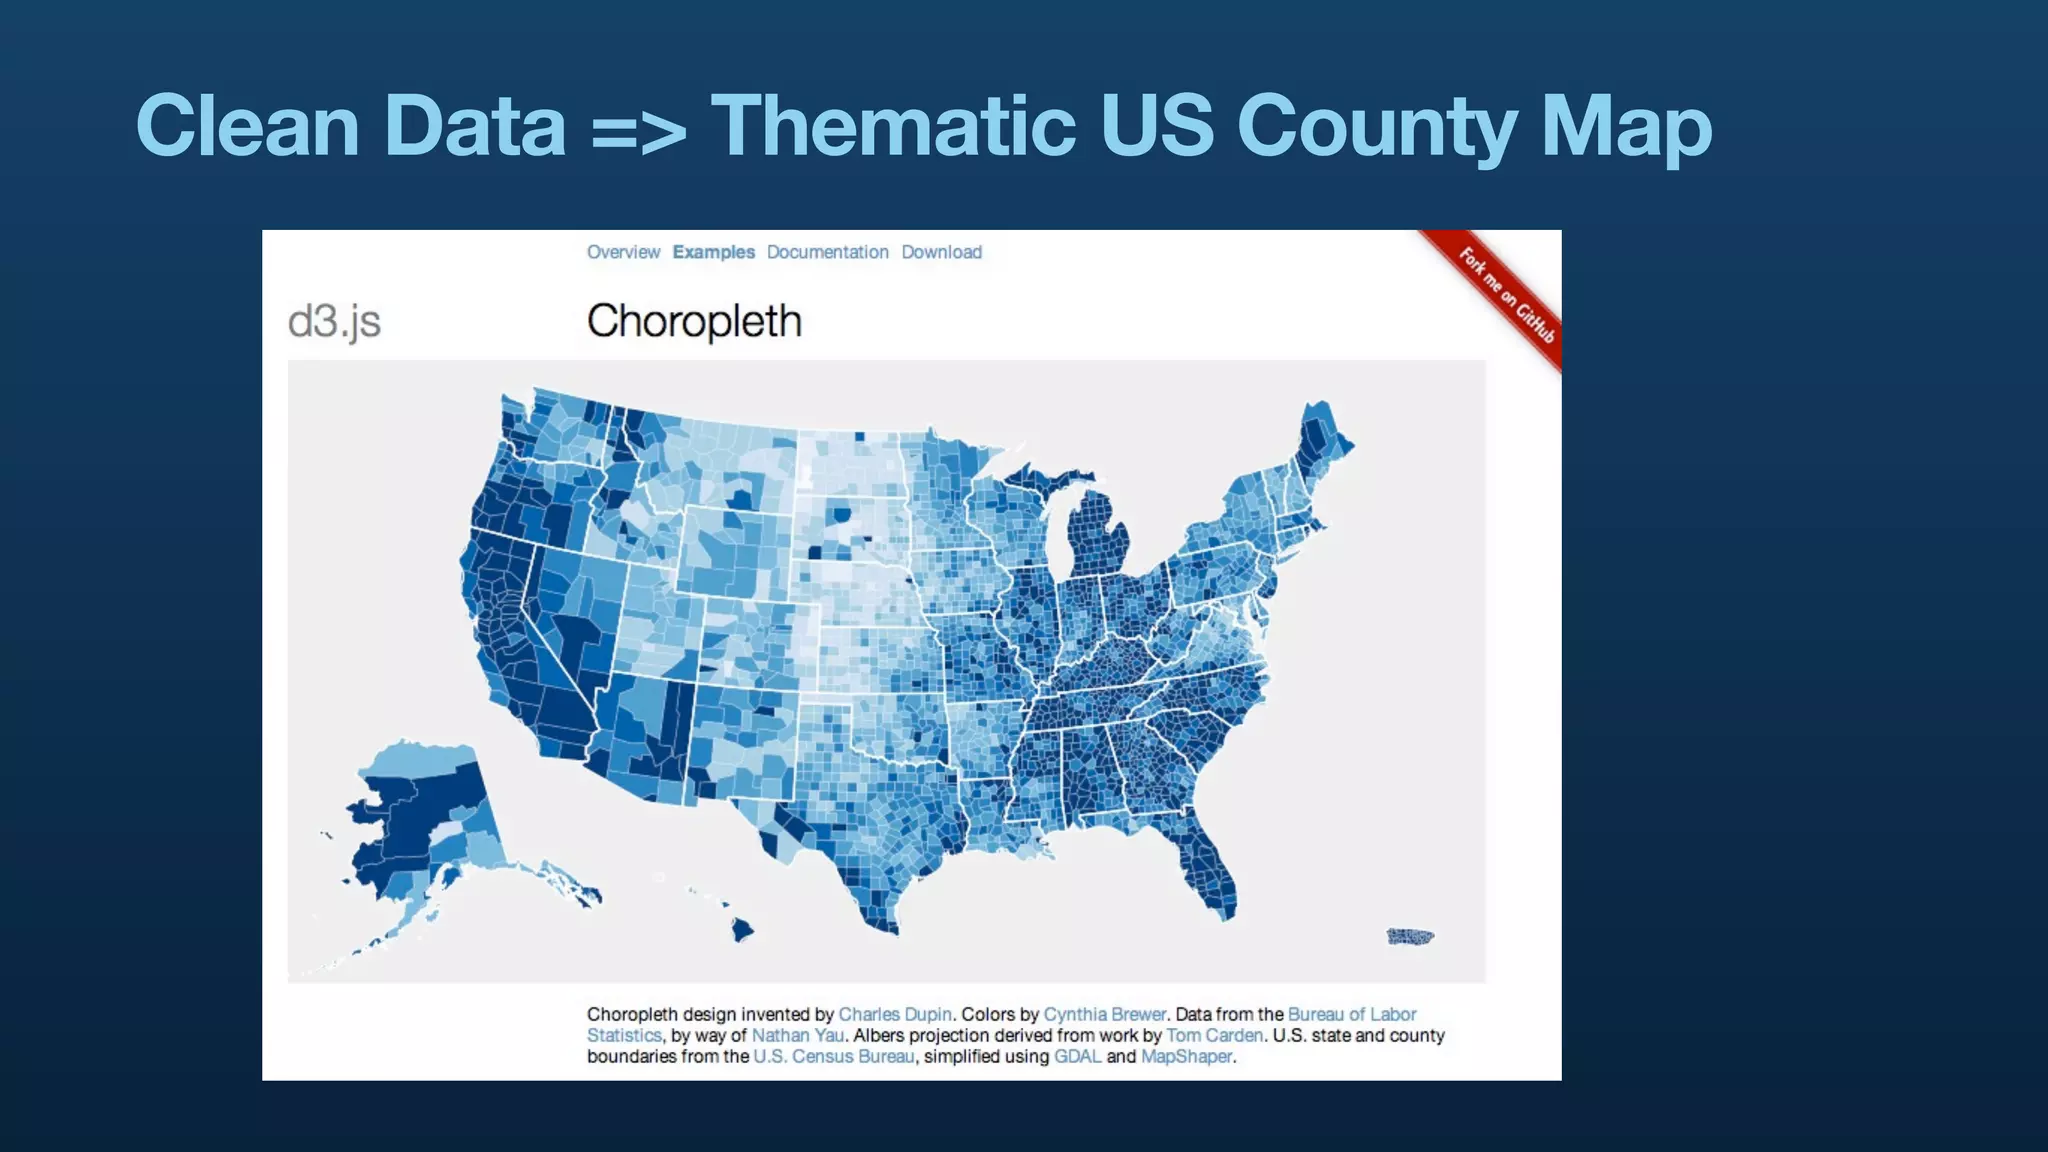
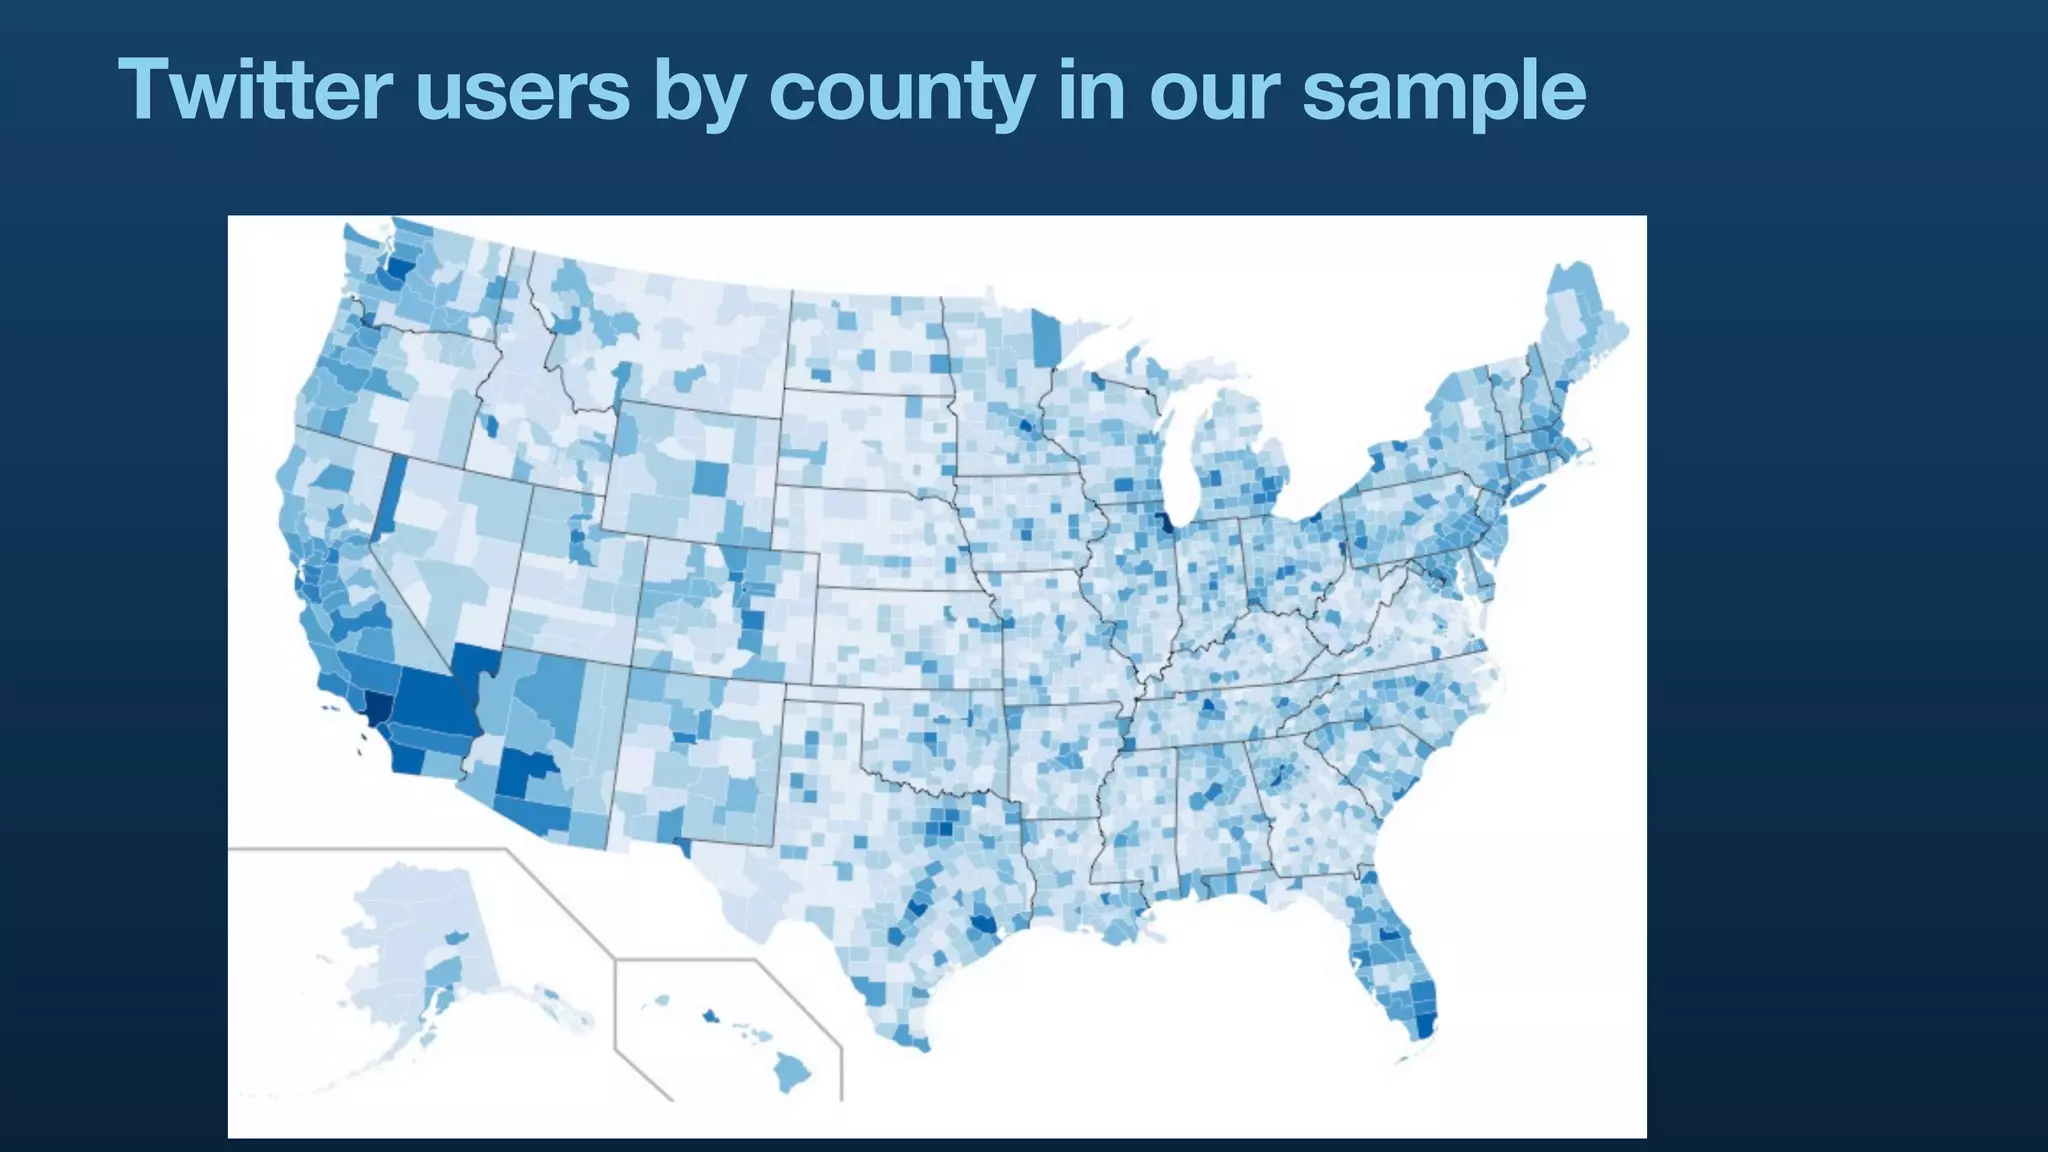
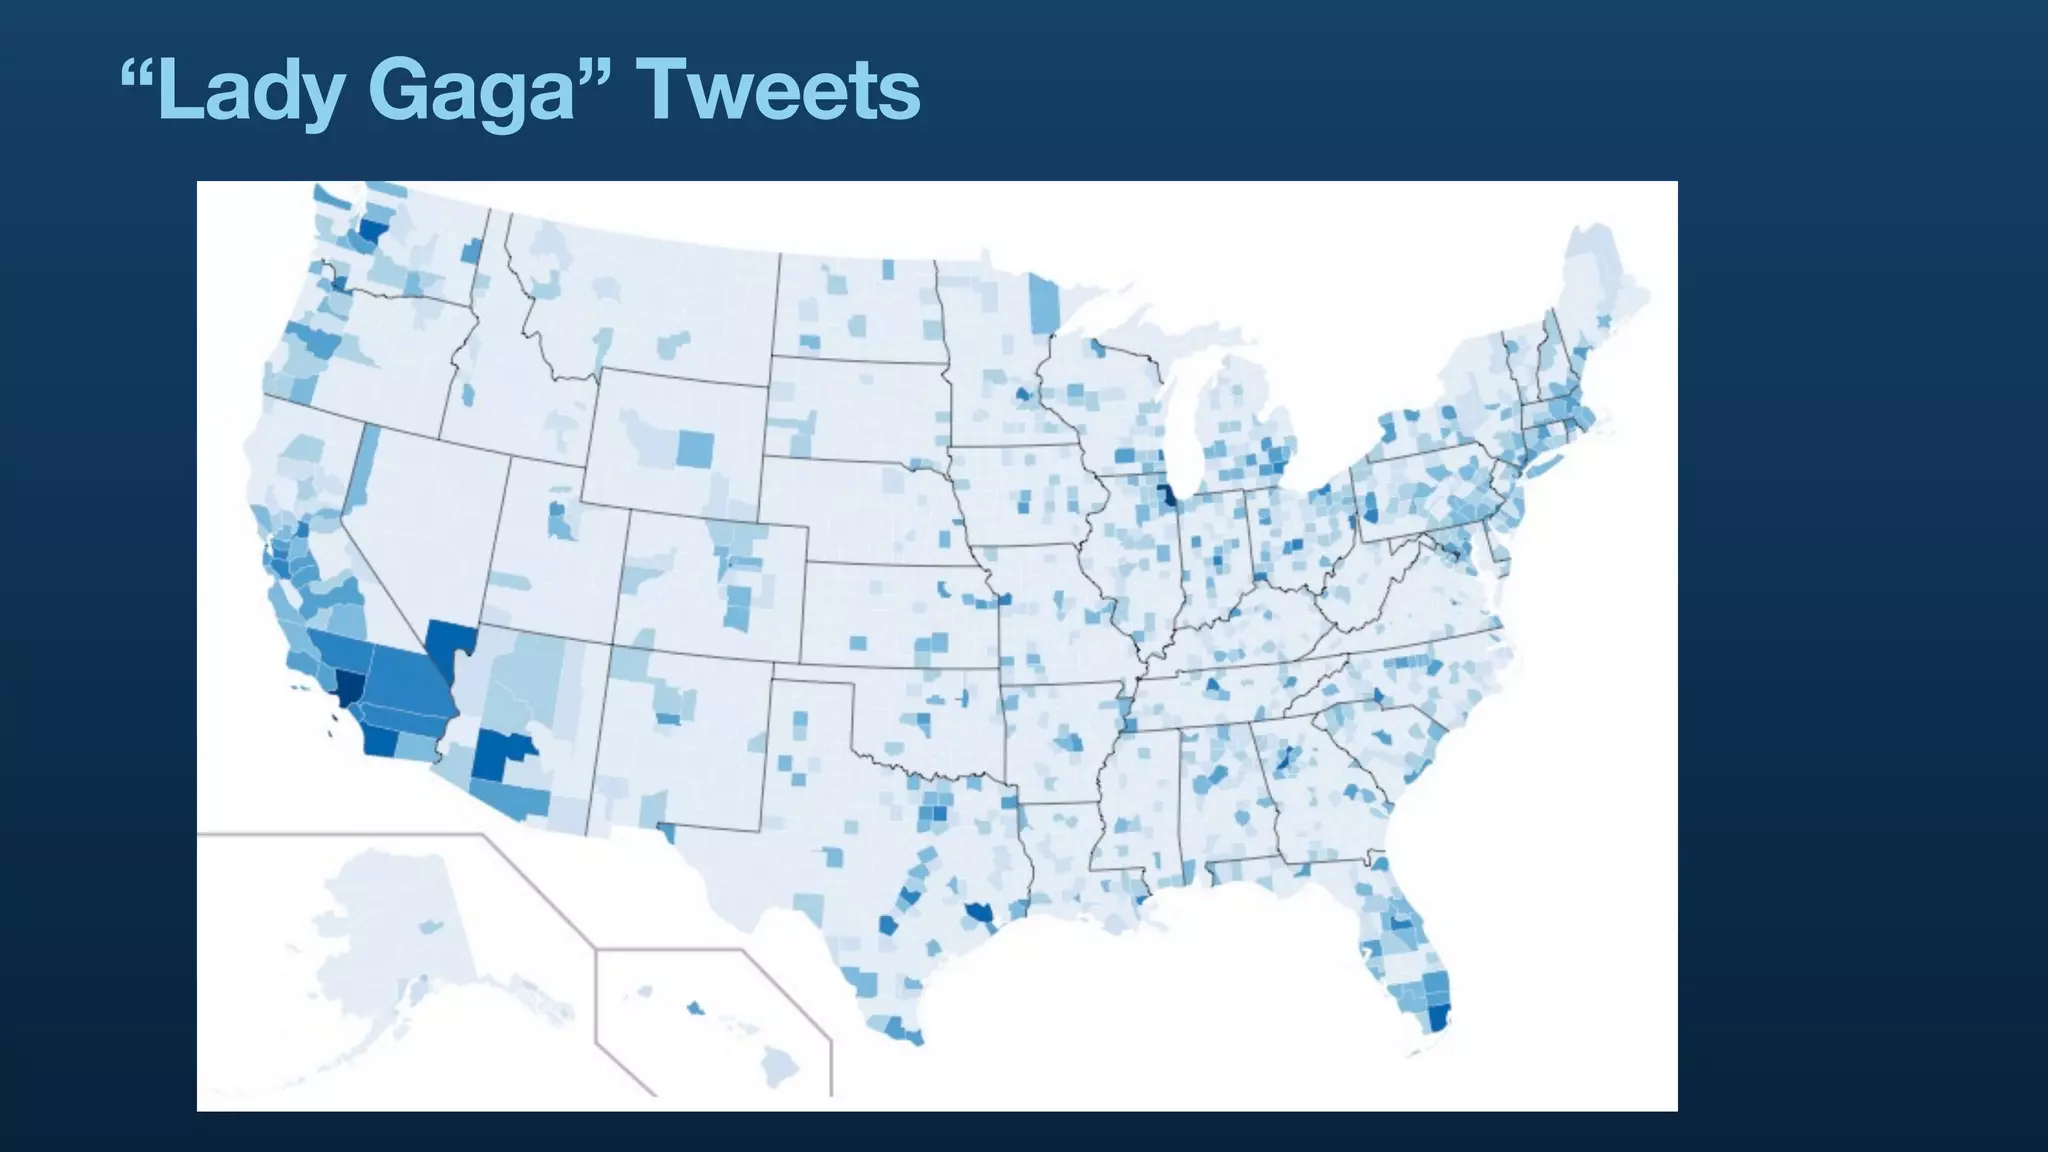
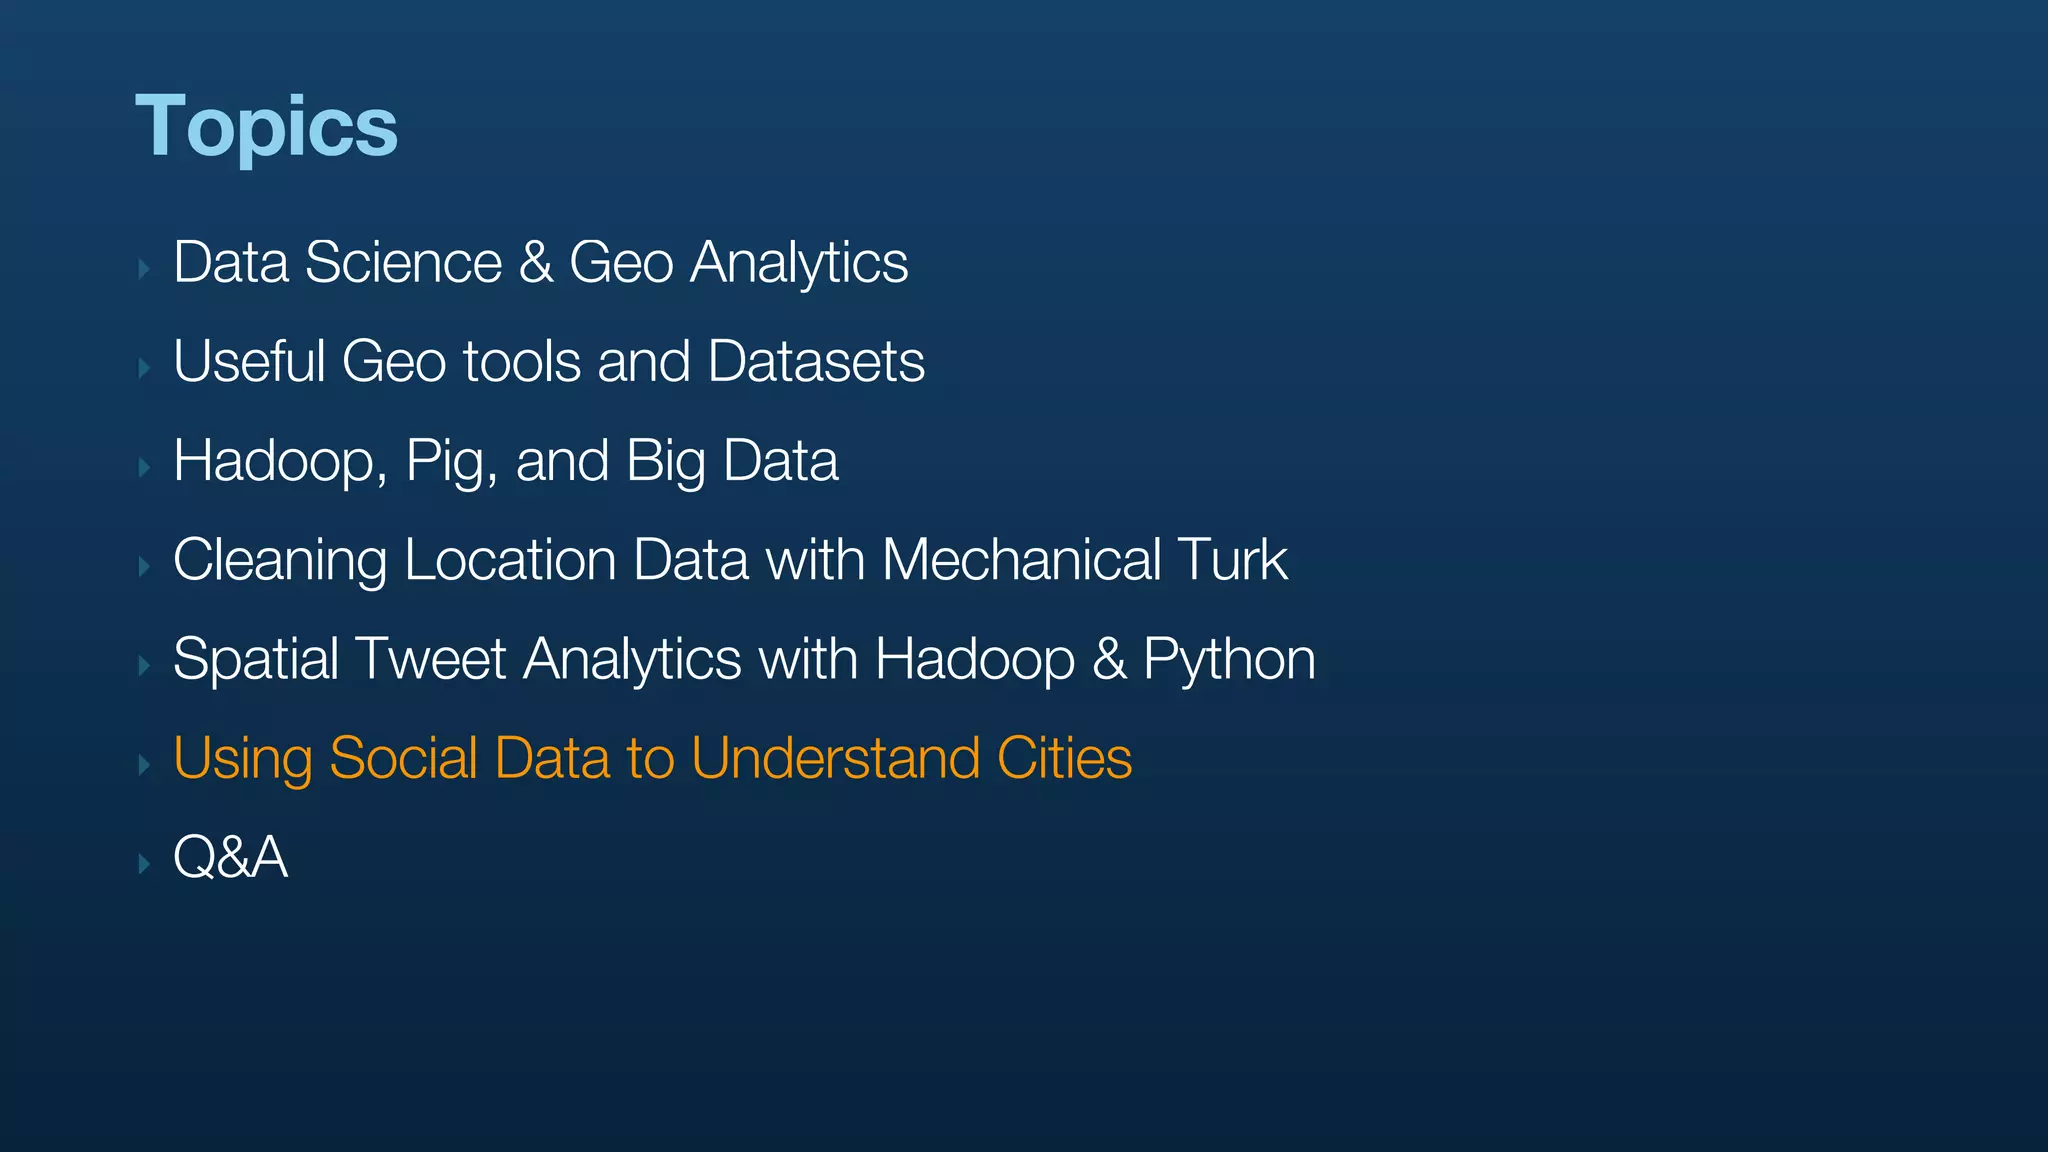
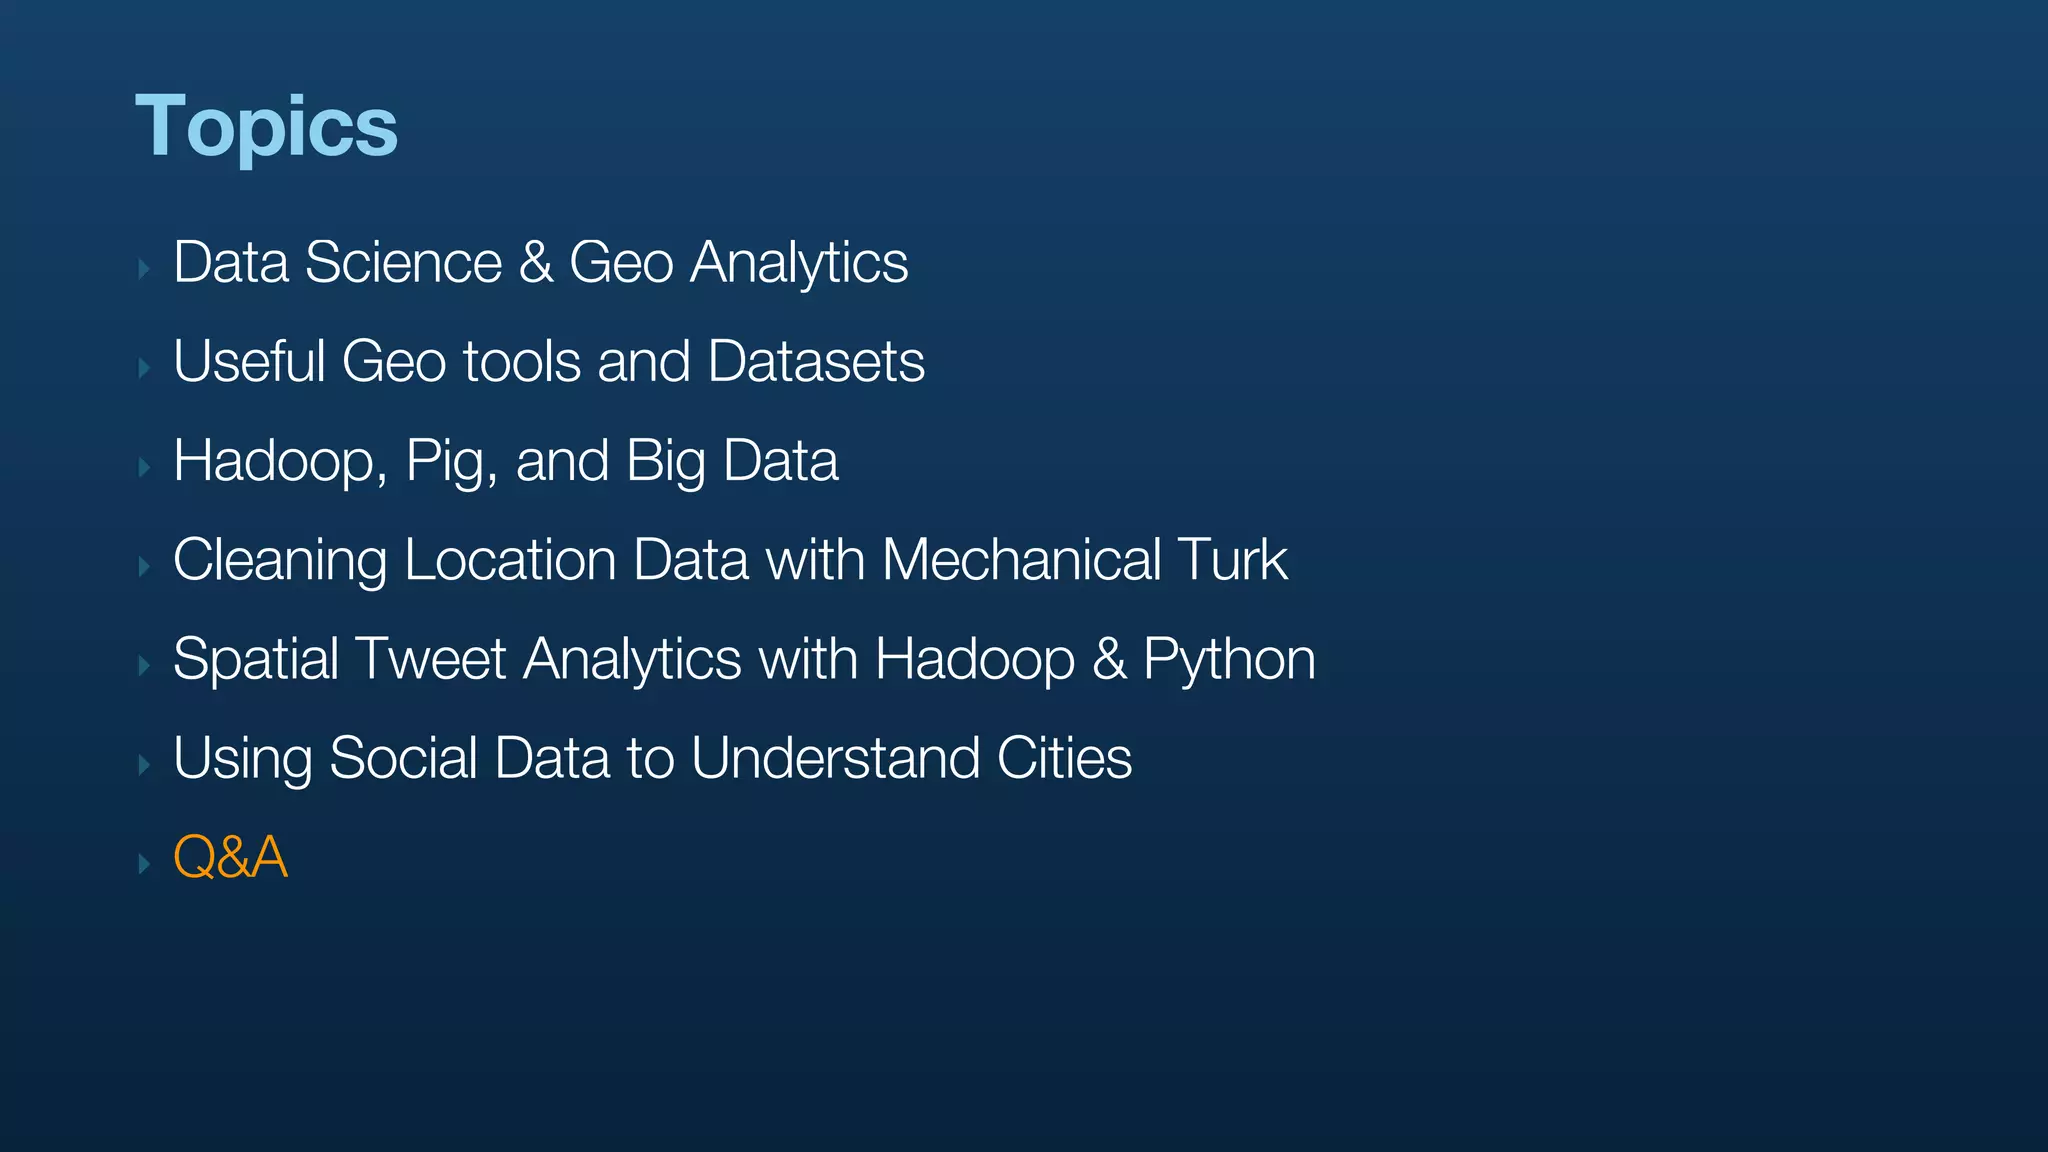


The document serves as a tutorial on geo analytics, discussing tools and techniques such as Hadoop, Pig, and data cleaning methods for analyzing spatial data, particularly from Twitter. It emphasizes the importance of processing large datasets and offers examples of using different programming languages for spatial analysis as well as data visualization. Additionally, the document highlights challenges in data consistency and suggests using Mechanical Turk for data cleaning tasks.