Download to read offline

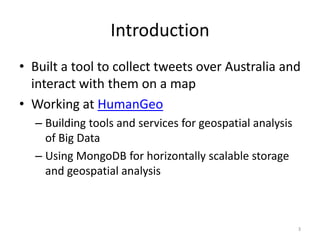
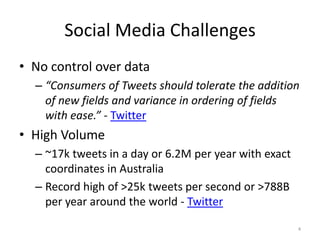
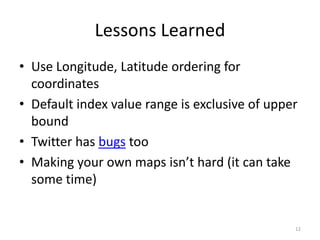

This document summarizes using MongoDB to collect and analyze tweets from social media. It describes setting up MongoDB collections to store tweets collected from Twitter's API, querying the tweets by location, user, and other fields, and building an interface with maps and visualization tools to interact with the tweets. Key steps included collecting tweets from Australia, augmenting the data, indexing for efficient querying, finding the most active tweeter, and lessons learned around data structure and API limitations.


![MongoDB .local San Francisco 2020: Powering the new age data demands [Infosys]](https://cdn.slidesharecdn.com/ss_thumbnails/315pminfosysfinalsfoversionvocalpart1-200120221508-thumbnail.jpg?width=640&height=640&fit=bounds)