Download as KEY, PPTX

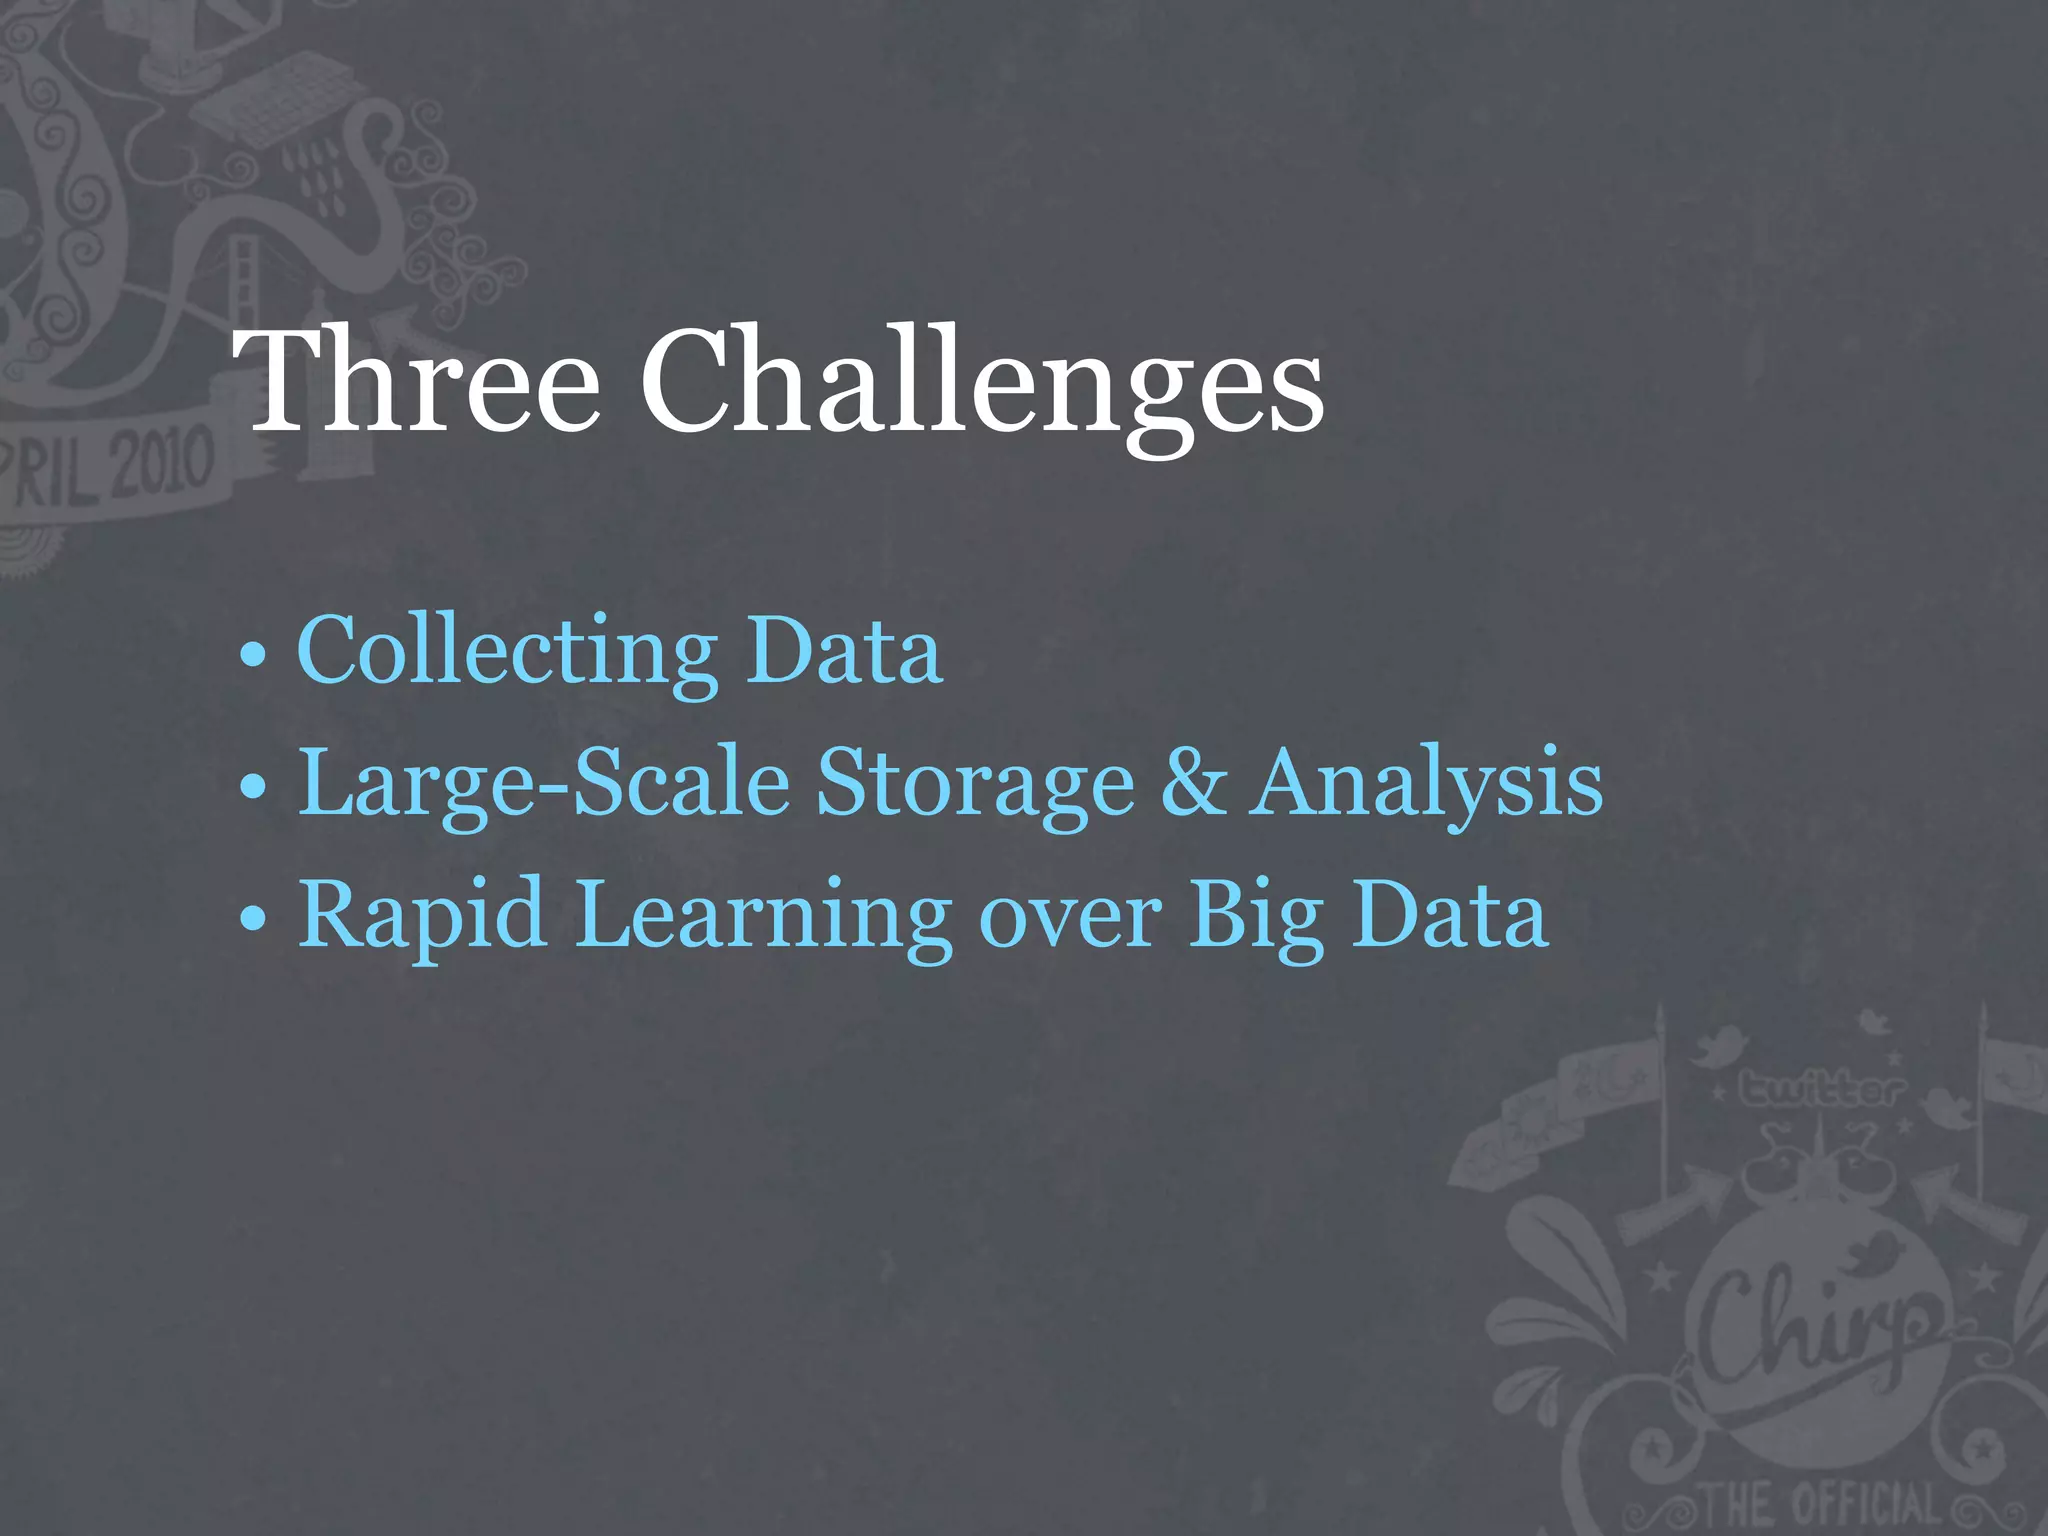
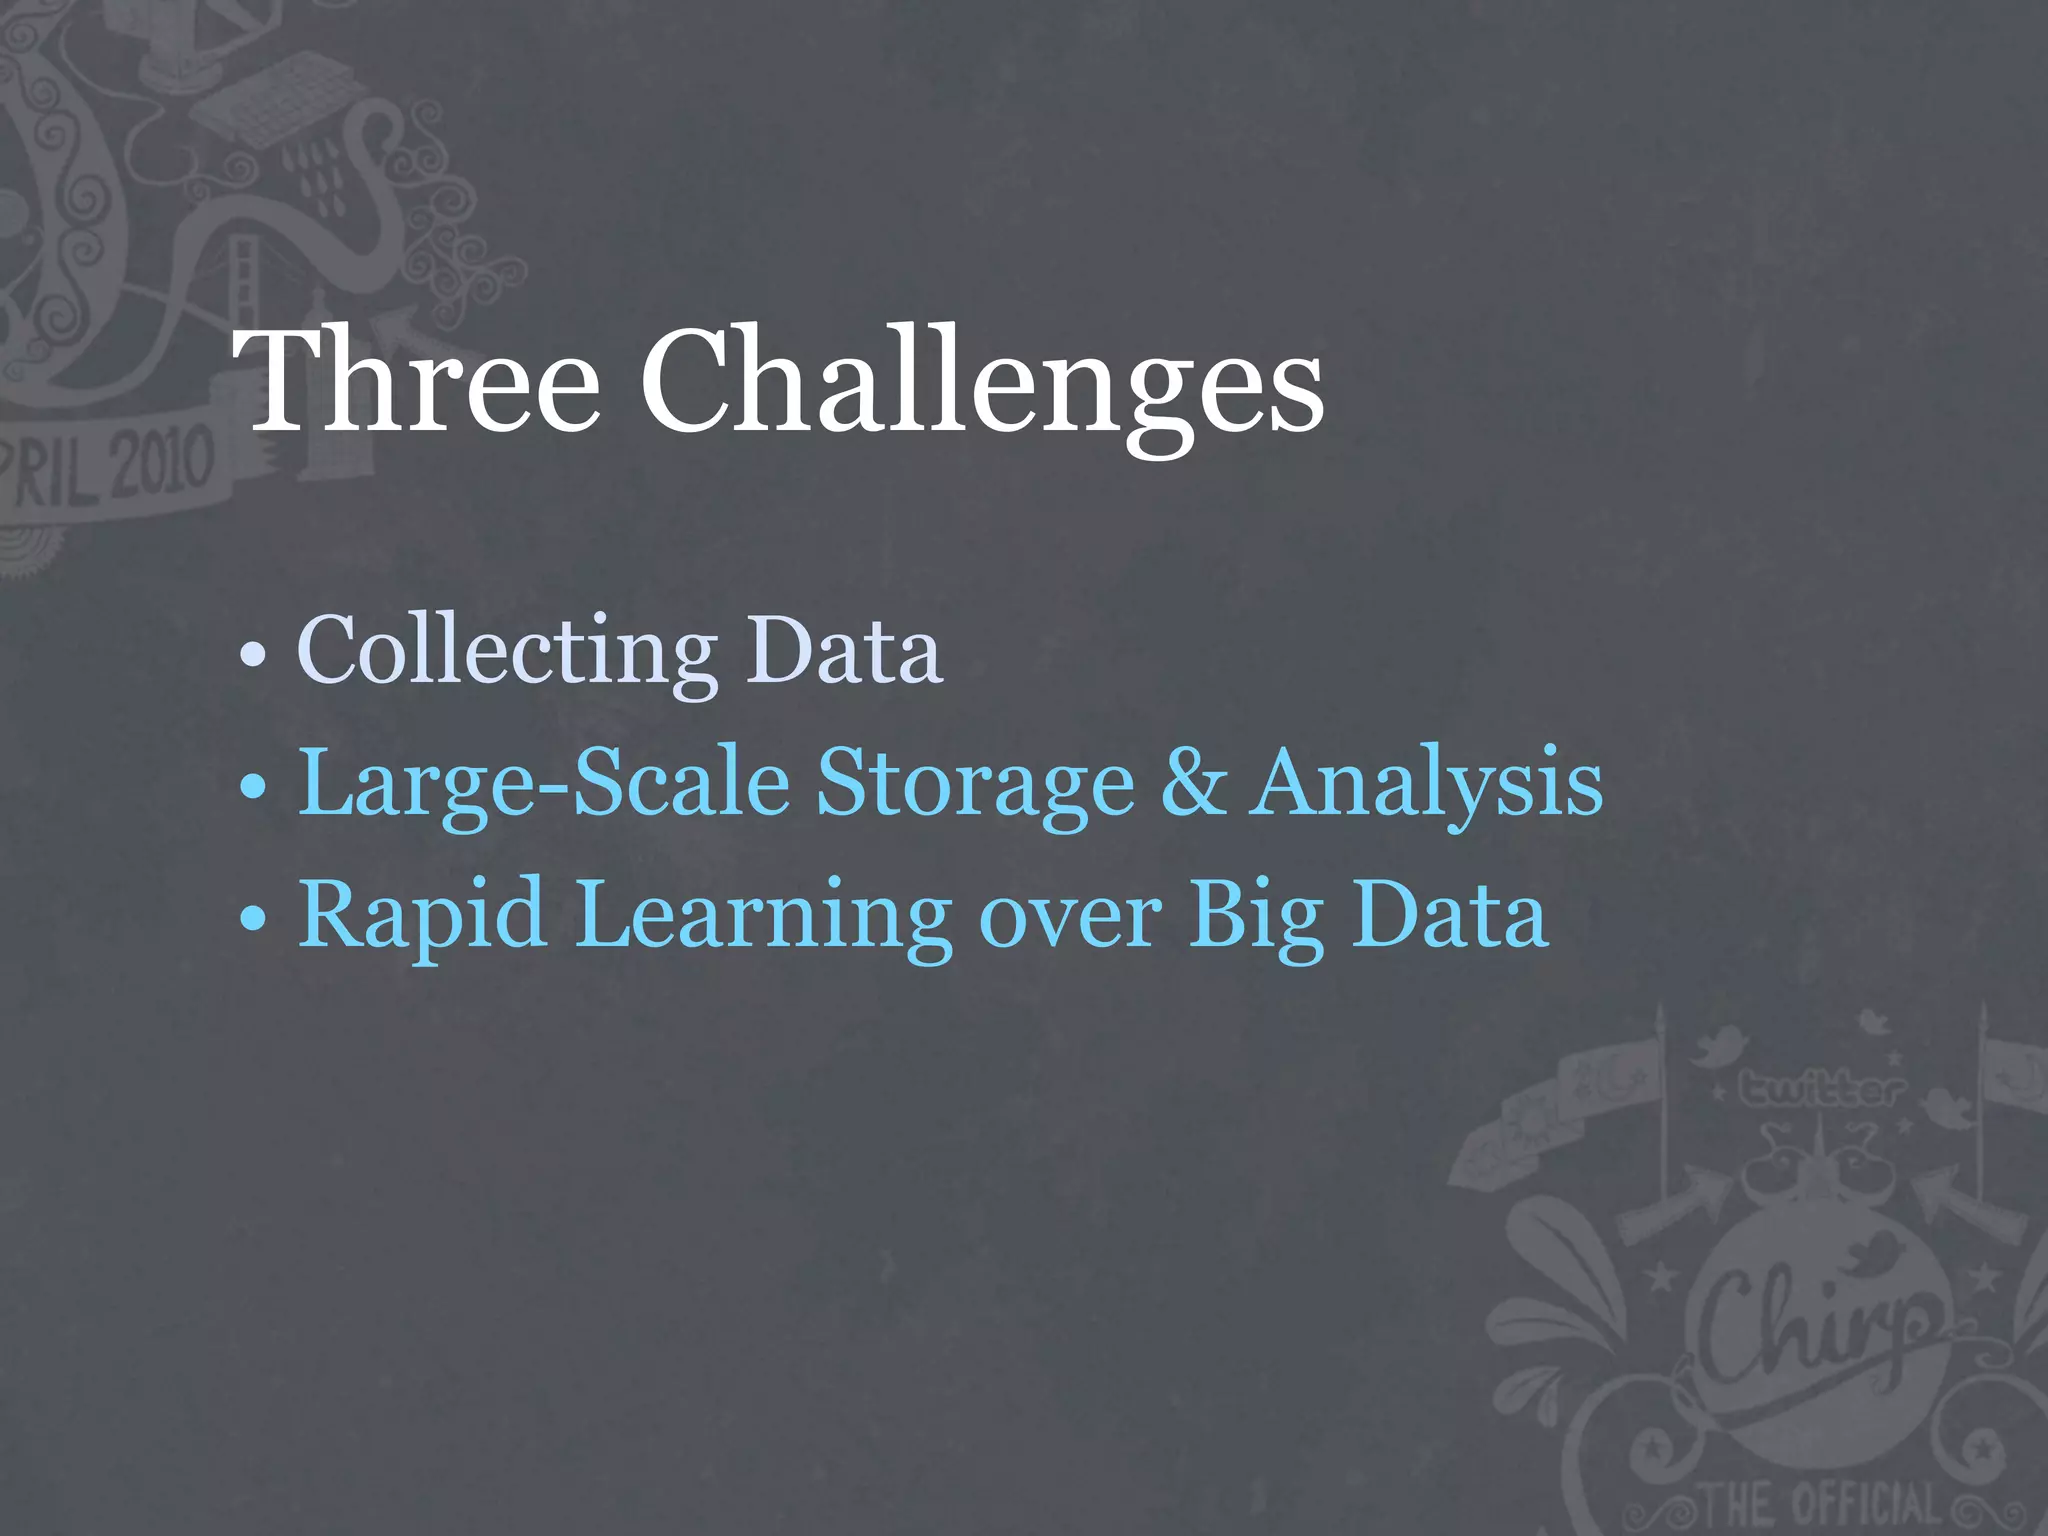
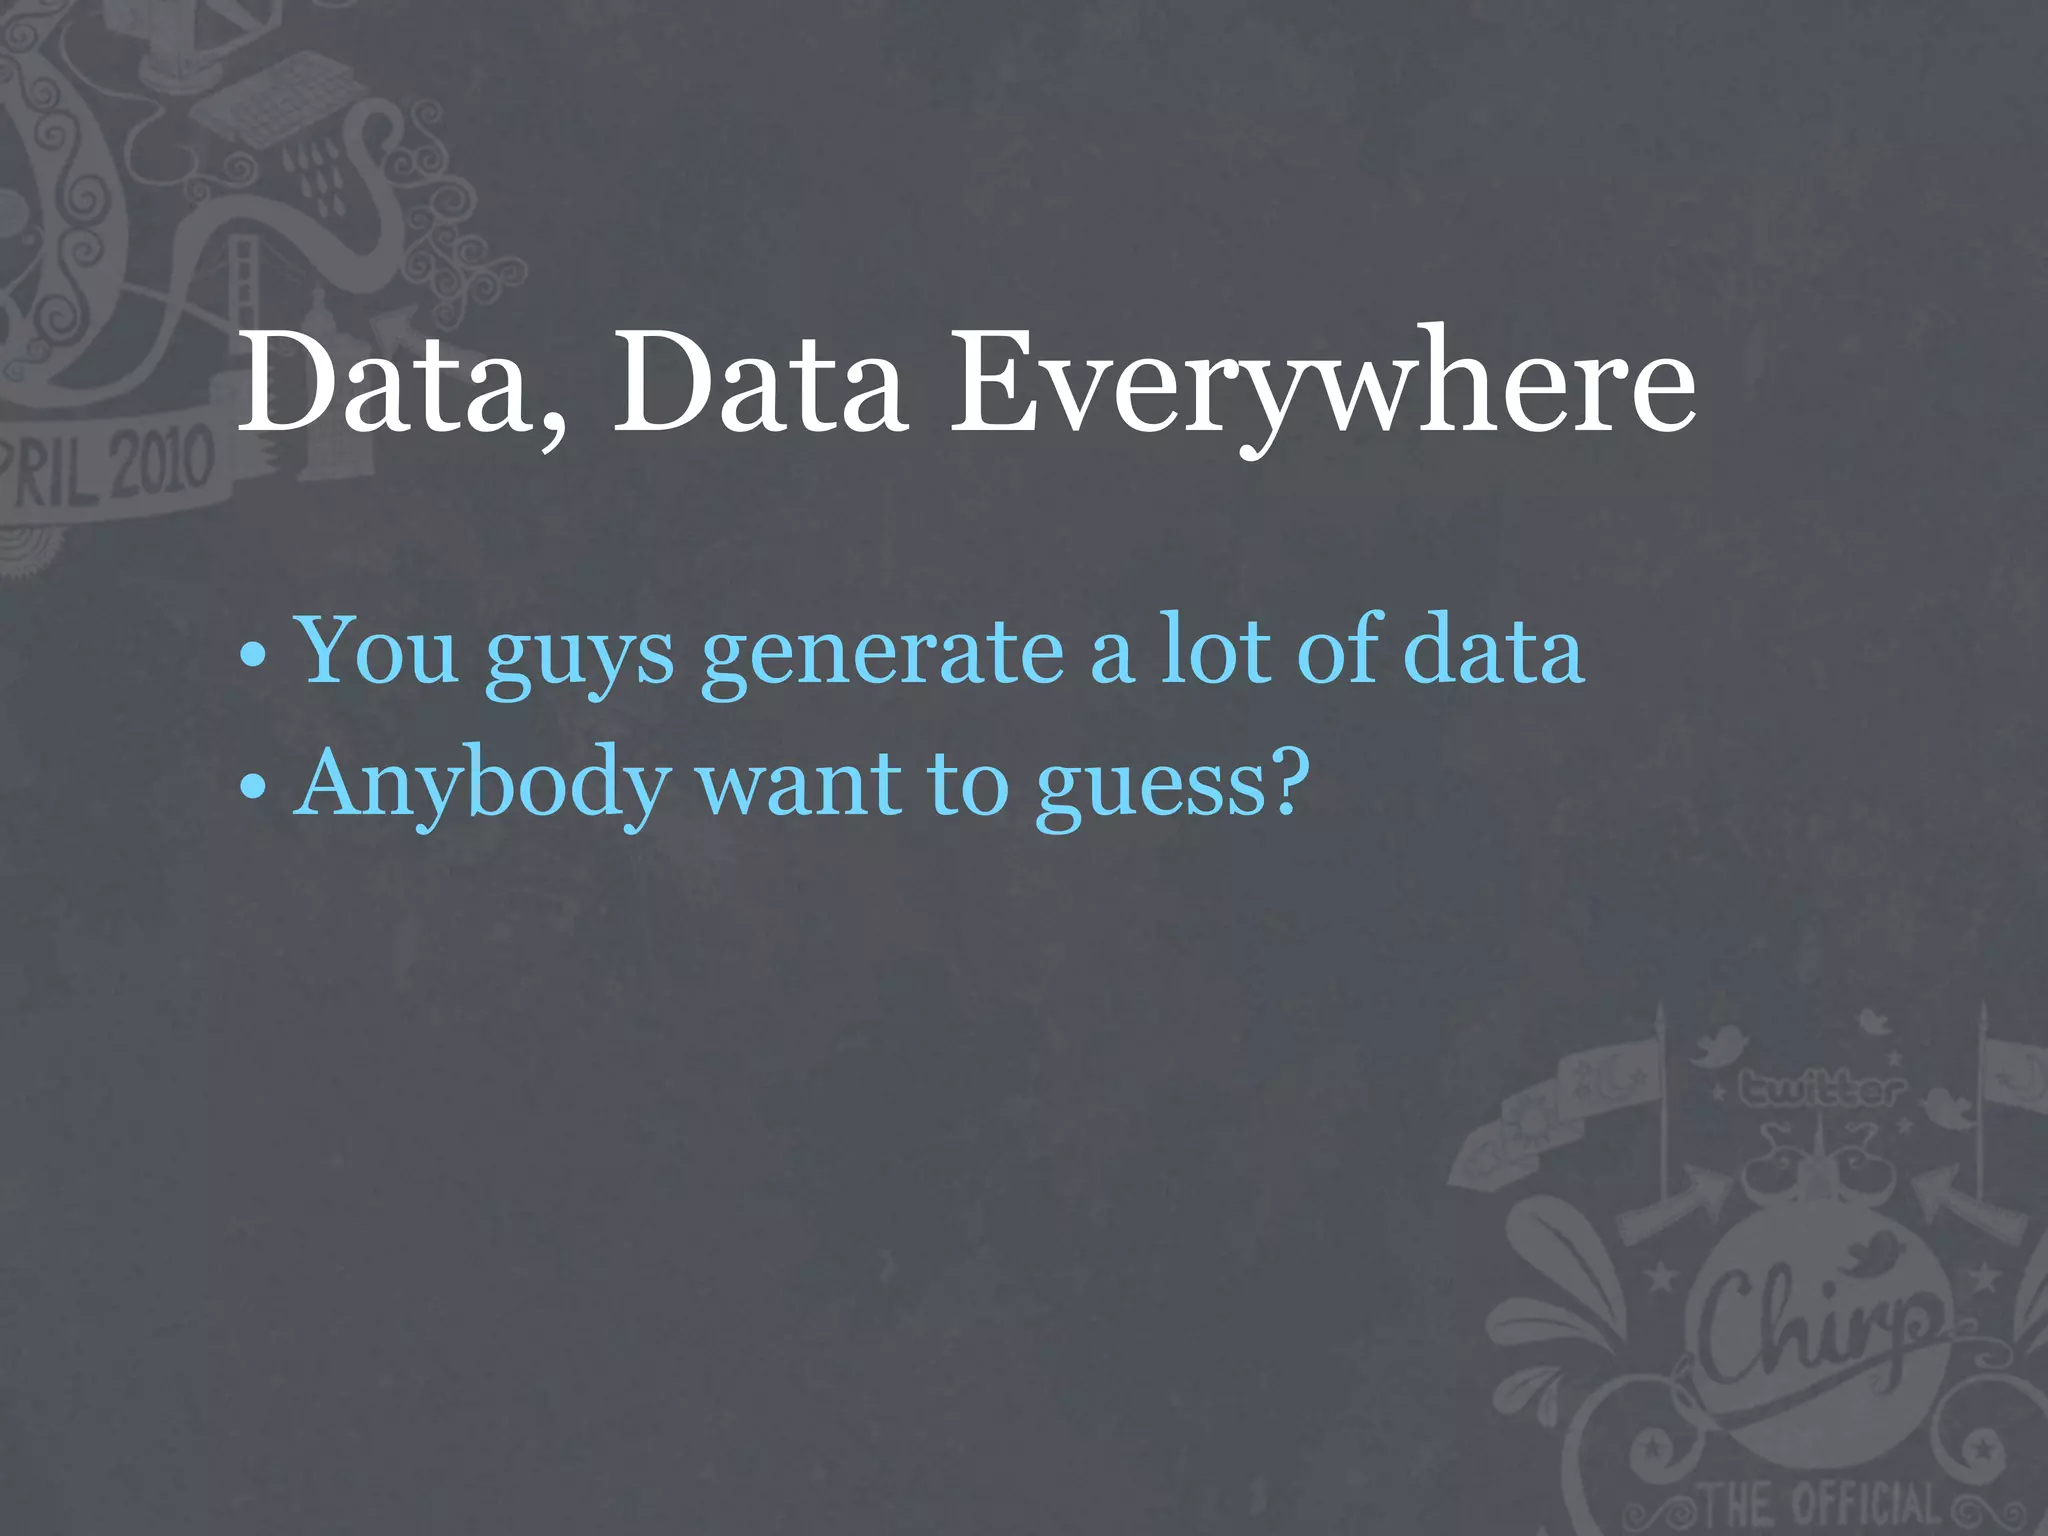
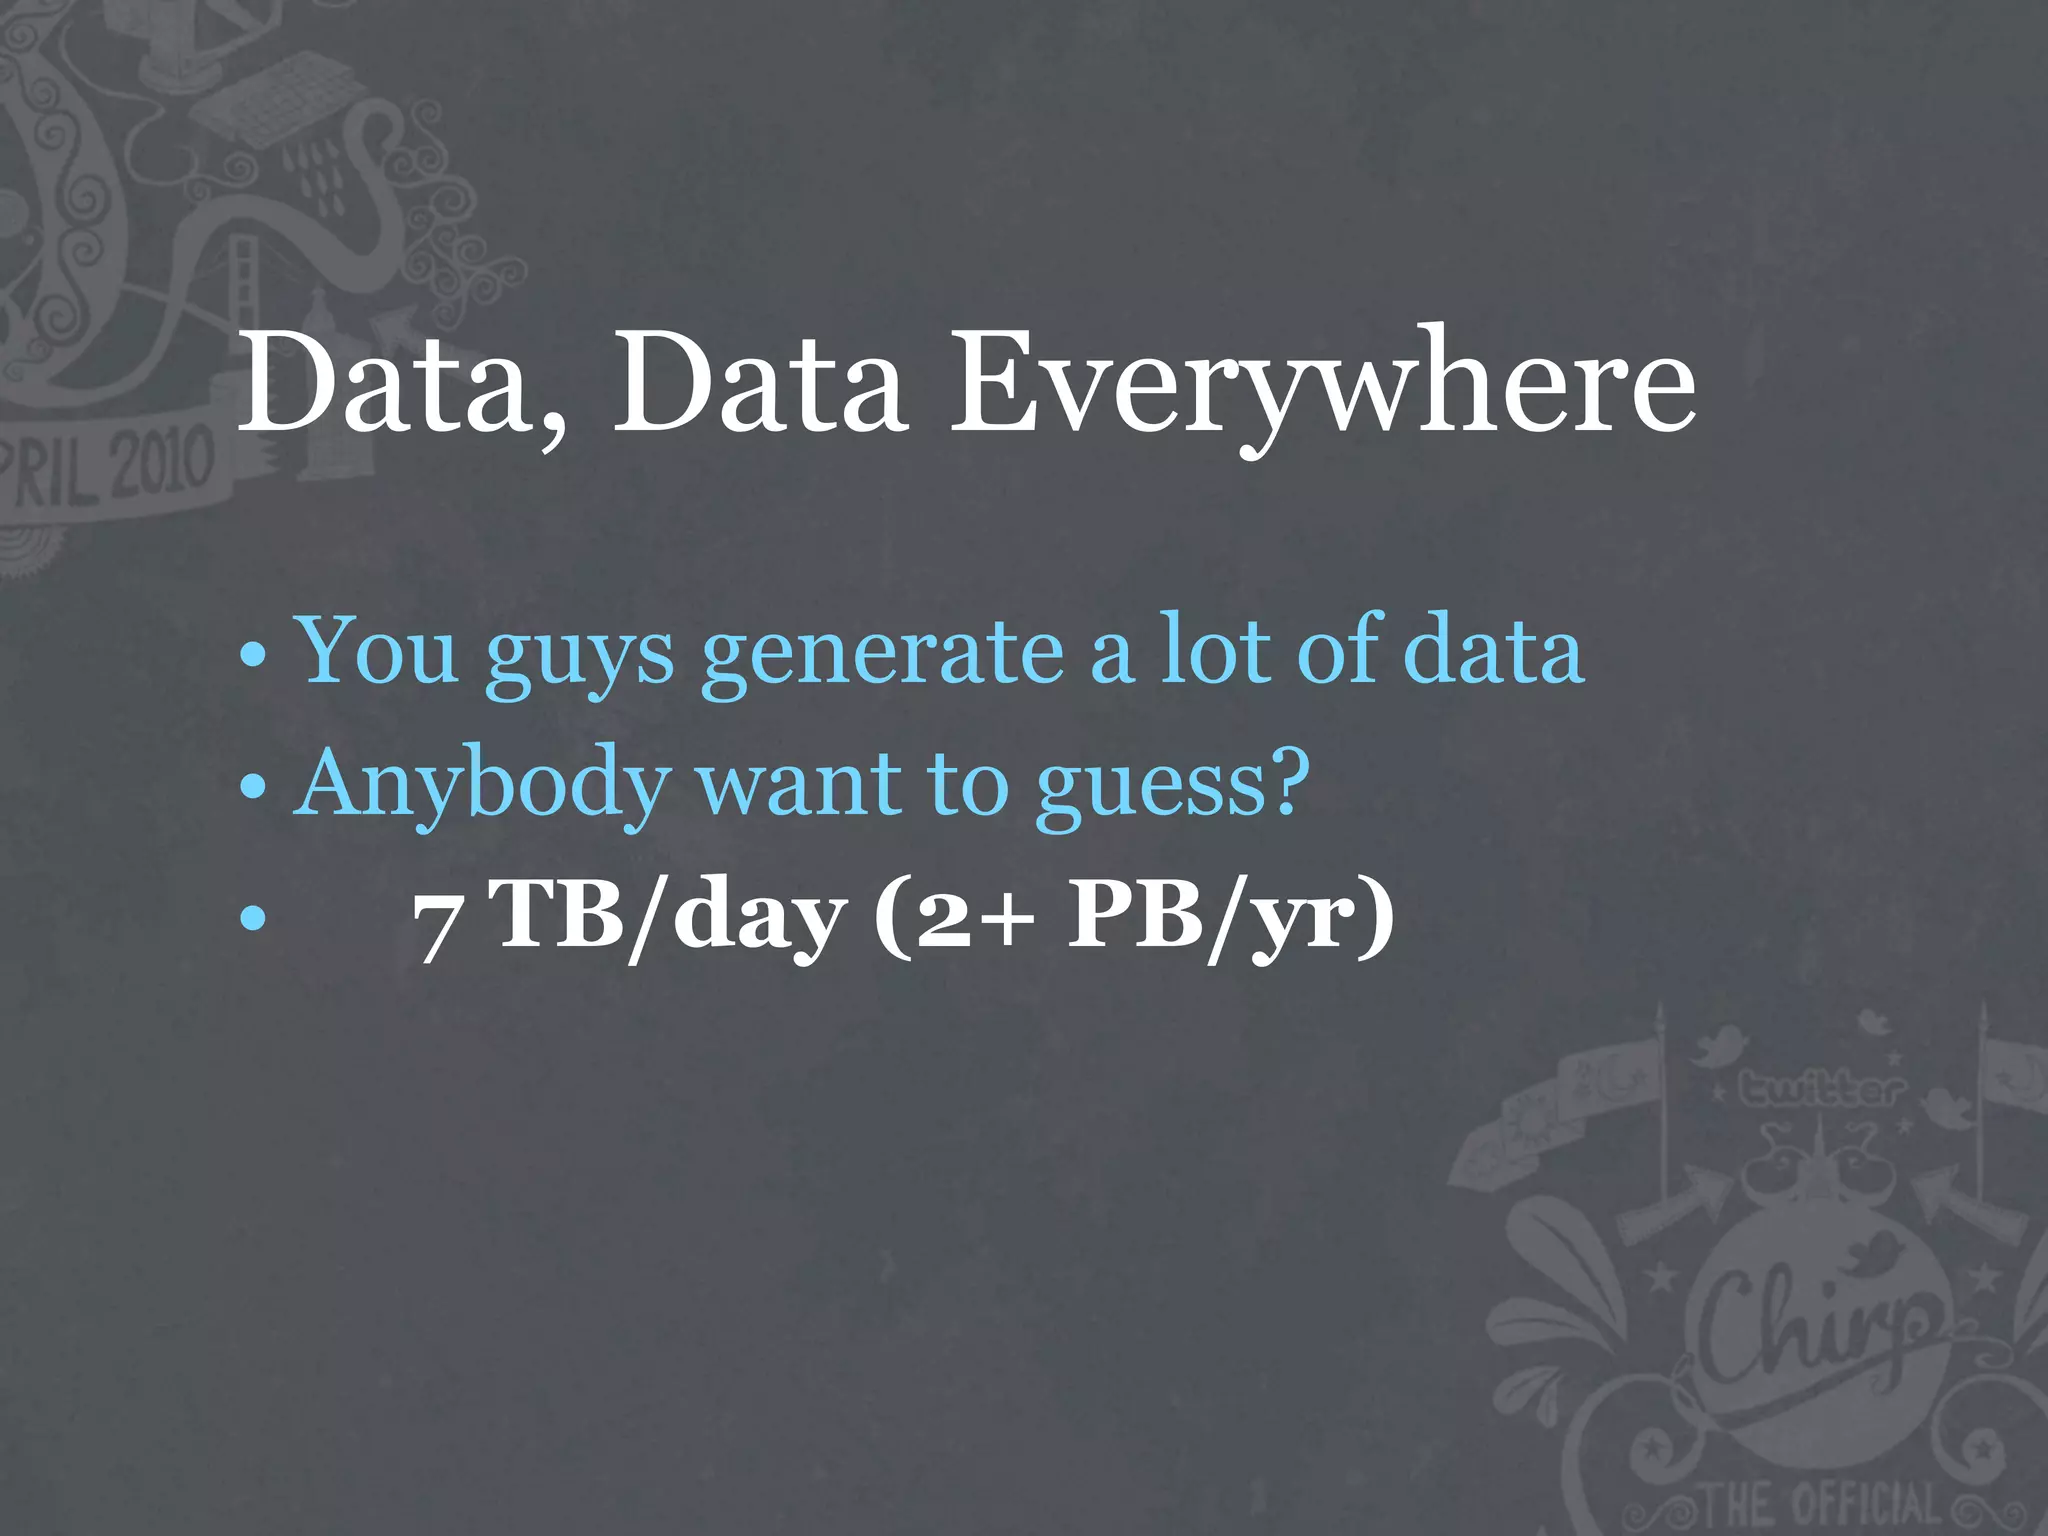
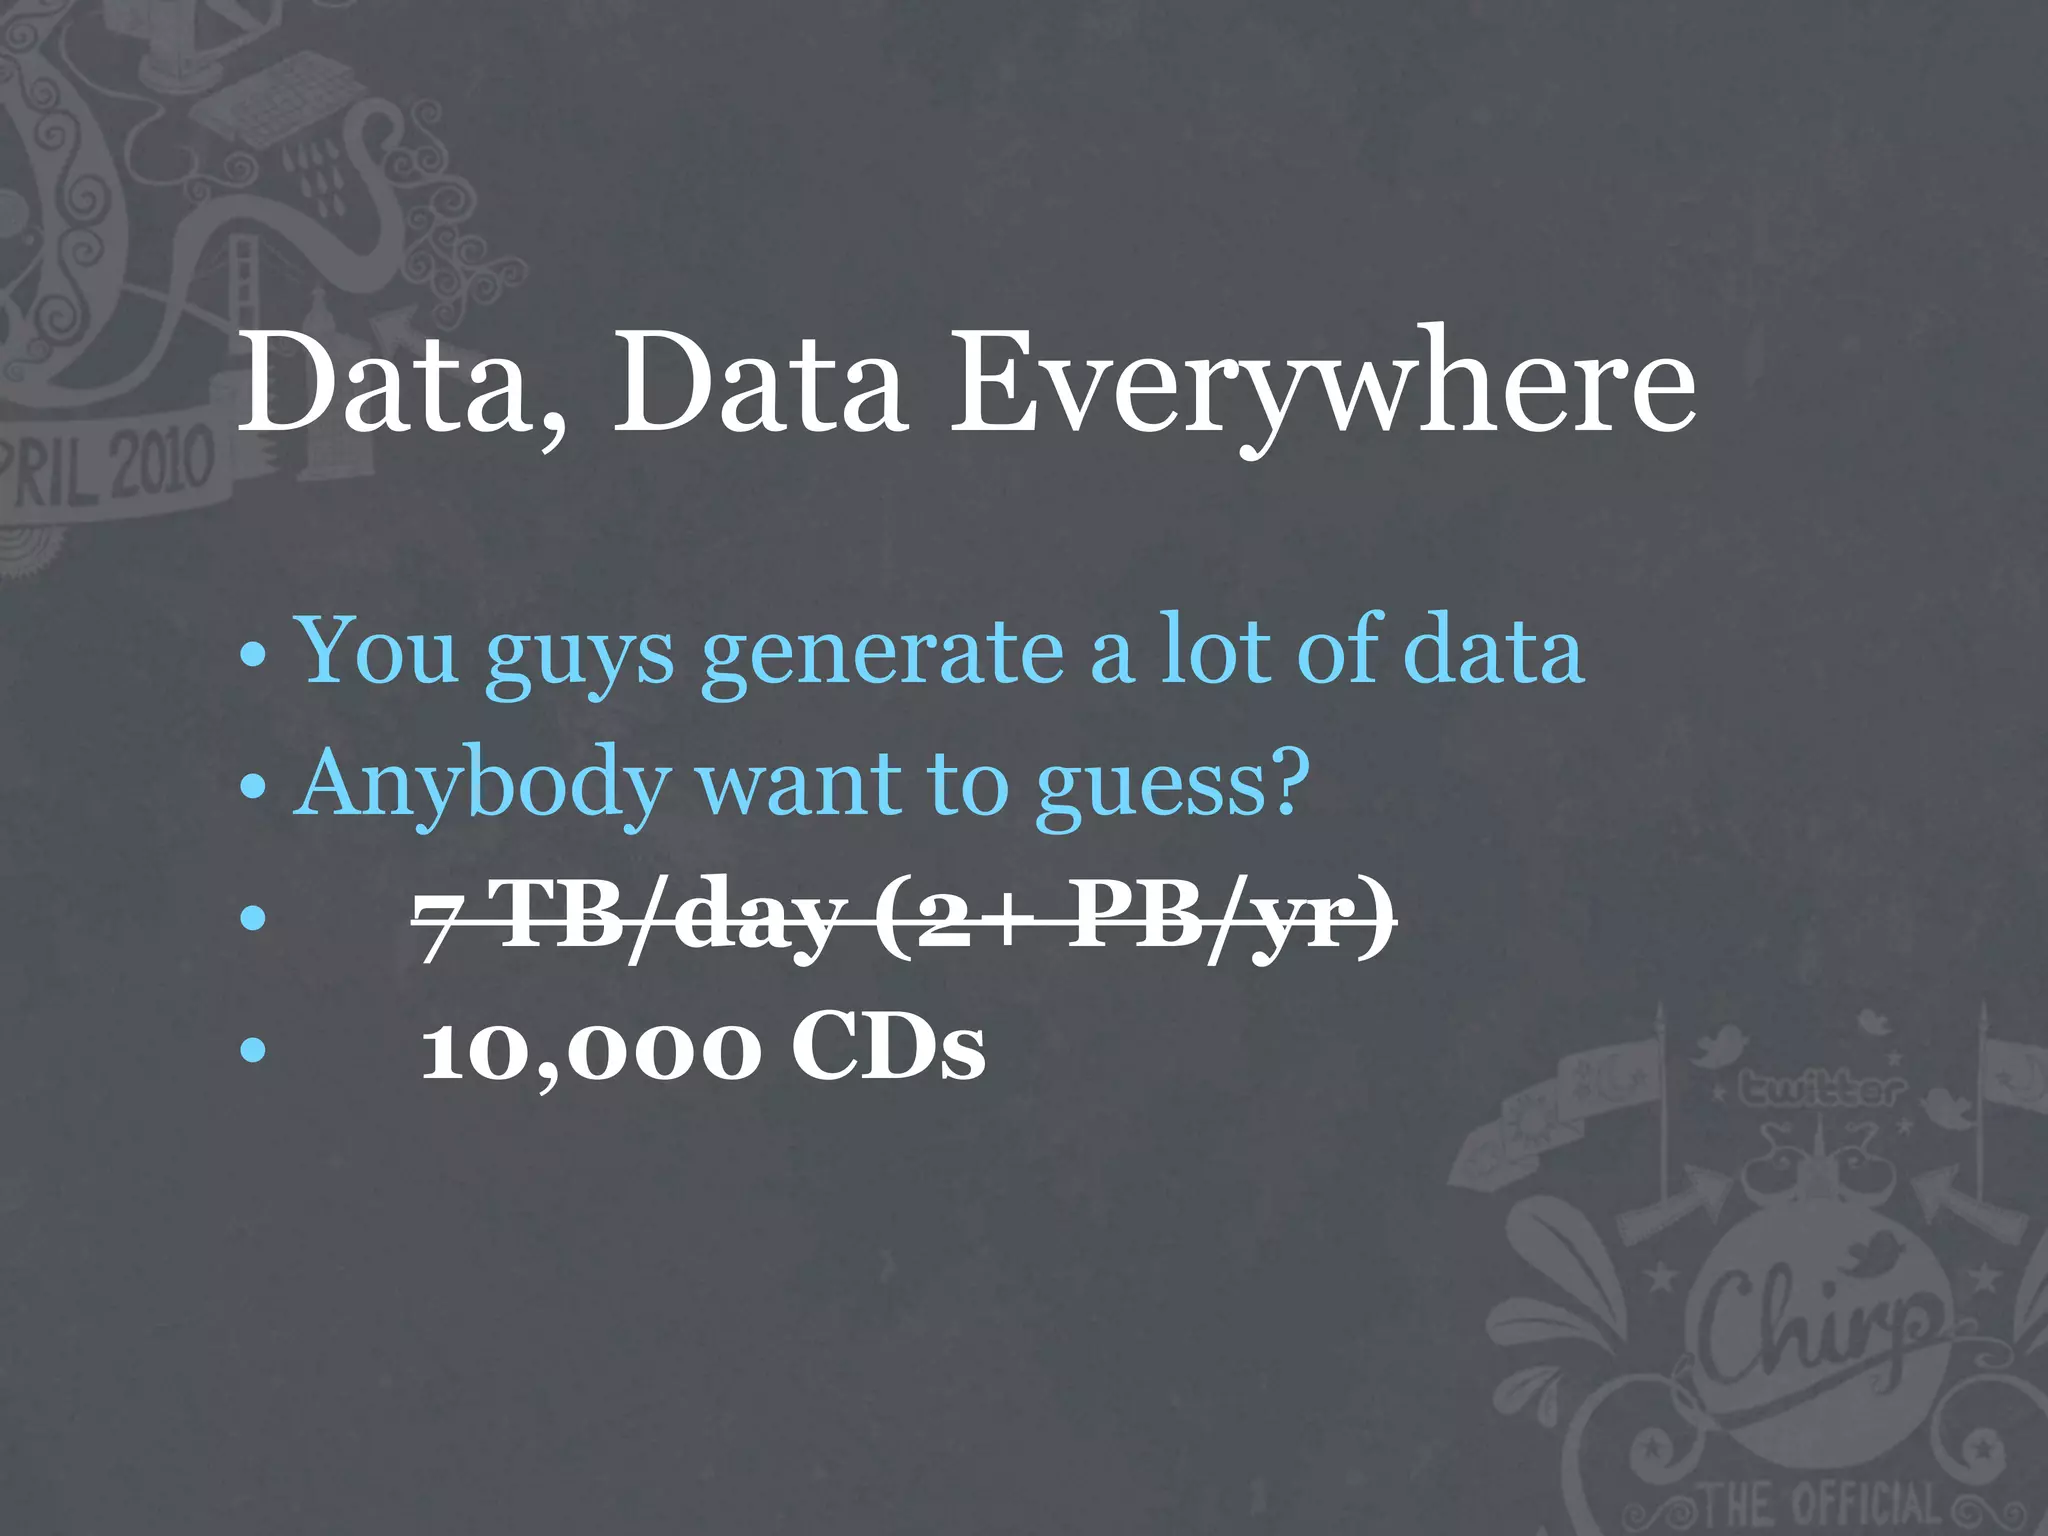
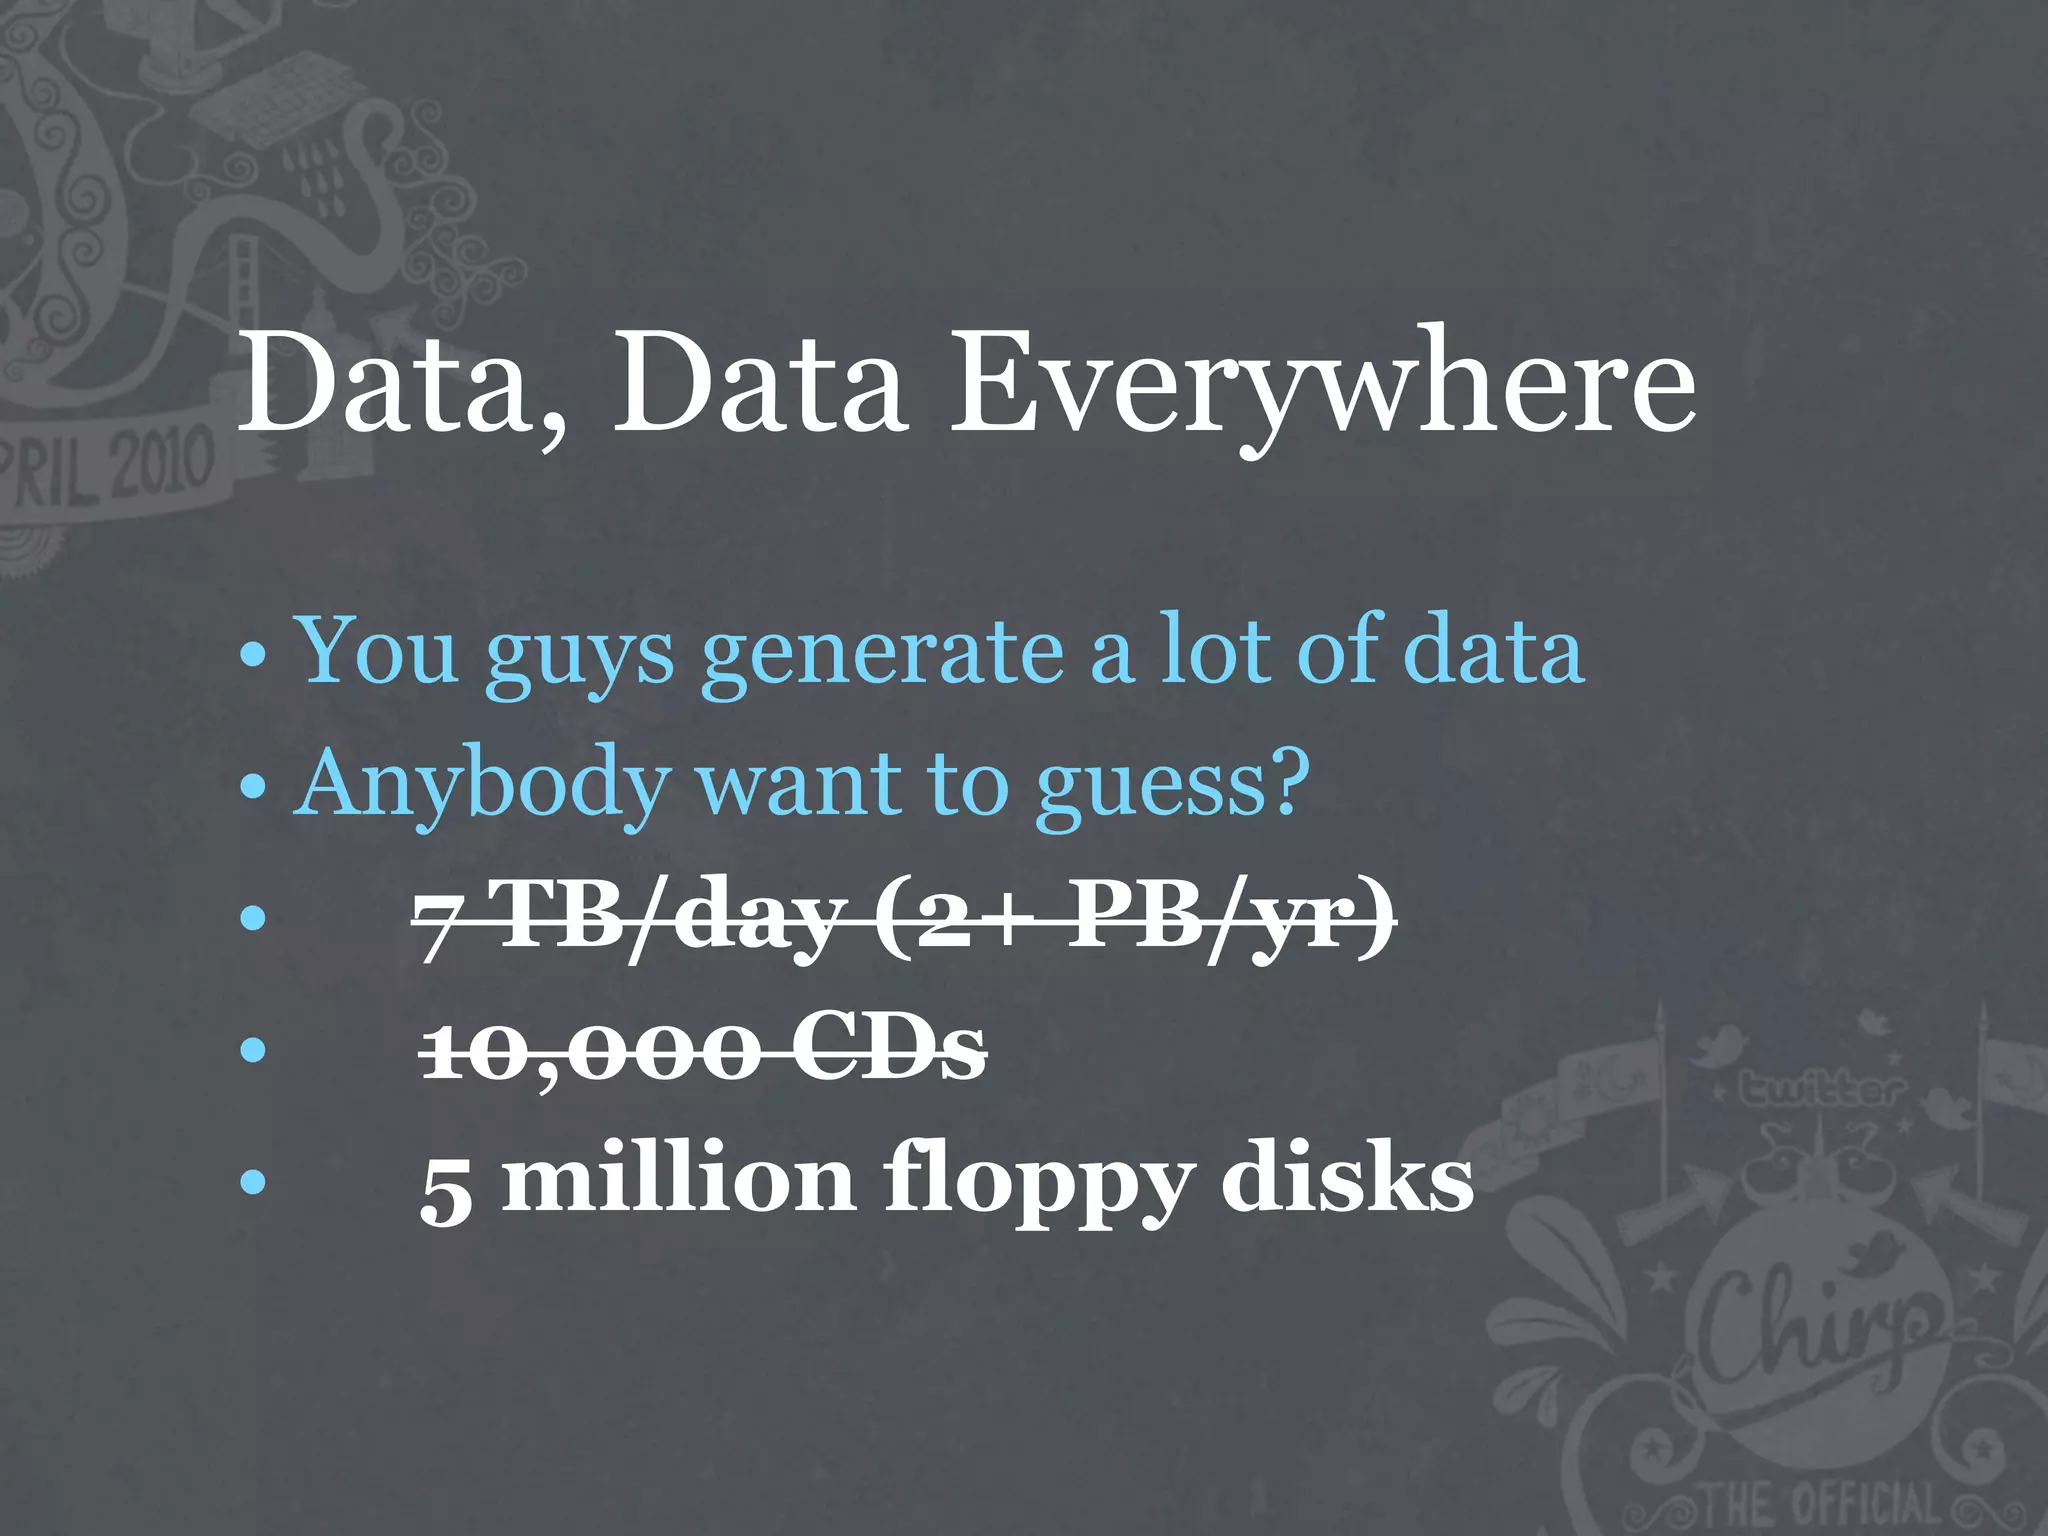
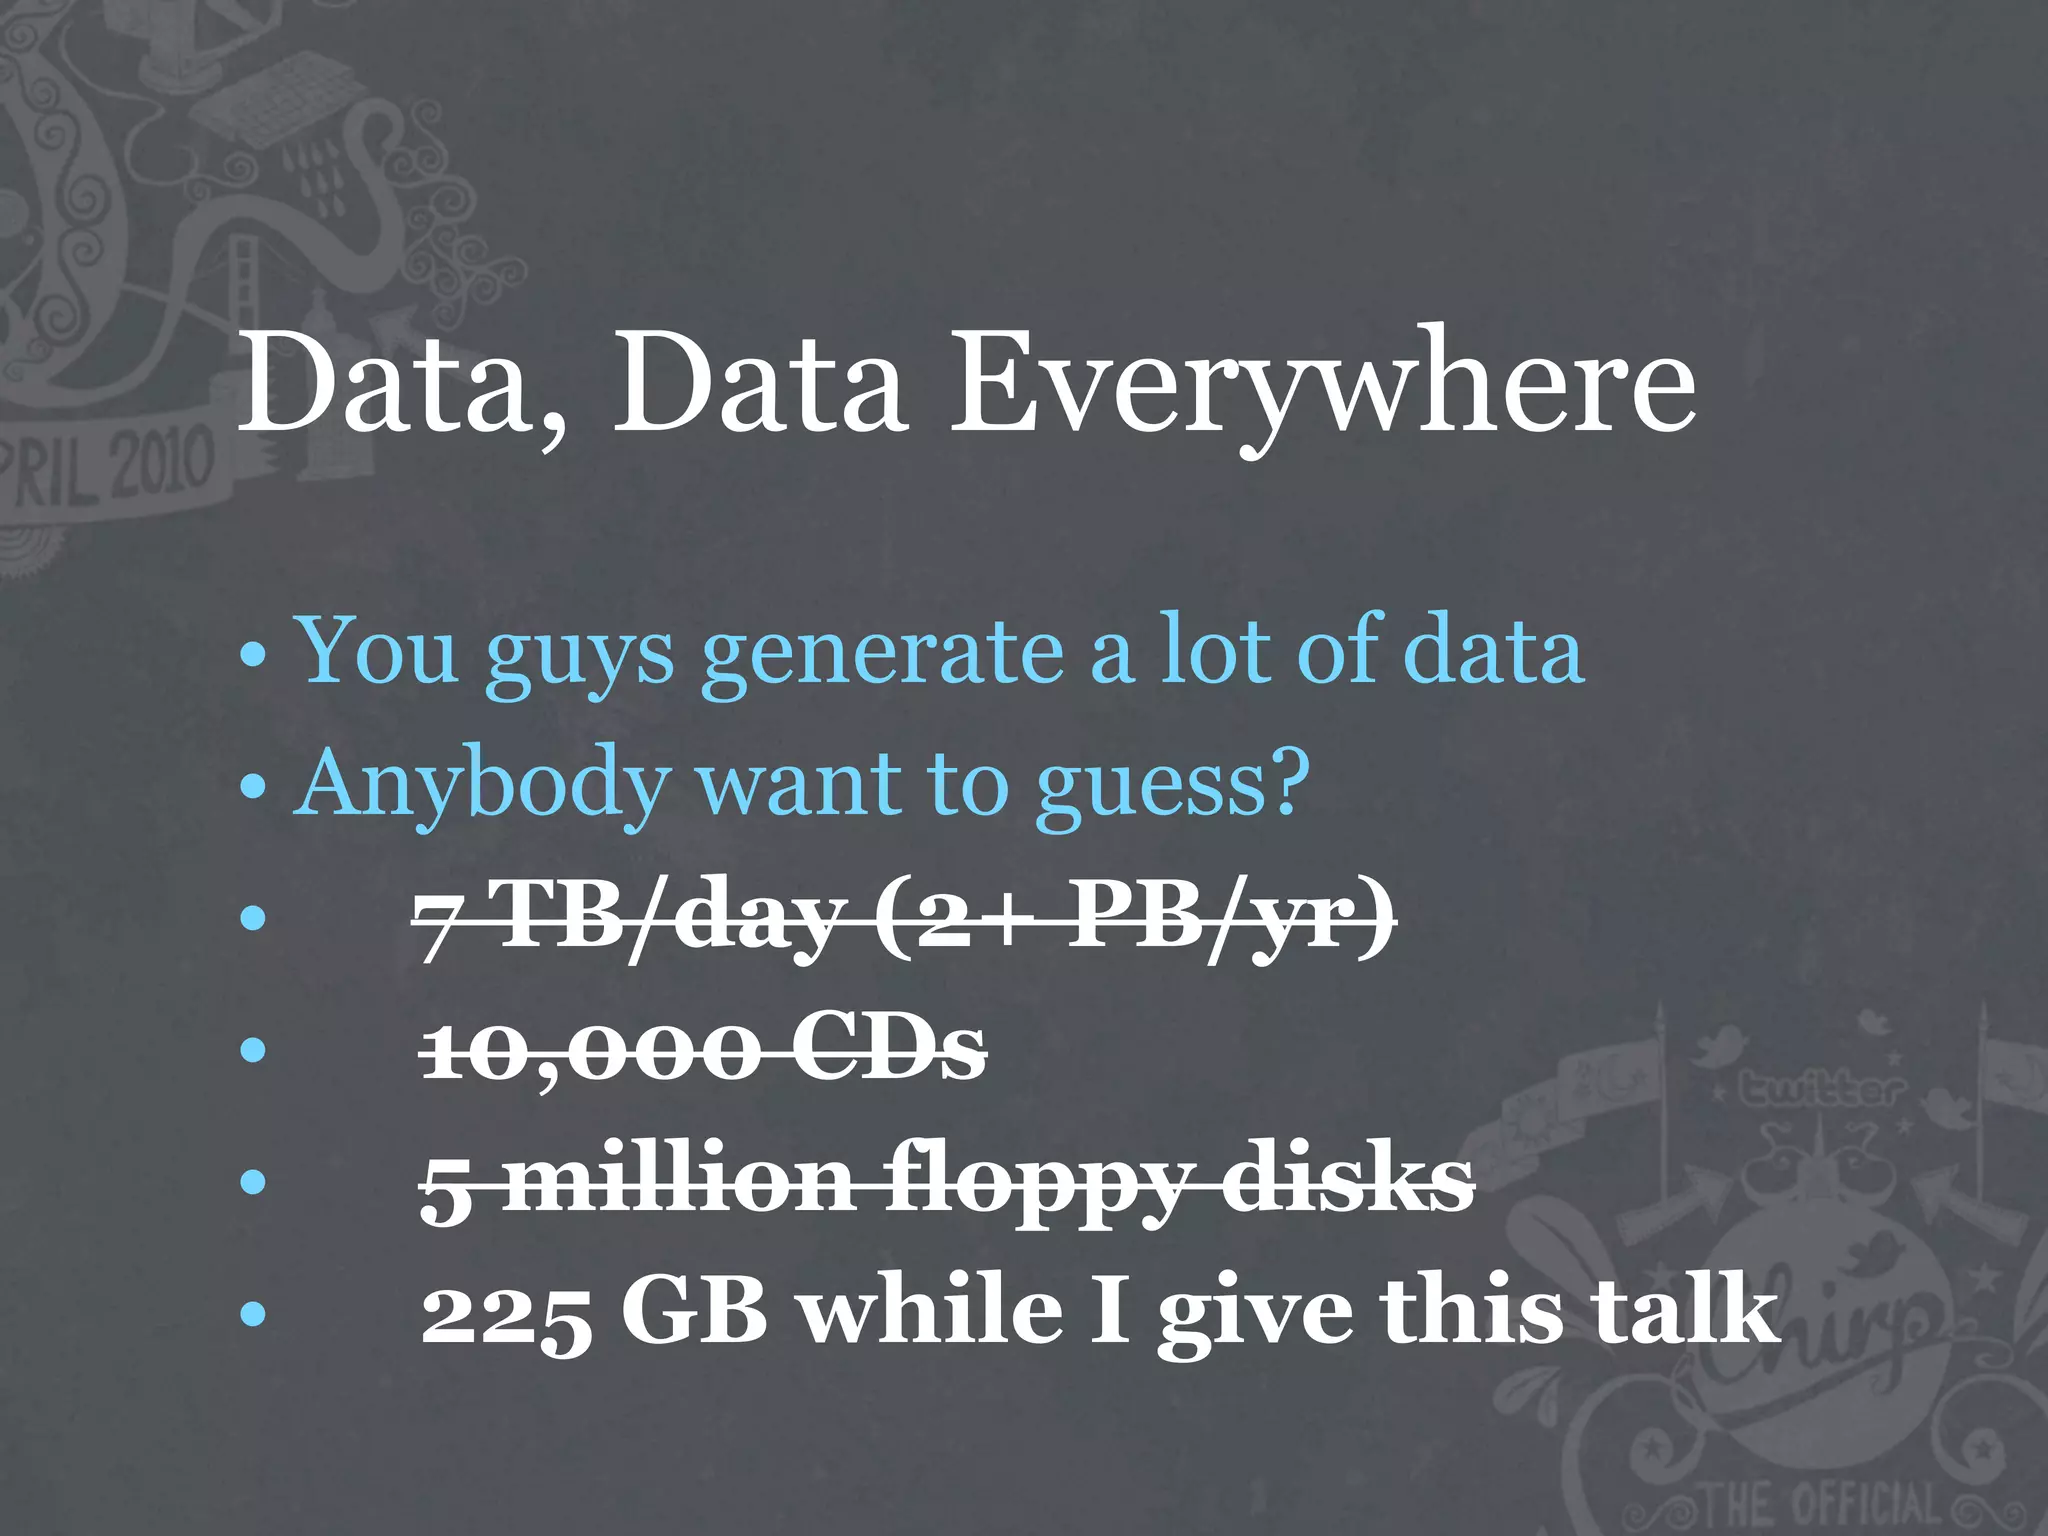
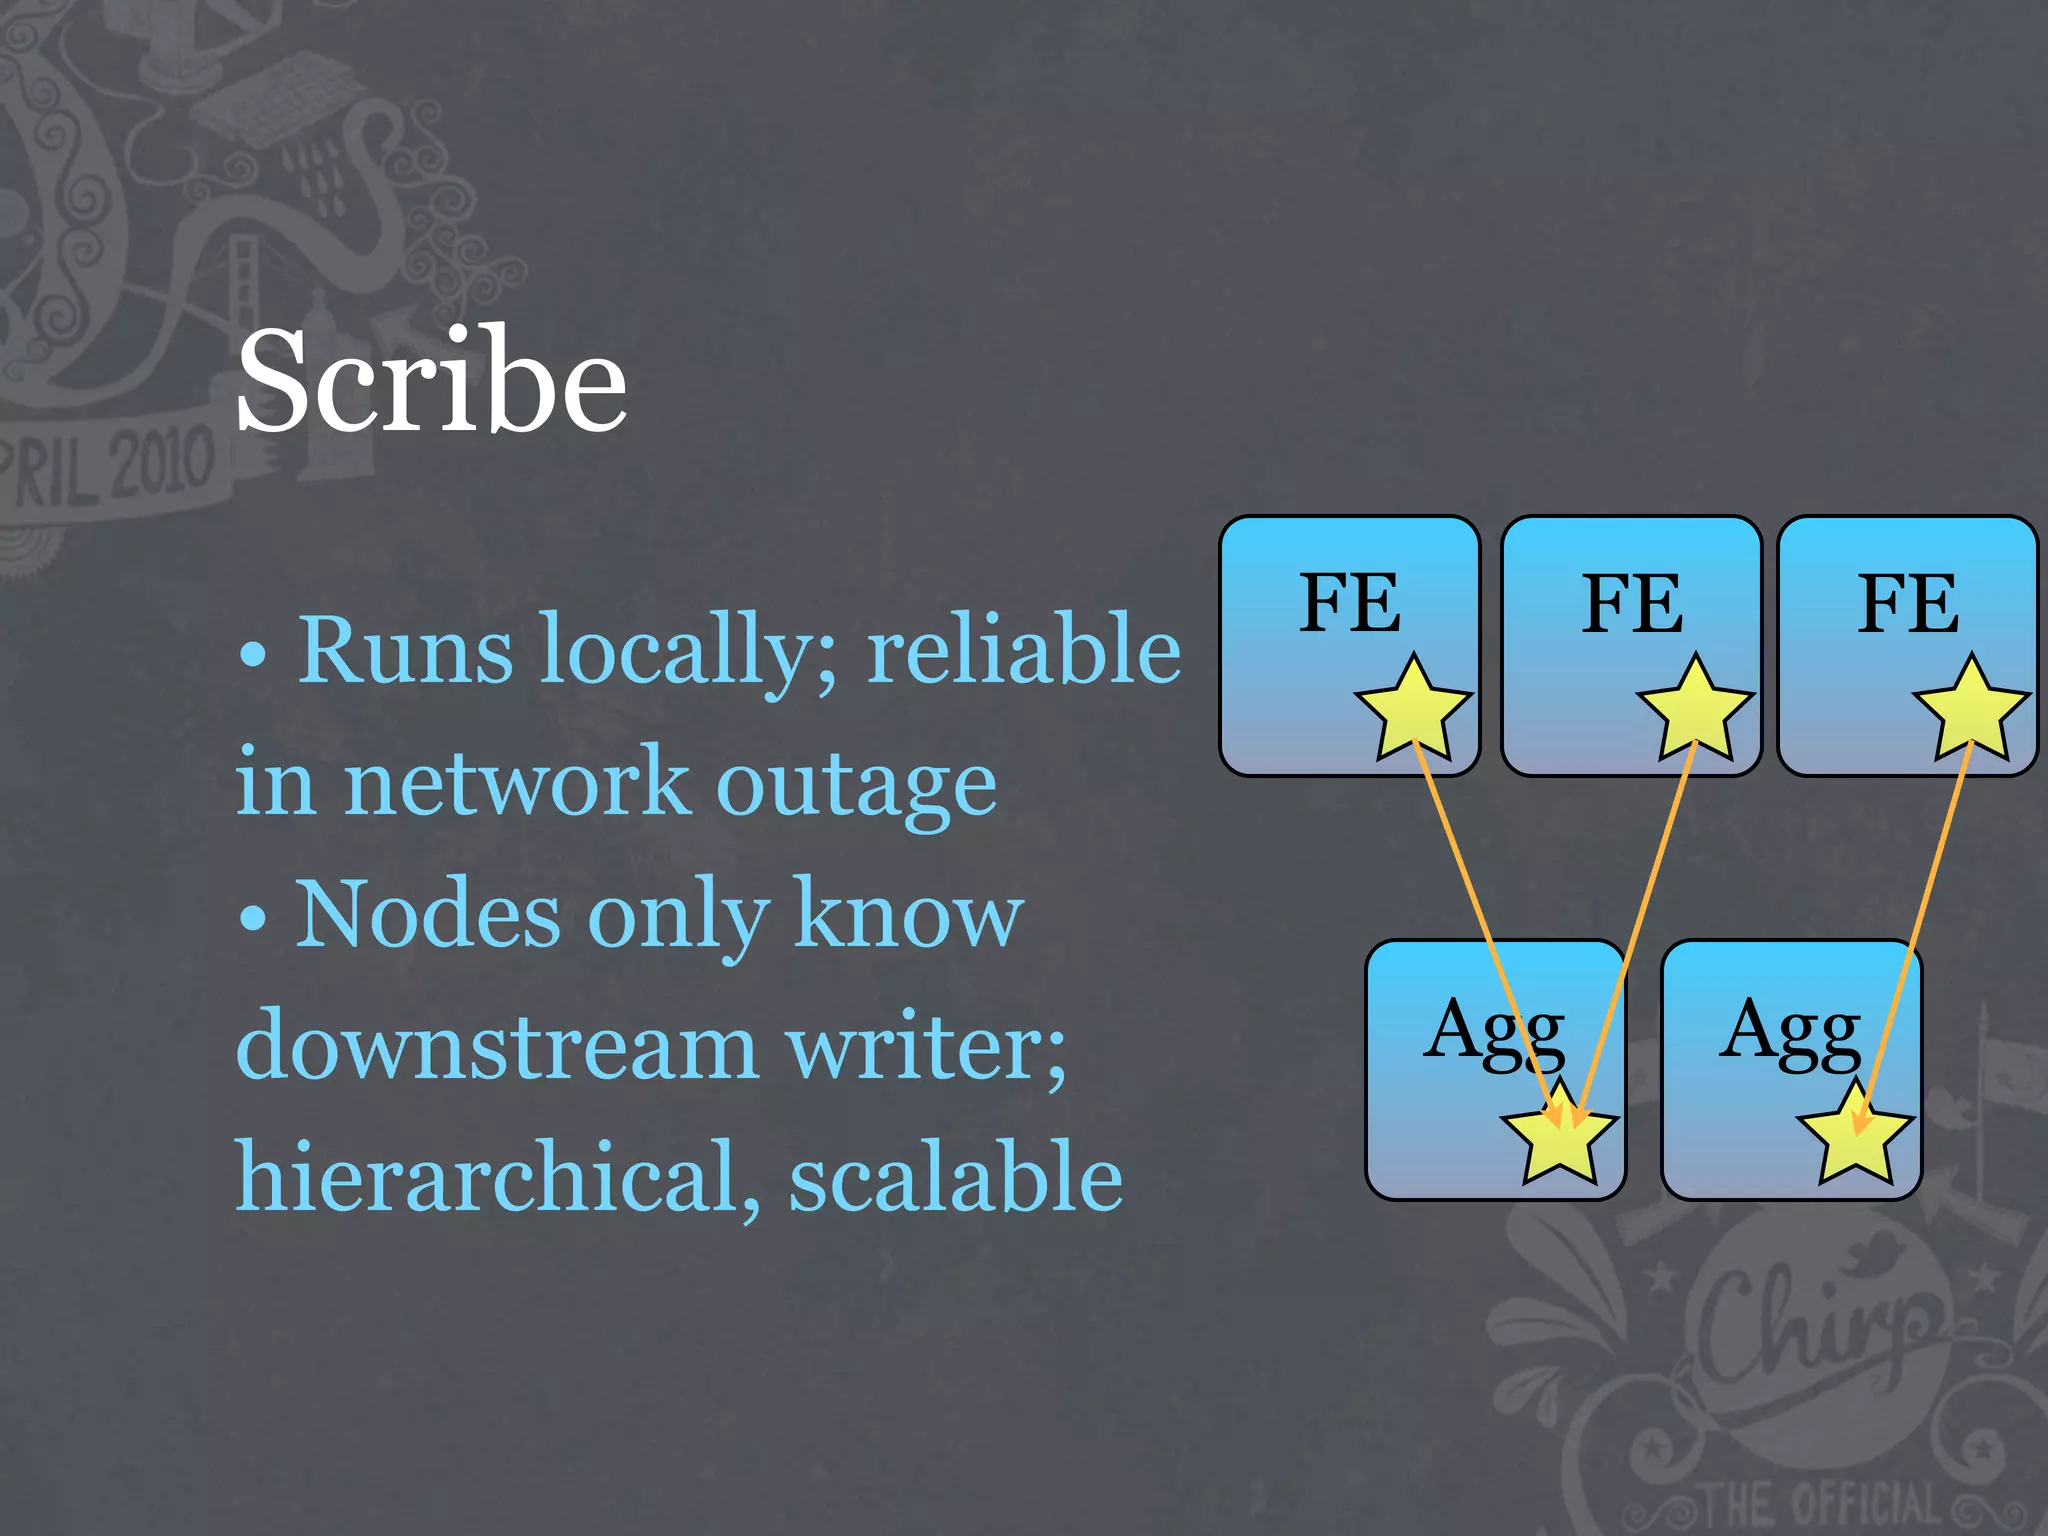
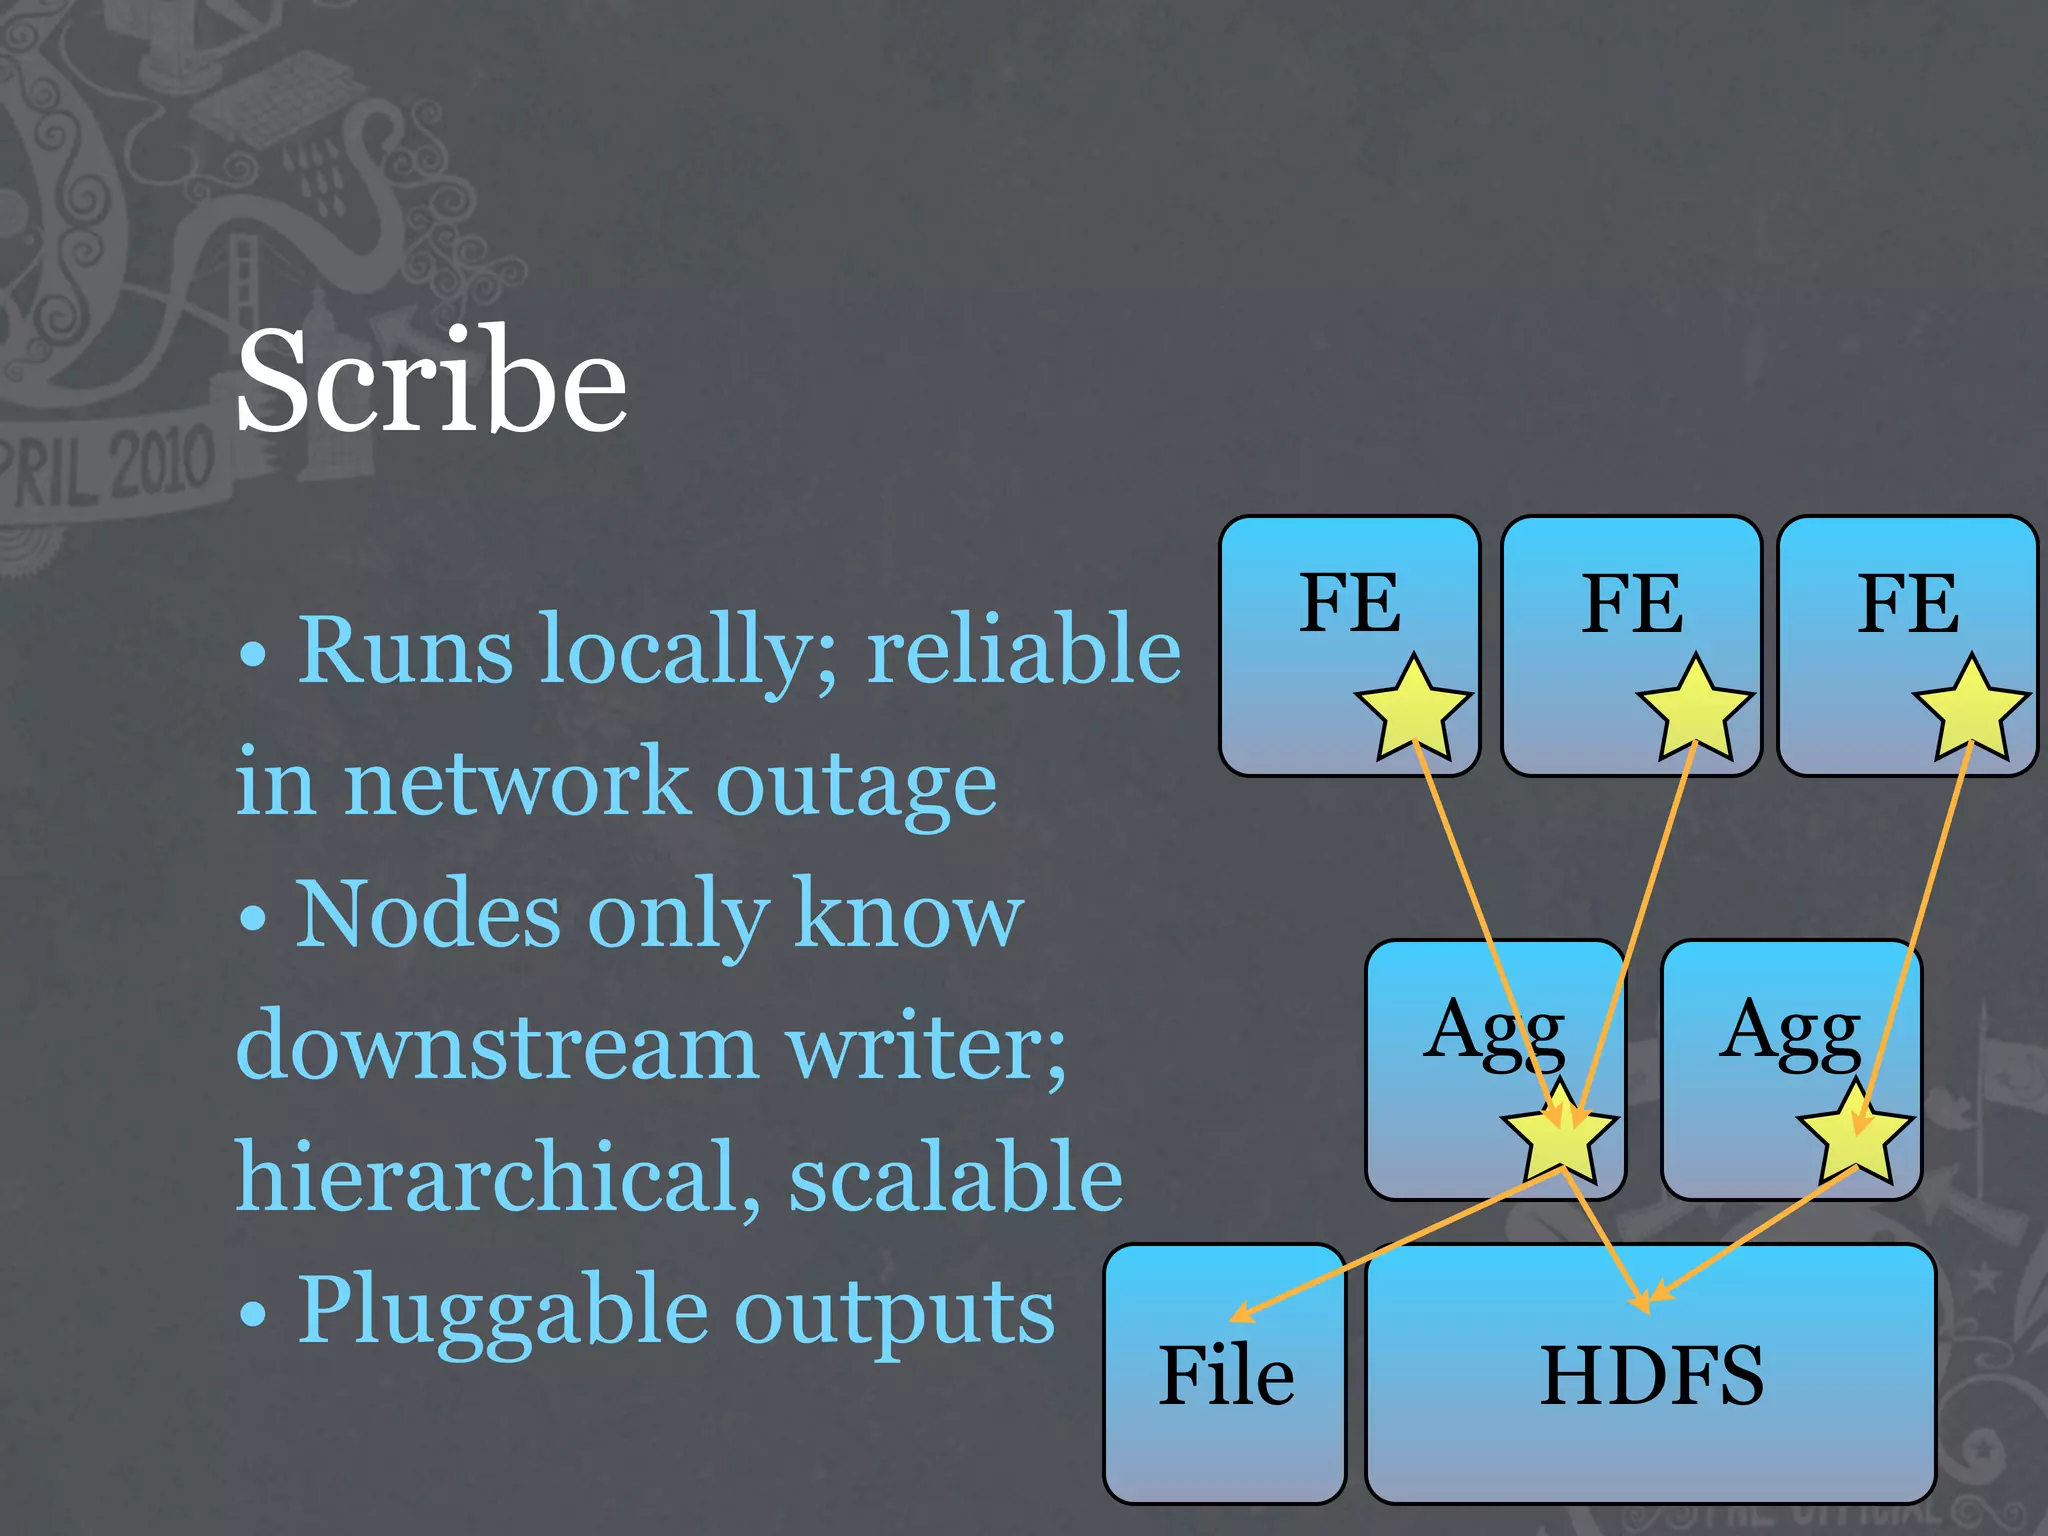
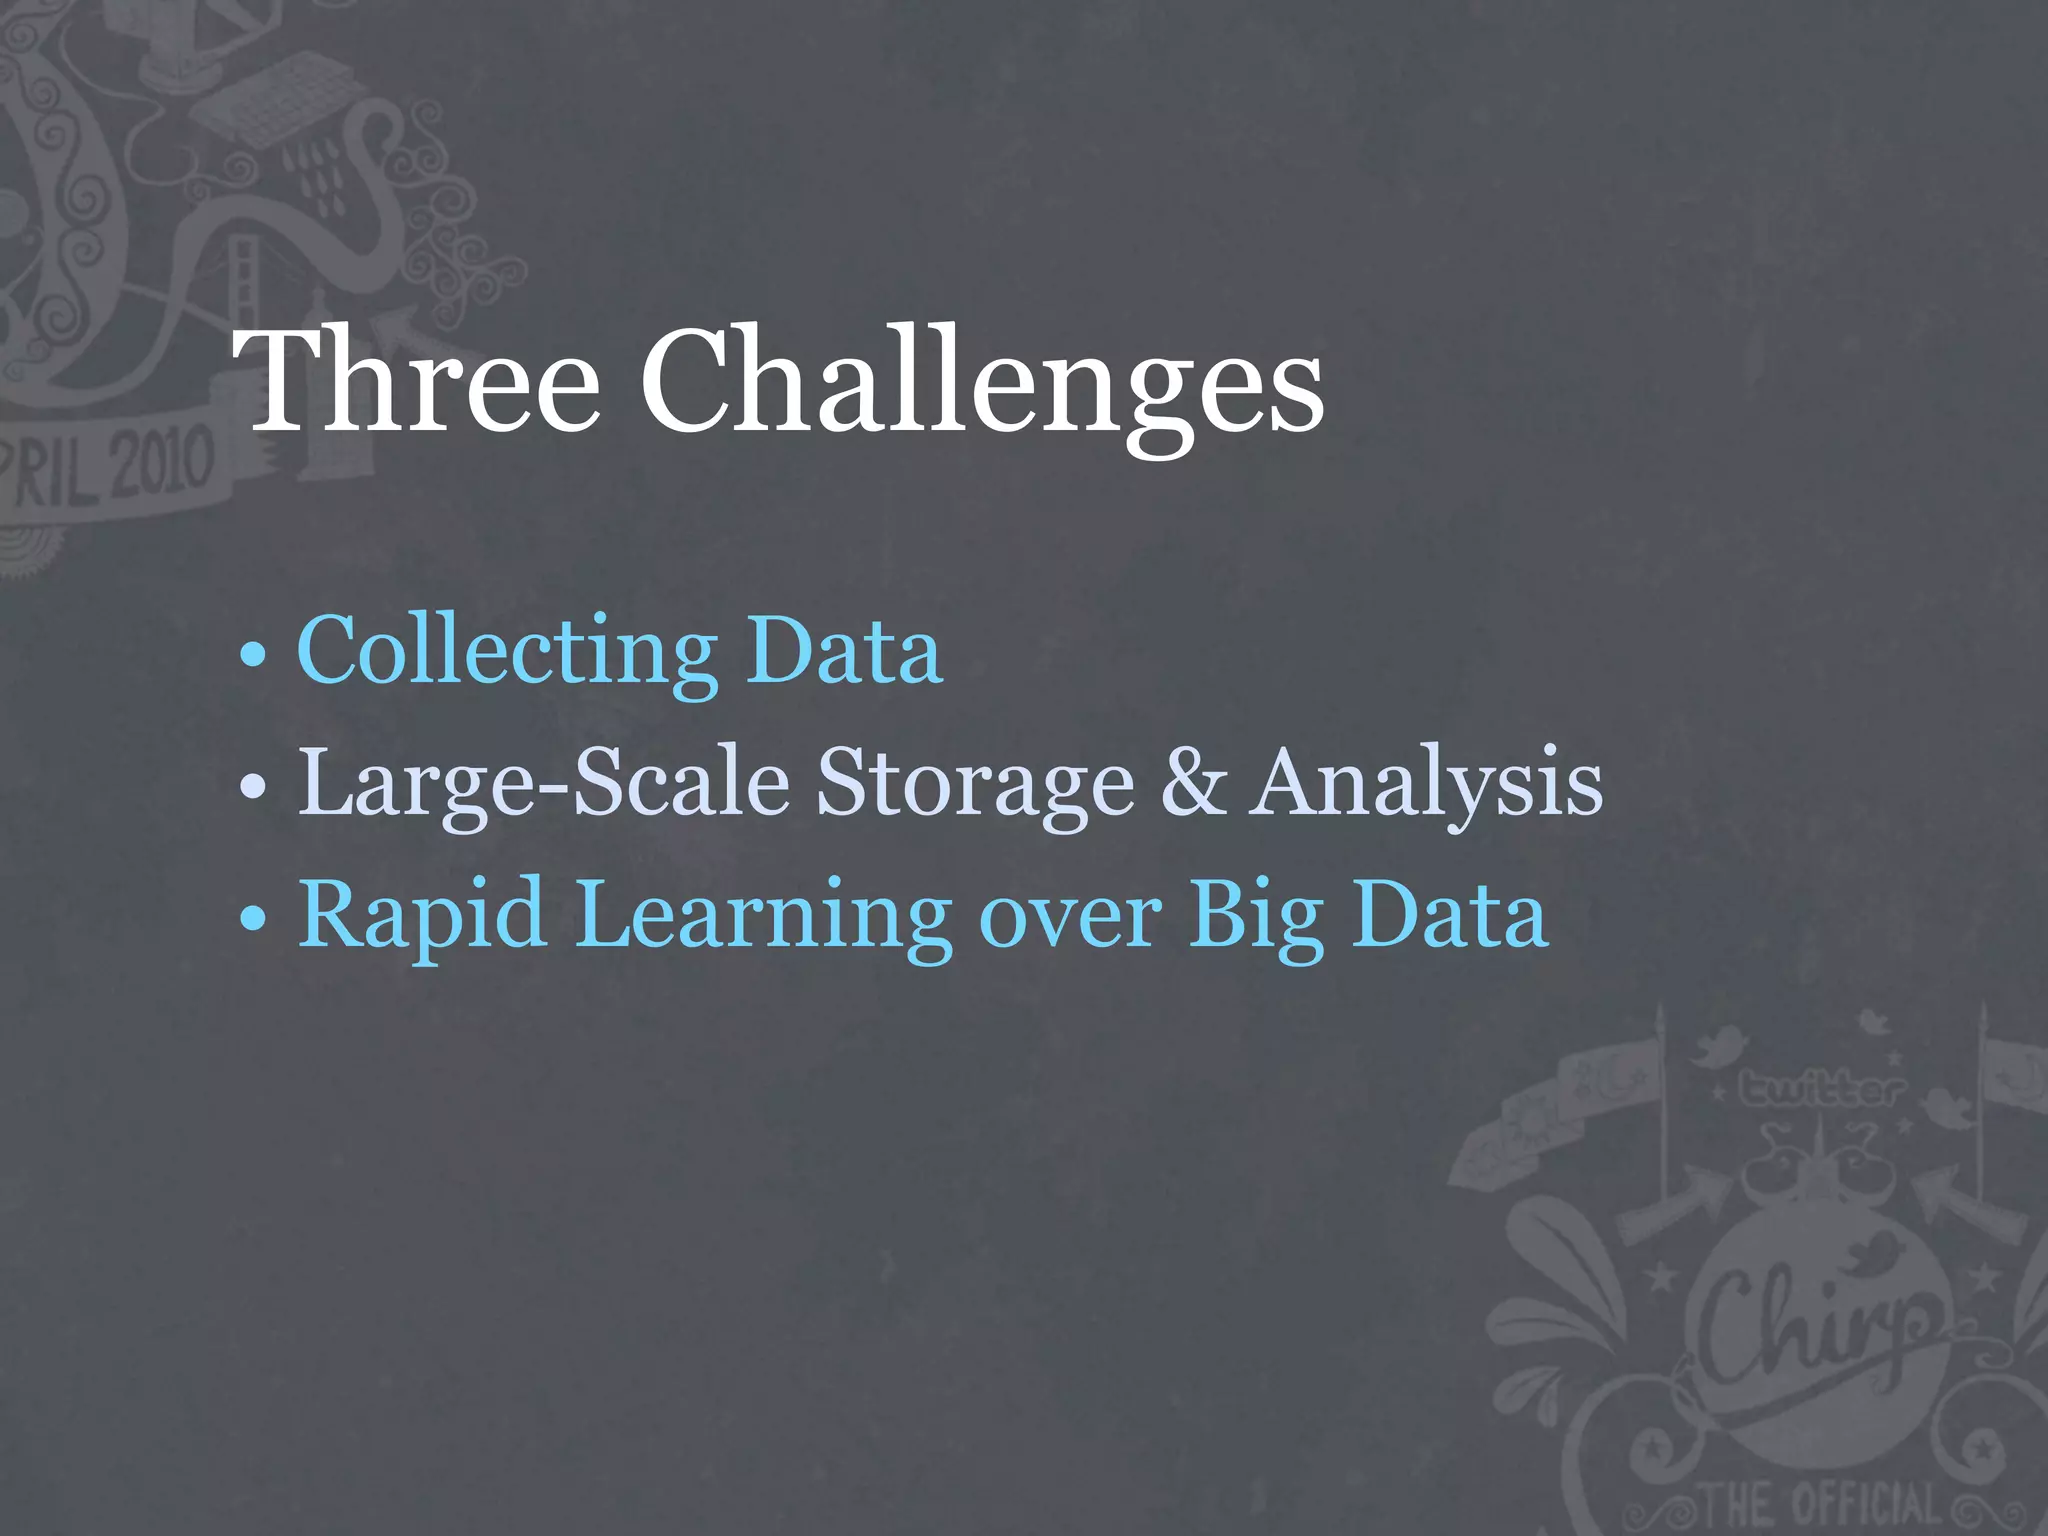

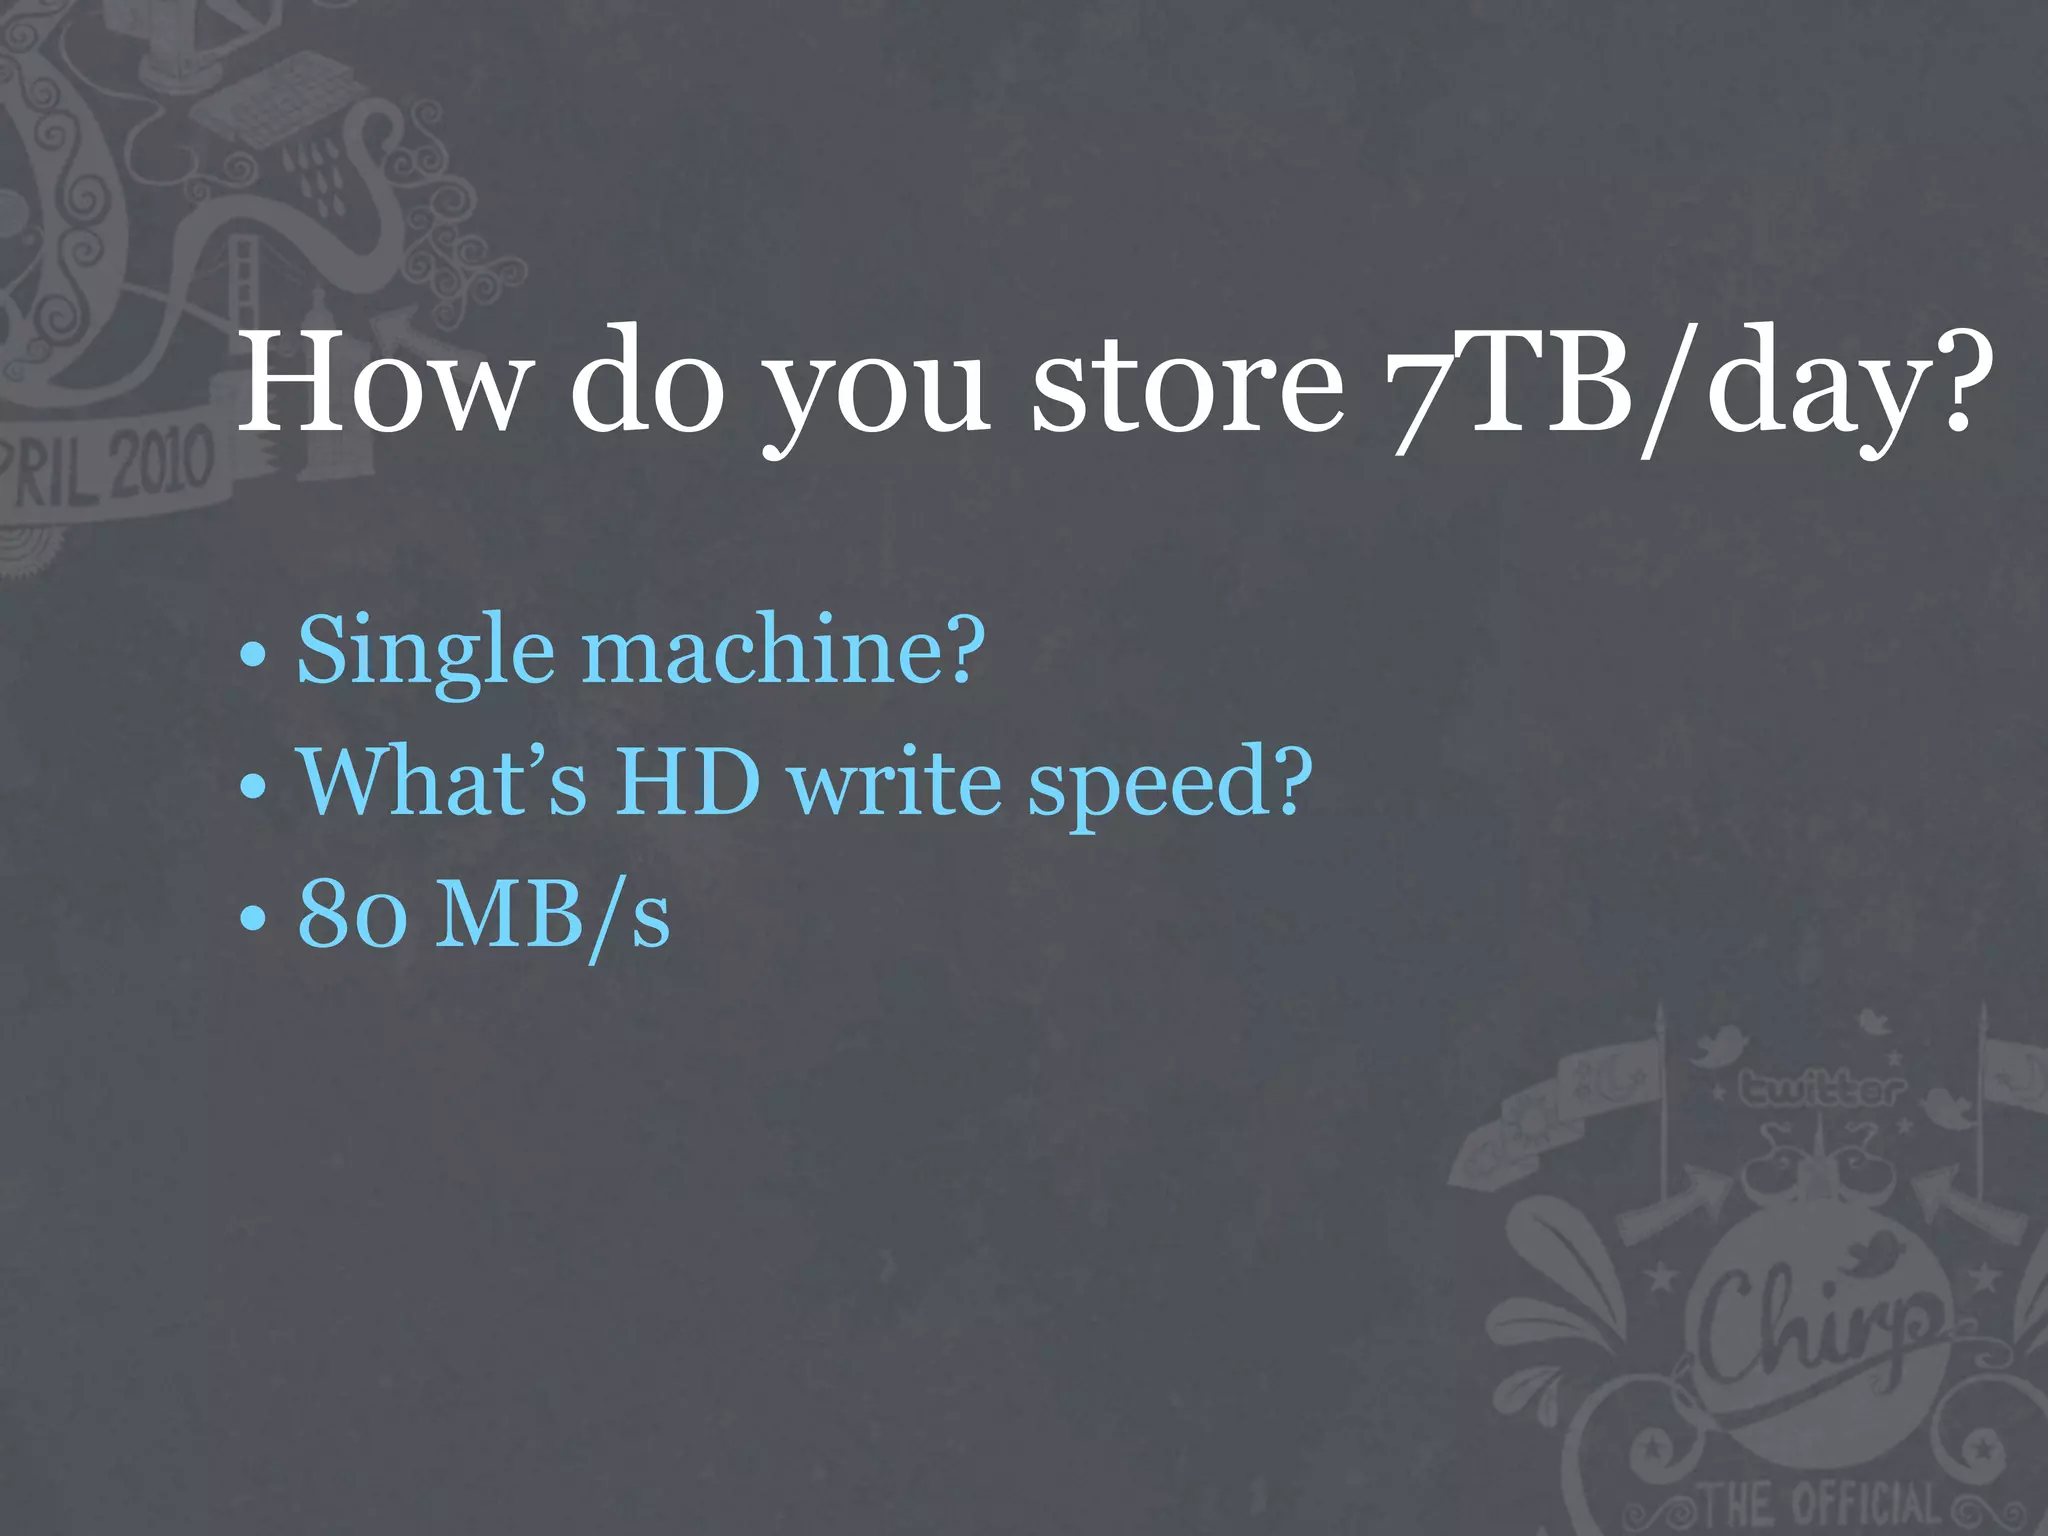
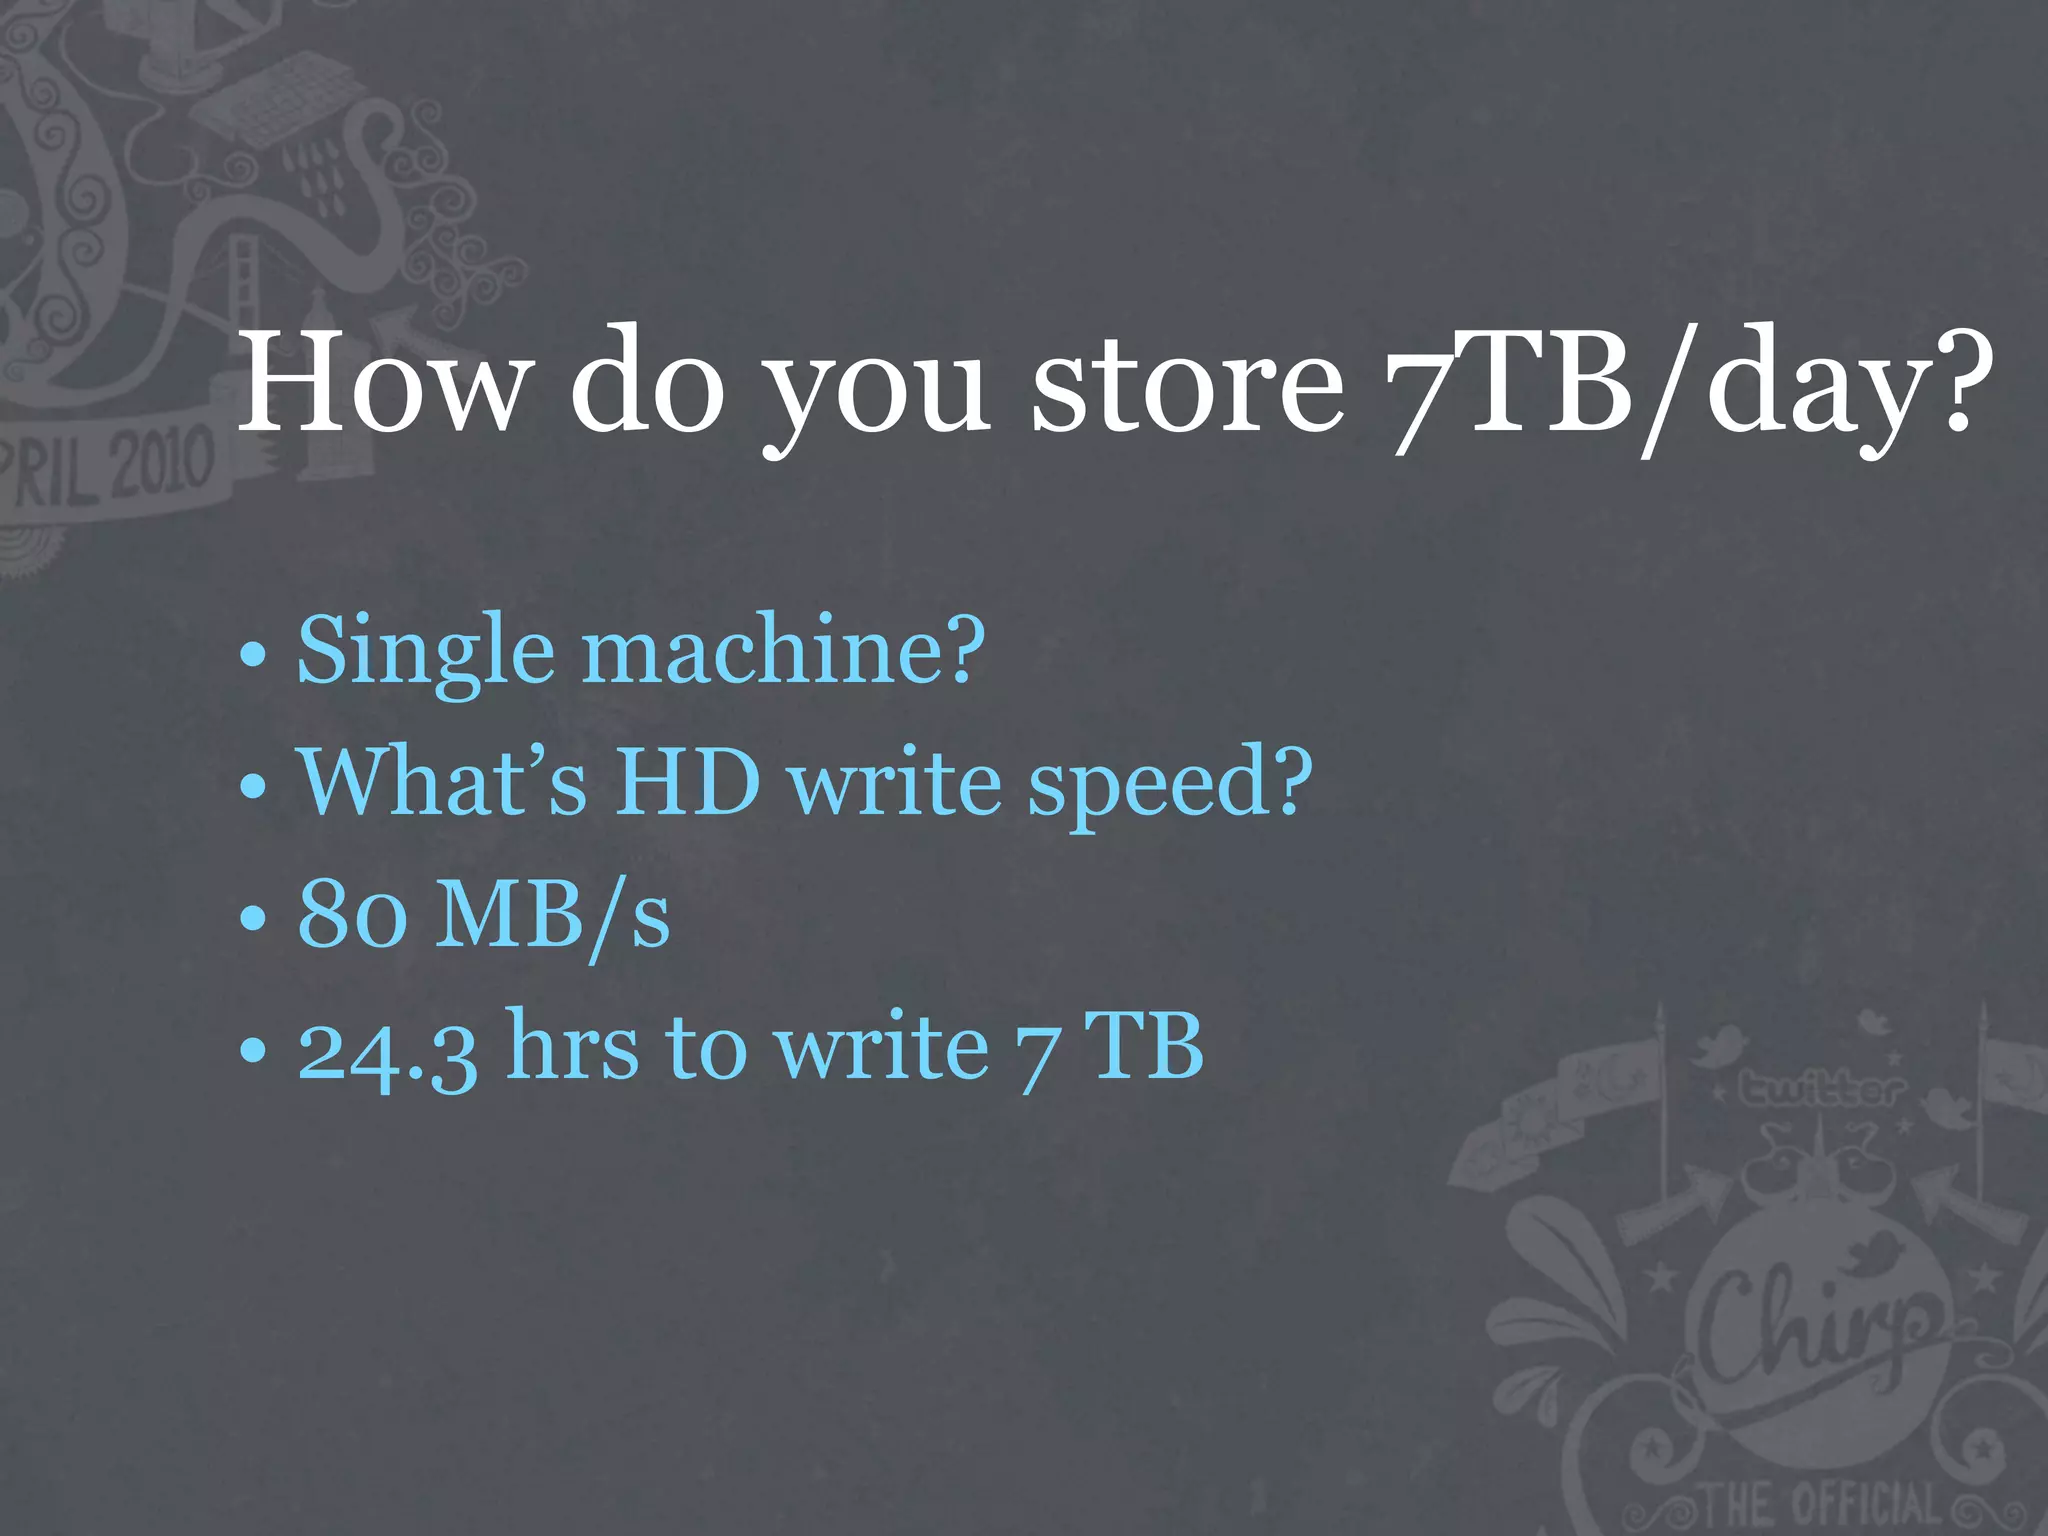
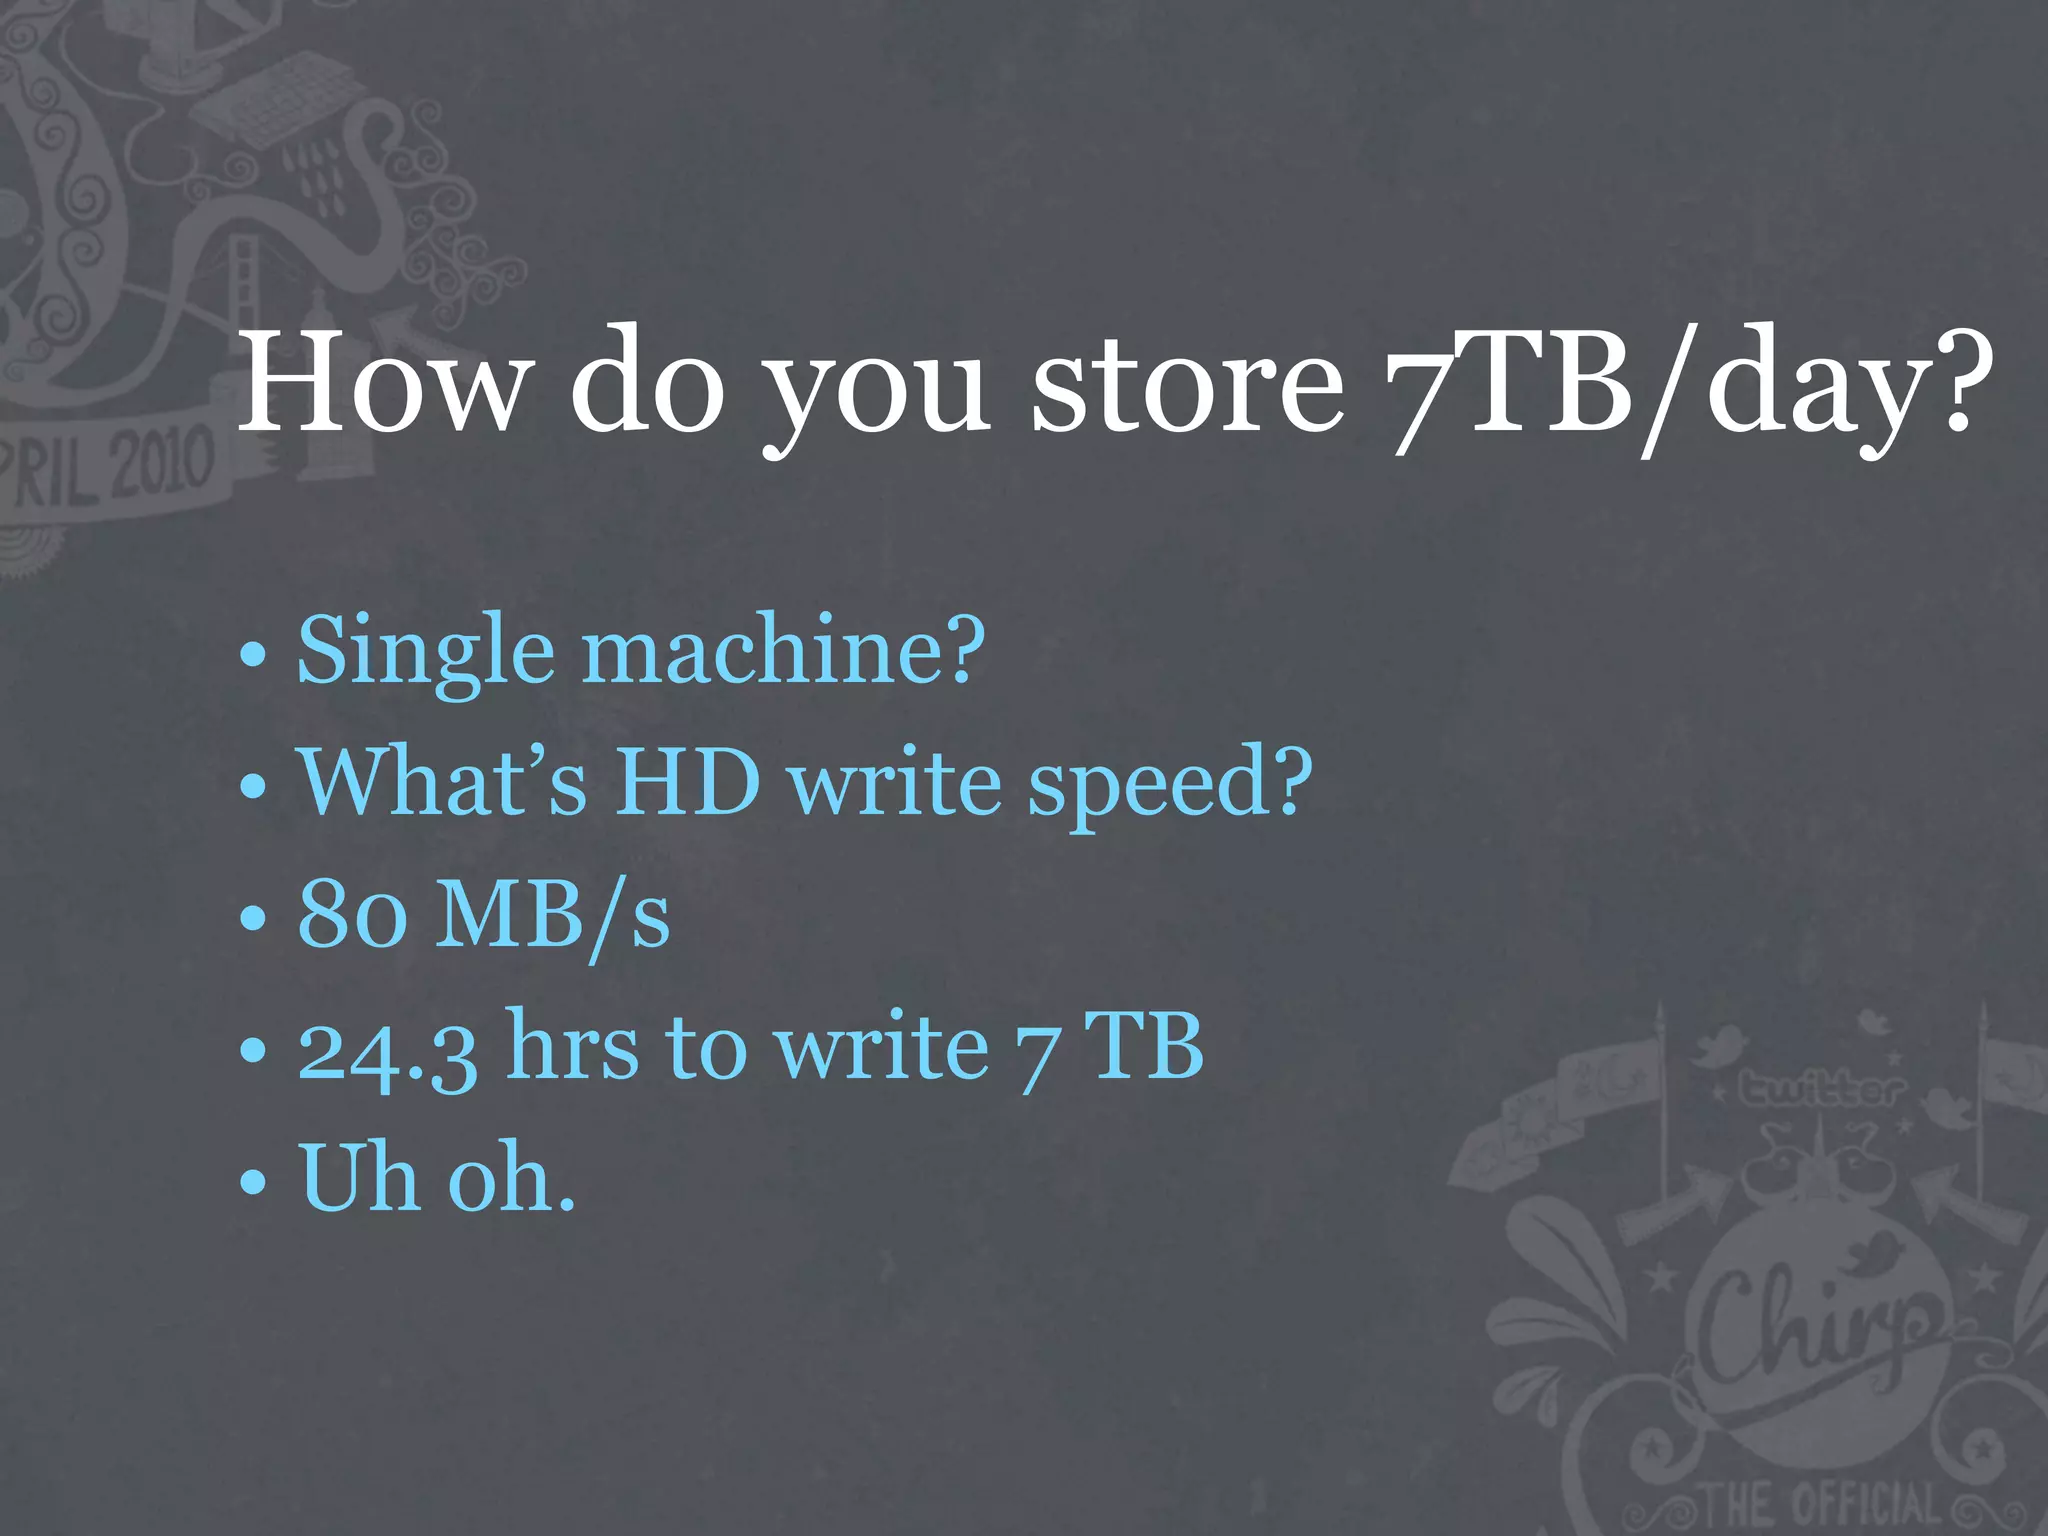

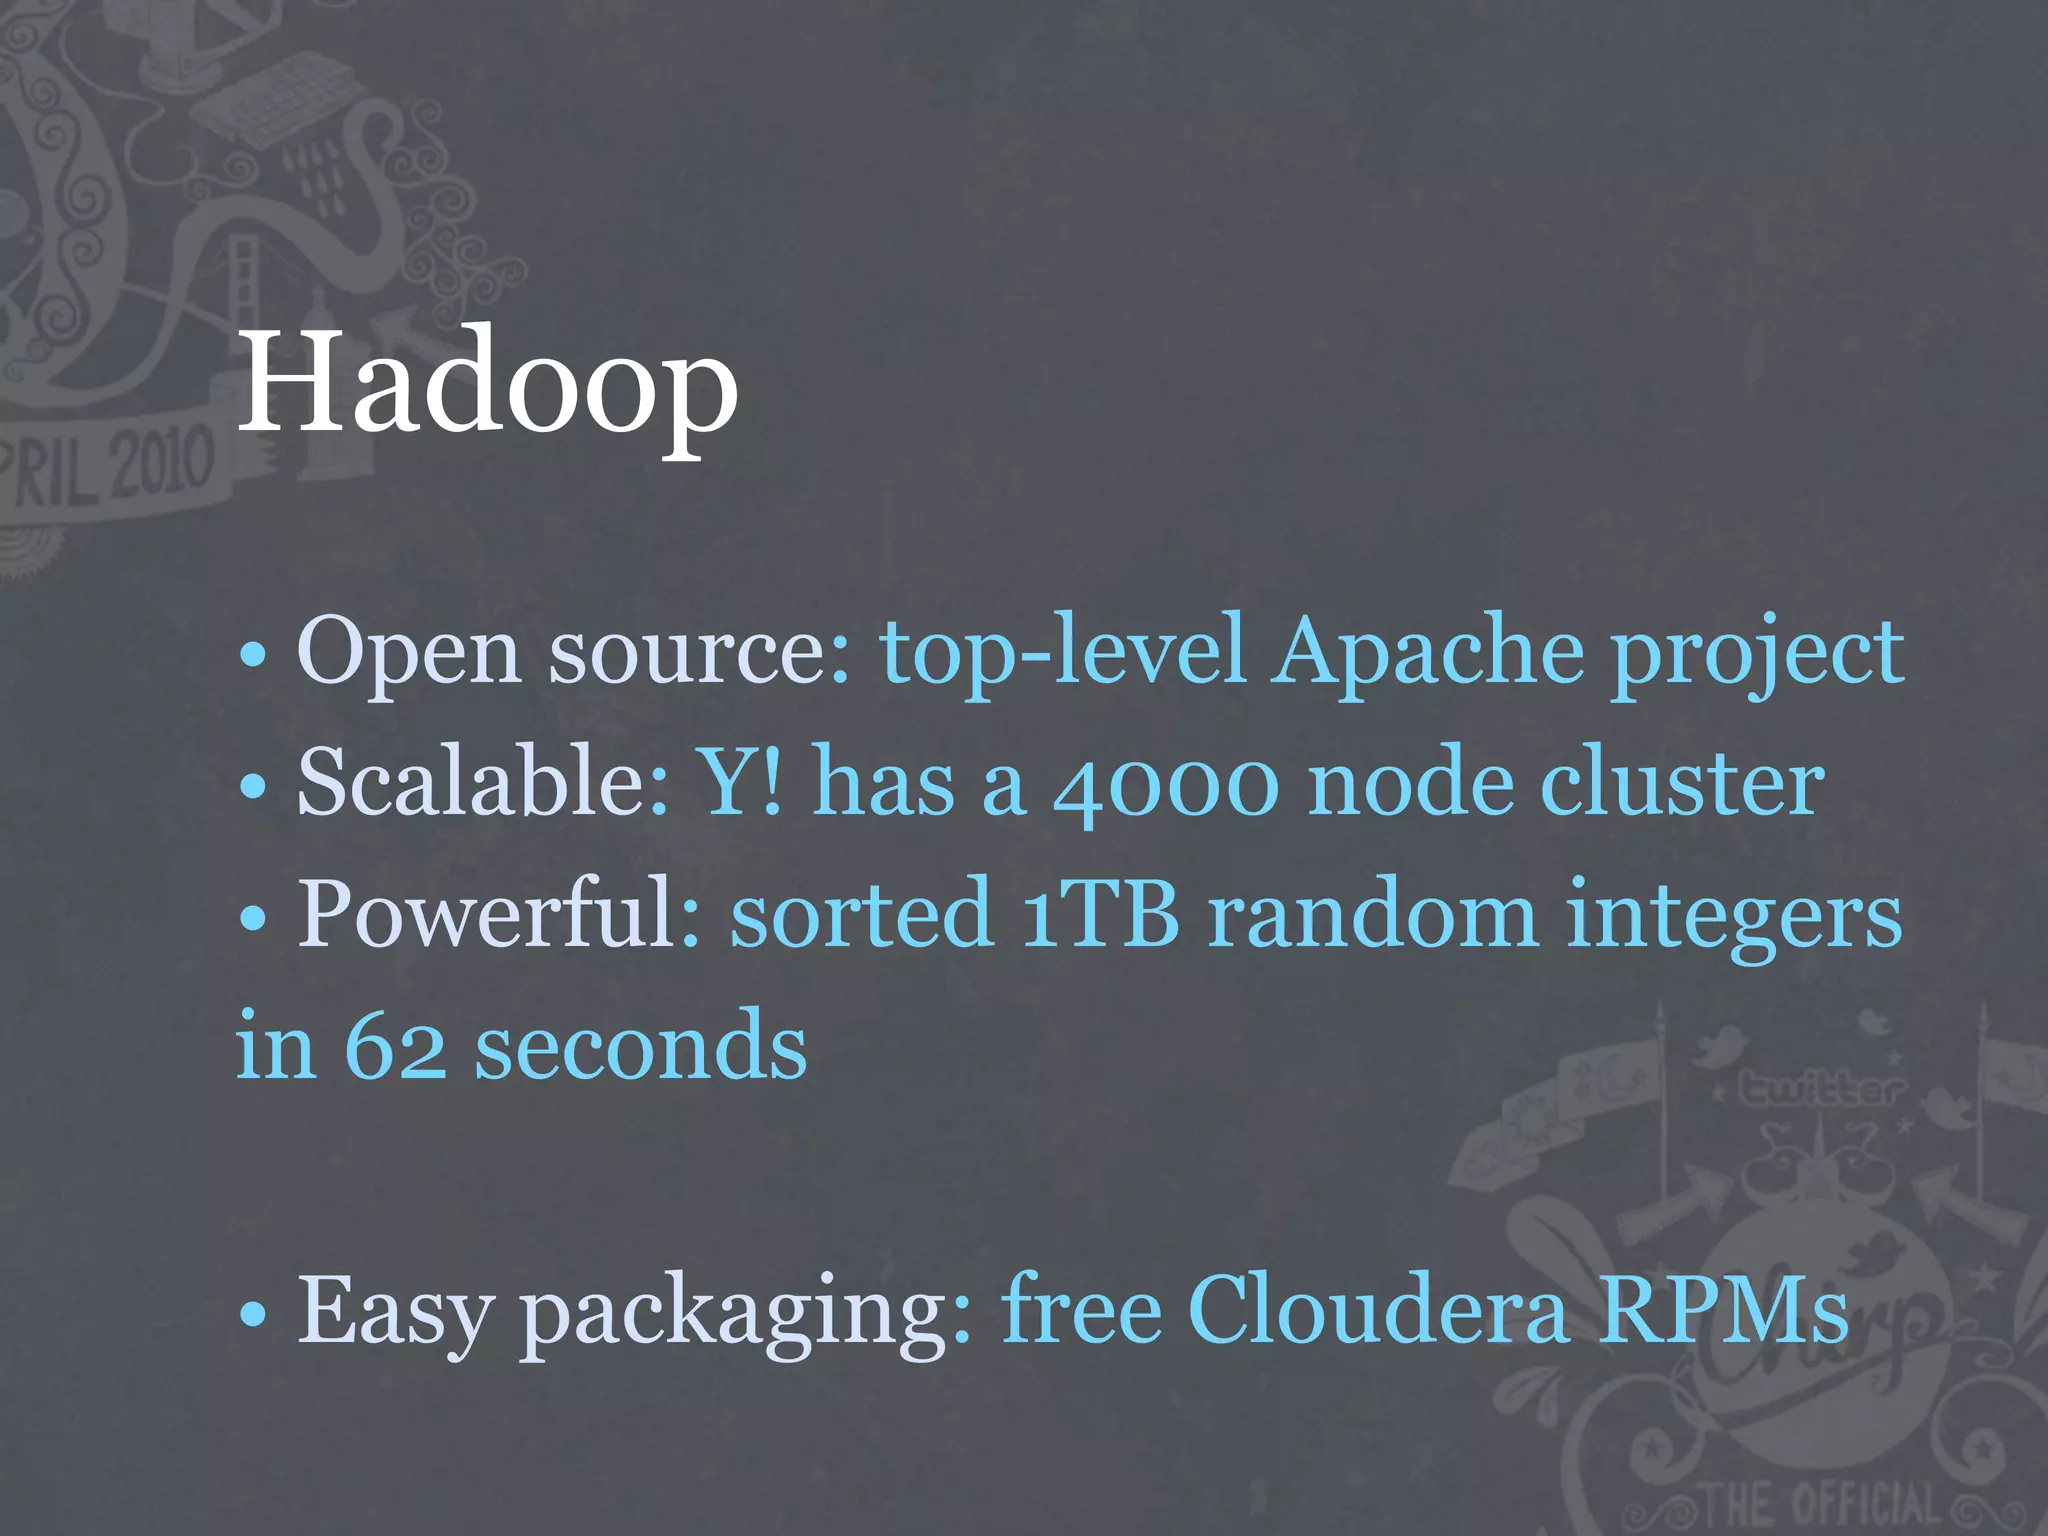
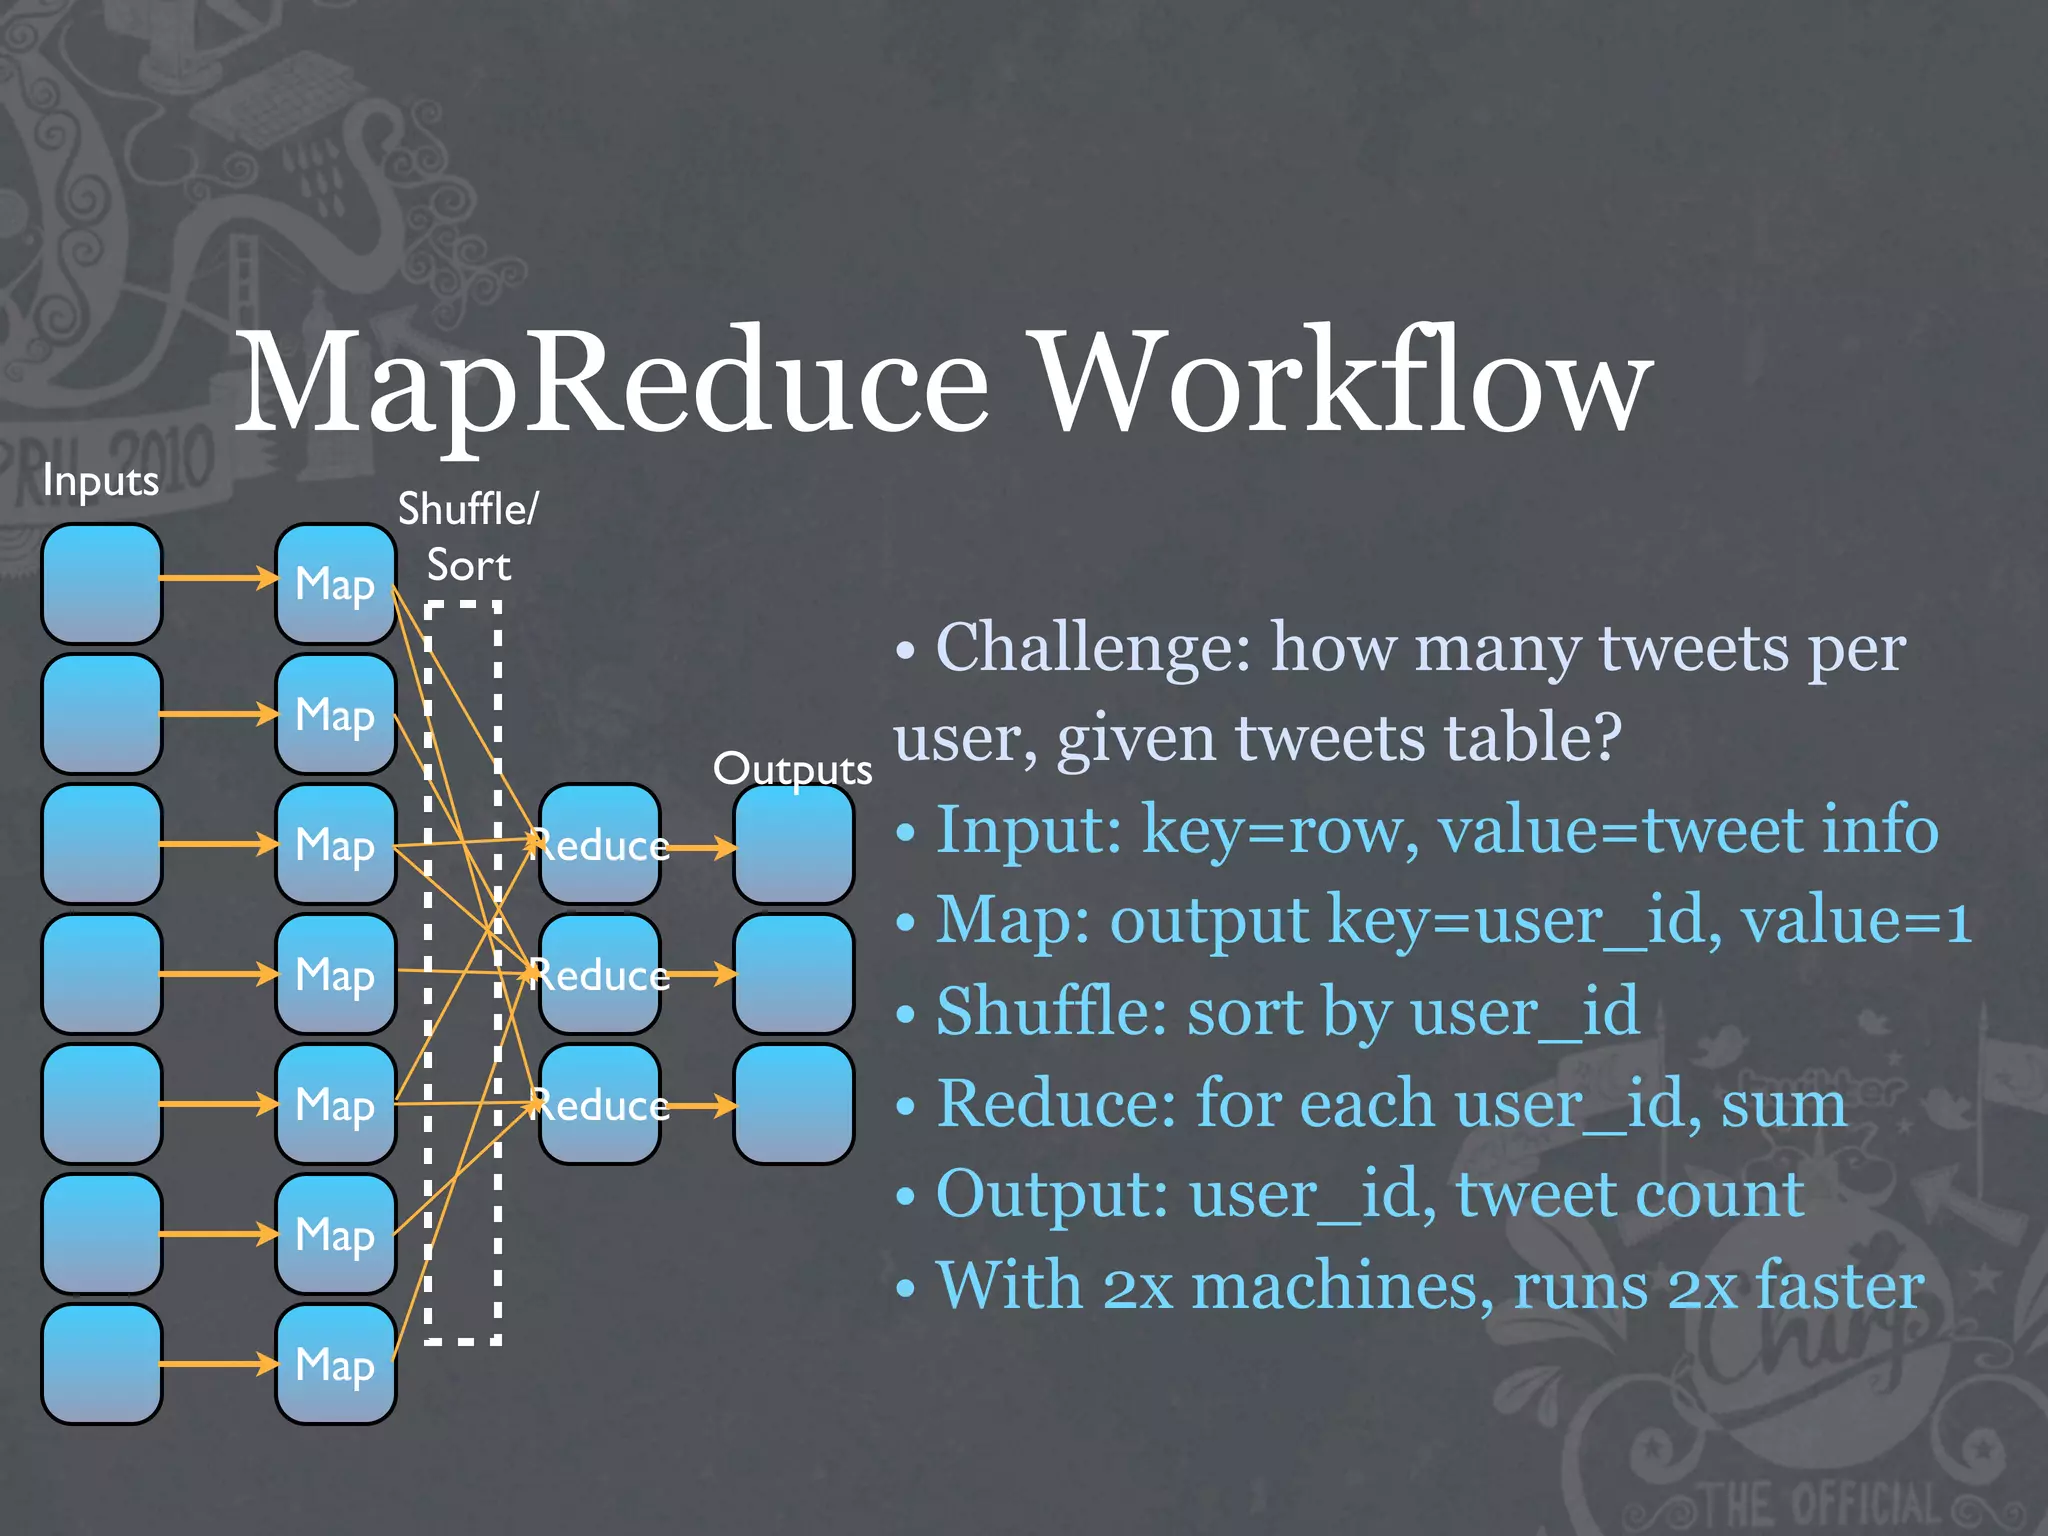
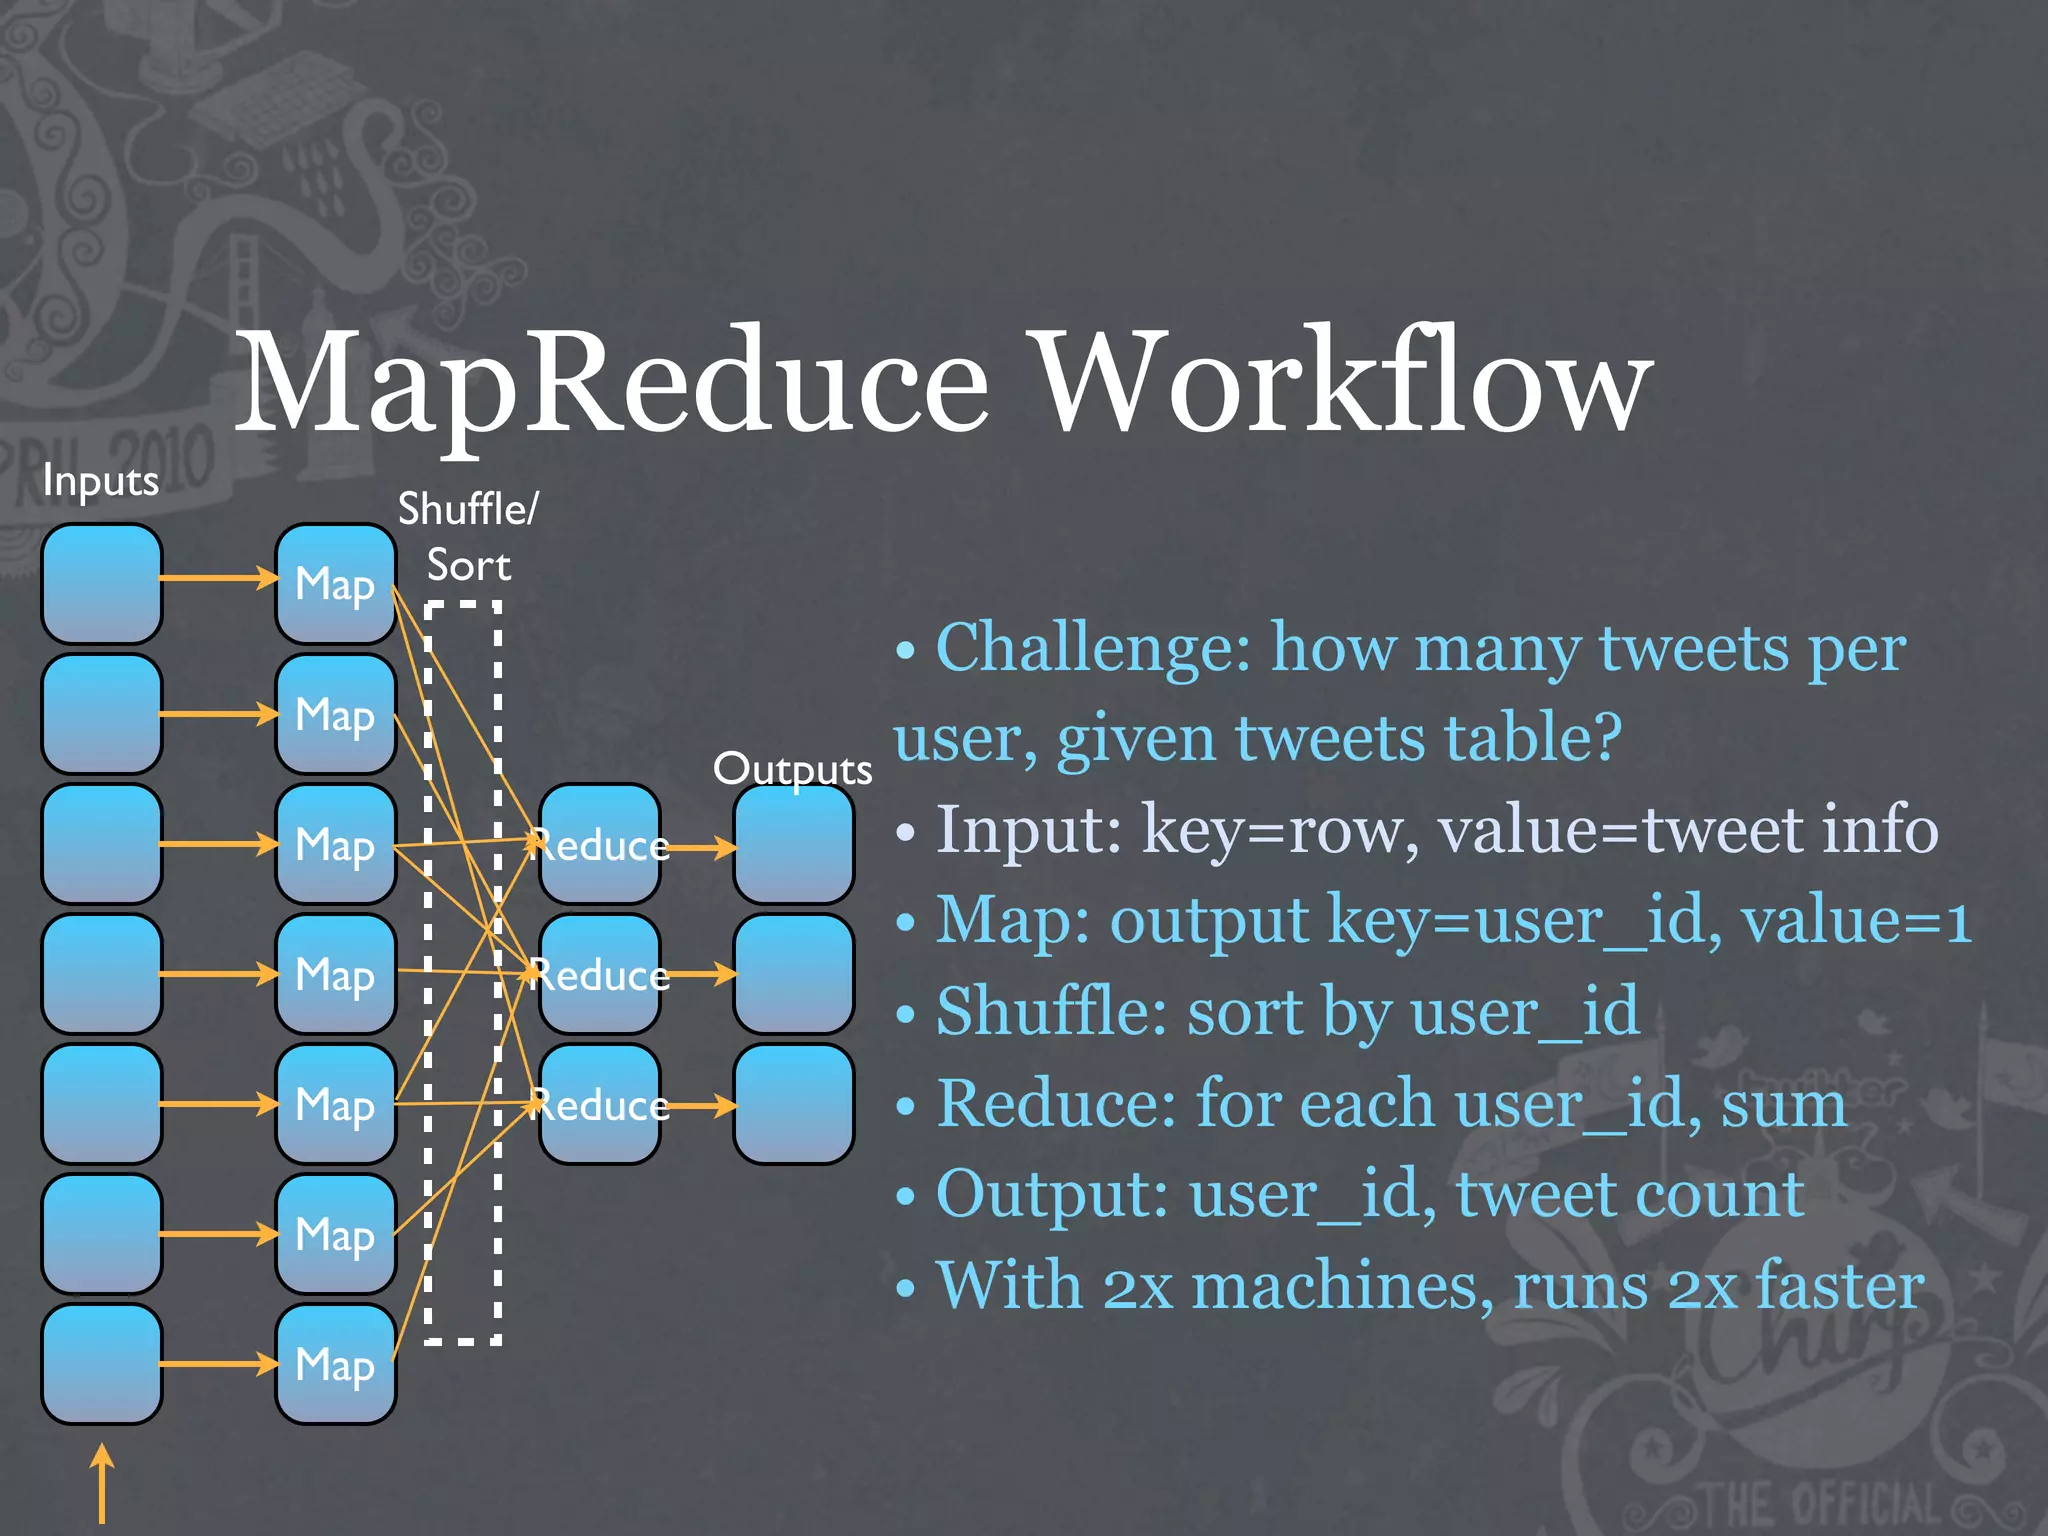
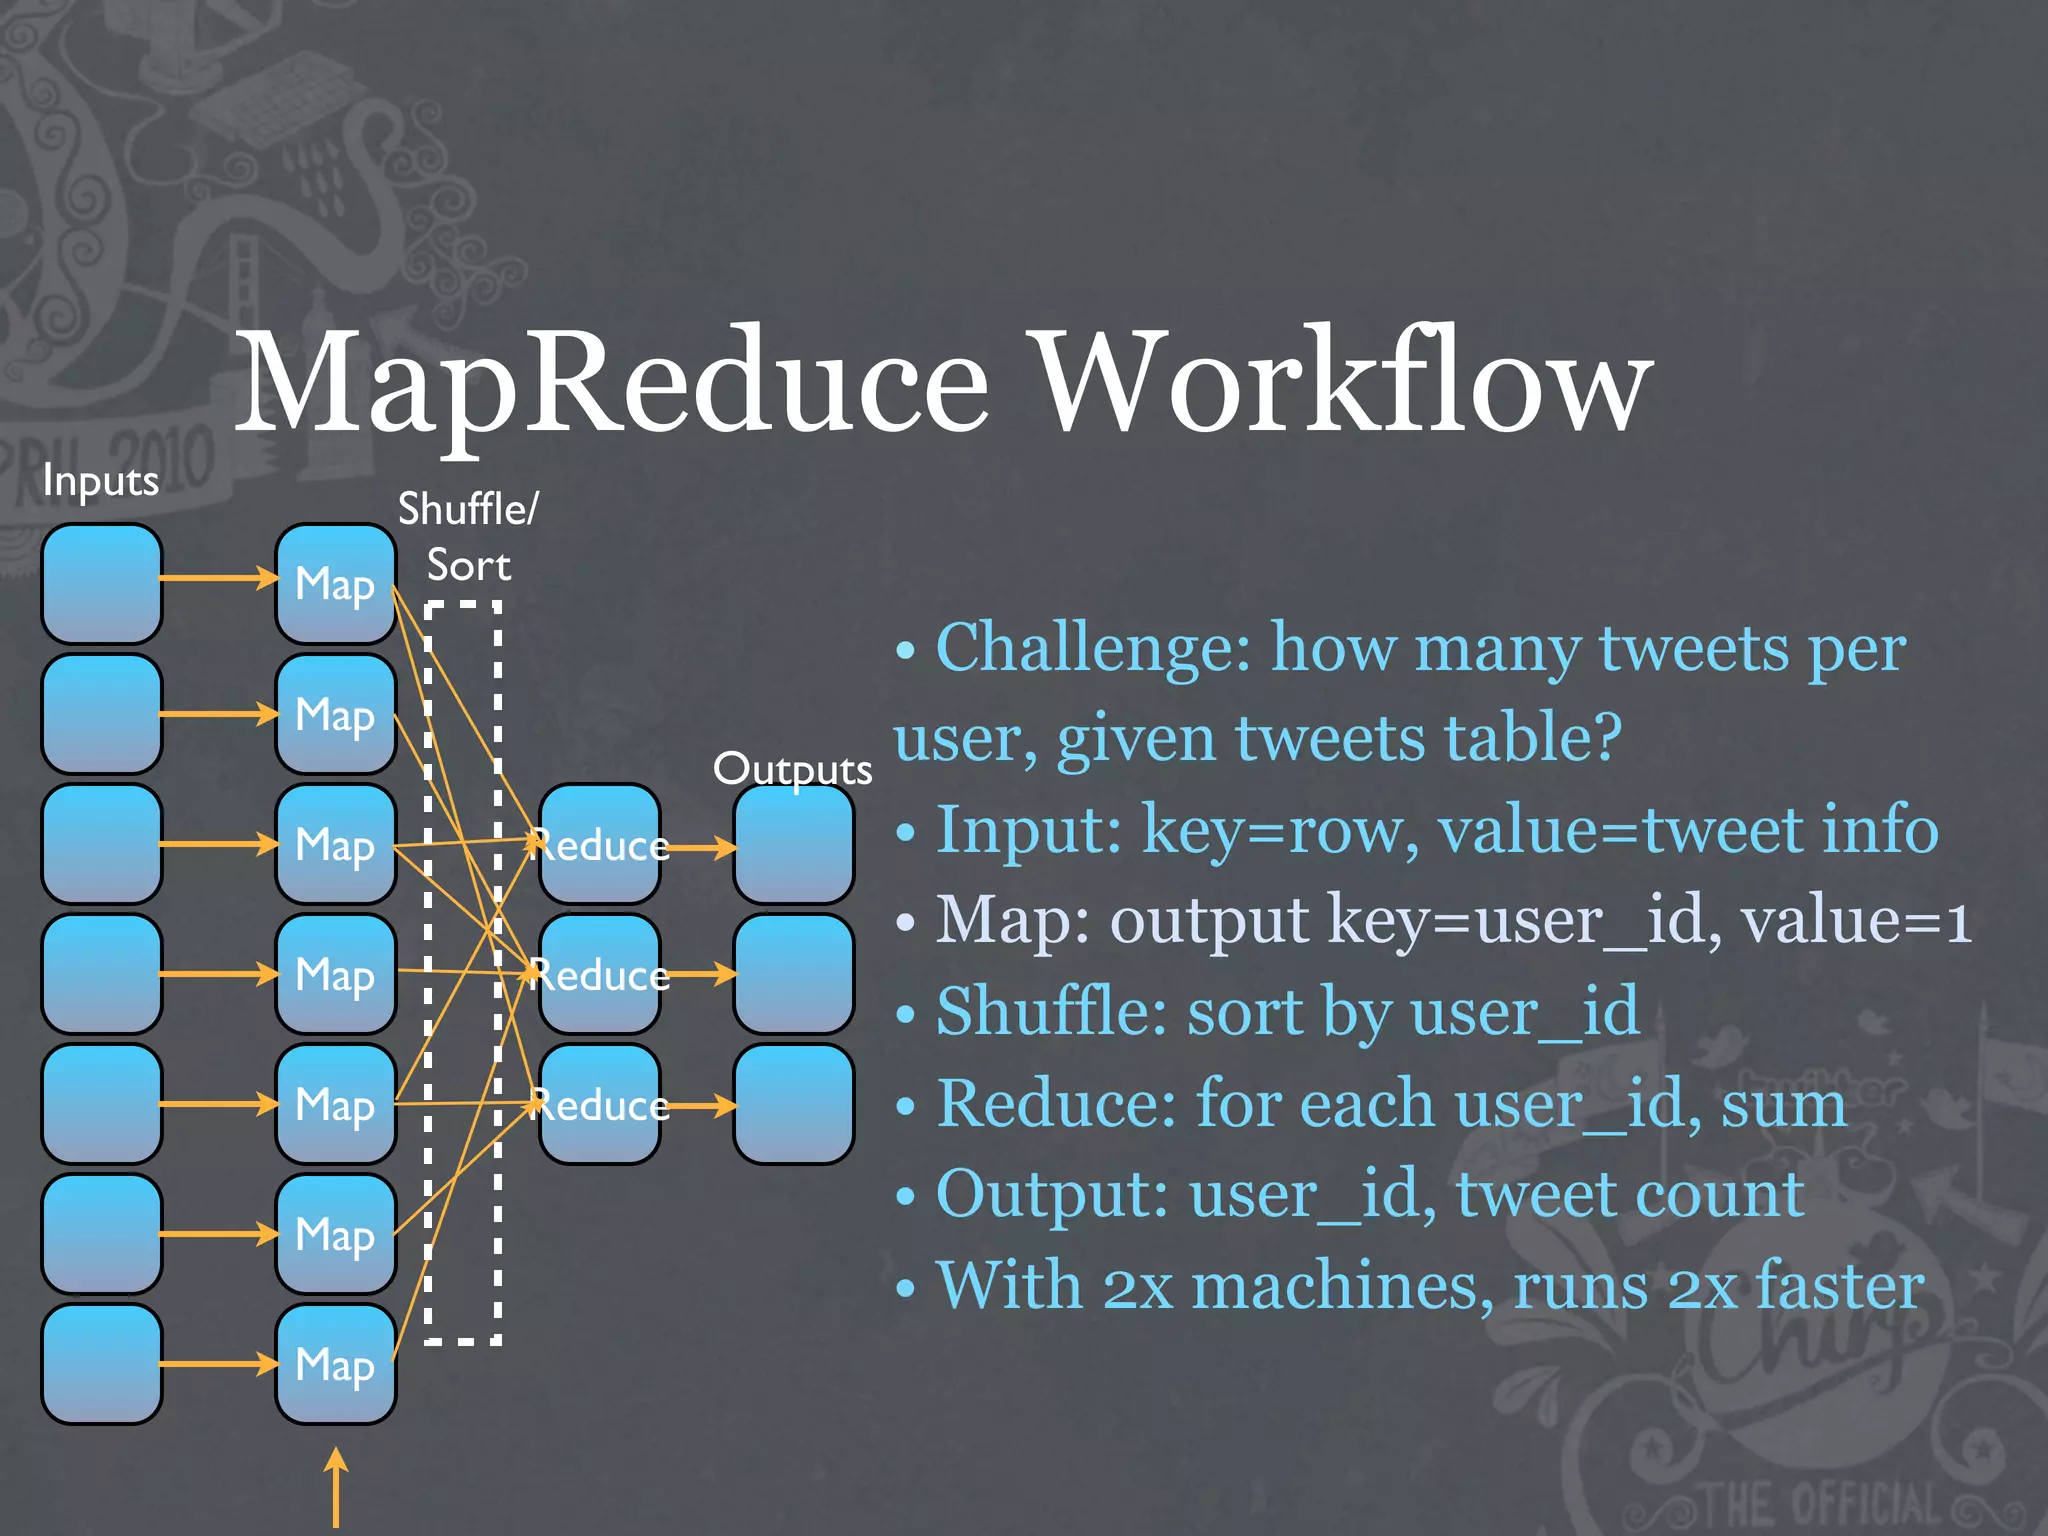

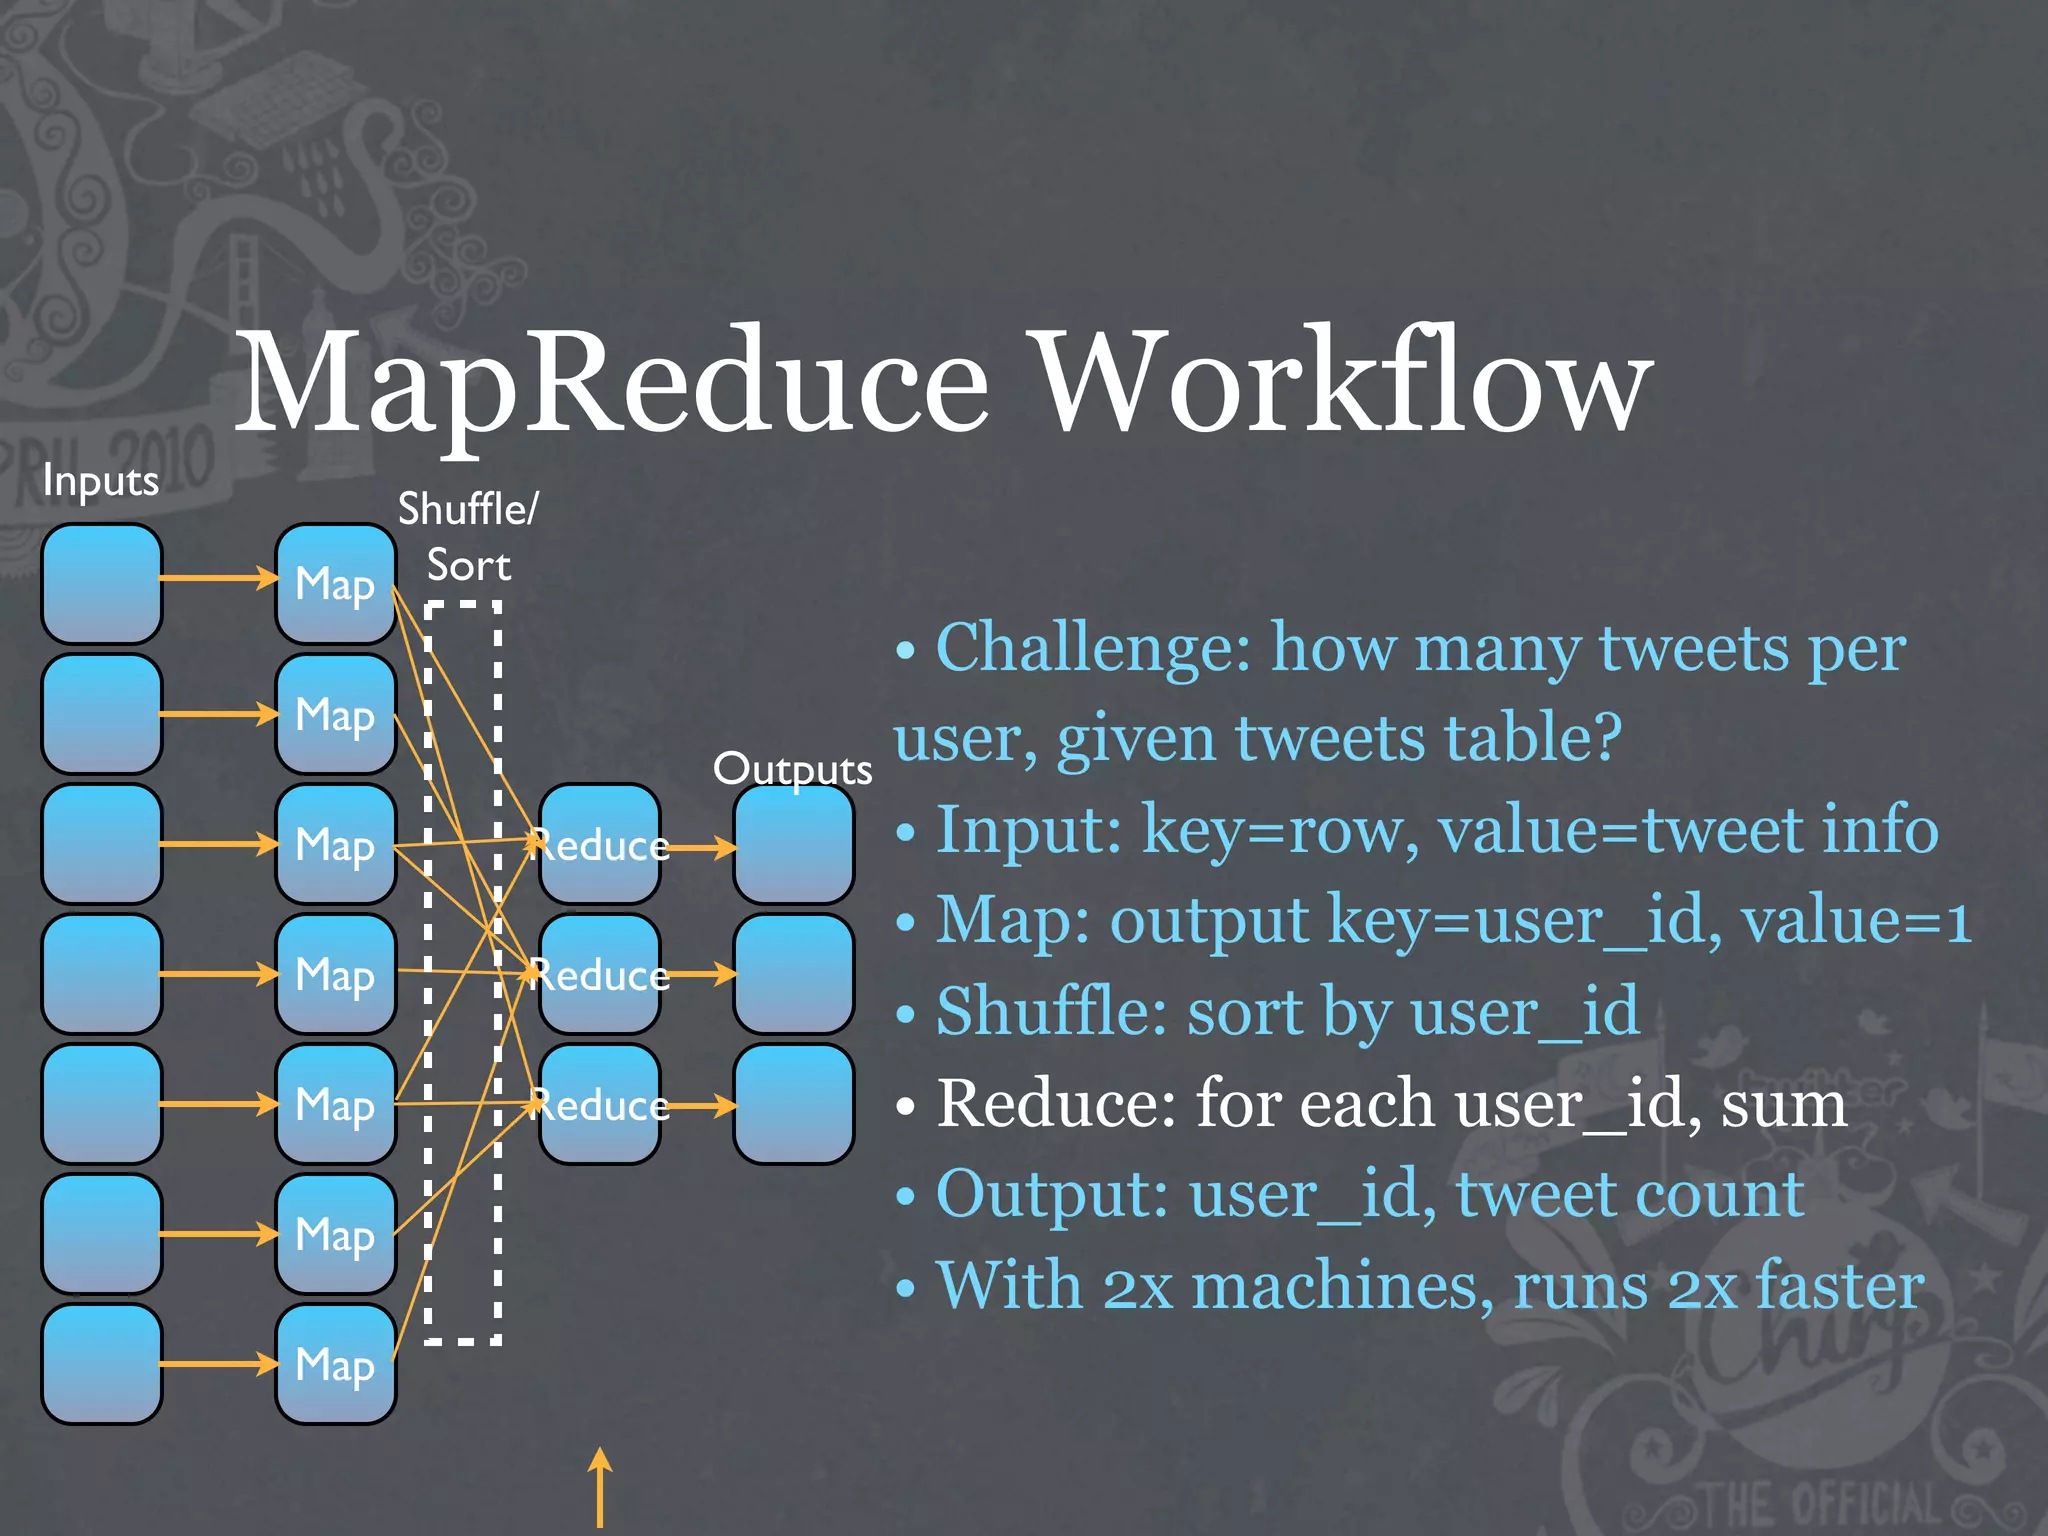
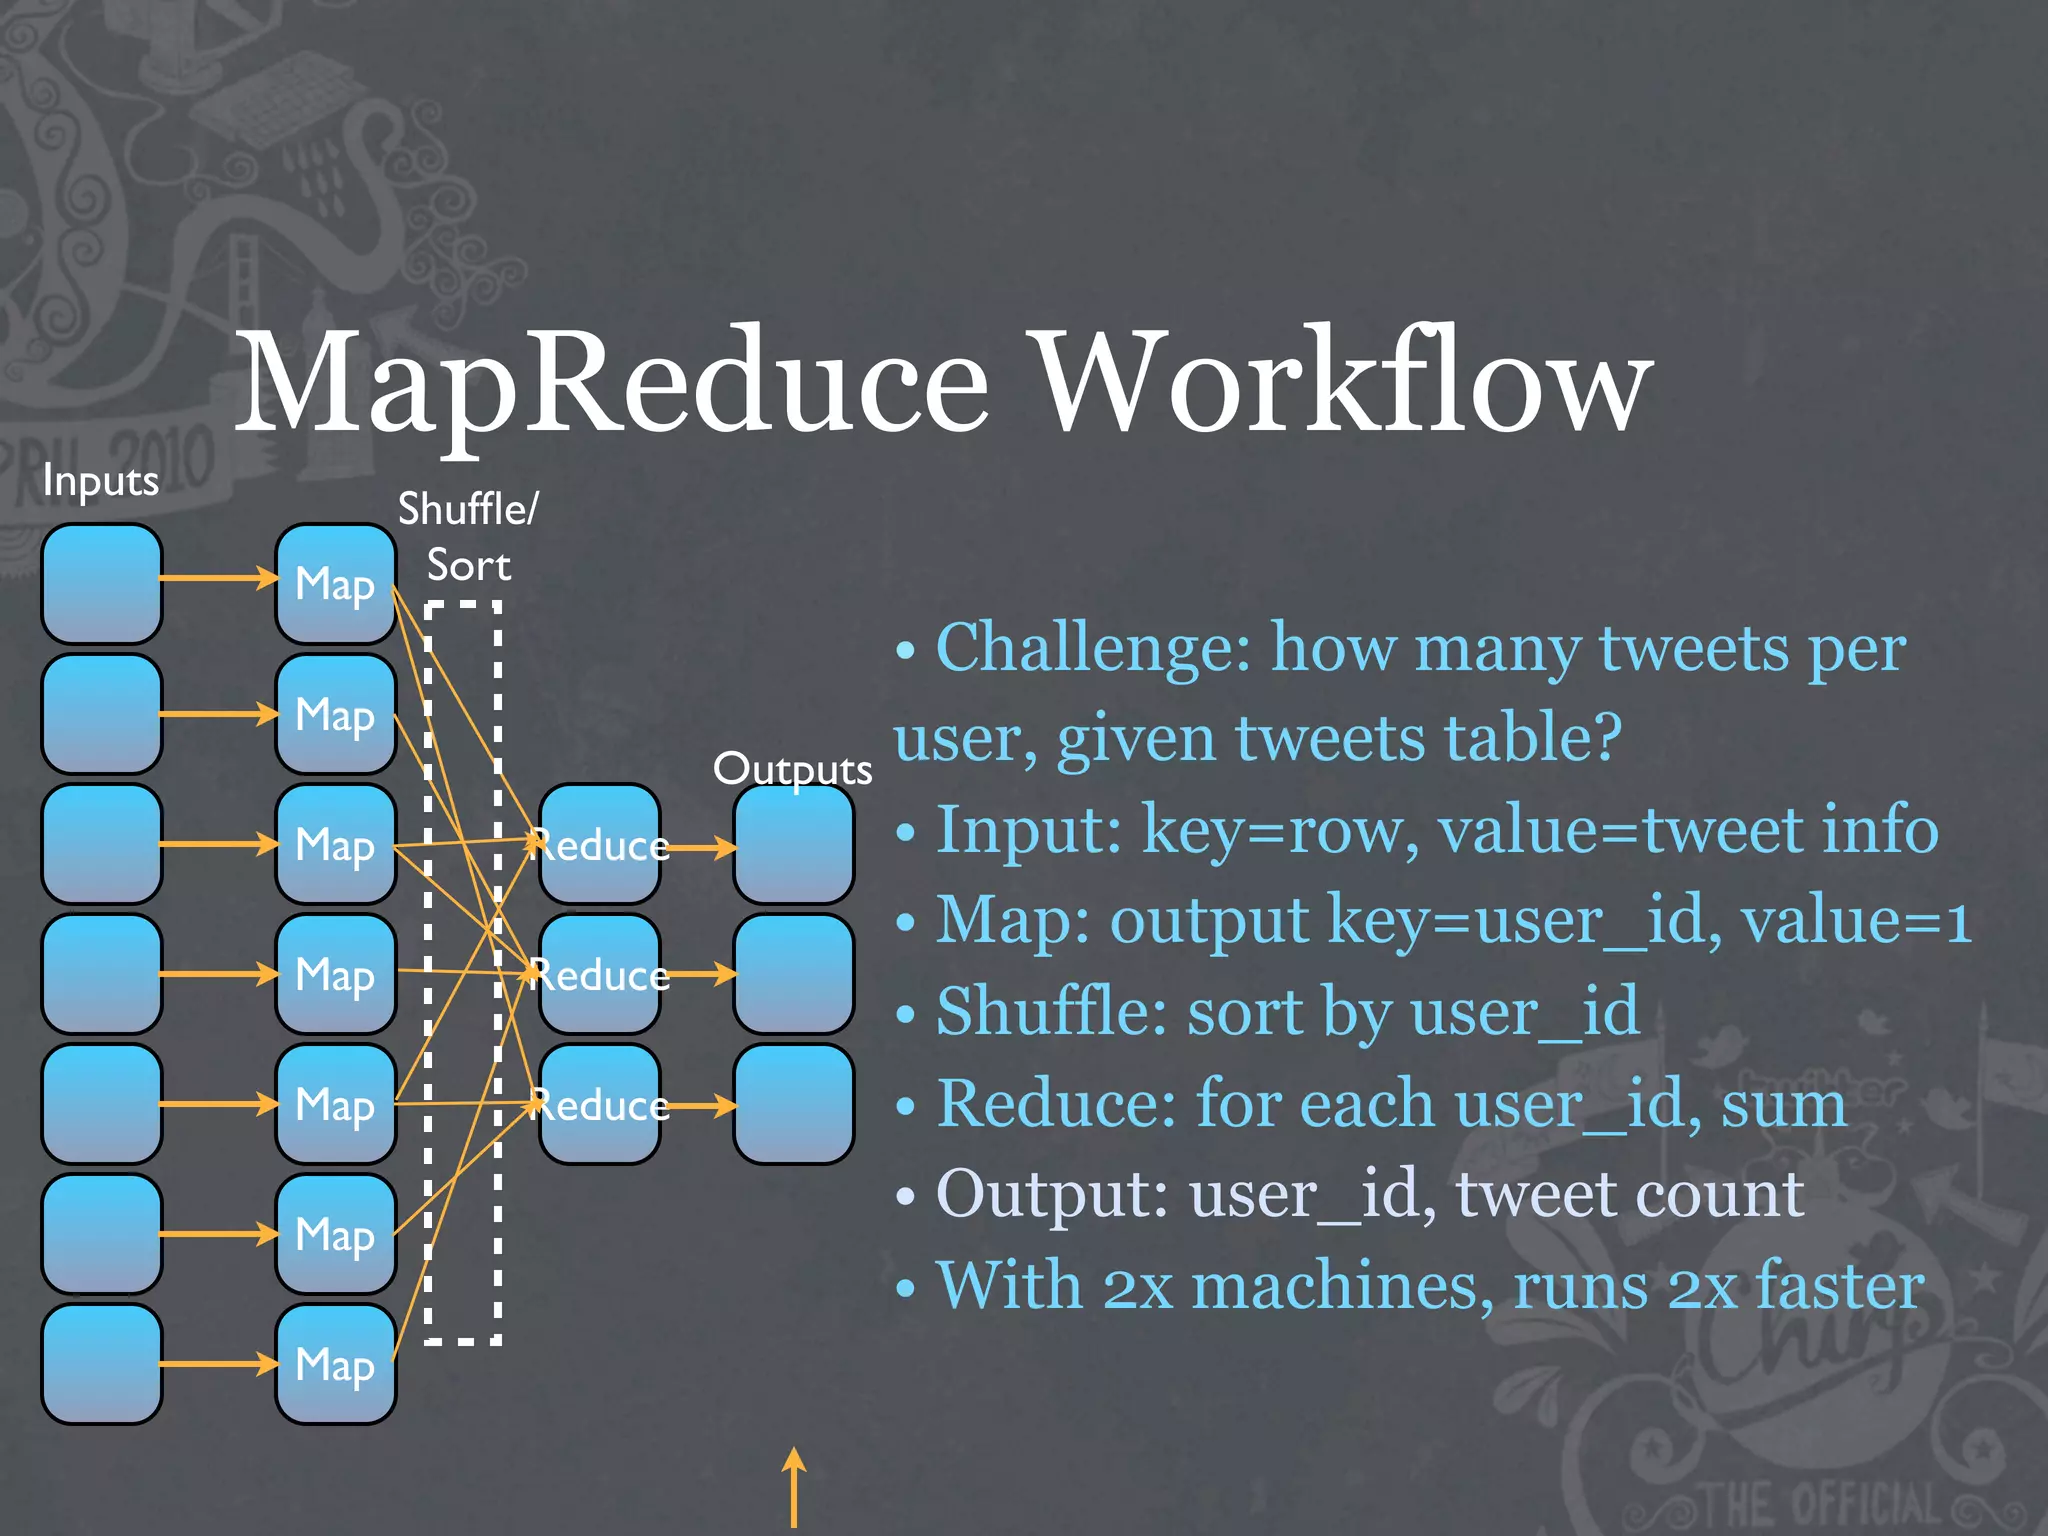


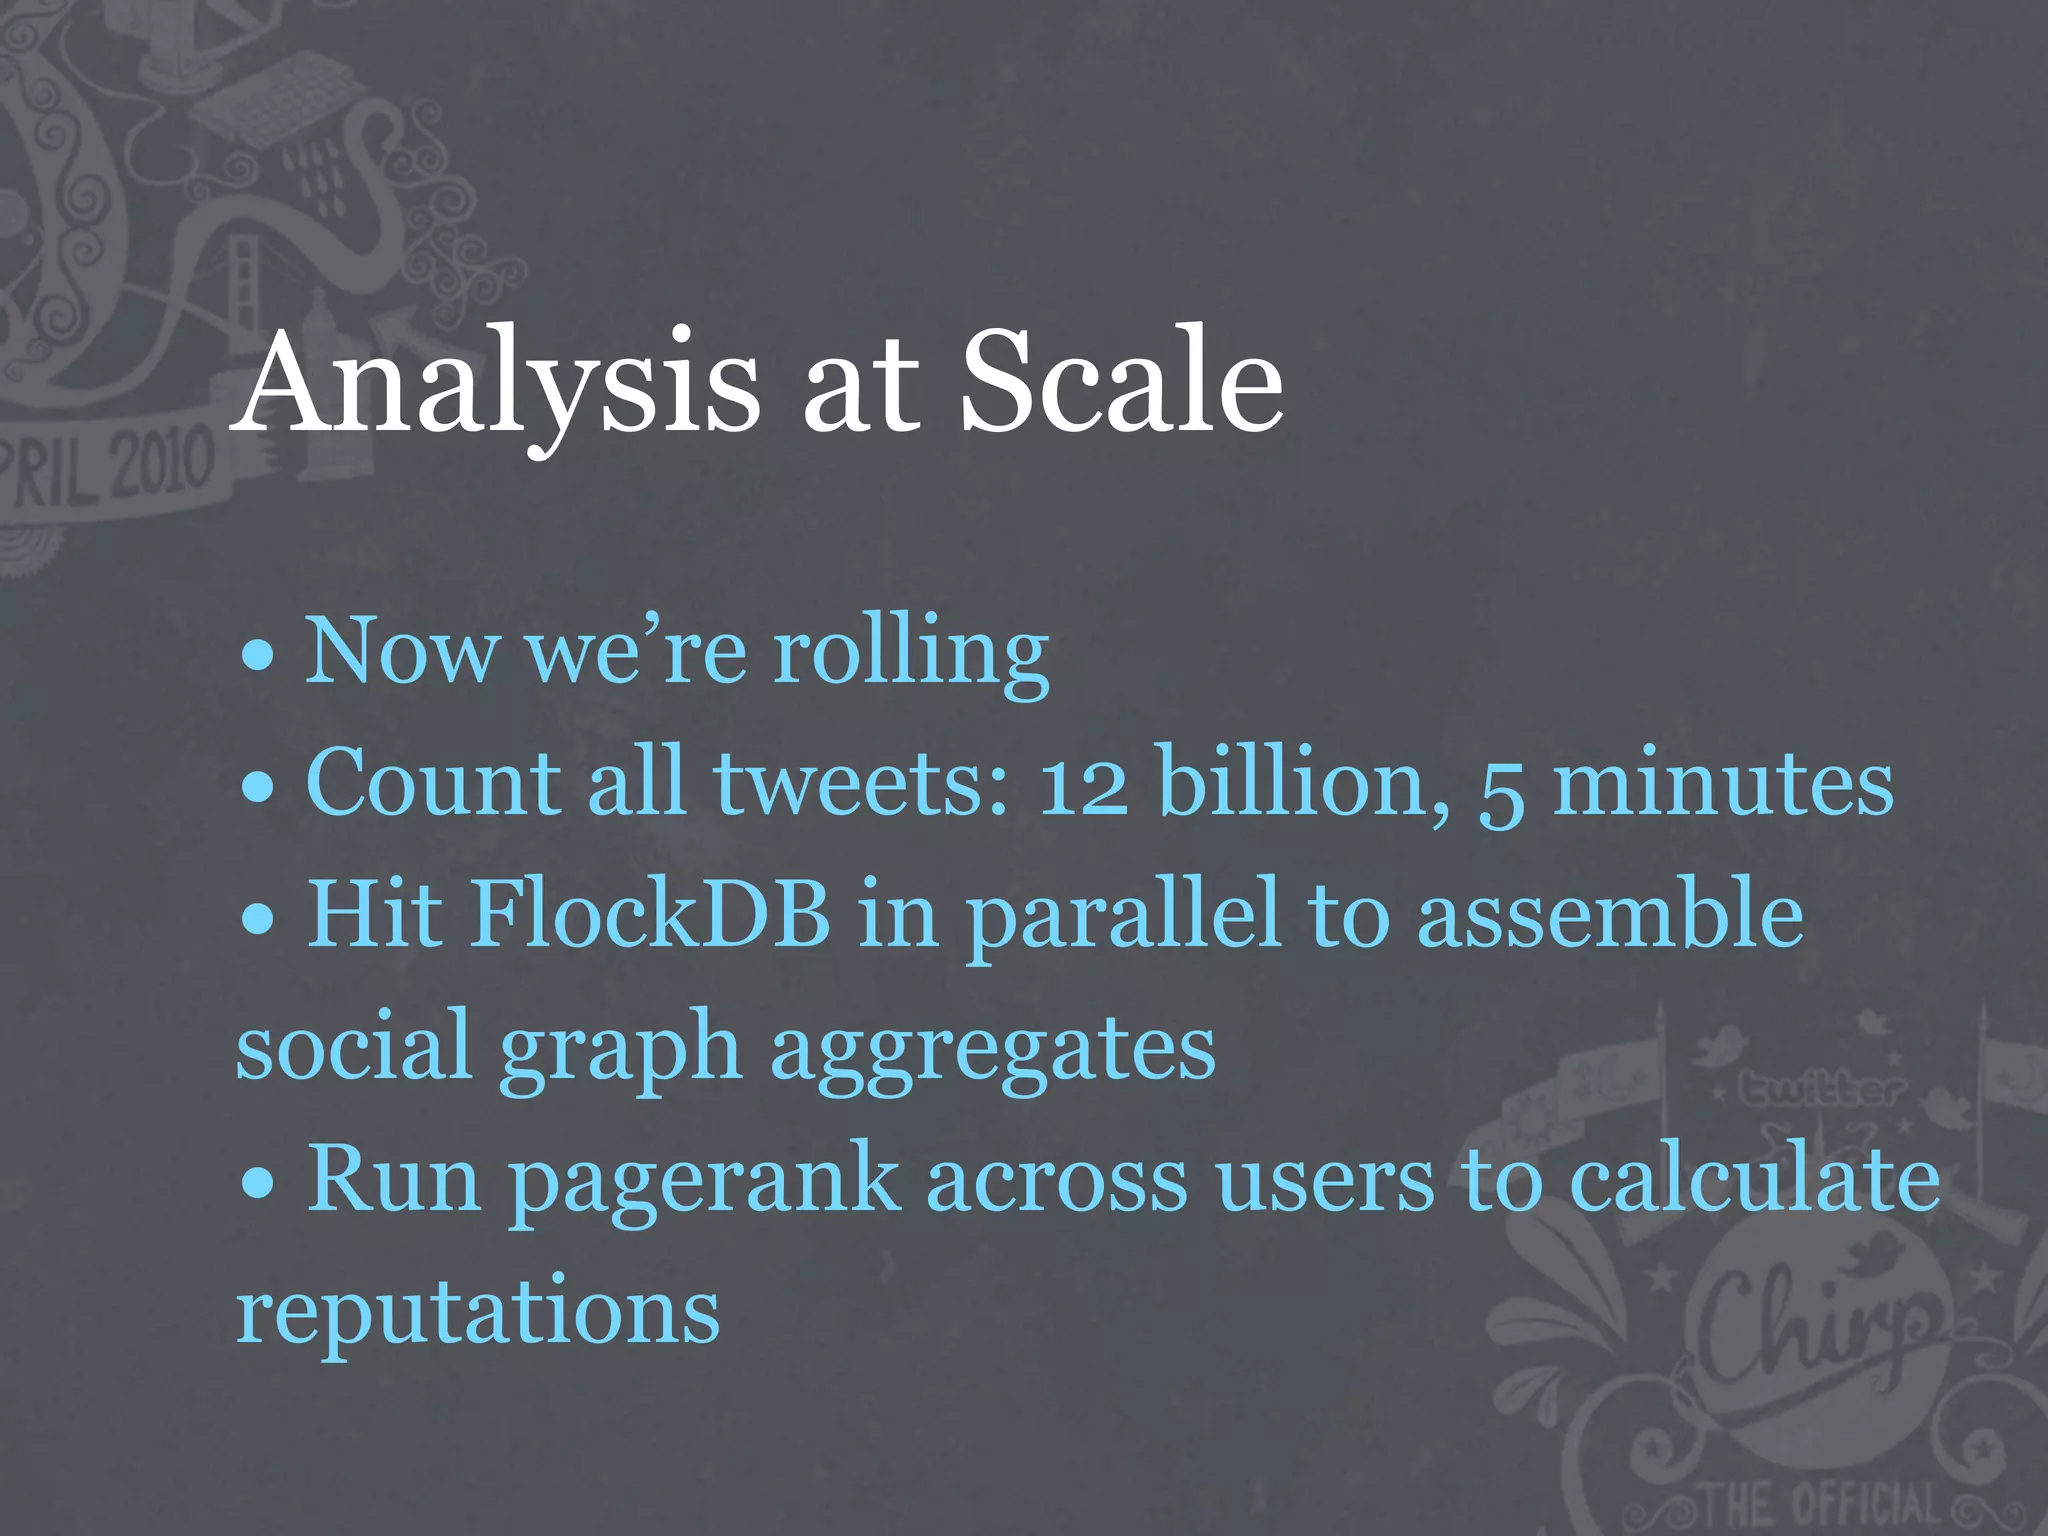
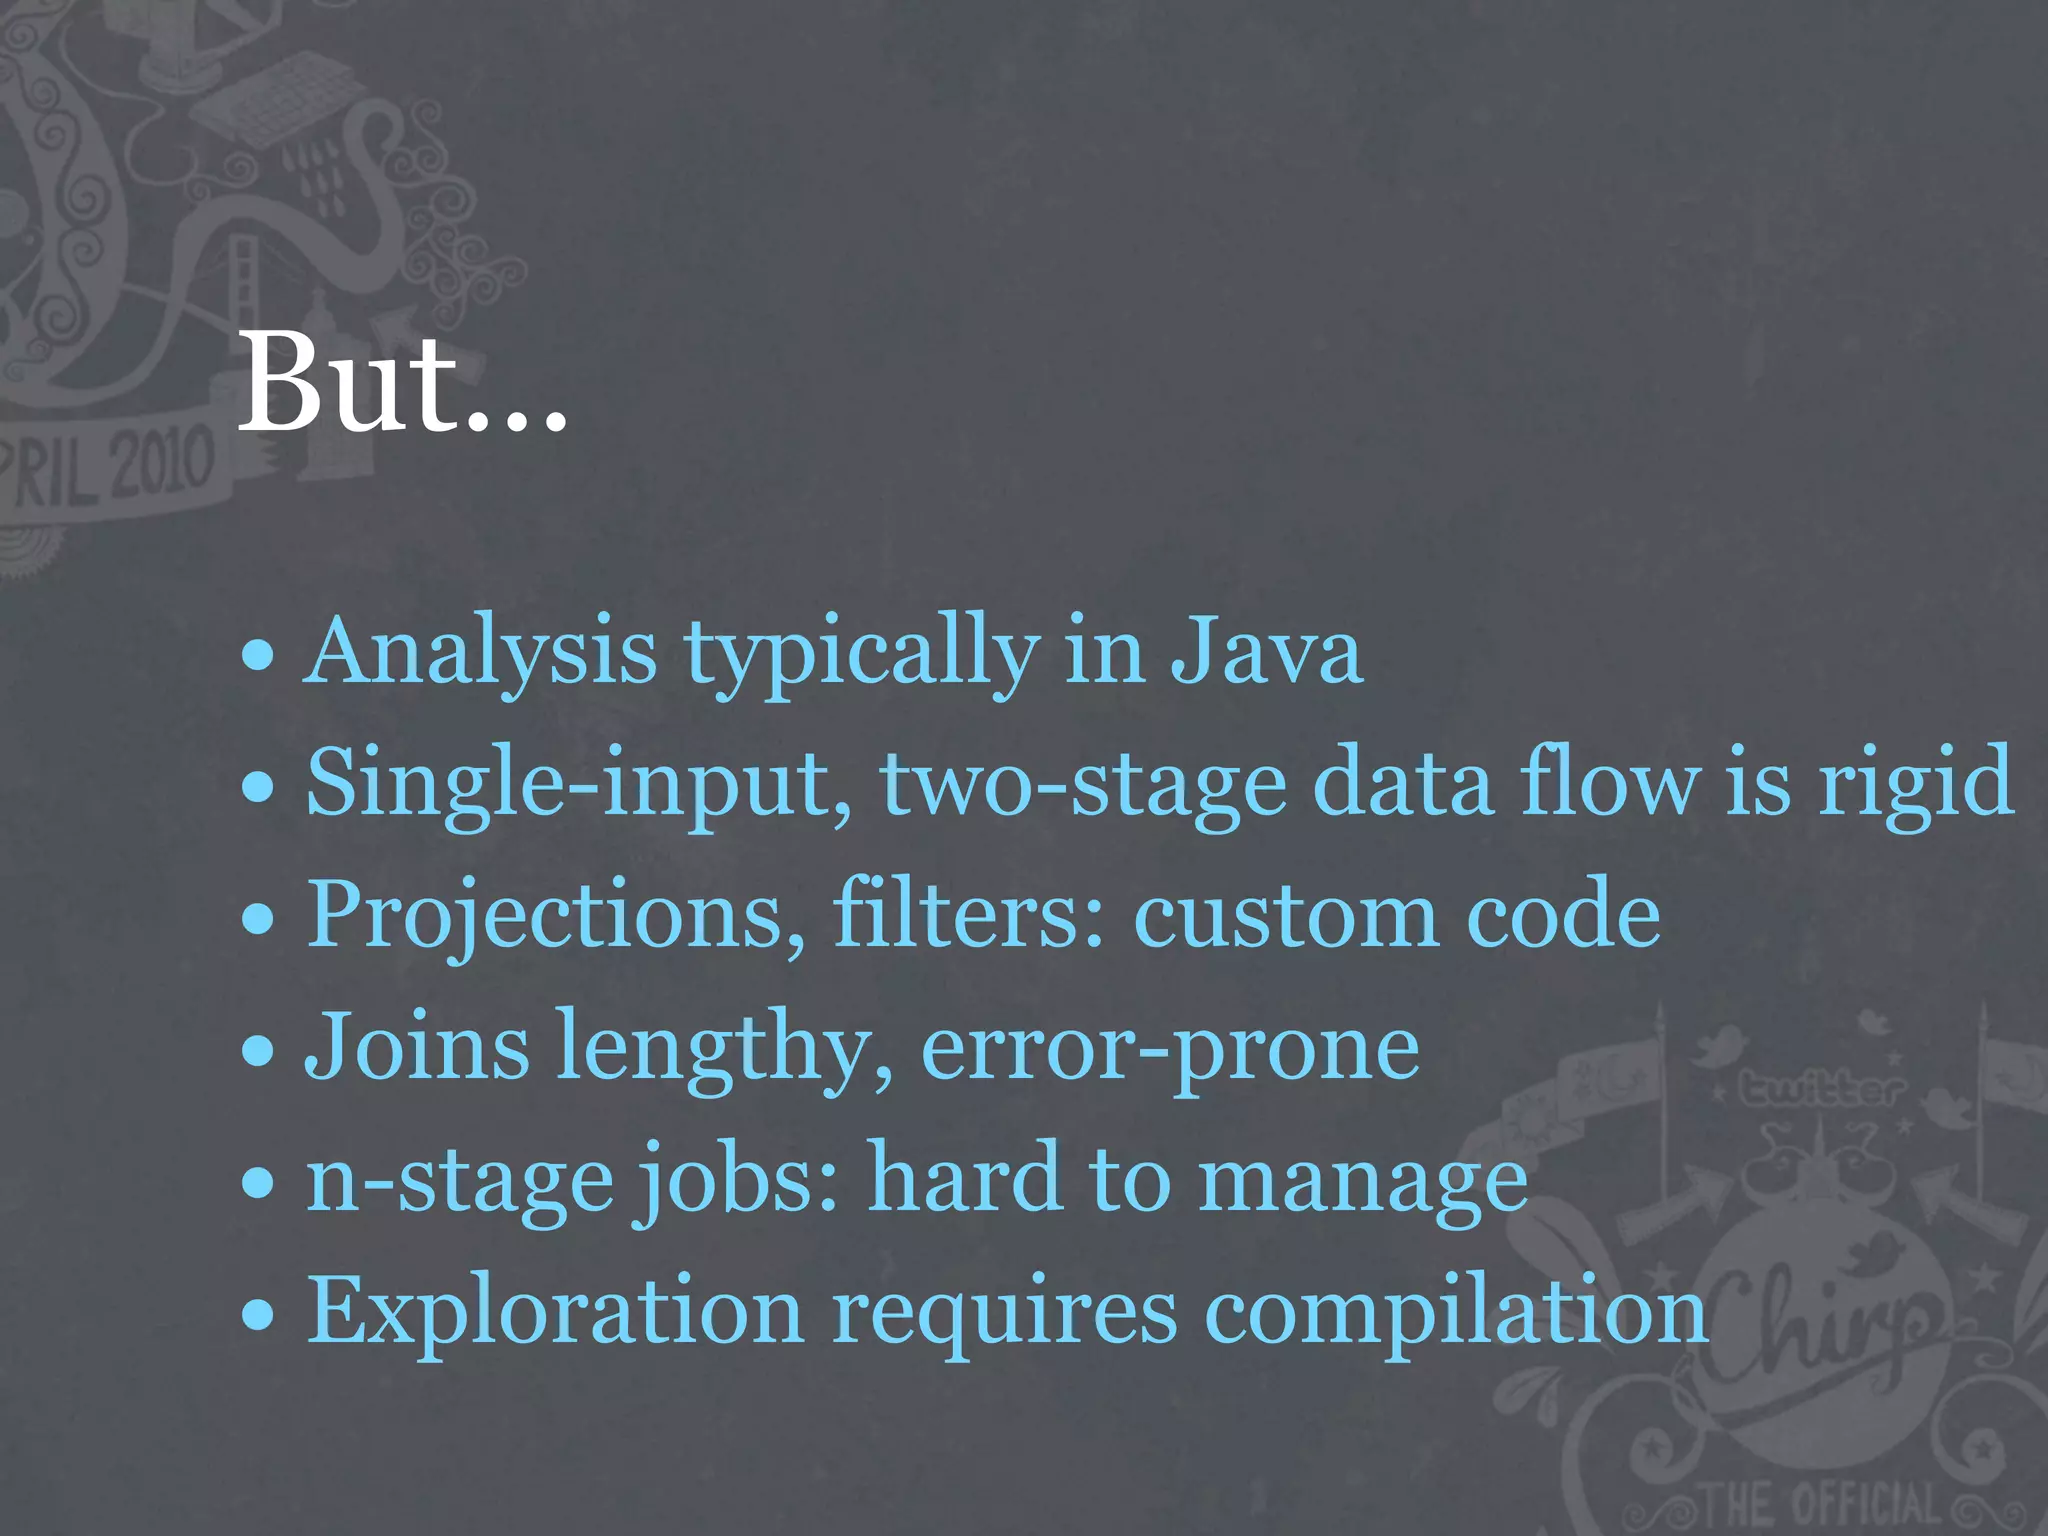
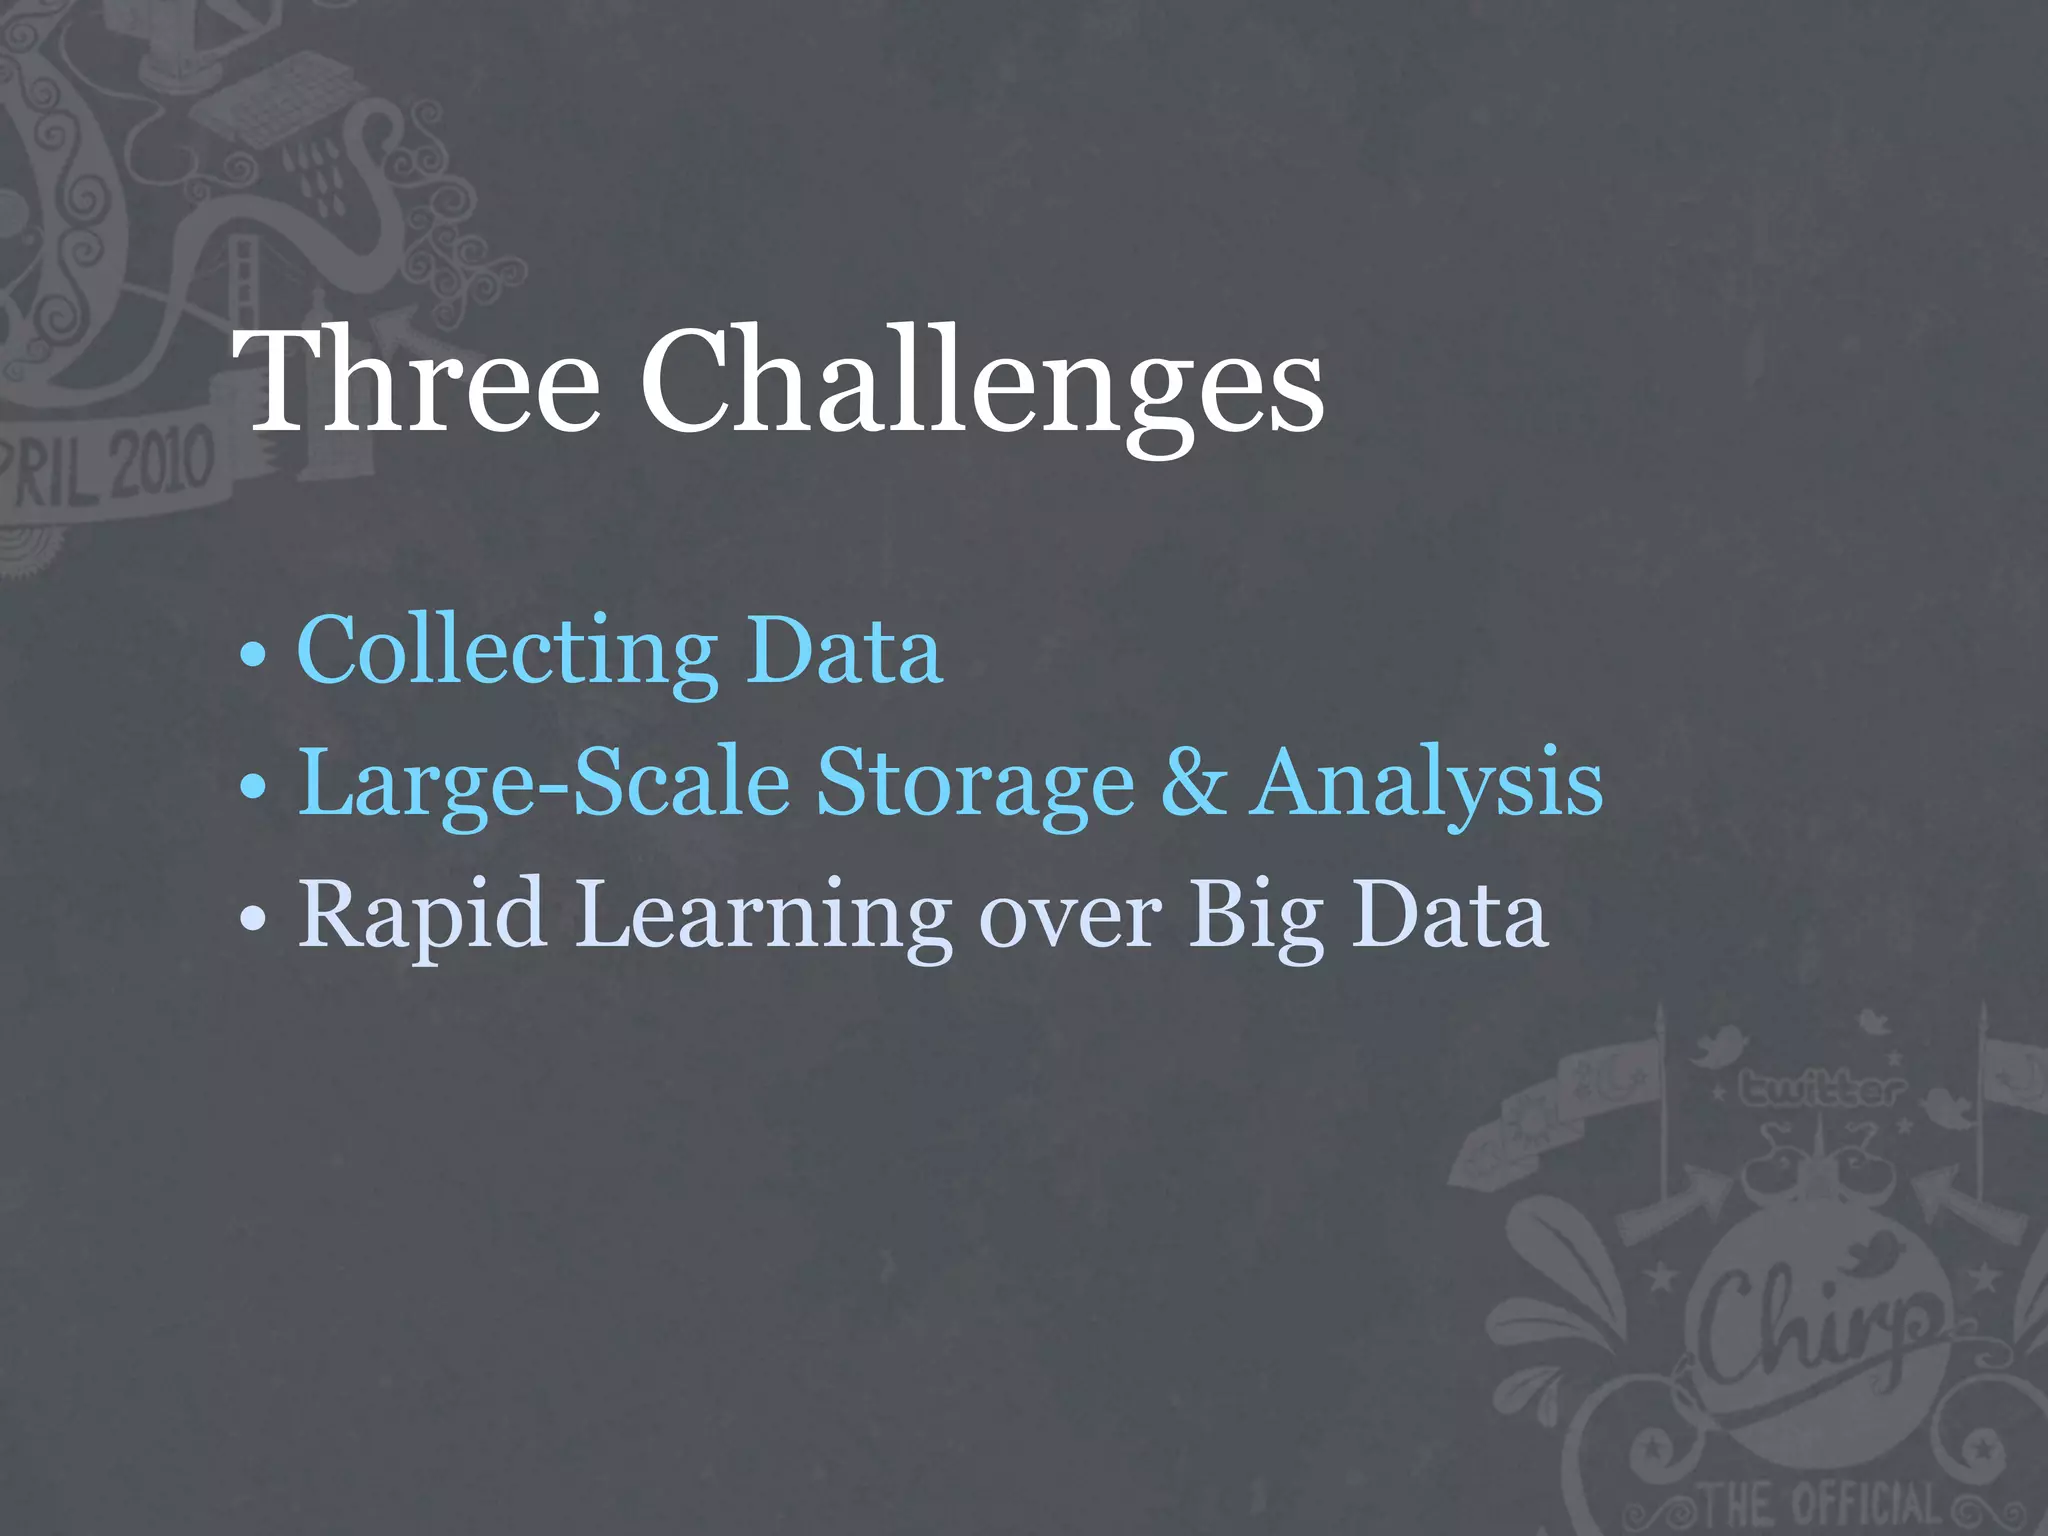


The document discusses the challenges of handling big data at Twitter, focusing on data collection, large-scale storage, and analysis, particularly emphasizing the need for infrastructure like Hadoop and Scribe for efficient processing. It highlights the scale of data generated, at 7TB per day, and the importance of using distributed systems for storing and analyzing this data. The talk also touches on various analytical challenges and solutions, including the use of tools like Pig for simplifying data transformations and facilitating analysis.