SlideShare a Scribd company logo
1 of 5
Download to read offline
propell market
               SEPTEMBER |        2008

                                                         Fundamentals Strong But
                                                        Market Responding Slowly

                                                 Hobart’s September quarter 2008 has produced the second highest
                                                 increase in house prices for the country. A whole 2.03%. Similarly, in new
                                                 home activity there were 818 building approvals which is 4.60% up on the
                                                 previous quarter. On the downside, housing finance commitments were
                                                 down 14.33% which was the largest fall across all states and territories.
                                The suggestion is that while building activity may be strong, no one’s buying anything.
                                These figures compare to a decrease nationally of 5.78% and 9.19% respectively.


                                Population growth for Hobart was 0.93% annually and there is a low rental vacancy rate of
• 818 building approvals
                                1.3%, up from 0.9% the previous quarter. Rent increases have been fairly moderate and
  for the quarter. 4.60%
                                when combined with average to low capital growth, Hobart and Tasmania in general are
  up on June 2008
                                considered to be the most affordable areas of the country. Recent house price growth has
                                not affected affordability and the latest figures show prices increasing only marginally.
• 14.33%       decrease    in
  housing          finance
                                Hobart has experienced strong labour conditions into 2008 which is reflected in the
  commitments.            The
                                unemployment rate dropping to 3.8% from 4.2% registered in June. This rate is under the
  largest decrease in the
                                national average of 4.3% and combined with increasing population growth signifies
  country
                                underlying confidence in the Tasmanian economy. A sometimes volatile Tasmanian
                                labour market, fluctuating industry outputs and a change of Government may hinder
• 2.03%        increase    in   progress however.
  house prices for quarter
  (second highest in the
                                Hobart house prices have increased
  country), 9.94% growth
                                by 2.03% for the quarter with the
  year-to-date
                                median house price for September
                                2008   sitting   at   $292,536.    This
• Hobart’s affordability is
                                represents an increase of 9.94% since
  attractive    but   buyers
                                September 2007. Hobart is one of the
  are not present in the
                                more affordable cities in Australia
  market                        and first home buyers still have
                                considerable options to enter the market. At present, the decrease in interest rates
                                nationally has not produced a noticeable stimulus. Whether this is a result of global
                                financial problems or local uncertainty is hard to say at this stage.

1300 VALUER                                                            Property Intelligence for today and tomorrow
Propell National Valuers | Residential Overview | SEPT 2008


House and unit price growth in the top 10 suburbs for the year-to-date varied from 24.5%
in Hobart City through to 10.4% in West Hobart for houses, and 18.4% in Mount Stuart to
7.4% in Lutana for units, with evidence showing that properties near the CBD and along
the banks of the Derwent River performed the best. Unit growth was subdued throughout
the year-to-date despite the low entry prices indicating that detached housing is a
preferred option in Tasmania for owners and investors alike. Well placed waterfront units
however showed good returns.
                                                                                              • Hobart           City       top
The table below illustrates the top 10 Hobart growth suburbs based on median house and
unit prices for the September quarter 2008 year-to-date.                                         performing suburb with
Top 10 Growth Suburbs                                                                            growth of 24.5% for
                                                                                                 houses        and      Mount
                                                                                                 Stuart with 18.4% for
   Suburb          Median Q3     Median%        Suburb        Median Q3       Median%
  (Houses)            2008       Change         (Units)          2008         Change
                                                                                                 units
Hobart City         $465,000       24.5       Mount Stuart     $208,000         18.4
Sandy Bay          $531,000         20.7      North Hobart     $285,000          16.7
                                                                                              • Well located waterfront
Fern Tree          $356,000         19.3      South Hobart     $281,000          16.3
                                                                                                 properties           showed
South Hobart       $374,000         19.3      West Hobart      $288,000          14.0
                                                                                                 most growth followed
Mount Stuart       $410,000         19.0      New Town         $215,000          10.7
                                                                                                 by CBD proximity
Moonah             $243,000         14.7      Sandy Bay        $363,000          10.2
Goodwood           $230,000         13.2      Hobart City      $445,000          10.2
South Hobart       $605,000         11.9      Dynnyne          $285,000           7.8
Lutana             $240,000         11.4      Goodwood         $190,000           7.4
West Hobart        $435,000         10.4      Lutana           $190,000           7.3

Source: RPData


Hobart’s house price has increased by 9.94% for the year to September, while unit price
growth has been -7.23%. This compares to South Australia(10.84% and 11.46%),
Melbourne(5.80% and 4.16%), Brisbane(3.66% and 1.73%), Darwin(12.89 and 10.34%),
Perth(-4.31% and 1.26%), Canberra(2.73% and 7.64%), and Sydney(-1.48% and -1.18%)


  Source: RPData


2|                                                                            QUARTERLY RESIDENTIAL REPORT—Hobart
Propell National Valuers | Residential Overview | SEPT 2008


                               Residential Rental Market

                               In the September quarter vacancy rates increased to 1.3%, from 0.9% in the previous
                               quarter. The average weekly rent for a two bedroom unit in Hobart is $240 per week. This
                               is an increase of 0.00% over the quarter and 4.34% for the year. The average weekly rent
                               for a three bedroom house in Hobart is $290 per week, an increase of 1.75% and 5.45%
                               year-to-date.
                               Current tenant demand for rental properties in Hobart is strong and rental rates are
                               considered the most affordable in the country. Tasmania continues to project an enigma
                               as it has a strong rental market and consistent price growth but is affected greatly by its
                               small market and population fluctuations.
                               The graph below illustrates the average residential rent growth in three bedroom houses
                               and two bedroom units in the Hobart area over the last two years.


• Vacancy rate increased
  to 1.3% for quarter


• Hobart the most afford-
                                 Source: REIT
  able rental location in
  Australia


• Yields   on   houses   at    The table below highlights median rents within the Statistical Division of Hobart for the
  5.1%, units 4.8%             September quarter 2008. These figures represent the average of all house and units
                               within the Division. The gross rental yield figure is also shown.


                                     Hobart Statistical     Sept-08       Sept-07        Qtr         Yearly         Gross
                                         Division                                     % Change         %           Rental
                                                                                                     Change        Yield %
                                 Houses                      $290          $275        1.75%         5.45%         5.1%
                                 Units                       $240          $230        0.00%         4.34%         4.8%

                                 Source: REIT
                                                                                            Suburb Sales Q1
                                                                  2007     Median Q1
                                                                   2007     Sales Q1
                                                                  2008     Median Q1
                              2008     Median % Change


3|                                                                        QUARTERLY RESIDENTIAL REPORT—Hobart
Propell National Valuers | Residential Overview | SEPT 2008


Population

As at December 2007, The Hobart Statistical Division had a population growth of 0.93%,
the lowest in the country below the Statistical Divisions of Adelaide (1.06%), and Sydney
(1.21%). This represented a total of 1,918 people or the equivalent of 36 people per week.
Tasmania as a whole grew by 0.70% or 3,419 people. The largest growth continued to
occur in the Statistical Subdivisions of Greater Hobart(0.93%), and Southern(0.80%) with
Mersey-Lyell(0.41%) having the lowest.


Net Natural Increase to December 2007 increased to 582(2.28%) from 569 compared to
September 2007. Net Overseas Migration also increased to 403(13.84%) from 354, while
there was an easing in Net Interstate Migration of 236(8.17%) from 257. Preliminary
figures suggest more people entering the state than leaving. This is a good sign for
Tasmania and it can be partly attributable to the level of affordability in the state along
with the potential for new industries and the expansion of existing industries as
international players, particularly mining set up shop in the state.


                                                                                                • Hobart           Statis tical
Tasmania’s Gross State Product for the year to December 2007 was 2.1% (below the
average of 2.7%), with a State Final Demand growth of –0.7%. This contributed to Total             Division has population
Domestic Demand by 0.0%.
                                                                                                   increase of 0.93%

As at September 2008, there were 226,600 people employed from a total labour force of
                                                                                                • Net interstate migration
241,700. This was an increase of 0.9%. Of the people employed, 154,600 were full-time
employees while 67,400 were part-time employees. The unemployment rate was 3.8%                    eases slightly
down from 4.2%. This is the lowest level of unemployment in Tasmania since recorded
data in 1978. The participation rate slowed however from 60.9% to 60.3%.
                                                                                                • Unemployment rate of
                                                                                                   3.8%      the     lowest        in
Tasmania’s primary growth industries are Manufacturing, Finance and Insurance,
                                                                                                   recorded        history     for
Agriculture, Forestry and Fishing. The construction industry is also a major force in
Tasmania and has recorded a steady increase in the number of people employed over the
                                                                                                   Tasmania
last 5 years. In 2006-2007 there were 16,500 people working in the construction industry
in Tasmania. This represented an increase of 3.8% on 2005-2006 and 36.4% on 2002-2003.
In 2006-2007 the construction industry employed 7.4% of the state’s total employed
personnel.


4|                                                                              QUARTERLY RESIDENTIAL REPORT—Hobart
Propell National Valuers | Residential Overview | SEPT 2008


                                                                 Major Projects
                                                                 The 2008-2009 Tasmanian budget has been balanced between investment in Capital
                                                                 Works infrastructure and social and economic concerns including:


                                                                        Infrastructure
                                                                                      $626.8 million for roads, bus-ways and other transport systems
                                                                                      $492.8 million for hospital and other health facilities
                                                                                      $80 million for drought proofing Tasmania
                                                                                      $135 million for new and existing schools
                                                                        Families
                                                                                      $34.8 million to improve literacy and numeracy skills
                                                                                      $99 million to support public housing
                                                                                      $80 million for reforms in Family Services
                                                                        Environment
                                                                                      $5.7 million for climate change programs
                                                                                      $12 million for urban renewal and built heritage
                                                                                      $12 million for saving the Tasmanian Devil
 • Over                $626             million                         Business
      outlined for roads, bus-                                                        $65 million for additional tax cuts
      ways                and             other                                       $10 million for workforce participation programs
      transport infrastructure                                                        $7.2 million for improving job skills and new training programs


 • The 2008-09 Budget is a                                                                                                                                     FOR MORE INFORMATION
                                                            Summary                                                                                                  CONTACT
      balanced               social           and
      economic budget
                                                                                                                                                          Aaron Parker
                                                                                                                                                          Research Manager
                                                             Another mixed quarter for Hobart with house prices
                                                             increasing slightly along with building approvals,
                                                             while unit prices decreased along with housing
                                                                                                                                                          Phone: 07 5443 2322
                                                             finance. Again, unemployment improved indicating
                                                                                                                                                          Fax:          07 5443 8039
                                                             the underlying strength and growth in the economy,
                                                                                                                                                          E-mail: aparker@propellvaluers.com
                                                             while rental rates tapered off. As usual, Hobart and
                                                             Tasmania in general provides conflicting data for first
                                                             home buyers and investors yet it still remains the
                                                             most affordable state in the country. New stock
                                                             coming on to the market from building activity will
                                                             impact house prices negatively in the current climate
                                                                                                                                                                               OR CALL
                                                             unless more incentive is given to first home buyers.
                                                             Interest rate reductions have not created the stimulus
                                                                                                                                                                         1300 VALUER
                                                             needed up to this point, nor has new industry created
                                                                                                                                                                        (1300 825 837)
                                                             migration incentive.


Propell National Values does not give any warranty in relation to the accuracy of the information contained in this report. If you intend to rely upon the information
contained herein, you must take note that the information, figures and projections have been provided by various sources and have not been verified by us. Whilst all
care has been taken in the preparation of this report, we have no belief one-way or the other in relation to the accuracy of such information, figures and projections
contained herein. Propell National Valuers will not be liable for any loss or damage resulting from any statement, figure, projection or any other information that you rely
upon that is contained in the material. COPYRIGHT - Propell National Valuers 2008


 5|                                                                                                                              QUARTERLY RESIDENTIAL REPORT—Hobart

More Related Content

What's hot

The Nest Report Q2 2012
The Nest Report Q2 2012The Nest Report Q2 2012
The Nest Report Q2 2012Jeremy Hart
 
Presentation Why Buy It Community Card Program Overview 9.8.2010
Presentation  Why Buy It  Community Card Program Overview 9.8.2010Presentation  Why Buy It  Community Card Program Overview 9.8.2010
Presentation Why Buy It Community Card Program Overview 9.8.2010amywalkercherry
 
Honeywell Q4 2008 Earnings Conference Call Presentation
Honeywell Q4 2008 Earnings Conference Call PresentationHoneywell Q4 2008 Earnings Conference Call Presentation
Honeywell Q4 2008 Earnings Conference Call Presentationfinance8
 
April Market Watch
April Market WatchApril Market Watch
April Market WatchLarrySage
 
Toronto real estate statistics january 2011
Toronto real estate statistics january 2011Toronto real estate statistics january 2011
Toronto real estate statistics january 2011John Helfrich
 
Greater Boston Real Estate Market Data, September 2012
Greater Boston Real Estate Market Data, September 2012Greater Boston Real Estate Market Data, September 2012
Greater Boston Real Estate Market Data, September 2012Unit Realty Group
 
Rebgv stats-pkg-march-2019
Rebgv stats-pkg-march-2019Rebgv stats-pkg-march-2019
Rebgv stats-pkg-march-2019Kathryn Huang
 

What's hot (9)

MARKET WATCH FOR JUNE 2010
MARKET WATCH FOR JUNE 2010MARKET WATCH FOR JUNE 2010
MARKET WATCH FOR JUNE 2010
 
The Nest Report Q2 2012
The Nest Report Q2 2012The Nest Report Q2 2012
The Nest Report Q2 2012
 
Gt2011
Gt2011Gt2011
Gt2011
 
Presentation Why Buy It Community Card Program Overview 9.8.2010
Presentation  Why Buy It  Community Card Program Overview 9.8.2010Presentation  Why Buy It  Community Card Program Overview 9.8.2010
Presentation Why Buy It Community Card Program Overview 9.8.2010
 
Honeywell Q4 2008 Earnings Conference Call Presentation
Honeywell Q4 2008 Earnings Conference Call PresentationHoneywell Q4 2008 Earnings Conference Call Presentation
Honeywell Q4 2008 Earnings Conference Call Presentation
 
April Market Watch
April Market WatchApril Market Watch
April Market Watch
 
Toronto real estate statistics january 2011
Toronto real estate statistics january 2011Toronto real estate statistics january 2011
Toronto real estate statistics january 2011
 
Greater Boston Real Estate Market Data, September 2012
Greater Boston Real Estate Market Data, September 2012Greater Boston Real Estate Market Data, September 2012
Greater Boston Real Estate Market Data, September 2012
 
Rebgv stats-pkg-march-2019
Rebgv stats-pkg-march-2019Rebgv stats-pkg-march-2019
Rebgv stats-pkg-march-2019
 

Viewers also liked

NSW Market View Q32008 Email Version1
NSW Market View Q32008 Email Version1NSW Market View Q32008 Email Version1
NSW Market View Q32008 Email Version1Property News
 
Album de fotografias
Album de fotografiasAlbum de fotografias
Album de fotografiasguestdfb4c
 
Design Specs Upload
Design Specs UploadDesign Specs Upload
Design Specs UploadSatyajit Das
 
Lessons brands can learn from “AAP”
Lessons brands can learn from “AAP”Lessons brands can learn from “AAP”
Lessons brands can learn from “AAP”Troika Consulting
 
2014 Labor Characteristics Report: Warehouse & Distribution
2014 Labor Characteristics Report: Warehouse & Distribution2014 Labor Characteristics Report: Warehouse & Distribution
2014 Labor Characteristics Report: Warehouse & DistributionGreater Burlington Partnership
 
ITU - Social software: 14 Proces
ITU - Social software: 14 ProcesITU - Social software: 14 Proces
ITU - Social software: 14 ProcesMorten Gade
 
ITU - Social software: 01 Introduktion
ITU - Social software: 01 IntroduktionITU - Social software: 01 Introduktion
ITU - Social software: 01 IntroduktionMorten Gade
 
The TEA group application
The TEA group applicationThe TEA group application
The TEA group applicationOceanrose
 
Fremtiden, internettet og alt det der
Fremtiden, internettet og alt det derFremtiden, internettet og alt det der
Fremtiden, internettet og alt det derMorten Gade
 
Species Pages Slide Show
Species Pages Slide ShowSpecies Pages Slide Show
Species Pages Slide Showtbarbaro
 
Maßgeschneidertes Corporate Design
Maßgeschneidertes Corporate DesignMaßgeschneidertes Corporate Design
Maßgeschneidertes Corporate DesignClaudia Vlach
 
Accelerate Native Advertising Using Rich Media On Social
Accelerate Native Advertising Using Rich Media On SocialAccelerate Native Advertising Using Rich Media On Social
Accelerate Native Advertising Using Rich Media On SocialClosed
 
Wild Apricot Client Survey December 2008
Wild Apricot Client Survey December 2008Wild Apricot Client Survey December 2008
Wild Apricot Client Survey December 2008Wild Apricot
 

Viewers also liked (20)

NSW Market View Q32008 Email Version1
NSW Market View Q32008 Email Version1NSW Market View Q32008 Email Version1
NSW Market View Q32008 Email Version1
 
Album de fotografias
Album de fotografiasAlbum de fotografias
Album de fotografias
 
Visiebundel
VisiebundelVisiebundel
Visiebundel
 
Design Specs Upload
Design Specs UploadDesign Specs Upload
Design Specs Upload
 
Canberra Sept 2008
Canberra Sept 2008Canberra Sept 2008
Canberra Sept 2008
 
Lessons brands can learn from “AAP”
Lessons brands can learn from “AAP”Lessons brands can learn from “AAP”
Lessons brands can learn from “AAP”
 
2014 Labor Characteristics Report: Warehouse & Distribution
2014 Labor Characteristics Report: Warehouse & Distribution2014 Labor Characteristics Report: Warehouse & Distribution
2014 Labor Characteristics Report: Warehouse & Distribution
 
ITU - Social software: 14 Proces
ITU - Social software: 14 ProcesITU - Social software: 14 Proces
ITU - Social software: 14 Proces
 
ITU - Social software: 01 Introduktion
ITU - Social software: 01 IntroduktionITU - Social software: 01 Introduktion
ITU - Social software: 01 Introduktion
 
The TEA group application
The TEA group applicationThe TEA group application
The TEA group application
 
Fremtiden, internettet og alt det der
Fremtiden, internettet og alt det derFremtiden, internettet og alt det der
Fremtiden, internettet og alt det der
 
Business Plan Rev
Business Plan   RevBusiness Plan   Rev
Business Plan Rev
 
Species Pages Slide Show
Species Pages Slide ShowSpecies Pages Slide Show
Species Pages Slide Show
 
Labellezaazul
LabellezaazulLabellezaazul
Labellezaazul
 
Maßgeschneidertes Corporate Design
Maßgeschneidertes Corporate DesignMaßgeschneidertes Corporate Design
Maßgeschneidertes Corporate Design
 
2014 Housing Presentation
2014 Housing Presentation2014 Housing Presentation
2014 Housing Presentation
 
Accelerate Native Advertising Using Rich Media On Social
Accelerate Native Advertising Using Rich Media On SocialAccelerate Native Advertising Using Rich Media On Social
Accelerate Native Advertising Using Rich Media On Social
 
Content marketing
Content marketingContent marketing
Content marketing
 
Wild Apricot Client Survey December 2008
Wild Apricot Client Survey December 2008Wild Apricot Client Survey December 2008
Wild Apricot Client Survey December 2008
 
Adelaide Sept 2008
Adelaide Sept 2008Adelaide Sept 2008
Adelaide Sept 2008
 

Similar to Hobart Sept 2008

Toronto Market Trends
Toronto Market TrendsToronto Market Trends
Toronto Market TrendsLarrySage
 
February 2010 Toronto Mls Market Watch
February 2010 Toronto Mls Market WatchFebruary 2010 Toronto Mls Market Watch
February 2010 Toronto Mls Market WatchSteven Silva
 
WA Market View Q3 2008
WA Market View Q3 2008WA Market View Q3 2008
WA Market View Q3 2008Property News
 
Toronto Real Estate Market Watch Nov 09
Toronto Real Estate Market Watch Nov 09Toronto Real Estate Market Watch Nov 09
Toronto Real Estate Market Watch Nov 09Joseph Bitton
 
Toronto housing stats market watch all neighbourhoods dec. 2010
Toronto housing stats market watch all neighbourhoods dec. 2010Toronto housing stats market watch all neighbourhoods dec. 2010
Toronto housing stats market watch all neighbourhoods dec. 2010James Metcalfe
 
Market watch december 2010
Market watch december 2010Market watch december 2010
Market watch december 2010Jennifer Backus
 
Market Watch December 2010 Toronto Homes Resale Statistics
Market Watch December 2010 Toronto Homes Resale StatisticsMarket Watch December 2010 Toronto Homes Resale Statistics
Market Watch December 2010 Toronto Homes Resale StatisticsJohn Helfrich
 
TREB Market Watch December 2010
TREB Market Watch December 2010TREB Market Watch December 2010
TREB Market Watch December 2010Harish Maraj
 
MRIS Virginia 2009 Mid-Year Trends Report
MRIS Virginia 2009 Mid-Year Trends ReportMRIS Virginia 2009 Mid-Year Trends Report
MRIS Virginia 2009 Mid-Year Trends ReportMatthew Rathbun
 
Toronto real estate statistics june 2011
Toronto real estate statistics june 2011Toronto real estate statistics june 2011
Toronto real estate statistics june 2011John Helfrich
 
Toronto Real Estate Stats December 2009
Toronto Real Estate Stats December 2009Toronto Real Estate Stats December 2009
Toronto Real Estate Stats December 2009John Helfrich
 
Remax Market Outlook 2010
Remax Market Outlook 2010 Remax Market Outlook 2010
Remax Market Outlook 2010 loriewarren
 
Toronto real estate statistics april 2011
Toronto real estate statistics april 2011Toronto real estate statistics april 2011
Toronto real estate statistics april 2011John Helfrich
 
Toronto real estate statistics july 2010
Toronto real estate statistics july 2010Toronto real estate statistics july 2010
Toronto real estate statistics july 2010John Helfrich
 
Market Watch July 2010
Market Watch July 2010Market Watch July 2010
Market Watch July 2010Derek Cardona
 

Similar to Hobart Sept 2008 (20)

Melbourne Sept 2008
Melbourne Sept 2008Melbourne Sept 2008
Melbourne Sept 2008
 
Darwin Sept 2008
Darwin Sept 2008Darwin Sept 2008
Darwin Sept 2008
 
Toronto Market Trends
Toronto Market TrendsToronto Market Trends
Toronto Market Trends
 
February 2010 Toronto Mls Market Watch
February 2010 Toronto Mls Market WatchFebruary 2010 Toronto Mls Market Watch
February 2010 Toronto Mls Market Watch
 
WA Market View Q3 2008
WA Market View Q3 2008WA Market View Q3 2008
WA Market View Q3 2008
 
Toronto Real Estate Market Watch Nov 09
Toronto Real Estate Market Watch Nov 09Toronto Real Estate Market Watch Nov 09
Toronto Real Estate Market Watch Nov 09
 
Toronto housing stats market watch all neighbourhoods dec. 2010
Toronto housing stats market watch all neighbourhoods dec. 2010Toronto housing stats market watch all neighbourhoods dec. 2010
Toronto housing stats market watch all neighbourhoods dec. 2010
 
Market watch december 2010
Market watch december 2010Market watch december 2010
Market watch december 2010
 
Market Watch December 2010 Toronto Homes Resale Statistics
Market Watch December 2010 Toronto Homes Resale StatisticsMarket Watch December 2010 Toronto Homes Resale Statistics
Market Watch December 2010 Toronto Homes Resale Statistics
 
TREB Market Watch December 2010
TREB Market Watch December 2010TREB Market Watch December 2010
TREB Market Watch December 2010
 
MRIS Virginia 2009 Mid-Year Trends Report
MRIS Virginia 2009 Mid-Year Trends ReportMRIS Virginia 2009 Mid-Year Trends Report
MRIS Virginia 2009 Mid-Year Trends Report
 
Toronto real estate statistics june 2011
Toronto real estate statistics june 2011Toronto real estate statistics june 2011
Toronto real estate statistics june 2011
 
Toronto Real Estate Stats December 2009
Toronto Real Estate Stats December 2009Toronto Real Estate Stats December 2009
Toronto Real Estate Stats December 2009
 
Remax Market Outlook 2010
Remax Market Outlook 2010 Remax Market Outlook 2010
Remax Market Outlook 2010
 
Toronto real estate statistics april 2011
Toronto real estate statistics april 2011Toronto real estate statistics april 2011
Toronto real estate statistics april 2011
 
Market Watch April 2011
Market Watch April 2011Market Watch April 2011
Market Watch April 2011
 
Toronto real estate statistics july 2010
Toronto real estate statistics july 2010Toronto real estate statistics july 2010
Toronto real estate statistics july 2010
 
Mw1007 pdf
Mw1007 pdfMw1007 pdf
Mw1007 pdf
 
Toronto Real Estate Market Watch July 2010
Toronto Real Estate Market Watch July 2010Toronto Real Estate Market Watch July 2010
Toronto Real Estate Market Watch July 2010
 
Market Watch July 2010
Market Watch July 2010Market Watch July 2010
Market Watch July 2010
 

More from Property News

February 2009 Month In Review
February 2009 Month In ReviewFebruary 2009 Month In Review
February 2009 Month In ReviewProperty News
 
Flyover Lilyfield Nsw
Flyover Lilyfield NswFlyover Lilyfield Nsw
Flyover Lilyfield NswProperty News
 
Flyover Kyeemagh Nsw
Flyover Kyeemagh NswFlyover Kyeemagh Nsw
Flyover Kyeemagh NswProperty News
 
Flyover Beenleigh Qld
Flyover Beenleigh QldFlyover Beenleigh Qld
Flyover Beenleigh QldProperty News
 
Act Market View Q3 2008
Act Market View Q3 2008Act Market View Q3 2008
Act Market View Q3 2008Property News
 
808 Qld Resi View Brisbane Northern Link Tunnel Report
808 Qld Resi View Brisbane Northern Link Tunnel Report808 Qld Resi View Brisbane Northern Link Tunnel Report
808 Qld Resi View Brisbane Northern Link Tunnel ReportProperty News
 
1008 Nsw Resi Suburb View Newcastle
1008 Nsw Resi Suburb View Newcastle1008 Nsw Resi Suburb View Newcastle
1008 Nsw Resi Suburb View NewcastleProperty News
 
June Qld Resi Suburb View Surfers Paradise
June Qld Resi Suburb View Surfers ParadiseJune Qld Resi Suburb View Surfers Paradise
June Qld Resi Suburb View Surfers ParadiseProperty News
 
December 2008 Month In Review
December 2008 Month In ReviewDecember 2008 Month In Review
December 2008 Month In ReviewProperty News
 
API eNews 14 Jan 2009
API eNews 14 Jan 2009API eNews 14 Jan 2009
API eNews 14 Jan 2009Property News
 

More from Property News (14)

February 2009 Month In Review
February 2009 Month In ReviewFebruary 2009 Month In Review
February 2009 Month In Review
 
Flyover Glebe
Flyover GlebeFlyover Glebe
Flyover Glebe
 
Flyover Lilyfield Nsw
Flyover Lilyfield NswFlyover Lilyfield Nsw
Flyover Lilyfield Nsw
 
Flyover Kyeemagh Nsw
Flyover Kyeemagh NswFlyover Kyeemagh Nsw
Flyover Kyeemagh Nsw
 
Flyover Beenleigh Qld
Flyover Beenleigh QldFlyover Beenleigh Qld
Flyover Beenleigh Qld
 
Flyover Margate Qld
Flyover Margate QldFlyover Margate Qld
Flyover Margate Qld
 
Perth Sept 2008
Perth Sept 2008Perth Sept 2008
Perth Sept 2008
 
Brisbane Sept 2008
Brisbane Sept 2008Brisbane Sept 2008
Brisbane Sept 2008
 
Act Market View Q3 2008
Act Market View Q3 2008Act Market View Q3 2008
Act Market View Q3 2008
 
808 Qld Resi View Brisbane Northern Link Tunnel Report
808 Qld Resi View Brisbane Northern Link Tunnel Report808 Qld Resi View Brisbane Northern Link Tunnel Report
808 Qld Resi View Brisbane Northern Link Tunnel Report
 
1008 Nsw Resi Suburb View Newcastle
1008 Nsw Resi Suburb View Newcastle1008 Nsw Resi Suburb View Newcastle
1008 Nsw Resi Suburb View Newcastle
 
June Qld Resi Suburb View Surfers Paradise
June Qld Resi Suburb View Surfers ParadiseJune Qld Resi Suburb View Surfers Paradise
June Qld Resi Suburb View Surfers Paradise
 
December 2008 Month In Review
December 2008 Month In ReviewDecember 2008 Month In Review
December 2008 Month In Review
 
API eNews 14 Jan 2009
API eNews 14 Jan 2009API eNews 14 Jan 2009
API eNews 14 Jan 2009
 

Recently uploaded

VIP Call Girls in Noida 9711199012 Escorts in Greater Noida,Ms
VIP Call Girls in Noida 9711199012 Escorts in Greater Noida,MsVIP Call Girls in Noida 9711199012 Escorts in Greater Noida,Ms
VIP Call Girls in Noida 9711199012 Escorts in Greater Noida,Msankitnayak356677
 
(8264348440) 🔝 Call Girls In Nand Nagri 🔝 Delhi NCR
(8264348440) 🔝 Call Girls In Nand Nagri 🔝 Delhi NCR(8264348440) 🔝 Call Girls In Nand Nagri 🔝 Delhi NCR
(8264348440) 🔝 Call Girls In Nand Nagri 🔝 Delhi NCRsoniya singh
 
Night 7k Call Girls Noida Sector 93 Escorts Call Me: 8448380779
Night 7k Call Girls Noida Sector 93 Escorts Call Me: 8448380779Night 7k Call Girls Noida Sector 93 Escorts Call Me: 8448380779
Night 7k Call Girls Noida Sector 93 Escorts Call Me: 8448380779Delhi Call girls
 
BERMUDA Triangle the mystery of life.pptx
BERMUDA Triangle the mystery of life.pptxBERMUDA Triangle the mystery of life.pptx
BERMUDA Triangle the mystery of life.pptxseribangash
 
Akshay Mehndiratta Summer Special Light Meal Ideas From Across India.pptx
Akshay Mehndiratta Summer Special Light Meal Ideas From Across India.pptxAkshay Mehndiratta Summer Special Light Meal Ideas From Across India.pptx
Akshay Mehndiratta Summer Special Light Meal Ideas From Across India.pptxAkshay Mehndiratta
 
Exploring Sicily Your Comprehensive Ebook Travel Guide
Exploring Sicily Your Comprehensive Ebook Travel GuideExploring Sicily Your Comprehensive Ebook Travel Guide
Exploring Sicily Your Comprehensive Ebook Travel GuideTime for Sicily
 
Moving to Italy - A Relocation Rollercoaster
Moving to Italy - A Relocation RollercoasterMoving to Italy - A Relocation Rollercoaster
Moving to Italy - A Relocation RollercoasterStefSmulders1
 
Italia Lucca 1 Un tesoro nascosto tra le sue mura
Italia Lucca 1 Un tesoro nascosto tra le sue muraItalia Lucca 1 Un tesoro nascosto tra le sue mura
Italia Lucca 1 Un tesoro nascosto tra le sue murasandamichaela *
 
Hoi An Ancient Town, Vietnam (越南 會安古鎮).ppsx
Hoi An Ancient Town, Vietnam (越南 會安古鎮).ppsxHoi An Ancient Town, Vietnam (越南 會安古鎮).ppsx
Hoi An Ancient Town, Vietnam (越南 會安古鎮).ppsxChung Yen Chang
 
best weekend places near delhi where you should visit.pdf
best weekend places near delhi where you should visit.pdfbest weekend places near delhi where you should visit.pdf
best weekend places near delhi where you should visit.pdftour guide
 
DARK TRAVEL AGENCY presented by Khuda Bux
DARK TRAVEL AGENCY presented by Khuda BuxDARK TRAVEL AGENCY presented by Khuda Bux
DARK TRAVEL AGENCY presented by Khuda BuxBeEducate
 
"Fly with Ease: Booking Your Flights with Air Europa"
"Fly with Ease: Booking Your Flights with Air Europa""Fly with Ease: Booking Your Flights with Air Europa"
"Fly with Ease: Booking Your Flights with Air Europa"flyn goo
 
08448380779 Call Girls In Shahdara Women Seeking Men
08448380779 Call Girls In Shahdara Women Seeking Men08448380779 Call Girls In Shahdara Women Seeking Men
08448380779 Call Girls In Shahdara Women Seeking MenDelhi Call girls
 
Top 10 Traditional Indian Handicrafts.pptx
Top 10 Traditional Indian Handicrafts.pptxTop 10 Traditional Indian Handicrafts.pptx
Top 10 Traditional Indian Handicrafts.pptxdishha99
 
Dubai Call Girls O528786472 Call Girls Dubai Big Juicy
Dubai Call Girls O528786472 Call Girls Dubai Big JuicyDubai Call Girls O528786472 Call Girls Dubai Big Juicy
Dubai Call Girls O528786472 Call Girls Dubai Big Juicyhf8803863
 
08448380779 Call Girls In Chhattarpur Women Seeking Men
08448380779 Call Girls In Chhattarpur Women Seeking Men08448380779 Call Girls In Chhattarpur Women Seeking Men
08448380779 Call Girls In Chhattarpur Women Seeking MenDelhi Call girls
 
How can I fly with the British Airways Unaccompanied Minor Policy?
How can I fly with the British Airways Unaccompanied Minor Policy?How can I fly with the British Airways Unaccompanied Minor Policy?
How can I fly with the British Airways Unaccompanied Minor Policy?flightsvillacom
 

Recently uploaded (20)

VIP Call Girls in Noida 9711199012 Escorts in Greater Noida,Ms
VIP Call Girls in Noida 9711199012 Escorts in Greater Noida,MsVIP Call Girls in Noida 9711199012 Escorts in Greater Noida,Ms
VIP Call Girls in Noida 9711199012 Escorts in Greater Noida,Ms
 
(8264348440) 🔝 Call Girls In Nand Nagri 🔝 Delhi NCR
(8264348440) 🔝 Call Girls In Nand Nagri 🔝 Delhi NCR(8264348440) 🔝 Call Girls In Nand Nagri 🔝 Delhi NCR
(8264348440) 🔝 Call Girls In Nand Nagri 🔝 Delhi NCR
 
Night 7k Call Girls Noida Sector 93 Escorts Call Me: 8448380779
Night 7k Call Girls Noida Sector 93 Escorts Call Me: 8448380779Night 7k Call Girls Noida Sector 93 Escorts Call Me: 8448380779
Night 7k Call Girls Noida Sector 93 Escorts Call Me: 8448380779
 
BERMUDA Triangle the mystery of life.pptx
BERMUDA Triangle the mystery of life.pptxBERMUDA Triangle the mystery of life.pptx
BERMUDA Triangle the mystery of life.pptx
 
Akshay Mehndiratta Summer Special Light Meal Ideas From Across India.pptx
Akshay Mehndiratta Summer Special Light Meal Ideas From Across India.pptxAkshay Mehndiratta Summer Special Light Meal Ideas From Across India.pptx
Akshay Mehndiratta Summer Special Light Meal Ideas From Across India.pptx
 
Exploring Sicily Your Comprehensive Ebook Travel Guide
Exploring Sicily Your Comprehensive Ebook Travel GuideExploring Sicily Your Comprehensive Ebook Travel Guide
Exploring Sicily Your Comprehensive Ebook Travel Guide
 
Moving to Italy - A Relocation Rollercoaster
Moving to Italy - A Relocation RollercoasterMoving to Italy - A Relocation Rollercoaster
Moving to Italy - A Relocation Rollercoaster
 
Call Girls 🫤 Connaught Place ➡️ 9999965857 ➡️ Delhi 🫦 Russian Escorts FULL ...
Call Girls 🫤 Connaught Place ➡️ 9999965857  ➡️ Delhi 🫦  Russian Escorts FULL ...Call Girls 🫤 Connaught Place ➡️ 9999965857  ➡️ Delhi 🫦  Russian Escorts FULL ...
Call Girls 🫤 Connaught Place ➡️ 9999965857 ➡️ Delhi 🫦 Russian Escorts FULL ...
 
Italia Lucca 1 Un tesoro nascosto tra le sue mura
Italia Lucca 1 Un tesoro nascosto tra le sue muraItalia Lucca 1 Un tesoro nascosto tra le sue mura
Italia Lucca 1 Un tesoro nascosto tra le sue mura
 
Hoi An Ancient Town, Vietnam (越南 會安古鎮).ppsx
Hoi An Ancient Town, Vietnam (越南 會安古鎮).ppsxHoi An Ancient Town, Vietnam (越南 會安古鎮).ppsx
Hoi An Ancient Town, Vietnam (越南 會安古鎮).ppsx
 
best weekend places near delhi where you should visit.pdf
best weekend places near delhi where you should visit.pdfbest weekend places near delhi where you should visit.pdf
best weekend places near delhi where you should visit.pdf
 
DARK TRAVEL AGENCY presented by Khuda Bux
DARK TRAVEL AGENCY presented by Khuda BuxDARK TRAVEL AGENCY presented by Khuda Bux
DARK TRAVEL AGENCY presented by Khuda Bux
 
"Fly with Ease: Booking Your Flights with Air Europa"
"Fly with Ease: Booking Your Flights with Air Europa""Fly with Ease: Booking Your Flights with Air Europa"
"Fly with Ease: Booking Your Flights with Air Europa"
 
08448380779 Call Girls In Shahdara Women Seeking Men
08448380779 Call Girls In Shahdara Women Seeking Men08448380779 Call Girls In Shahdara Women Seeking Men
08448380779 Call Girls In Shahdara Women Seeking Men
 
Top 10 Traditional Indian Handicrafts.pptx
Top 10 Traditional Indian Handicrafts.pptxTop 10 Traditional Indian Handicrafts.pptx
Top 10 Traditional Indian Handicrafts.pptx
 
Dubai Call Girls O528786472 Call Girls Dubai Big Juicy
Dubai Call Girls O528786472 Call Girls Dubai Big JuicyDubai Call Girls O528786472 Call Girls Dubai Big Juicy
Dubai Call Girls O528786472 Call Girls Dubai Big Juicy
 
Rohini Sector 18 Call Girls Delhi 9999965857 @Sabina Saikh No Advance
Rohini Sector 18 Call Girls Delhi 9999965857 @Sabina Saikh No AdvanceRohini Sector 18 Call Girls Delhi 9999965857 @Sabina Saikh No Advance
Rohini Sector 18 Call Girls Delhi 9999965857 @Sabina Saikh No Advance
 
08448380779 Call Girls In Chhattarpur Women Seeking Men
08448380779 Call Girls In Chhattarpur Women Seeking Men08448380779 Call Girls In Chhattarpur Women Seeking Men
08448380779 Call Girls In Chhattarpur Women Seeking Men
 
How can I fly with the British Airways Unaccompanied Minor Policy?
How can I fly with the British Airways Unaccompanied Minor Policy?How can I fly with the British Airways Unaccompanied Minor Policy?
How can I fly with the British Airways Unaccompanied Minor Policy?
 
Call Girls In Munirka 📱 9999965857 🤩 Delhi 🫦 HOT AND SEXY VVIP 🍎 SERVICE
Call Girls In Munirka 📱  9999965857  🤩 Delhi 🫦 HOT AND SEXY VVIP 🍎 SERVICECall Girls In Munirka 📱  9999965857  🤩 Delhi 🫦 HOT AND SEXY VVIP 🍎 SERVICE
Call Girls In Munirka 📱 9999965857 🤩 Delhi 🫦 HOT AND SEXY VVIP 🍎 SERVICE
 

Hobart Sept 2008

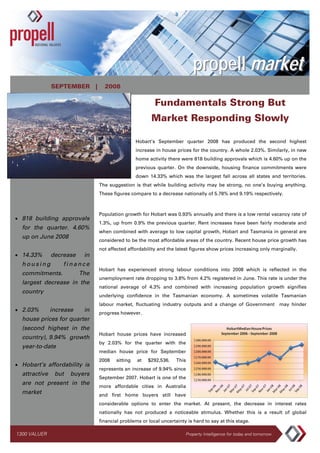
  • 1. propell market SEPTEMBER | 2008 Fundamentals Strong But Market Responding Slowly Hobart’s September quarter 2008 has produced the second highest increase in house prices for the country. A whole 2.03%. Similarly, in new home activity there were 818 building approvals which is 4.60% up on the previous quarter. On the downside, housing finance commitments were down 14.33% which was the largest fall across all states and territories. The suggestion is that while building activity may be strong, no one’s buying anything. These figures compare to a decrease nationally of 5.78% and 9.19% respectively. Population growth for Hobart was 0.93% annually and there is a low rental vacancy rate of • 818 building approvals 1.3%, up from 0.9% the previous quarter. Rent increases have been fairly moderate and for the quarter. 4.60% when combined with average to low capital growth, Hobart and Tasmania in general are up on June 2008 considered to be the most affordable areas of the country. Recent house price growth has not affected affordability and the latest figures show prices increasing only marginally. • 14.33% decrease in housing finance Hobart has experienced strong labour conditions into 2008 which is reflected in the commitments. The unemployment rate dropping to 3.8% from 4.2% registered in June. This rate is under the largest decrease in the national average of 4.3% and combined with increasing population growth signifies country underlying confidence in the Tasmanian economy. A sometimes volatile Tasmanian labour market, fluctuating industry outputs and a change of Government may hinder • 2.03% increase in progress however. house prices for quarter (second highest in the Hobart house prices have increased country), 9.94% growth by 2.03% for the quarter with the year-to-date median house price for September 2008 sitting at $292,536. This • Hobart’s affordability is represents an increase of 9.94% since attractive but buyers September 2007. Hobart is one of the are not present in the more affordable cities in Australia market and first home buyers still have considerable options to enter the market. At present, the decrease in interest rates nationally has not produced a noticeable stimulus. Whether this is a result of global financial problems or local uncertainty is hard to say at this stage. 1300 VALUER Property Intelligence for today and tomorrow
  • 2. Propell National Valuers | Residential Overview | SEPT 2008 House and unit price growth in the top 10 suburbs for the year-to-date varied from 24.5% in Hobart City through to 10.4% in West Hobart for houses, and 18.4% in Mount Stuart to 7.4% in Lutana for units, with evidence showing that properties near the CBD and along the banks of the Derwent River performed the best. Unit growth was subdued throughout the year-to-date despite the low entry prices indicating that detached housing is a preferred option in Tasmania for owners and investors alike. Well placed waterfront units however showed good returns. • Hobart City top The table below illustrates the top 10 Hobart growth suburbs based on median house and unit prices for the September quarter 2008 year-to-date. performing suburb with Top 10 Growth Suburbs growth of 24.5% for houses and Mount Stuart with 18.4% for Suburb Median Q3 Median% Suburb Median Q3 Median% (Houses) 2008 Change (Units) 2008 Change units Hobart City $465,000 24.5 Mount Stuart $208,000 18.4 Sandy Bay $531,000 20.7 North Hobart $285,000 16.7 • Well located waterfront Fern Tree $356,000 19.3 South Hobart $281,000 16.3 properties showed South Hobart $374,000 19.3 West Hobart $288,000 14.0 most growth followed Mount Stuart $410,000 19.0 New Town $215,000 10.7 by CBD proximity Moonah $243,000 14.7 Sandy Bay $363,000 10.2 Goodwood $230,000 13.2 Hobart City $445,000 10.2 South Hobart $605,000 11.9 Dynnyne $285,000 7.8 Lutana $240,000 11.4 Goodwood $190,000 7.4 West Hobart $435,000 10.4 Lutana $190,000 7.3 Source: RPData Hobart’s house price has increased by 9.94% for the year to September, while unit price growth has been -7.23%. This compares to South Australia(10.84% and 11.46%), Melbourne(5.80% and 4.16%), Brisbane(3.66% and 1.73%), Darwin(12.89 and 10.34%), Perth(-4.31% and 1.26%), Canberra(2.73% and 7.64%), and Sydney(-1.48% and -1.18%) Source: RPData 2| QUARTERLY RESIDENTIAL REPORT—Hobart
  • 3. Propell National Valuers | Residential Overview | SEPT 2008 Residential Rental Market In the September quarter vacancy rates increased to 1.3%, from 0.9% in the previous quarter. The average weekly rent for a two bedroom unit in Hobart is $240 per week. This is an increase of 0.00% over the quarter and 4.34% for the year. The average weekly rent for a three bedroom house in Hobart is $290 per week, an increase of 1.75% and 5.45% year-to-date. Current tenant demand for rental properties in Hobart is strong and rental rates are considered the most affordable in the country. Tasmania continues to project an enigma as it has a strong rental market and consistent price growth but is affected greatly by its small market and population fluctuations. The graph below illustrates the average residential rent growth in three bedroom houses and two bedroom units in the Hobart area over the last two years. • Vacancy rate increased to 1.3% for quarter • Hobart the most afford- Source: REIT able rental location in Australia • Yields on houses at The table below highlights median rents within the Statistical Division of Hobart for the 5.1%, units 4.8% September quarter 2008. These figures represent the average of all house and units within the Division. The gross rental yield figure is also shown. Hobart Statistical Sept-08 Sept-07 Qtr Yearly Gross Division % Change % Rental Change Yield % Houses $290 $275 1.75% 5.45% 5.1% Units $240 $230 0.00% 4.34% 4.8% Source: REIT Suburb Sales Q1 2007 Median Q1 2007 Sales Q1 2008 Median Q1 2008 Median % Change 3| QUARTERLY RESIDENTIAL REPORT—Hobart
  • 4. Propell National Valuers | Residential Overview | SEPT 2008 Population As at December 2007, The Hobart Statistical Division had a population growth of 0.93%, the lowest in the country below the Statistical Divisions of Adelaide (1.06%), and Sydney (1.21%). This represented a total of 1,918 people or the equivalent of 36 people per week. Tasmania as a whole grew by 0.70% or 3,419 people. The largest growth continued to occur in the Statistical Subdivisions of Greater Hobart(0.93%), and Southern(0.80%) with Mersey-Lyell(0.41%) having the lowest. Net Natural Increase to December 2007 increased to 582(2.28%) from 569 compared to September 2007. Net Overseas Migration also increased to 403(13.84%) from 354, while there was an easing in Net Interstate Migration of 236(8.17%) from 257. Preliminary figures suggest more people entering the state than leaving. This is a good sign for Tasmania and it can be partly attributable to the level of affordability in the state along with the potential for new industries and the expansion of existing industries as international players, particularly mining set up shop in the state. • Hobart Statis tical Tasmania’s Gross State Product for the year to December 2007 was 2.1% (below the average of 2.7%), with a State Final Demand growth of –0.7%. This contributed to Total Division has population Domestic Demand by 0.0%. increase of 0.93% As at September 2008, there were 226,600 people employed from a total labour force of • Net interstate migration 241,700. This was an increase of 0.9%. Of the people employed, 154,600 were full-time employees while 67,400 were part-time employees. The unemployment rate was 3.8% eases slightly down from 4.2%. This is the lowest level of unemployment in Tasmania since recorded data in 1978. The participation rate slowed however from 60.9% to 60.3%. • Unemployment rate of 3.8% the lowest in Tasmania’s primary growth industries are Manufacturing, Finance and Insurance, recorded history for Agriculture, Forestry and Fishing. The construction industry is also a major force in Tasmania and has recorded a steady increase in the number of people employed over the Tasmania last 5 years. In 2006-2007 there were 16,500 people working in the construction industry in Tasmania. This represented an increase of 3.8% on 2005-2006 and 36.4% on 2002-2003. In 2006-2007 the construction industry employed 7.4% of the state’s total employed personnel. 4| QUARTERLY RESIDENTIAL REPORT—Hobart
  • 5. Propell National Valuers | Residential Overview | SEPT 2008 Major Projects The 2008-2009 Tasmanian budget has been balanced between investment in Capital Works infrastructure and social and economic concerns including: Infrastructure $626.8 million for roads, bus-ways and other transport systems $492.8 million for hospital and other health facilities $80 million for drought proofing Tasmania $135 million for new and existing schools Families $34.8 million to improve literacy and numeracy skills $99 million to support public housing $80 million for reforms in Family Services Environment $5.7 million for climate change programs $12 million for urban renewal and built heritage $12 million for saving the Tasmanian Devil • Over $626 million Business outlined for roads, bus- $65 million for additional tax cuts ways and other $10 million for workforce participation programs transport infrastructure $7.2 million for improving job skills and new training programs • The 2008-09 Budget is a FOR MORE INFORMATION Summary CONTACT balanced social and economic budget Aaron Parker Research Manager Another mixed quarter for Hobart with house prices increasing slightly along with building approvals, while unit prices decreased along with housing Phone: 07 5443 2322 finance. Again, unemployment improved indicating Fax: 07 5443 8039 the underlying strength and growth in the economy, E-mail: aparker@propellvaluers.com while rental rates tapered off. As usual, Hobart and Tasmania in general provides conflicting data for first home buyers and investors yet it still remains the most affordable state in the country. New stock coming on to the market from building activity will impact house prices negatively in the current climate OR CALL unless more incentive is given to first home buyers. Interest rate reductions have not created the stimulus 1300 VALUER needed up to this point, nor has new industry created (1300 825 837) migration incentive. Propell National Values does not give any warranty in relation to the accuracy of the information contained in this report. If you intend to rely upon the information contained herein, you must take note that the information, figures and projections have been provided by various sources and have not been verified by us. Whilst all care has been taken in the preparation of this report, we have no belief one-way or the other in relation to the accuracy of such information, figures and projections contained herein. Propell National Valuers will not be liable for any loss or damage resulting from any statement, figure, projection or any other information that you rely upon that is contained in the material. COPYRIGHT - Propell National Valuers 2008 5| QUARTERLY RESIDENTIAL REPORT—Hobart