SlideShare a Scribd company logo
1 of 16
Download to read offline
SINGLE FAMILY RESIDENTIAL BREAKDOWN


                                                                                                                                        1.6 % 6.8% %
June 2010                                                                                                    24.0 %                               0.2
                                                                                                                                                      0.1 %

Market More Balanced in June
TORONTO - Tuesday, July 6, 2010                                                                8.4 %

Greater Toronto REALTORS®                      The average price for June
reported 8,442 sales through the               transactions was $435,034 – up                     11.5 %                                                       47.5 %
Multiple Listing Service® (MLS®)               eight per cent compared to the
in June. This represented a 23                 average of $403,972 recorded
per cent decrease compared                     for June 2009.
to the record 10,955 sales                                                      2.3 %                      Dwelling Type             Sales        %     Median
                                               “With more homes to 7.0 0.3 % %
                                                                                         %
                                                              21.5 %      choose
                                                                              0.1
reported in June 2009. Sales                                                                             Single Detached 4,006
                                                                                                          Detached                               98     $460,000
                                               from in the second quarter, many
for the second quarter of 2010                                                                           Semi Detached
                                                                                                          Semi-Detached                967       99     $372,000
                                               home buyers have been making                              Condo T.H.
amounted to 28,810 – up one                                                                               Condo Townhouse              709       98     $280,000
                                               less-aggressive offers. This has
per cent annually. Year-to-date                                                                          Condo Apt.
                                                                                                          Condo Apt                  2,024      98      $280,000
                                                  8.5 %
                                               resulted in less upward pressure                          Link
sales through June were up 23                                                                             Link                         132       99     $348,500
                                               on the average selling price,”                            Attached/Row
per cent to 50,455 compared to                                                                            Att/Row/Twnhouse             577       99     $342,000
                                               said Jason Mercer, TREB’s Senior                          Co-op Apt.
the first six months of 2009.                          12.0 %                    48.3 %
                                                                                                          Co-op Apt                      15      97     $229,000
                                               Manager of Market Analysis.                               Detached Condo
                                                                                                          Det Condo                      12      98     $432,500
“We experienced a record number                “The annual rate of average
of existing home sales during the              price growth in the second half of
first half of 2010, but these sales            2010 will be in the single digits.”                           Housing Market Indicators
                                                                                                                        June 2009           June 2010        %Change
were weighted more towards
                                                                                                Sales                       10,955               8,442          (-23%)
the beginning of the year,”
said Toronto Real Estate Board                       Median Price                               New Listings
                                                                                                Active Listings*
                                                                                                                            13,357
                                                                                                                            18,704
                                                                                                                                                15,086
                                                                                                                                                23,923
                                                                                                                                                                 (13%)
                                                                                                                                                                 (28%)
                                                                                                Days on Market                  33                  27          (-18%)
President Bill Johnston. “The pace
of home sales has moderated                         In June, the median price                   * All figures for single-family dwellings.


from record levels over the past                    was    $367,750,         from        the
two months with the prospect of                     $345,000 recorded during
higher mortgage rates.”
                                                    June of 2009.        n                     Inside
                                                                                               District Map ............................................................. 2
                          Annual Average and Median Price                                      Price Category Breakdown......................................2
                                                                                               East District ............................................................. 3
                                                                                               West District ............................................................ 6
                                                                                               Toronto District ......................................................10
  500000              Average         Median
                                                                                               North District..........................................................12
  400000                                                                                       Annual Summary ...................................................16
  300000                                                                                       Single Family Comparison ....................................16

  200000
   100000
       0
            2000   2001   2002 2003   2004   2005   2006   2007   2008   2009     2010
District Map


                                Price Category Breakdown - June 2010
         Price Range         Total S.F.D   %S.F.D   Condo Apt. %Condo Apt. Condo T.H. %Condo T.H.
    -           -    $90,000        27       0.3          13        0.6           4          0.6
    $90,001     -   $100,000        14       0.2          13        0.6            -           -
    $100,001    -   $110,000        14       0.2           9        0.4            -           -
    $110,001    -   $120,000        20       0.2          16        0.8           3          0.4
    $120,001    -   $130,000        24       0.3          18        0.9           6          0.8
    $130,001    -   $140,000        51       0.6          35        1.7           8          1.1
    $140,001    -   $150,000        50       0.6          36        1.8           9          1.3
    $150,001    -   $160,000        54       0.6          35        1.7           9          1.3
    $160,001    -   $170,000        80       0.9          53        2.6          12          1.7
    $170,001    -   $180,000        87       1.0          48        2.4          18          2.5
    $180,001    -   $190,000       136       1.6          68        3.4          29          4.1
    $190,001    -   $200,000       125       1.5          71        3.5          22          3.1
    $200,001    -   $225,000       320       3.8         170        8.4          66          9.3
    $225,001    -   $250,000       443       5.2         189        9.3          67          9.4
    $250,001    -   $300,000     1,081      12.8         420       20.8         158        22.3
    $300,001    -   $400,000     2,422      28.7         502       24.8         223        31.5
    $400,001    -   $500,000     1,460      17.3         202       10.0          38          5.4
    $500,001    -   $750,000     1,387      16.4          93        4.6          28          3.9
    $750,001    - $1,000,000       341       4.0          15        0.7           6          0.8
    $1,000,001 - $1,500,000        200       2.4          11        0.5           2          0.3
    $1,500,001 -           -       106       1.3           7        0.3           1          0.1
    Total:                       8,442       100       2,024        100         709         100

2   TORONTO REAL ESTATE BOARD
East District


                                 Current Month: June 2010
Area   Active    New     Sales      $ Volume          Avg Price      Med Price     Avg DOM   Avg %List
E01     174       167      108     $51,476,549        $476,635        $442,000          17         101
E02     154       141       74     $43,270,610        $584,738        $519,500          13          99
E03     272       232      132     $52,753,204        $399,645        $404,000          17          99
E04     250       177       96     $28,203,900        $293,791        $305,500          27          98
E05     273       173      102     $35,246,488        $345,554        $326,500          25          97
E06     131       102       49     $18,745,050        $382,552        $345,000          28          97
E07     223       154       98     $31,403,930        $320,448        $324,150          23          97
E08     279       159       80     $25,473,950        $318,424        $335,000          22          97
E09     369       226      113     $32,645,190        $288,895        $282,000          26          98
E10     114        91       63     $25,051,600        $397,644        $380,000          30          98
E11     312       190      111     $33,094,212        $298,146        $306,000          26          98
E12      67        46       24      $8,263,700        $344,321        $291,750          28          98
E13     255       189      115     $38,658,650        $336,162        $315,000          25          98
E14     358       269      171     $57,217,298        $334,604        $318,000          24          98
E15     352       283      148     $46,412,500        $313,598        $305,000          23          98
E16     688       414      227     $55,320,450        $243,702        $231,000          30          97
E17     303       211      120     $30,461,930        $253,849        $241,500          32          98
E18      31         9        7      $4,053,000        $579,000        $355,000          34          95
E19     101        63       41     $16,567,250        $404,079        $357,000          34          98
E20     132        62       32      $9,674,250        $302,320        $287,950          62          97
E21     174        69       35     $13,306,400        $380,183        $338,000          44          96
TOTAL 5,012     3,427    1,946    $657,300,111        $337,770        $318,000          26          98


                                    Year-to-Date: June 2010
Area  Listed     Sales       $ Volume            Avg Price        Med Price      Avg DOM     Avg %List
E01     969        510     $250,666,506           $491,503         $461,000            14         103
E02     881        505     $307,502,717           $608,916         $547,000            13         102
E03   1,379        728     $306,070,303           $420,426         $411,000            17         101
E04   1,038        511     $151,314,516           $296,115         $315,000            23          99
E05   1,089        588     $199,573,311           $339,410         $310,000            20         100
E06     629        321     $131,927,774           $410,990         $359,000            18         102
E07     991        524     $177,278,504           $338,318         $345,000            21         100
E08     980        483     $152,204,835           $315,124         $327,000            22          99
E09   1,399        765     $210,565,993           $275,250         $265,000            23          99
E10     573        327     $131,288,873           $401,495         $385,000            20          99
E11   1,169        610     $184,062,675           $301,742         $299,950            25          98
E12     271        137      $45,057,933           $328,890         $292,533            24          98
E13   1,129        600     $209,040,723           $348,401         $330,000            22          99
E14   1,854      1,076     $357,530,677           $332,278         $317,000            21          99
E15   1,701        947     $300,115,724           $316,912         $305,000            20          99
E16   2,623      1,355     $314,452,467           $232,068         $224,000            29          97
E17   1,232        709     $184,215,213           $259,824         $247,000            28          98
E18      75         30      $17,428,900           $580,963         $453,750            49          95
E19     442        242      $93,142,419           $384,886         $351,000            28          98
E20     352        159      $47,978,650           $301,753         $275,000            49          97
E21     459        216      $73,446,934           $340,032         $308,800            45          96
TOTAL 21,235    11,343   $3,844,865,647           $338,964         $314,000            23          99


                                                                     TORONTO REAL ESTATE BOARD       3
SINGLE FAMILY EAST BREAKDOWN - JuNE 2010                                East District


                              East District                                                     East District
      80                     Days on Market                             80               Sales Active Listing Ratio

      60                                                                60


      40                                                                40


      20                                                                20


       0                                                                 0
            Jun   Jul Aug Sep Oct Nov Dec Jan Feb Mar Apr May Jun            Jun   Jul Aug Sep Oct Nov Dec Jan Fab Mar Apr May Jun

           2009                                              2010            2009                                           2010


     Detached Houses                                                   Semi-Detached Houses
Area Act Sales Av. Price                Med. Price % S-A Av. % List Area Act Sales Av. Price Med. Price % S-A Av. % List
E01         31      23     $529,585      $450,000     74.2      101   E01     61        58      $475,772      $441,000 95.1          101
E02         62      29     $723,083      $650,000     46.8      100   E02     57        33      $525,979      $475,950 57.9           99
E03        131      59     $452,469      $425,000     45.0       99   E03     52        36      $480,564      $478,000 69.2          101
E04        107      45     $380,853      $375,000     42.1       98   E04     15         4      $313,850      $285,500 26.7           94
E05         90      36     $487,594      $466,500     40.0       98   E05     15         5      $360,200      $350,000 33.3           99
E06        101      40     $383,789      $345,750     39.6       97   E06     17         3      $371,667      $345,000 17.7          100
E07         85      38     $435,883      $416,500     44.7       98   E07     16        10      $330,880      $329,000 62.5           97
E08        144      47     $400,501      $365,000     32.6       97   E08      6         5      $312,100      $285,000 83.3           97
E09         94      49     $358,898      $348,000     52.1       98   E09      5         4      $304,125      $323,250 80.0           98
E10         89      44     $453,102      $431,500     49.4       98   E10      5         -             -             -     -           -
E11         96      39     $402,952      $405,000     40.6       99   E11     31        16      $346,456      $362,500 51.6           98
E12         38      16     $390,481      $317,950     42.1       98   E12      4         2      $262,000      $262,000 50.0          100
E13        161      60     $422,502      $394,250     37.3       99   E13     10        10      $281,050      $272,250 100.0          98
E14        250     118     $366,226      $352,250     47.2       98   E14     21        13      $287,377      $280,000 61.9          100
E15        247      92     $355,623      $339,000     37.3       98   E15     10         5      $236,000      $239,000 50.0           98
E16        508     164     $270,069      $255,000     32.3       97   E16     63        29      $185,757      $183,600 46.0           97
E17        221      74     $282,453      $262,500     33.5       98   E17      7         4      $180,625      $179,500 57.1           98
E18         31       7     $579,000      $355,000     22.6       95   E18      -         -             -             -     -           -
E19         93      31     $447,624      $388,000     33.3       97   E19      -         -             -             -     -           -
E20        113      31     $303,202      $289,900     27.4       97   E20      -         -             -             -     -           -
E21        173      33     $387,770      $350,000     19.1       96   E21      1         1      $235,000      $235,000 100.0          98


4     TORONTO REAL ESTATE BOARD
SINGLE FAMILY EAST BREAKDOWN - JuNE 2010                          East District


     Condo Apartment                                                  Link
Area Act Sales Av. Price    Med. Price % S-A Av. % List Area Act   Sales Av. Price       Med. Price % S-A Av. % List
E01  40    11    $412,764    $379,000    27.5   103    E01     -        -        -           -           -           -
E02  12     4    $432,475    $421,450    33.3    98    E02     -        -        -           -           -           -
E03  73    31    $224,177    $171,500    42.5    96    E03     -        -        -           -           -           -
E04  95    34    $182,935    $190,000    35.8    97    E04     -        -        -           -           -           -
E05 113    40    $249,445    $248,500    35.4    96    E05    8        1      $348,000    $348,000      12.5        97
E06   7     3    $244,500    $225,000    42.9    96    E06     -        -        -           -           -           -
E07  80    34    $197,599    $200,000    42.5    97    E07    18       4      $362,250    $361,500      22.2        98
E08  95    21    $173,538    $164,500    22.1    97    E08     -        -        -           -           -           -
E09 219    54    $234,029    $233,250    24.7    98    E09     -        -        -           -           -           -
E10   4     3    $170,800    $153,000    75.0   100    E10    1        1      $327,500    $327,500     100.0        99
E11 117    26    $158,115    $160,000    22.2    97    E11    6         -        -           -           -           -
E12   3     -           -           -       -     -    E12    1        1      $338,500    $338,500     100.0        98
E13  18    16    $200,488    $185,400    88.9    98    E13    5        2      $262,500    $262,500      40.0        97
E14  16     4    $225,875    $219,250    25.0    97    E14    4        2      $251,000    $251,000      50.0        99
E15  36    11    $223,409    $196,000    30.6    97    E15    5        11     $275,545    $274,500     220.0        98
E16  17     4    $141,725    $138,500    23.5    94    E16    9        5      $215,300    $220,000      55.6        98
E17   8     7    $168,214    $160,000    87.5    96    E17    31       16     $239,696    $228,250      51.6        99
E18   -     -           -           -       -     -    E18     -        -        -           -           -           -
E19   -     -           -           -       -     -    E19    5        1      $301,500    $301,500      20.0        99
E20  10     -           -           -       -     -    E20    2        1      $275,000    $275,000      50.0        97
E21   -     -           -           -       -     -    E21     -       1      $275,000    $275,000       -          99


     Condo Townhouse                                       Detached Condo
Area Act Sales Av. Price Med. Price % S-A Av. % List Area Act Sales Av. Price            Med. Price % S-A Av. % List
E01   24    2    $358,500   $358,500   8.3       98   E01    -     -               -          -         -       -
E02    9    1    $394,000   $394,000 11.1       100   E02    -     -               -          -         -       -
E03    7    2    $264,650   $264,650 28.6        98   E03    -     -               -          -         -       -
E04   24   12    $268,275   $261,500 50.0        98   E04    -     -               -          -         -       -
E05   43   17    $267,076   $261,000 39.5        99   E05    -     -               -          -         -       -
E06    3    -           -          -     -        -   E06    -     -               -          -         -       -
E07   20    9    $275,411   $278,000 45.0        97   E07    -     -               -          -         -       -
E08   28    7    $206,514   $220,000 25.0        97   E08    -     -               -          -         -       -
E09   46    5    $166,430   $178,000 10.9        98   E09    -     -               -          -         -       -
E10    7    7    $212,129   $200,000 100.0       96   E10    -     -               -          -         -       -
E11   36   18    $238,722   $243,000 50.0        98   E11    -     -               -          -         -       -
E12   14    5    $230,700   $240,000 35.7        99   E12    -     -               -          -         -       -
E13   40   16    $225,666   $216,250 40.0        97   E13    -     -               -          -         -       -
E14   32   12    $225,233   $228,450 37.5        99   E14    1     1        $201,000   $201,000     100.0      98
E15   17   11    $217,891   $212,500 64.7        98   E15    -     -               -          -         -       -
E16   77   17    $154,200   $150,000 22.1        97   E16    -     -               -          -         -       -
E17   14    5    $200,900   $210,000 35.7        97   E17    -     -               -          -         -       -
E18    -    -           -          -     -        -   E18    -     -               -          -         -       -
E19    -    1    $263,000   $263,000     -       97   E19    -     -               -          -         -       -
E20    7    -           -          -     -        -   E20    -     -               -          -         -       -
E21    -    -           -          -     -        -   E21    -     -               -          -         -       -


                                                                             TORONTO REAL ESTATE BOARD              5
SINGLE FAMILY EAST BREAKDOWN - JuNE 2010                     East District
           Co-op Apartment                                     Attached/Row/Townhouse
Area Act Sales          Av. Price   Med. Price % S-A Av. % List Area Act Sales     Av. Price   Med. Price % S-A Av. % List
E01        -       -           -            -      -     -    E01    18      14   $460,279     $458,450     77.8      100
E02        2       1    $270,000     $270,000   50.0    97    E02    12       6   $425,000     $394,500     50.0       97
E03        -       2    $214,450     $214,450      -    99    E03     9       2   $424,750     $424,750     22.2       99
E04        2       -           -            -      -     -    E04     7       1   $371,000     $371,000     14.3      105
E05        -       -           -            -      -     -    E05     4       3   $342,000     $338,000     75.0       98
E06        -       -           -            -      -     -    E06     3       3   $515,000     $419,000    100.0       98
E07        -       -           -            -      -     -    E07     4       3   $295,167     $297,000     75.0       98
E08        -       -           -            -      -     -    E08     6       -          -            -        -        -
E09        -       -           -            -      -     -    E09     5       1   $373,000     $373,000     20.0       98
E10        -       -           -            -      -     -    E10     8       8   $348,788     $352,450    100.0       98
E11        -       -           -            -      -     -    E11    25      12   $285,650     $291,500     48.0       99
E12        -       -           -            -      -     -    E12     7       -          -            -        -        -
E13        -       -           -            -      -     -    E13    21      11   $286,782     $302,000     52.4       98
E14        -       -           -            -      -     -    E14    34      21   $283,686     $286,000     61.8       98
E15        -       -           -            -      -     -    E15    37      18   $257,217     $260,000     48.7       99
E16        -       -           -            -      -     -    E16    14       8   $172,175     $202,450     57.1       93
E17        -       -           -            -      -     -    E17    22      14   $201,486     $196,450     63.6       99
E18        -       -           -            -      -     -    E18     -       -          -            -        -        -
E19        -       -           -            -      -     -    E19     3       8   $265,800     $263,950    266.7       99
E20        -       -           -            -      -     -    E20     -       -          -            -        -        -
E21        -       -           -            -      -     -    E21     -       -          -            -        -        -


                                                                                                    West District
                                             Current Month: June 2010
    Area       Active      New       Sales       $ Volume        Avg Price         Med Price     Avg DOM       Avg %List
W01     126                 119         64      $33,777,144      $527,768           $476,639              19        101
W02     160                 130         75      $38,321,032      $510,947           $460,000              15        101
W03     260                 128         62      $20,460,312      $330,005           $314,500              26         98
W04     267                 143         67      $21,894,500      $326,784           $342,000              30         97
W05     489                 231        111      $33,611,630      $302,807           $325,000              33         97
W06     361                 211        123      $49,266,590      $400,541           $396,500              27         99
W07     155                 123         68      $34,866,719      $512,746           $492,250              23         99
W08     289                 201        122      $75,228,074      $616,624           $475,750              24         97
W09     172                 102         52      $22,337,222      $429,562           $422,500              30         98
W10     314                 178         76      $20,083,700      $264,259           $281,250              36         98
W12     266                 159         97      $52,526,354      $541,509           $423,000              28         97
W13     264                 142         79      $49,302,925      $624,088           $538,000              30         97
W14     148                  90         52      $18,800,222      $361,543           $359,161              27         97
W15     551                 360        209      $56,793,330      $271,738           $252,000              28         97
W16     179                 138         88      $39,449,075      $448,285           $365,500              19         98
W17       3                   2          -                -             -                  -               -          -
W18     163                  98         35       $9,317,950      $266,227           $277,500              31         97
W19     527                 386        235      $95,711,050      $407,281           $390,000              24         98
W20     537                 444        291     $116,645,268      $400,843           $380,000              21         98
W21     572                 311        190     $121,458,739      $639,257           $511,750              33         97
W22     228                 219        117      $47,254,599      $403,885           $365,200              19         99
W23   1,077                 793        387     $133,778,999      $345,682           $335,000              24         98
W24     782                 565        314     $109,005,984      $347,153           $338,000              24         97
W25     166                 105         51      $18,816,200      $368,945           $333,000              34         98
W26      40                  10          8       $5,957,500      $744,688           $713,750              58         92
W27     226                 137         81      $35,206,690      $434,650           $383,000              26         98
W28     290                 112         73      $36,843,600      $504,707           $464,000              41         98
W29     162                  91         61      $20,193,100      $331,034           $290,000              34         98
TOTAL 8,774               5,728      3,188   $1,316,908,508      $413,083           $360,000              26         98


6      TORONTO REAL ESTATE BOARD
SINGLE FAMILY WEST BREAKDOWN - JuNE 2010                            West District


                           West District                                                     West District
   80                     Days on Market                              80              Sales Active Listing Ratio

   60                                                                 60


   40                                                                 40


   20                                                                 20


    0                                                                  0
        Jun    Jul Aug Sep Oct Nov Dec Jan Feb Mar Apr May Jun             Jun   Jul Aug Sep Oct Nov Dec Jan Feb Mar Apr May Jun

        2009                                             2010              2009                                            2010


                                                    Year-to-Date: June 2010
Area          Listed       Sales            $ Volume             Avg Price            Med Price        Avg DOM         Avg %List
W01             630          375         $201,133,959             $536,357              $475,000                17                 103
W02             828          484         $249,193,566             $514,863              $455,000                15                 104
W03             895          416         $138,603,237             $333,181              $329,250                23                  99
W04             934          445         $142,338,637             $319,862              $319,000                30                  98
W05           1,482          634         $200,863,609             $316,820              $331,000                29                  98
W06           1,336          707         $287,798,490             $407,070              $380,000                24                 100
W07             721          433         $216,992,495             $501,137              $479,000                18                 100
W08           1,246          738         $432,479,596             $586,016              $490,000                22                  99
W09             563          275         $107,138,426             $389,594              $401,000                28                  98
W10           1,138          531         $140,904,319             $265,357              $265,000                30                  98
W12           1,052          551         $293,252,341             $532,218              $430,000                26                  98
W13             966          479         $290,378,578             $606,218              $457,000                25                  98
W14             615          346         $127,667,005             $368,980              $361,000                22                  98
W15           2,207        1,235         $330,701,189             $267,774              $245,000                24                  98
W16             884          536         $232,942,078             $434,593              $389,500                19                  99
W17               3            -                    -                    -                     -                 -                   -
W18             483          234          $66,540,001             $284,359              $295,000                28                  97
W19           2,389        1,312         $528,668,127             $402,948              $390,000                19                  99
W20           2,756        1,583         $647,558,454             $409,070              $384,000                17                  99
W21           2,028        1,056         $616,687,076             $583,984              $503,750                25                  98
W22           1,250          769         $308,559,927             $401,248              $369,900                15                  99
W23           4,939        2,642         $912,076,450             $345,222              $333,000                21                  98
W24           3,645        1,980         $714,217,131             $360,716              $345,000                21                  98
W25             551          305         $120,823,401             $396,142              $357,000                28                  98
W26              74           34          $22,443,500             $660,103              $577,500                57                  96
W27             853          527         $218,288,265             $414,209              $381,000                26                  99
W28             832          444         $219,247,906             $493,802              $452,500                32                  98
W29             534          336         $105,741,351             $314,706              $290,000                33                  98
TOTAL         35,834      19,407       $7,873,239,114             $405,691              $360,000                22                  99


                                                                                           TORONTO REAL ESTATE BOARD                7
SINGLE FAMILY WEST BREAKDOWN - JuNE 2010                   West District
     Detached Houses                                          Semi-Detached Houses
Area Act Sales Av. Price       Med. Price % S-A Av. % List Area Act Sales Av. Price Med. Price % S-A Av. % List
W01     35    15   $801,368    $845,000   42.9     102   W01 21       20    $511,514     $498,889 95.2       102
W02     56    30   $664,636    $682,500   53.6     102   W02 63       24    $458,023     $447,500 38.1       101
W03    164    34   $345,568    $318,250   20.7      97   W03 60       18    $381,667     $391,850 30.0        98
W04    149    34   $404,179    $392,000   22.8      97   W04 13        7    $358,857     $360,000 53.9        98
W05    120    24   $427,946    $398,750   20.0      97   W05 105      40    $375,313     $342,750 38.1        98
W06    115    45   $466,041    $435,000   39.1     100   W06 11        2    $524,000     $524,000 18.2        99
W07     63    32   $655,749    $632,450   50.8     100   W07   -       2    $437,500     $437,500     -       99
W08    180    66   $896,024    $797,950   36.7      97   W08 2         1    $418,000     $418,000 50.0        95
W09     64    29   $558,887    $560,000   45.3      99   W09 2         3    $372,000     $367,000 150.0       99
W10     94    37   $355,189    $345,000   39.4      98   W10 6         2    $308,100     $308,100 33.3        96
W12    183    59   $683,094    $542,000   32.2      97   W12 14        5    $338,500     $338,000 35.7        96
W13    193    50   $826,969    $804,950   25.9      96   W13 20        9    $328,222     $318,000 45.0        99
W14     35    17   $550,853    $535,000   48.6      97   W14 15        8    $400,688     $412,500 53.3        97
W15     35    12   $508,833    $496,500   34.3      97   W15 16       10    $405,000     $400,000 62.5        97
W16     87    38   $651,836    $516,500   43.7      98   W16 31       15    $350,060     $360,000 48.4        97
W17      -     -          -           -      -       -   W17   -       -           -            -     -        -
W18     61    10   $312,100    $302,000   16.4      96   W18 56       12    $304,421     $307,000 21.4        97
W19    209    92   $555,054    $526,000   44.0      98   W19 73       34    $396,263     $395,000 46.6        98
W20    242   114   $526,880    $509,500   47.1      98   W20 89       62    $381,685     $381,500 69.7        99
W21    406   116   $795,464    $617,500   28.6      97   W21 12        8    $375,125     $372,000 66.7        98
W22    138    53   $503,651    $493,000   38.4      98   W22 32       21    $346,524     $347,500 65.6        98
W23    735   222   $391,330    $370,750   30.2      98   W23 183      84    $309,711     $315,000 45.9        98
W24    492   164   $430,521    $430,500   33.3      97   W24 126      58    $321,081     $323,500 46.0        98
W25    104    24   $496,746    $444,750   23.1      98   W25 11        1    $294,000     $294,000   9.1       98
W26     39     8   $744,688    $713,750   20.5      92   W26   -       -           -            -     -        -
W27    204    67   $460,976    $435,000   32.8      98   W27 5         6    $316,750     $325,500 120.0       97
W28    269    59   $545,925    $506,000   21.9      98   W28 7         6    $335,167     $336,000 85.7        98
W29    125    45   $363,898    $324,000   36.0      97   W29 6         6    $223,633     $225,000 100.0       99


      Condo Apartment                                                 Link
Area Act Sales     Av. Price   Med. Price % S-A Av. % List Area Act Sales    Av. Price   Med. Price % S-A Av. % List
W01    56 15       $346,410    $310,150 26.8      98     W01    -      -            -           -        -       -
W02    20   9      $350,944    $378,000 45.0      98     W02    -      -            -           -        -       -
W03    25   9      $179,333    $174,000 36.0      97     W03    -      -            -           -        -       -
W04    68 18       $175,250    $175,000 26.5      96     W04    -      -            -           -        -       -
W05   147 21       $146,878    $126,000 14.3      95     W05    1      1     $240,000    $240,000    100.0     110
W06   195 61       $352,029    $315,000 31.3      98     W06    -      -            -           -        -       -
W07    78 28       $353,366    $285,000 35.9      98     W07    -      -            -           -        -       -
W08    97 47       $270,563    $250,500 48.5      98     W08    1      -            -           -        -       -
W09    93 18       $239,694    $225,000 19.4      96     W09    -      -            -           -        -       -
W10   162 31       $172,016    $160,000 19.1      99     W10    1      -            -           -        -       -
W12    45 19       $242,068    $237,000 42.2      97     W12    -      -            -           -        -       -
W13    12   9      $185,222    $190,000 75.0      97     W13    -      -            -           -        -       -
W14    44 13       $207,300    $210,000 29.6      97     W14    -      -            -           -        -       -
W15   441 163      $242,868    $233,500 37.0      97     W15    2      -            -           -        -       -
W16    16 10       $264,820    $221,950 62.5      98     W16    5      1     $341,000    $341,000     20.0      98
W17     3   -             -           -     -      -     W17    -      -            -           -        -       -
W18    30   7      $148,071    $133,000 23.3      96     W18    -      -            -           -        -       -
W19   125 45       $221,439    $194,500 36.0      97     W19    2      2     $402,500    $402,500    100.0      98
W20    52 25       $208,820    $198,500 48.1      97     W20    4      2     $369,500    $369,500     50.0      99
W21    69 22       $387,105    $247,000 31.9      96     W21    6      2     $371,500    $371,500     33.3      99
W22     1   3      $287,833    $277,000 300.0     98     W22    5      1     $297,000    $297,000     20.0      99
W23    27 12       $225,875    $212,000 44.4      97     W23    9      -            -           -        -       -
W24    50 33       $171,224    $159,900 66.0      97     W24    1      2     $291,100    $291,100    200.0      97
W25    24 10       $224,850    $219,000 41.7      97     W25    2      -            -           -        -       -
W26     -   -             -           -     -      -     W26    -      -            -           -        -       -
W27     4   -             -           -     -      -     W27    1      1     $262,000    $262,000    100.0      95
W28     5   -             -           -     -      -     W28    1      -            -           -        -       -
W29    18   3      $287,633    $320,000 16.7      97     W29    1      -            -           -        -       -
8     TORONTO REAL ESTATE BOARD
SINGLE FAMILY WEST BREAKDOWN - JuNE 2010                West District
     Condo Townhouse                                       Detached Condo
Area Act Sales Av. Price Med. Price % S-A Av. % List Area Act Sales Av. Price      Med. Price % S-A Av. % List
W01     6    5   $314,600    $308,000 83.3     100     W01    -     -          -           -     -            -
W02    12    4   $258,725    $247,950 33.3      98     W02    -     -          -           -     -            -
W03     7    -          -           -     -      -     W03    -     -          -           -     -            -
W04    31    5   $291,780    $289,000 16.1      98     W04    -     -          -           -     -            -
W05    98   23   $198,717    $204,990 23.5      97     W05    -     -          -           -     -            -
W06    16    7   $400,929    $376,500 43.8      99     W06    -     -          -           -     -            -
W07     1    1   $285,000    $285,000 100.0     95     W07    -     -          -           -     -            -
W08     7    7   $314,971    $320,000 100.0     97     W08    -     -          -           -     -            -
W09     6    2   $349,500    $349,500 33.3      99     W09    -     -          -           -     -            -
W10    46    6   $165,500    $184,000 13.0      95     W10    -     -          -           -     -            -
W12    21   14   $423,714    $391,000 66.7      98     W12    2     -          -           -     -            -
W13    34    8   $248,188    $237,750 23.5      97     W13    1     1   $685,000    $685,000 100.0           98
W14    46   13   $241,948    $253,000 28.3      97     W14    -     -          -           -     -            -
W15    55   24   $293,745    $287,250 43.6      98     W15    -     -          -           -     -            -
W16    39   24   $268,300    $275,500 61.5      98     W16    -     -          -           -     -            -
W17     -    -          -           -     -      -     W17    -     -          -           -     -            -
W18    15    5   $241,480    $212,000 33.3      98     W18    -     -          -           -     -            -
W19    84   44   $314,630    $314,500 52.4      98     W19    -     -          -           -     -            -
W20   100   71   $288,084    $290,000 71.0      98     W20    5     -          -           -     -            -
W21    29   10   $319,030    $304,750 34.5      99     W21    -     -          -           -     -            -
W22     5    5   $225,980    $225,000 100.0     98     W22    -     -          -           -     -            -
W23    62   35   $238,326    $235,000 56.5      97     W23    -     -          -           -     -            -
W24    53   29   $189,607    $187,200 54.7      97     W24    3     -          -           -     -            -
W25    15   10   $245,280    $252,750 66.7      98     W25    -     1   $312,000    $312,000     -           96
W26     -    -          -           -     -      -     W26    1     -          -           -     -            -
W27     5    1   $184,900    $184,900 20.0     100     W27    -     -          -           -     -            -
W28     1    -          -           -     -      -     W28    -     -          -           -     -            -
W29     4    2   $193,000    $193,000 50.0      97     W29    -     -          -           -     -            -


      Co-op Apartment                                    Attached/Row/Townhouse
Area Act Sales Av. Price    Med. Price % S-A Av. % List Area Act Sales Av. Price Med. Price % S-A Av. % List
W01    -    -           -           -     -      -    W01     8     9   $528,578   $530,000   112.5      102
W02    2    1    $162,000    $162,000 50.0      96    W02     7     7   $433,429   $384,000   100.0      103
W03    -    -           -           -     -      -    W03     4     1   $227,000   $227,000    25.0       99
W04    -    -           -           -     -      -    W04     6     3   $342,333   $347,000    50.0       98
W05    7    1     $63,500     $63,500 14.3      91    W05    11     1   $370,000   $370,000     9.1       97
W06    6    2    $126,750    $126,750 33.3      99    W06    18     6   $452,167   $476,500    33.3       98
W07    1    1    $140,000    $140,000 100.0     93    W07    12     4   $672,125   $686,500    33.3      100
W08    1    -           -           -     -      -    W08     1     1   $751,226   $751,226   100.0      105
W09    4    -           -           -     -      -    W09     3     -          -          -       -        -
W10    2    -           -           -     -      -    W10     3     -          -          -       -        -
W12    -    -           -           -     -      -    W12     1     -          -          -       -        -
W13    -    -           -           -     -      -    W13     4     2   $331,500   $331,500    50.0       97
W14    1    -           -           -     -      -    W14     7     1   $390,000   $390,000    14.3       98
W15    1    -           -           -     -      -    W15     1     -          -          -       -        -
W16    -    -           -           -     -      -    W16     1     -          -          -       -        -
W17    -    -           -           -     -      -    W17     -     -          -          -       -        -
W18    -    -           -           -     -      -    W18     1     1   $300,000   $300,000   100.0       97
W19    -    -           -           -     -      -    W19    34    18   $364,428   $360,000    52.9       98
W20    -    -           -           -     -      -    W20    45    17   $382,529   $390,000    37.8       98
W21    -    -           -           -     -      -    W21    50    32   $429,197   $383,500    64.0       99
W22    -    -           -           -     -      -    W22    47    34   $323,344   $326,250    72.3       99
W23    -    -           -           -     -      -    W2 3   61    34   $289,297   $290,050    55.7       98
W24    -    -           -           -     -      -    W24    57    28   $287,382   $301,500    49.1       98
W25    1    -           -           -     -      -    W25     9     5   $317,400   $320,000    55.6       99
W26    -    -           -           -     -      -    W26     -     -          -          -       -        -
W27    -    -           -           -     -      -    W27     7     6   $328,983   $323,200    85.7      100
W28    3    -           -           -     -      -    W28     4     8   $327,875   $309,500   200.0       99
W29    -    -           -           -     -      -    W29     8     5   $245,400   $252,000    62.5       99
                                                                        TORONTO REAL ESTATE BOARD        9
Central District
                                                 Current Month: June 2010
Area       Active           New        Sales         $ Volume           Avg Price             Med Price        Avg DOM        Avg%List
C01   1,197                726          438         $180,501,643        $412,104               $357,750                 25             99
C02     274                172           93          $67,892,053        $730,022               $555,000                 19             99
C03     182                120           40          $37,803,160        $945,079               $727,500                 26             98
C04     252                174          106          $88,127,350        $831,390               $790,000                 20             97
C06      96                 60           24          $14,076,911        $586,538               $567,000                 30             97
C07     373                201          113          $49,396,116        $437,134               $385,000                 30             97
C08     479                332          188          $74,133,024        $394,325               $348,250                 24             98
C09      98                 68           42          $48,729,129       $1,160,217              $960,115                 24             98
C10     195                152          109          $73,483,374        $674,159               $542,000                 22             99
C11      66                 54           36          $17,976,600        $499,350               $505,900                 19             98
C12     184                 84           43          $57,868,800       $1,345,786            $1,157,500                 29             97
C13     193                 99           82          $36,805,263        $448,845               $393,000                 25             98
C14     513                342          162          $75,701,114        $467,291               $392,500                 25             98
C15     390                261          106          $48,495,500        $457,505               $384,800                 22             98
TOTAL 4,492              2,845        1,582         $870,990,037        $550,563              $415,000                  24             98


                           Central District                                                    Central District
     80                    Days on Market                                 80               Sales Active Listing Ratio

     60                                                                   60


     40                                                                   40


     20                                                                   20


                                                                           0
      0                                                                        Jun   Jul Aug Sep Oct Nov Dec Jan Feb Mar Apr May Jun
          Jun   Jul Aug Sep Oct Nov Dec Jan Feb Mar Apr May Jun

          2009                                            2010                 2009                                           2010


                                                     Year-to-Date: June 2010
Area            Listed      Sales             $ Volume             Avg Price             Med Price         Avg DOM           Avg%List
 C01    4,813               2,368          $980,874,085            $414,220              $365,000               19              100
 C02    1,045                 507          $388,984,383            $767,228              $580,000               21              101
 C03      695                 332          $289,507,727            $872,011              $611,000               22              100
 C04    1,252                 698          $585,494,450            $838,817              $760,500               18              100
 C06      386                 175           $97,493,497            $557,106              $520,000               21               99
 C07    1,468                 747          $331,801,388            $444,179              $378,000               21               99
 C08    1,981               1,012          $398,504,055            $393,779              $350,000               19              100
 C09      390                 198          $248,442,258           $1,254,759             $955,000               22              100
 C10      970                 557          $406,340,982            $729,517              $593,900               17              101
 C11      356                 219          $116,390,471            $531,463              $450,000               20              100
 C12      587                 260          $382,053,308           $1,469,436            $1,186,500              26               99
 C13      817                 403          $170,474,696            $423,014              $372,000               21              100
 C14    2,085               1,044          $505,867,692            $484,548              $380,000               19              100
 C15    1,590                 773          $350,105,495            $452,918              $375,000               19              100
 TOTAL 18,435               9,293        $5,252,334,487            $565,193              $411,000               20              100


10   TORONTO REAL ESTATE BOARD
SINGLE FAMILY CENTRAL BREAKDOWN - JuNE 2010                       Central District
     Detached Houses                                         Semi-Detached Houses
Area Act Sales Av. Price       Med. Price % S-A Av. % List Area Act Sales Av. Price Med. Price % S-A Av.% List
C01     20    8     $640,750  $633,000     40.0   101     C01   56       23     $664,835   $637,900  41.1           101
C02     51   19   $1,039,316  $800,000     37.3    99     C02   50       34     $622,397   $535,000  68.0           100
C03    107   25   $1,165,590  $834,000     23.4    97     C03   24        7     $618,057   $586,000  29.2            99
C04    175   75     $990,689  $912,500     42.9    97     C04   12        8     $638,000   $615,000  66.7            99
C06     58   18     $685,245  $662,500     31.0    96     C06    2        -             -          -    -             -
C07    121   31     $669,762  $660,000     25.6    97     C07   15        6     $458,583   $462,500  40.0           100
C08      6    2     $817,000  $817,000     33.3   100     C08   18       10     $684,250   $683,500  55.6            98
C09     45   18   $1,695,791 $1,577,500    40.0    97     C09    7        1    $1,468,000 $1,468,000 14.3            99
C10     59   34   $1,085,861  $891,000     57.6    98     C10   16       16     $626,206   $632,500 100.0           101
C11     25   10     $933,100  $908,000     40.0    99     C11    4        9     $569,722   $560,000 225.0            98
C12    149   28   $1,770,268 $1,269,500    18.8    97     C12    3        -             -          -    -             -
C13     38   26     $687,545  $585,000     68.4    99     C13   17       11     $410,859   $429,000  64.7           100
C14    110   40     $770,850  $681,500     36.4    98     C14    -        -             -          -    -             -
C15    100   34     $693,568  $621,000     34.0   100     C15   33       12     $406,633   $407,500  36.4            98


     Condo Apartment                                                        Link
Area Act Sales Av. Price       Med. Price % S-A Av. % List Area Act      Sales Av. Price        Med. Price % S-A Av.% List
C01   1,029 349    $378,489    $340,000   33.9     98     C01        -     -            -               -     -        -
C02    130   30    $689,952    $440,056   23.1     98     C02        -     -            -               -     -        -
C03      37   8    $542,125    $453,500   21.6     98     C03        -     -            -               -     -        -
C04      51  21    $374,557    $325,000   41.2     97     C04        -     -            -               -     -        -
C06      32   5    $268,700    $280,000   15.6     98     C06        -     -            -               -     -        -
C07    198   67    $320,900    $299,000   33.8     98     C07        1     1     $455,000        $455,000 100.0       97
C08    420 161     $365,609    $340,000   38.3     98     C08        -     -            -               -     -        -
C09      34  18    $697,606    $504,500   52.9    100     C09        -     -            -               -     -        -
C10    108   49    $423,192    $400,000   45.4     99     C10        -     -            -               -     -        -
C11      29  15    $166,167    $145,000   51.7     97     C11        -     -            -               -     -        -
C12      25   9    $533,144    $472,500   36.0     98     C12        -     -            -               -     -        -
C13    132   41    $305,943    $282,000   31.1     98     C13        -     -            -               -     -        -
C14    359 104     $351,782    $331,000   29.0     98     C14        -     -            -               -     -        -
C15    191   37    $343,703    $312,000   19.4     97     C15        5     1     $455,000        $455,000  20.0       97


      Condo Townhouse                                           Detached Condo
Area Act Sales     Av. Price   Med. Price % S-A Av. % List Area Act Sales       Av. Price       Med. Price % S-A Av.% List
C01    63    45    $468,784     $369,000 71.4       99    C01    -         -                -           -      -           -
C02     8     2    $610,000     $610,000 25.0      100    C02    -         -                -           -      -           -
C03     4     -           -            -     -       -    C03    -         -                -           -      -           -
C04     4     1    $308,000     $308,000 25.0      100    C04    -         -                -           -      -           -
C06     1     1    $399,000     $399,000 100.0     100    C06    -         -                -           -      -           -
C07    27     3    $354,967     $364,900 11.1       97    C07    -         -                -           -      -           -
C08    12     7    $400,874     $363,000 58.3       99    C08    -         -                -           -      -           -
C09     5     2    $844,000     $844,000 40.0       95    C09    -         -                -           -      -           -
C10     7     9    $619,933     $639,000 128.6      98    C10    -         -                -           -      -           -
C11     6     1    $512,800     $512,800 16.7      103    C11    -         -                -           -      -           -
C12     7     6    $583,833     $555,000 85.7       98    C12    -         -                -           -      -           -
C13     4     1    $439,000     $439,000 25.0       98    C13    -         -                -           -      -           -
C14    33    14    $423,557     $407,000 42.4       98    C14    -         -                -           -      -           -
C15    61    22    $311,936     $315,500 36.1       98    C15    -         -                -           -      -           -


                                                                                TORONTO REAL ESTATE BOARD             11
SINGLE FAMILY CENTRAL BREAKDOWN - JuNE 2010                 Central District


        Co-op Apartment                                     Attached/Row/Townhouse
Area Act Sales       Av. Price   Med. Price % S-A Av. % List Area Act Sales      Av. Price   Med. Price % S-A Av. % List
C01     1       -           -            -     -      -    C01     28       13 $530,508     $519,000 46.4          100
C02     6       1    $250,000     $250,000 16.7      98    C02     29        7 $687,857     $760,000 24.1           98
C03     7       -           -            -     -      -    C03      3        -          -          -     -           -
C04     9       -           -            -     -      -    C04      1        1 $548,000     $548,000 100.0          98
C06     -       -           -            -     -      -    C06      3        -          -          -     -           -
C07     -       -           -            -     -      -    C07     11        5 $572,360     $580,000 45.5           97
C08     3       1    $255,000     $255,000 33.3     100    C08     20        7 $533,186     $508,000 35.0           98
C09     6       2    $558,500     $558,500 33.3      98    C09      1        1 $1,375,000 $1,375,000 100.0          99
C10     1       1    $229,000     $229,000 100.0     97    C10      4        -          -          -     -           -
C11     -       -           -            -     -      -    C11      2        1 $512,800     $512,800 50.0          103
C12     -       -           -            -     -      -    C12      -        -          -          -     -           -
C13     2       1    $360,000     $360,000 50.0      96    C13      -        2 $533,500     $533,500     -          98
C14     2       1    $153,000     $153,000 50.0      94    C14      9        3 $733,000     $625,000 33.3           97
C15     -       -           -            -     -      -    C15      -        -          -          -     -           -


                                                                                                  North District

                                           Current Month: June 2010
 Area       Active      New       Sales       $ Volume        Avg Price          Med Price     Avg DOM     Avg %List
 N01     189           128          73       $40,889,318         $560,128         $520,000           21            98
 N02     280           168          91       $39,363,999         $432,571         $399,000           25            98
 N03     501           317         175       $91,912,657         $525,215         $449,900           27            98
 N04     301           210         102       $55,376,500         $542,907         $535,000           23            98
 N05     261           141          71       $40,122,568         $565,107         $519,900           34            97
 N06     237           122          82       $40,971,800         $499,656         $383,000           34            97
 N07     262           191         148       $57,918,197         $391,339         $362,750           25            98
 N08     697           417         202      $110,814,928         $548,589         $481,000           23            98
 N10     255           133          75       $39,124,068         $521,654         $466,500           29            98
 N11     690           462         265      $136,870,913         $516,494         $450,000           24            98
 N12     154            79          49       $24,660,910         $503,284         $430,000           34            98
 N13     112            32          11        $7,794,554         $708,596         $475,000           59            97
 N14     172            58          30       $23,040,500         $768,017         $600,000           47            97
 N15     130            61          26       $10,867,800         $417,992         $378,750           43            97
 N16     151            58          39       $16,636,739         $426,583         $375,000           46            96
 N17     337           150          80       $25,072,775         $313,410         $265,000           50            97
 N18     158            78          43       $14,201,459         $330,266         $310,000           39            97
 N19     191            84          64       $19,969,300         $312,020         $272,500           56            97
 N20      40            12           7        $3,199,000         $457,000         $470,000           34            96
 N21      44             9           8        $3,145,400         $393,175         $377,000           54            98
 N22     107            34          24        $6,305,200         $262,717         $247,200           65            97
 N23     238            95          45       $13,832,000         $307,378         $280,000           47            97
 N24     138            47          16        $5,265,900         $329,119         $283,500           66            96
 TOTAL 5,645         3,086       1,726      $827,356,485         $479,349         $422,200           31            98


12    TORONTO REAL ESTATE BOARD
North District


                          North District                                                    North District
   80                     Days on Market                              80               Sales Active Listing Ratio

   60                                                                 60


   40                                                                 40


   20                                                                 20


    0                                                                  0
        Jun    Jul Aug Sep Oct Nov Dec Jan Feb Mar Apr May Jun             Jun   Jul Aug Sep Oct Nov Dec Jan Feb Mar Apr May Jun

        2009                                            2010               2009                                           2010


                                                    Year-to-Date: June 2010
Area          Listed       Sales            $ Volume             Avg Price            Med Price        Avg DOM         Avg %List
N01             755          400        $227,690,056             $569,225               $520,000                19            100
N02           1,092          546        $271,427,148             $497,119               $439,950                21             99
N03           2,310        1,220        $615,854,085             $504,798               $445,000                20             99
N04           1,315          616        $329,841,402             $535,457               $511,900                19             99
N05           1,015          455        $248,918,736             $547,074               $520,000                22             98
N06             915          522        $250,465,276             $479,819               $418,750                25             99
N07           1,282          817        $311,047,358             $380,719               $355,000                21             99
N08           2,794        1,434        $738,257,886             $514,824               $472,800                21             98
N10           1,001          457        $225,752,015             $493,987               $471,000                19            100
N11           2,935        1,548        $810,258,113             $523,423               $474,640                19            100
N12             528          283        $132,440,798             $467,989               $420,000                26             98
N13             211           67          $50,509,142            $753,868               $615,000                77             97
N14             358          156        $106,802,738             $684,633               $574,250                44             96
N15             334          154          $67,534,510            $438,536               $376,450                38             97
N16             398          197          $83,226,030            $422,467               $379,114                45             97
N17             903          471        $133,387,667             $283,201               $265,000                37             97
N18             471          255          $84,900,156            $332,942               $315,000                39             98
N19             487          274          $80,589,720            $294,123               $267,000                51             98
N20              82           39          $17,478,600            $448,169               $422,500                59             96
N21              98           50          $16,607,900            $332,158               $333,000                59             97
N22             267          133          $39,944,150            $300,332               $269,000                57             97
N23             554          236          $65,540,349            $277,713               $254,750                52             97
N24             273           82          $22,316,052            $272,147               $235,000                57             96
TOTAL         20,378      10,412       $4,930,789,887            $473,568               $429,000                26             99


                                                                                           TORONTO REAL ESTATE BOARD               13
SINGLE FAMILY NORTH BREAKDOWN - JuNE 2010                 North District


     Detached Houses                                        Semi-Detached Houses
Area Act Sales Av. Price     Med. Price % S-A Av. % List Area Act Sales Av. Price Med. Price % S-A Av. % List
N01   101    36   $762,501    $666,000   35.6     98    N01     4     3    $469,333   $453,000 75.0          98
N02   141    41   $568,383    $539,000   29.1     98    N02     2     1    $420,000   $420,000 50.0          98
N03   227    75   $787,151    $711,000   33.0     98    N03    12     7    $455,929   $480,000 58.3          98
N04   209    71   $601,501    $583,000   34.0     98    N04    11     3    $414,167   $453,000 27.3          98
N05   216    49   $643,550    $584,000   22.7     97    N05    11     5    $391,700   $392,000 45.5          97
N06   177    44   $615,986    $491,250   24.9     97    N06    19    10    $365,340   $359,450 52.6          99
N07   171    93   $446,703    $420,000   54.4     98    N07    32    17    $317,294   $322,500 53.1          99
N08   458   129   $642,791    $560,000   28.2     97    N08    71    35    $419,143   $425,000 49.3          98
N10   144    39   $637,694    $588,000   27.1     97    N10     9     1    $395,000   $395,000 11.1          98
N11   391   132   $665,723    $613,400   33.8     98    N11    58    29    $401,573   $400,000 50.0          98
N12   133    38   $550,563    $448,000   28.6     97    N12    12     7    $355,571   $361,000 58.3         100
N13   112    11   $708,596    $475,000    9.8     97    N13     -     -           -          -     -          -
N14   157    30   $768,017    $600,000   19.1     97    N14     1     -           -          -     -          -
N15   115    23   $440,430    $395,000   20.0     96    N15     -     -           -          -     -          -
N16   131    29   $473,697    $430,000   22.1     95    N16     -     -           -          -     -          -
N17   317    74   $320,646    $274,000   23.3     97    N17     7     1    $253,000   $253,000 14.3          99
N18   132    24   $388,236    $337,500   18.2     96    N18     5     7    $263,243   $243,000 140.0         98
N19   127    41   $328,995    $299,900   32.3     97    N19     4     1    $197,500   $197,500 25.0          94
N20    40     7   $457,000    $470,000   17.5     96    N20     -     -           -          -     -          -
N21    44     8   $393,175    $377,000   18.2     98    N21     -     -           -          -     -          -
N22    90    16   $283,563    $293,500   17.8     97    N22     1     1    $154,800   $154,800 100.0         97
N23   230    42   $316,750    $284,500   18.3     97    N23     -     -           -          -     -          -
N24   133    15   $335,027    $302,000   11.3     96    N24     -     -           -          -     -          -


     Condo Apartment                                                   Link
Area Act Sales Av. Price     Med. Price % S-A Av. % List Area Act   Sales Av. Price   Med. Price % S-A Av. % List
N01 46      14    $350,214    $310,500 30.4       99    N01     6      2   $524,500   $524,500 33.3        99
N02 106     33    $279,858    $276,000 31.1       97    N02     7      6   $379,000   $380,000 85.7        99
N03 180     55    $271,039    $273,250 30.6       98    N03     3      6   $462,984   $463,001 200.0       99
N04 32       7    $337,571    $205,000 21.9       96    N04     1      -          -          -     -        -
N05   1      -           -           -     -       -    N05     4      3   $466,333   $447,000 75.0        97
N06   6      4    $318,750    $312,500 66.7       94    N06     -      -          -          -     -        -
N07 17       8    $237,153    $209,500 47.1       99    N07     -      -          -          -     -        -
N08 79      12    $280,492    $282,500 15.2       97    N08     2      1   $450,000   $450,000 50.0        94
N10 29       4    $297,500    $290,500 13.8       98    N10    60     29   $410,827   $408,000 48.3        99
N11 114     32    $295,809    $270,250 28.1       98    N11    23     10   $452,560   $408,400 43.5        99
N12   3      -           -           -     -       -    N12     -      -          -          -     -        -
N13   -      -           -           -     -       -    N13     -      -          -          -     -        -
N14 11       -           -           -     -       -    N14     -      -          -          -     -        -
N15   -      -           -           -     -       -    N15     -      -          -          -     -        -
N16   9      3    $235,633    $220,000 33.3       98    N16     4      2   $330,807   $330,807 50.0        97
N17   1      1    $192,000    $192,000 100.0      96    N17     3      -          -          -     -        -
N18   2      2    $168,750    $168,750 100.0      98    N18    12      7   $297,143   $300,000 58.3        98
N19   9      1    $193,000    $193,000 11.1       94    N19     4      3   $244,667   $240,000 75.0        97
N20   -      -           -           -     -       -    N20     -      -          -          -     -        -
N21   -      -           -           -     -       -    N21     -      -          -          -     -        -
N22   -      -           -           -     -       -    N22     5      3   $223,667   $223,000 60.0        98
N23   -      -           -           -     -       -    N23     3      -          -          -     -        -
N24   -      -           -           -     -       -    N24     -      -          -          -     -        -


14    TORONTO REAL ESTATE BOARD
SINGLE FAMILY NORTH BREAKDOWN - JuNE 2010               North District


     Condo Townhouse                                       Detached Condo
Area Act Sales Av. Price Med. Price % S-A Av. % List Area Act Sales Av. Price         Med. Price % S-A Av. % List
N01   30   17    $327,018       $313,000 56.7      98    N01 -        -           -           -    -        -
N02   18    7    $374,714       $374,000 38.9      98    N02 1        -           -           -    -        -
N03   34   16    $327,469       $313,500 47.1      98    N03 -        -           -           -    -        -
N04    6    1    $320,000       $320,000 16.7      98    N04 -        -           -           -    -        -
N05    1    1    $318,000       $318,000 100.0     98    N05 -        -           -           -    -        -
N06   14    8    $414,438       $339,000 57.1      98    N06 -        -           -           -    -        -
N07   14   10    $271,468       $237,250 71.4      99    N07 -        -           -           -    -        -
N08    8    2    $316,500       $316,500 25.0      98    N08 -        -           -           -    -        -
N10    7    -           -              -     -      -    N10 -        -           -           -    -        -
N11   39   21    $365,143       $365,000 53.9      98    N11 -        1    $526,000    $526,000    -       99
N12    -    -           -              -     -      -    N12 1        -           -           -    -        -
N13    -    -           -              -     -      -    N13 -        -           -           -    -        -
N14    3    -           -              -     -      -    N14 -        -           -           -    -        -
N15    -    -           -              -     -      -    N15 -        -           -           -    -        -
N16    4    2    $281,000       $281,000 50.0      97    N16 -        -           -           -    -        -
N17    2    -           -              -     -      -    N17 -        -           -           -    -        -
N18    5    3    $207,867       $204,000 60.0      98    N18 -        -           -           -    -        -
N19    7    4    $206,125       $209,000 57.1      98    N19 22       8    $400,125    $432,500 36.4       98
N20    -    -           -              -     -      -    N20 -        -           -           -    -        -
N21    -    -           -              -     -      -    N21 -        -           -           -    -        -
N22    -    -           -              -     -      -    N22 -        -           -           -    -        -
N23    -    -           -              -     -      -    N23 -        -           -           -    -        -
N24    5    1    $240,500       $240,500 20.0      97    N24 -        -           -           -    -        -


     Co-op Apartment                                        Attached/Row/Townhouse
Area Act Sales Av. Price       Med. Price % S-A Av. % List Area Act Sales Av. Price Med. Price % S-A Av. % List
N01    -     -             -            -     -      -   N01    2    1     $520,000   $520,000 50.0       104
N02    -     -             -            -     -      -   N02    5    3     $502,667   $525,000 60.0        99
N03    -     -             -            -     -      -   N03   45   16     $422,519   $432,500 35.6        98
N04    1     -             -            -     -      -   N04   41   20     $437,220   $422,000 48.8        99
N05    -     -             -            -     -      -   N05   28   13     $377,932   $380,000 46.4        98
N06    -     -             -            -     -      -   N06   21   16     $351,531   $342,500 76.2        98
N07    -     -             -            -     -      -   N07   28   20     $318,445   $325,000 71.4        99
N08    -     -             -            -     -      -   N08   79   23     $381,565   $375,000 29.1        98
N10    -     -             -            -     -      -   N10    6    2     $377,500   $377,500 33.3       100
N11    1     -             -            -     -      -   N11   64   40     $379,110   $367,000 62.5        98
N12    -     -             -            -     -      -   N12    5    4     $312,625   $320,500 80.0        96
N13    -     -             -            -     -      -   N13    -    -            -          -     -        -
N14    -     -             -            -     -      -   N14    -    -            -          -     -        -
N15    -     -             -            -     -      -   N15   15    3     $245,967   $236,900 20.0        98
N16    -     -             -            -     -      -   N16    3    3     $323,000   $310,000 100.0       98
N17    -     -             -            -     -      -   N17    7    4     $225,000   $221,250 57.1        99
N18    -     -             -            -     -      -   N18    2    -            -          -     -        -
N19    -     -             -            -     -      -   N19   18    6     $221,750   $226,250 33.3        99
N20    -     -             -            -     -      -   N20    -    -            -          -     -        -
N21    -     -             -            -     -      -   N21    -    -            -          -     -        -
N22    -     -             -            -     -      -   N22   11    4     $235,600   $234,000 36.4        99
N23    -     -             -            -     -      -   N23    5    3     $176,167   $172,000 60.0        96
N24    -     -             -            -     -      -   N24    -    -            -          -     -        -


                                                                          TORONTO REAL ESTATE BOARD         15
District Totals
                                        New        Active         Listed                Sales                $ Volume          Avg Price            Med Price Avg DOM Avg Month
        Grand Total                15,086          23,923             N/A               8,442         3,672,555,141                 435,034            367,750                    27                 98
        Year                            N/A            N/A       95,882                50,455        21,901,229,135                 434,075            369,000                    23                 99


                                                                  Annual Summary - Single Family
               Year                 *Number of Sales                 *Average Price                              Year                *Number of Sales                      *Average Price
              1976                          19,025                     $61,389                                   2009
              1977                          20,512                     $64,559                                   January                          2,670                        $343,632
              1978                          21,184                     $67,333                                   February                          4,120                       $361,305
              1979                          23,466                     $70,830                                   March                            6,171                        $362,050
              1980                          26,017                     $75,694                                   April                            8,107                        $385,641
              1981                          29,625                     $90,203                                   May                              9,589                        $395,609
              1982                          25,336                     $95,496                                   June                             10,955                       $403,972
              1983                          30,046                    $101,626                                   July                             9,967                        $395,414
              1984                          31,905                    $102,318                                   August                           8,035                        $387,921
              1985                          45,509                    $109,094                                   September                         8,196                       $406,877
              1986                          52,919                    $138,925                                   October                          8,476                        $423,559
              1987                          43,475                    $189,105                                   November                          7,446                       $418,460
              1988                          49,381                    $229,635                                   December                          5,541                       $411,931
              1989                          38,960                    $273,698
              1990                          26,779                    $255,020                                   Total**                          87,308                       $395,460
              1991                          38,144                    $234,313
              1992                          41,703                    $214,971                                   2010
              1993                          38,990                    $206,490                                   January                          4,986                        $409,058
              1994                          44,237                    $208,921                                   February                          7,291                       $431,509
              1995                          39,273                    $203,028                                   March                            10,430                       $434,696
              1996                          55,779                    $198,150                                   April                            10,898                       $437,600
              1997                          58,014                    $211,307                                   May                              9,470                        $446,593
              1998                          55,344                    $216,815                                   June                             8,442                        $435,034
              1999                          58,957                    $228,372
              2000                          58,343                    $243,255                                   Year-to-Date**                   50,455                       $434,075
              2001                          67,612                    $251,508
              2002                          74,759                    $275,231
              2003                          78,898                    $293,067
              2004                          83,501                    $315,231
              2005                          84,145                    $335,907
              2006                          83,084                    $351,941
              2007                          93,193                    $376,236
              2008                          74,552                    $379,347
              * Due to District revisions, caution should be exercised when undertaking historical comparisons. Please refer to appropriate maps.
              **This figure may not equal the sum of all monthly totals, as the year-to-date total reflects sales reported in error and deals that have fallen through since January 1st.


                                                           Single Family Dwelling Sales Comparison

                                Sales                                                          Active Listings                                                     Average Price
15000                                                                                                                                    500000
                                                                    35000
13500
                                                                    30000
12000
                                                                                                                                         425000
10500                                                               25000
9000
                                                                    20000
7500                                                                                                                                     350000

6000                                                                15000

4500                                                                10000                                                                275000
3000
                                                                     5000
 1500
   0                                                                   0                                                                 200000
        Jun   Jul Aug Sep Oct Nov Dec Jan Feb Mar Apr May Jun               Jun   Jul Aug Sep Oct Nov Dec Jan Feb Mar Apr May Jun                 2000 2001 2002 2003 2004 2005 2006 2007 2008 2009 2010

        2009                                            2010                2009                                            2010


        16      TORONTO REAL ESTATE BOARD

More Related Content

What's hot

Toronto Real Estate Stats December 2009
Toronto Real Estate Stats December 2009Toronto Real Estate Stats December 2009
Toronto Real Estate Stats December 2009John Helfrich
 
Toronto real estate statistics may 2011
Toronto real estate statistics may 2011Toronto real estate statistics may 2011
Toronto real estate statistics may 2011John Helfrich
 
Treb Market Watch August 2010
Treb Market Watch August 2010Treb Market Watch August 2010
Treb Market Watch August 2010James Metcalfe
 
Market watch february 2011
Market watch february 2011Market watch february 2011
Market watch february 2011Jennifer Backus
 

What's hot (9)

Toronto Real Estate Stats December 2009
Toronto Real Estate Stats December 2009Toronto Real Estate Stats December 2009
Toronto Real Estate Stats December 2009
 
Market Watch April 2011
Market Watch April 2011Market Watch April 2011
Market Watch April 2011
 
Mw1011
Mw1011Mw1011
Mw1011
 
Toronto real estate statistics may 2011
Toronto real estate statistics may 2011Toronto real estate statistics may 2011
Toronto real estate statistics may 2011
 
MARKET WATCH FOR JUNE 2010
MARKET WATCH FOR JUNE 2010MARKET WATCH FOR JUNE 2010
MARKET WATCH FOR JUNE 2010
 
Treb Market Watch August 2010
Treb Market Watch August 2010Treb Market Watch August 2010
Treb Market Watch August 2010
 
Market watch february 2011
Market watch february 2011Market watch february 2011
Market watch february 2011
 
Market watch march 2011
Market watch march 2011Market watch march 2011
Market watch march 2011
 
22152reportfeb2011
22152reportfeb201122152reportfeb2011
22152reportfeb2011
 

Viewers also liked

Publicidad en internet
Publicidad en internetPublicidad en internet
Publicidad en internetbryannajk
 
Vaba tarkvara roll IKT õpetamisel (Margus Ernits)
Vaba tarkvara roll IKT õpetamisel (Margus Ernits) Vaba tarkvara roll IKT õpetamisel (Margus Ernits)
Vaba tarkvara roll IKT õpetamisel (Margus Ernits) Riigi Infosüsteemi Amet
 
Grad labour-market
Grad labour-marketGrad labour-market
Grad labour-marketJason Brown
 
Videophone manual eu_es
Videophone manual eu_esVideophone manual eu_es
Videophone manual eu_esacnsigno
 
PLAN DE COMPENSACIÓN ACN
PLAN DE COMPENSACIÓN ACNPLAN DE COMPENSACIÓN ACN
PLAN DE COMPENSACIÓN ACNacnsigno
 

Viewers also liked (8)

Publicidad en internet
Publicidad en internetPublicidad en internet
Publicidad en internet
 
Vaba tarkvara roll IKT õpetamisel (Margus Ernits)
Vaba tarkvara roll IKT õpetamisel (Margus Ernits) Vaba tarkvara roll IKT õpetamisel (Margus Ernits)
Vaba tarkvara roll IKT õpetamisel (Margus Ernits)
 
NZC - Bracke
NZC - BrackeNZC - Bracke
NZC - Bracke
 
Grad labour-market
Grad labour-marketGrad labour-market
Grad labour-market
 
Videophone manual eu_es
Videophone manual eu_esVideophone manual eu_es
Videophone manual eu_es
 
Programación lineal
Programación linealProgramación lineal
Programación lineal
 
PLAN DE COMPENSACIÓN ACN
PLAN DE COMPENSACIÓN ACNPLAN DE COMPENSACIÓN ACN
PLAN DE COMPENSACIÓN ACN
 
Save the globe
Save the globeSave the globe
Save the globe
 

Similar to Market watch june 2010

Toronto real estate statistics june 2011
Toronto real estate statistics june 2011Toronto real estate statistics june 2011
Toronto real estate statistics june 2011John Helfrich
 
Toronto real estate statistics july 2010
Toronto real estate statistics july 2010Toronto real estate statistics july 2010
Toronto real estate statistics july 2010John Helfrich
 
T R E B Market Watch Jan2010
T R E B Market Watch Jan2010T R E B Market Watch Jan2010
T R E B Market Watch Jan2010John Helfrich
 
2010 01 Toronto Mls Market Watch
2010 01  Toronto Mls Market Watch2010 01  Toronto Mls Market Watch
2010 01 Toronto Mls Market WatchSteven Silva
 
Toronto Market Trends
Toronto Market TrendsToronto Market Trends
Toronto Market TrendsLarrySage
 
Toronto housing stats market watch all neighbourhoods dec. 2010
Toronto housing stats market watch all neighbourhoods dec. 2010Toronto housing stats market watch all neighbourhoods dec. 2010
Toronto housing stats market watch all neighbourhoods dec. 2010James Metcalfe
 
Market watch december 2010
Market watch december 2010Market watch december 2010
Market watch december 2010Jennifer Backus
 
Market Watch December 2010 Toronto Homes Resale Statistics
Market Watch December 2010 Toronto Homes Resale StatisticsMarket Watch December 2010 Toronto Homes Resale Statistics
Market Watch December 2010 Toronto Homes Resale StatisticsJohn Helfrich
 
TREB Market Watch December 2010
TREB Market Watch December 2010TREB Market Watch December 2010
TREB Market Watch December 2010Harish Maraj
 
Toronto Market Trends
Toronto Market TrendsToronto Market Trends
Toronto Market TrendsLarrySage
 
Toronto Real Estate Market Watch Nov 09
Toronto Real Estate Market Watch Nov 09Toronto Real Estate Market Watch Nov 09
Toronto Real Estate Market Watch Nov 09Joseph Bitton
 
Market watch january 2011
Market watch january 2011Market watch january 2011
Market watch january 2011Jennifer Backus
 
Toronto real estate statistics april 2011
Toronto real estate statistics april 2011Toronto real estate statistics april 2011
Toronto real estate statistics april 2011John Helfrich
 
Toronto Real Estate Statistics February 2011
Toronto Real Estate Statistics February 2011Toronto Real Estate Statistics February 2011
Toronto Real Estate Statistics February 2011John Helfrich
 
Toronto real estate statistics march 2011
Toronto real estate statistics march 2011Toronto real estate statistics march 2011
Toronto real estate statistics march 2011John Helfrich
 
Toronto real estate statistics november 2010
Toronto real estate statistics november 2010Toronto real estate statistics november 2010
Toronto real estate statistics november 2010John Helfrich
 
Market watch august 2010
Market watch august 2010Market watch august 2010
Market watch august 2010John Helfrich
 
September's Newsletter
September's NewsletterSeptember's Newsletter
September's NewsletterFabio Recine
 

Similar to Market watch june 2010 (20)

Toronto real estate statistics june 2011
Toronto real estate statistics june 2011Toronto real estate statistics june 2011
Toronto real estate statistics june 2011
 
Toronto real estate statistics july 2010
Toronto real estate statistics july 2010Toronto real estate statistics july 2010
Toronto real estate statistics july 2010
 
Mw1007 pdf
Mw1007 pdfMw1007 pdf
Mw1007 pdf
 
T R E B Market Watch Jan2010
T R E B Market Watch Jan2010T R E B Market Watch Jan2010
T R E B Market Watch Jan2010
 
2010 01 Toronto Mls Market Watch
2010 01  Toronto Mls Market Watch2010 01  Toronto Mls Market Watch
2010 01 Toronto Mls Market Watch
 
Toronto Market Trends
Toronto Market TrendsToronto Market Trends
Toronto Market Trends
 
Toronto housing stats market watch all neighbourhoods dec. 2010
Toronto housing stats market watch all neighbourhoods dec. 2010Toronto housing stats market watch all neighbourhoods dec. 2010
Toronto housing stats market watch all neighbourhoods dec. 2010
 
Market watch december 2010
Market watch december 2010Market watch december 2010
Market watch december 2010
 
Market Watch December 2010 Toronto Homes Resale Statistics
Market Watch December 2010 Toronto Homes Resale StatisticsMarket Watch December 2010 Toronto Homes Resale Statistics
Market Watch December 2010 Toronto Homes Resale Statistics
 
TREB Market Watch December 2010
TREB Market Watch December 2010TREB Market Watch December 2010
TREB Market Watch December 2010
 
Toronto Market Trends
Toronto Market TrendsToronto Market Trends
Toronto Market Trends
 
Toronto Real Estate Market Watch Nov 09
Toronto Real Estate Market Watch Nov 09Toronto Real Estate Market Watch Nov 09
Toronto Real Estate Market Watch Nov 09
 
Market watch january 2011
Market watch january 2011Market watch january 2011
Market watch january 2011
 
Toronto real estate statistics april 2011
Toronto real estate statistics april 2011Toronto real estate statistics april 2011
Toronto real estate statistics april 2011
 
Toronto Real Estate Statistics February 2011
Toronto Real Estate Statistics February 2011Toronto Real Estate Statistics February 2011
Toronto Real Estate Statistics February 2011
 
TREB
TREBTREB
TREB
 
Toronto real estate statistics march 2011
Toronto real estate statistics march 2011Toronto real estate statistics march 2011
Toronto real estate statistics march 2011
 
Toronto real estate statistics november 2010
Toronto real estate statistics november 2010Toronto real estate statistics november 2010
Toronto real estate statistics november 2010
 
Market watch august 2010
Market watch august 2010Market watch august 2010
Market watch august 2010
 
September's Newsletter
September's NewsletterSeptember's Newsletter
September's Newsletter
 

More from John Helfrich

Toronto real estate statistics january 2012
Toronto real estate statistics january 2012Toronto real estate statistics january 2012
Toronto real estate statistics january 2012John Helfrich
 
Toronto real estate statistics charts january 2012
Toronto real estate statistics charts january 2012Toronto real estate statistics charts january 2012
Toronto real estate statistics charts january 2012John Helfrich
 
Toronto condo market statistical report Q4 2011
Toronto condo market statistical report Q4 2011Toronto condo market statistical report Q4 2011
Toronto condo market statistical report Q4 2011John Helfrich
 
Toronto real estate statistics December 2011
Toronto real estate statistics December 2011Toronto real estate statistics December 2011
Toronto real estate statistics December 2011John Helfrich
 
John Helfrich Real Estate Newsletter January February 2012
John Helfrich Real Estate Newsletter January February 2012John Helfrich Real Estate Newsletter January February 2012
John Helfrich Real Estate Newsletter January February 2012John Helfrich
 
Toronto real estate statistics november 2011
Toronto real estate statistics november 2011Toronto real estate statistics november 2011
Toronto real estate statistics november 2011John Helfrich
 
Toronto real estate statistics October 2011
Toronto real estate statistics October 2011Toronto real estate statistics October 2011
Toronto real estate statistics October 2011John Helfrich
 
Toronto condo market statistical report 2011
Toronto condo market statistical report 2011Toronto condo market statistical report 2011
Toronto condo market statistical report 2011John Helfrich
 
Toronto EAST Real Estate statistics september 2011
Toronto EAST Real Estate statistics september 2011Toronto EAST Real Estate statistics september 2011
Toronto EAST Real Estate statistics september 2011John Helfrich
 
Toronto Real Estate Statistics september 2011
Toronto Real Estate Statistics september 2011Toronto Real Estate Statistics september 2011
Toronto Real Estate Statistics september 2011John Helfrich
 
Toronto Air Quality Study - Toronto Environment Office
Toronto Air Quality Study - Toronto Environment OfficeToronto Air Quality Study - Toronto Environment Office
Toronto Air Quality Study - Toronto Environment OfficeJohn Helfrich
 
Toronto real estate statistics chart august 2011
Toronto real estate statistics chart august 2011Toronto real estate statistics chart august 2011
Toronto real estate statistics chart august 2011John Helfrich
 
Toronto real estate statistics august 2011
Toronto real estate statistics august 2011Toronto real estate statistics august 2011
Toronto real estate statistics august 2011John Helfrich
 
Toronto real estate statistics charts july 2011
Toronto real estate statistics charts july 2011Toronto real estate statistics charts july 2011
Toronto real estate statistics charts july 2011John Helfrich
 
Toronto real estate statistics july 2011
Toronto real estate statistics july 2011Toronto real estate statistics july 2011
Toronto real estate statistics july 2011John Helfrich
 
Toronto real estate statistics charts april 2011
Toronto real estate statistics charts april 2011Toronto real estate statistics charts april 2011
Toronto real estate statistics charts april 2011John Helfrich
 
Toronto Real Estate Statistics October 2010
Toronto Real Estate Statistics October 2010Toronto Real Estate Statistics October 2010
Toronto Real Estate Statistics October 2010John Helfrich
 
Toronto Real Estate Statistics September 2010
Toronto Real Estate Statistics September 2010Toronto Real Estate Statistics September 2010
Toronto Real Estate Statistics September 2010John Helfrich
 

More from John Helfrich (18)

Toronto real estate statistics january 2012
Toronto real estate statistics january 2012Toronto real estate statistics january 2012
Toronto real estate statistics january 2012
 
Toronto real estate statistics charts january 2012
Toronto real estate statistics charts january 2012Toronto real estate statistics charts january 2012
Toronto real estate statistics charts january 2012
 
Toronto condo market statistical report Q4 2011
Toronto condo market statistical report Q4 2011Toronto condo market statistical report Q4 2011
Toronto condo market statistical report Q4 2011
 
Toronto real estate statistics December 2011
Toronto real estate statistics December 2011Toronto real estate statistics December 2011
Toronto real estate statistics December 2011
 
John Helfrich Real Estate Newsletter January February 2012
John Helfrich Real Estate Newsletter January February 2012John Helfrich Real Estate Newsletter January February 2012
John Helfrich Real Estate Newsletter January February 2012
 
Toronto real estate statistics november 2011
Toronto real estate statistics november 2011Toronto real estate statistics november 2011
Toronto real estate statistics november 2011
 
Toronto real estate statistics October 2011
Toronto real estate statistics October 2011Toronto real estate statistics October 2011
Toronto real estate statistics October 2011
 
Toronto condo market statistical report 2011
Toronto condo market statistical report 2011Toronto condo market statistical report 2011
Toronto condo market statistical report 2011
 
Toronto EAST Real Estate statistics september 2011
Toronto EAST Real Estate statistics september 2011Toronto EAST Real Estate statistics september 2011
Toronto EAST Real Estate statistics september 2011
 
Toronto Real Estate Statistics september 2011
Toronto Real Estate Statistics september 2011Toronto Real Estate Statistics september 2011
Toronto Real Estate Statistics september 2011
 
Toronto Air Quality Study - Toronto Environment Office
Toronto Air Quality Study - Toronto Environment OfficeToronto Air Quality Study - Toronto Environment Office
Toronto Air Quality Study - Toronto Environment Office
 
Toronto real estate statistics chart august 2011
Toronto real estate statistics chart august 2011Toronto real estate statistics chart august 2011
Toronto real estate statistics chart august 2011
 
Toronto real estate statistics august 2011
Toronto real estate statistics august 2011Toronto real estate statistics august 2011
Toronto real estate statistics august 2011
 
Toronto real estate statistics charts july 2011
Toronto real estate statistics charts july 2011Toronto real estate statistics charts july 2011
Toronto real estate statistics charts july 2011
 
Toronto real estate statistics july 2011
Toronto real estate statistics july 2011Toronto real estate statistics july 2011
Toronto real estate statistics july 2011
 
Toronto real estate statistics charts april 2011
Toronto real estate statistics charts april 2011Toronto real estate statistics charts april 2011
Toronto real estate statistics charts april 2011
 
Toronto Real Estate Statistics October 2010
Toronto Real Estate Statistics October 2010Toronto Real Estate Statistics October 2010
Toronto Real Estate Statistics October 2010
 
Toronto Real Estate Statistics September 2010
Toronto Real Estate Statistics September 2010Toronto Real Estate Statistics September 2010
Toronto Real Estate Statistics September 2010
 

Recently uploaded

Global Scenario On Sustainable and Resilient Coconut Industry by Dr. Jelfina...
Global Scenario On Sustainable  and Resilient Coconut Industry by Dr. Jelfina...Global Scenario On Sustainable  and Resilient Coconut Industry by Dr. Jelfina...
Global Scenario On Sustainable and Resilient Coconut Industry by Dr. Jelfina...ictsugar
 
8447779800, Low rate Call girls in Uttam Nagar Delhi NCR
8447779800, Low rate Call girls in Uttam Nagar Delhi NCR8447779800, Low rate Call girls in Uttam Nagar Delhi NCR
8447779800, Low rate Call girls in Uttam Nagar Delhi NCRashishs7044
 
Independent Call Girls Andheri Nightlaila 9967584737
Independent Call Girls Andheri Nightlaila 9967584737Independent Call Girls Andheri Nightlaila 9967584737
Independent Call Girls Andheri Nightlaila 9967584737Riya Pathan
 
Ten Organizational Design Models to align structure and operations to busines...
Ten Organizational Design Models to align structure and operations to busines...Ten Organizational Design Models to align structure and operations to busines...
Ten Organizational Design Models to align structure and operations to busines...Seta Wicaksana
 
Digital Transformation in the PLM domain - distrib.pdf
Digital Transformation in the PLM domain - distrib.pdfDigital Transformation in the PLM domain - distrib.pdf
Digital Transformation in the PLM domain - distrib.pdfJos Voskuil
 
Call Girls in DELHI Cantt, ( Call Me )-8377877756-Female Escort- In Delhi / Ncr
Call Girls in DELHI Cantt, ( Call Me )-8377877756-Female Escort- In Delhi / NcrCall Girls in DELHI Cantt, ( Call Me )-8377877756-Female Escort- In Delhi / Ncr
Call Girls in DELHI Cantt, ( Call Me )-8377877756-Female Escort- In Delhi / Ncrdollysharma2066
 
8447779800, Low rate Call girls in Kotla Mubarakpur Delhi NCR
8447779800, Low rate Call girls in Kotla Mubarakpur Delhi NCR8447779800, Low rate Call girls in Kotla Mubarakpur Delhi NCR
8447779800, Low rate Call girls in Kotla Mubarakpur Delhi NCRashishs7044
 
Marketplace and Quality Assurance Presentation - Vincent Chirchir
Marketplace and Quality Assurance Presentation - Vincent ChirchirMarketplace and Quality Assurance Presentation - Vincent Chirchir
Marketplace and Quality Assurance Presentation - Vincent Chirchirictsugar
 
Case study on tata clothing brand zudio in detail
Case study on tata clothing brand zudio in detailCase study on tata clothing brand zudio in detail
Case study on tata clothing brand zudio in detailAriel592675
 
IoT Insurance Observatory: summary 2024
IoT Insurance Observatory:  summary 2024IoT Insurance Observatory:  summary 2024
IoT Insurance Observatory: summary 2024Matteo Carbone
 
International Business Environments and Operations 16th Global Edition test b...
International Business Environments and Operations 16th Global Edition test b...International Business Environments and Operations 16th Global Edition test b...
International Business Environments and Operations 16th Global Edition test b...ssuserf63bd7
 
Market Sizes Sample Report - 2024 Edition
Market Sizes Sample Report - 2024 EditionMarket Sizes Sample Report - 2024 Edition
Market Sizes Sample Report - 2024 EditionMintel Group
 
Youth Involvement in an Innovative Coconut Value Chain by Mwalimu Menza
Youth Involvement in an Innovative Coconut Value Chain by Mwalimu MenzaYouth Involvement in an Innovative Coconut Value Chain by Mwalimu Menza
Youth Involvement in an Innovative Coconut Value Chain by Mwalimu Menzaictsugar
 
8447779800, Low rate Call girls in Rohini Delhi NCR
8447779800, Low rate Call girls in Rohini Delhi NCR8447779800, Low rate Call girls in Rohini Delhi NCR
8447779800, Low rate Call girls in Rohini Delhi NCRashishs7044
 
Kenya Coconut Production Presentation by Dr. Lalith Perera
Kenya Coconut Production Presentation by Dr. Lalith PereraKenya Coconut Production Presentation by Dr. Lalith Perera
Kenya Coconut Production Presentation by Dr. Lalith Pereraictsugar
 
Ms Motilal Padampat Sugar Mills vs. State of Uttar Pradesh & Ors. - A Milesto...
Ms Motilal Padampat Sugar Mills vs. State of Uttar Pradesh & Ors. - A Milesto...Ms Motilal Padampat Sugar Mills vs. State of Uttar Pradesh & Ors. - A Milesto...
Ms Motilal Padampat Sugar Mills vs. State of Uttar Pradesh & Ors. - A Milesto...ShrutiBose4
 
Flow Your Strategy at Flight Levels Day 2024
Flow Your Strategy at Flight Levels Day 2024Flow Your Strategy at Flight Levels Day 2024
Flow Your Strategy at Flight Levels Day 2024Kirill Klimov
 
8447779800, Low rate Call girls in Tughlakabad Delhi NCR
8447779800, Low rate Call girls in Tughlakabad Delhi NCR8447779800, Low rate Call girls in Tughlakabad Delhi NCR
8447779800, Low rate Call girls in Tughlakabad Delhi NCRashishs7044
 
Investment in The Coconut Industry by Nancy Cheruiyot
Investment in The Coconut Industry by Nancy CheruiyotInvestment in The Coconut Industry by Nancy Cheruiyot
Investment in The Coconut Industry by Nancy Cheruiyotictsugar
 

Recently uploaded (20)

Global Scenario On Sustainable and Resilient Coconut Industry by Dr. Jelfina...
Global Scenario On Sustainable  and Resilient Coconut Industry by Dr. Jelfina...Global Scenario On Sustainable  and Resilient Coconut Industry by Dr. Jelfina...
Global Scenario On Sustainable and Resilient Coconut Industry by Dr. Jelfina...
 
8447779800, Low rate Call girls in Uttam Nagar Delhi NCR
8447779800, Low rate Call girls in Uttam Nagar Delhi NCR8447779800, Low rate Call girls in Uttam Nagar Delhi NCR
8447779800, Low rate Call girls in Uttam Nagar Delhi NCR
 
Independent Call Girls Andheri Nightlaila 9967584737
Independent Call Girls Andheri Nightlaila 9967584737Independent Call Girls Andheri Nightlaila 9967584737
Independent Call Girls Andheri Nightlaila 9967584737
 
Ten Organizational Design Models to align structure and operations to busines...
Ten Organizational Design Models to align structure and operations to busines...Ten Organizational Design Models to align structure and operations to busines...
Ten Organizational Design Models to align structure and operations to busines...
 
Digital Transformation in the PLM domain - distrib.pdf
Digital Transformation in the PLM domain - distrib.pdfDigital Transformation in the PLM domain - distrib.pdf
Digital Transformation in the PLM domain - distrib.pdf
 
Call Girls in DELHI Cantt, ( Call Me )-8377877756-Female Escort- In Delhi / Ncr
Call Girls in DELHI Cantt, ( Call Me )-8377877756-Female Escort- In Delhi / NcrCall Girls in DELHI Cantt, ( Call Me )-8377877756-Female Escort- In Delhi / Ncr
Call Girls in DELHI Cantt, ( Call Me )-8377877756-Female Escort- In Delhi / Ncr
 
8447779800, Low rate Call girls in Kotla Mubarakpur Delhi NCR
8447779800, Low rate Call girls in Kotla Mubarakpur Delhi NCR8447779800, Low rate Call girls in Kotla Mubarakpur Delhi NCR
8447779800, Low rate Call girls in Kotla Mubarakpur Delhi NCR
 
Marketplace and Quality Assurance Presentation - Vincent Chirchir
Marketplace and Quality Assurance Presentation - Vincent ChirchirMarketplace and Quality Assurance Presentation - Vincent Chirchir
Marketplace and Quality Assurance Presentation - Vincent Chirchir
 
Case study on tata clothing brand zudio in detail
Case study on tata clothing brand zudio in detailCase study on tata clothing brand zudio in detail
Case study on tata clothing brand zudio in detail
 
Call Us ➥9319373153▻Call Girls In North Goa
Call Us ➥9319373153▻Call Girls In North GoaCall Us ➥9319373153▻Call Girls In North Goa
Call Us ➥9319373153▻Call Girls In North Goa
 
IoT Insurance Observatory: summary 2024
IoT Insurance Observatory:  summary 2024IoT Insurance Observatory:  summary 2024
IoT Insurance Observatory: summary 2024
 
International Business Environments and Operations 16th Global Edition test b...
International Business Environments and Operations 16th Global Edition test b...International Business Environments and Operations 16th Global Edition test b...
International Business Environments and Operations 16th Global Edition test b...
 
Market Sizes Sample Report - 2024 Edition
Market Sizes Sample Report - 2024 EditionMarket Sizes Sample Report - 2024 Edition
Market Sizes Sample Report - 2024 Edition
 
Youth Involvement in an Innovative Coconut Value Chain by Mwalimu Menza
Youth Involvement in an Innovative Coconut Value Chain by Mwalimu MenzaYouth Involvement in an Innovative Coconut Value Chain by Mwalimu Menza
Youth Involvement in an Innovative Coconut Value Chain by Mwalimu Menza
 
8447779800, Low rate Call girls in Rohini Delhi NCR
8447779800, Low rate Call girls in Rohini Delhi NCR8447779800, Low rate Call girls in Rohini Delhi NCR
8447779800, Low rate Call girls in Rohini Delhi NCR
 
Kenya Coconut Production Presentation by Dr. Lalith Perera
Kenya Coconut Production Presentation by Dr. Lalith PereraKenya Coconut Production Presentation by Dr. Lalith Perera
Kenya Coconut Production Presentation by Dr. Lalith Perera
 
Ms Motilal Padampat Sugar Mills vs. State of Uttar Pradesh & Ors. - A Milesto...
Ms Motilal Padampat Sugar Mills vs. State of Uttar Pradesh & Ors. - A Milesto...Ms Motilal Padampat Sugar Mills vs. State of Uttar Pradesh & Ors. - A Milesto...
Ms Motilal Padampat Sugar Mills vs. State of Uttar Pradesh & Ors. - A Milesto...
 
Flow Your Strategy at Flight Levels Day 2024
Flow Your Strategy at Flight Levels Day 2024Flow Your Strategy at Flight Levels Day 2024
Flow Your Strategy at Flight Levels Day 2024
 
8447779800, Low rate Call girls in Tughlakabad Delhi NCR
8447779800, Low rate Call girls in Tughlakabad Delhi NCR8447779800, Low rate Call girls in Tughlakabad Delhi NCR
8447779800, Low rate Call girls in Tughlakabad Delhi NCR
 
Investment in The Coconut Industry by Nancy Cheruiyot
Investment in The Coconut Industry by Nancy CheruiyotInvestment in The Coconut Industry by Nancy Cheruiyot
Investment in The Coconut Industry by Nancy Cheruiyot
 

Market watch june 2010

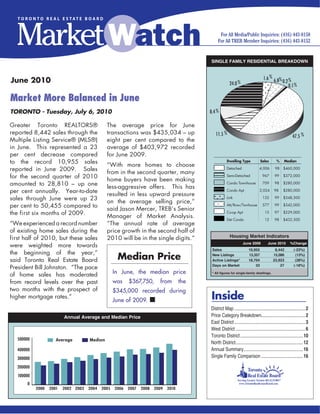
  • 1. SINGLE FAMILY RESIDENTIAL BREAKDOWN 1.6 % 6.8% % June 2010 24.0 % 0.2 0.1 % Market More Balanced in June TORONTO - Tuesday, July 6, 2010 8.4 % Greater Toronto REALTORS® The average price for June reported 8,442 sales through the transactions was $435,034 – up 11.5 % 47.5 % Multiple Listing Service® (MLS®) eight per cent compared to the in June. This represented a 23 average of $403,972 recorded per cent decrease compared for June 2009. to the record 10,955 sales 2.3 % Dwelling Type Sales % Median “With more homes to 7.0 0.3 % % % 21.5 % choose 0.1 reported in June 2009. Sales Single Detached 4,006 Detached 98 $460,000 from in the second quarter, many for the second quarter of 2010 Semi Detached Semi-Detached 967 99 $372,000 home buyers have been making Condo T.H. amounted to 28,810 – up one Condo Townhouse 709 98 $280,000 less-aggressive offers. This has per cent annually. Year-to-date Condo Apt. Condo Apt 2,024 98 $280,000 8.5 % resulted in less upward pressure Link sales through June were up 23 Link 132 99 $348,500 on the average selling price,” Attached/Row per cent to 50,455 compared to Att/Row/Twnhouse 577 99 $342,000 said Jason Mercer, TREB’s Senior Co-op Apt. the first six months of 2009. 12.0 % 48.3 % Co-op Apt 15 97 $229,000 Manager of Market Analysis. Detached Condo Det Condo 12 98 $432,500 “We experienced a record number “The annual rate of average of existing home sales during the price growth in the second half of first half of 2010, but these sales 2010 will be in the single digits.” Housing Market Indicators June 2009 June 2010 %Change were weighted more towards Sales 10,955 8,442 (-23%) the beginning of the year,” said Toronto Real Estate Board Median Price New Listings Active Listings* 13,357 18,704 15,086 23,923 (13%) (28%) Days on Market 33 27 (-18%) President Bill Johnston. “The pace of home sales has moderated In June, the median price * All figures for single-family dwellings. from record levels over the past was $367,750, from the two months with the prospect of $345,000 recorded during higher mortgage rates.” June of 2009. n Inside District Map ............................................................. 2 Annual Average and Median Price Price Category Breakdown......................................2 East District ............................................................. 3 West District ............................................................ 6 Toronto District ......................................................10 500000 Average Median North District..........................................................12 400000 Annual Summary ...................................................16 300000 Single Family Comparison ....................................16 200000 100000 0 2000 2001 2002 2003 2004 2005 2006 2007 2008 2009 2010
  • 2. District Map Price Category Breakdown - June 2010 Price Range Total S.F.D %S.F.D Condo Apt. %Condo Apt. Condo T.H. %Condo T.H. - - $90,000 27 0.3 13 0.6 4 0.6 $90,001 - $100,000 14 0.2 13 0.6 - - $100,001 - $110,000 14 0.2 9 0.4 - - $110,001 - $120,000 20 0.2 16 0.8 3 0.4 $120,001 - $130,000 24 0.3 18 0.9 6 0.8 $130,001 - $140,000 51 0.6 35 1.7 8 1.1 $140,001 - $150,000 50 0.6 36 1.8 9 1.3 $150,001 - $160,000 54 0.6 35 1.7 9 1.3 $160,001 - $170,000 80 0.9 53 2.6 12 1.7 $170,001 - $180,000 87 1.0 48 2.4 18 2.5 $180,001 - $190,000 136 1.6 68 3.4 29 4.1 $190,001 - $200,000 125 1.5 71 3.5 22 3.1 $200,001 - $225,000 320 3.8 170 8.4 66 9.3 $225,001 - $250,000 443 5.2 189 9.3 67 9.4 $250,001 - $300,000 1,081 12.8 420 20.8 158 22.3 $300,001 - $400,000 2,422 28.7 502 24.8 223 31.5 $400,001 - $500,000 1,460 17.3 202 10.0 38 5.4 $500,001 - $750,000 1,387 16.4 93 4.6 28 3.9 $750,001 - $1,000,000 341 4.0 15 0.7 6 0.8 $1,000,001 - $1,500,000 200 2.4 11 0.5 2 0.3 $1,500,001 - - 106 1.3 7 0.3 1 0.1 Total: 8,442 100 2,024 100 709 100 2 TORONTO REAL ESTATE BOARD
  • 3. East District Current Month: June 2010 Area Active New Sales $ Volume Avg Price Med Price Avg DOM Avg %List E01 174 167 108 $51,476,549 $476,635 $442,000 17 101 E02 154 141 74 $43,270,610 $584,738 $519,500 13 99 E03 272 232 132 $52,753,204 $399,645 $404,000 17 99 E04 250 177 96 $28,203,900 $293,791 $305,500 27 98 E05 273 173 102 $35,246,488 $345,554 $326,500 25 97 E06 131 102 49 $18,745,050 $382,552 $345,000 28 97 E07 223 154 98 $31,403,930 $320,448 $324,150 23 97 E08 279 159 80 $25,473,950 $318,424 $335,000 22 97 E09 369 226 113 $32,645,190 $288,895 $282,000 26 98 E10 114 91 63 $25,051,600 $397,644 $380,000 30 98 E11 312 190 111 $33,094,212 $298,146 $306,000 26 98 E12 67 46 24 $8,263,700 $344,321 $291,750 28 98 E13 255 189 115 $38,658,650 $336,162 $315,000 25 98 E14 358 269 171 $57,217,298 $334,604 $318,000 24 98 E15 352 283 148 $46,412,500 $313,598 $305,000 23 98 E16 688 414 227 $55,320,450 $243,702 $231,000 30 97 E17 303 211 120 $30,461,930 $253,849 $241,500 32 98 E18 31 9 7 $4,053,000 $579,000 $355,000 34 95 E19 101 63 41 $16,567,250 $404,079 $357,000 34 98 E20 132 62 32 $9,674,250 $302,320 $287,950 62 97 E21 174 69 35 $13,306,400 $380,183 $338,000 44 96 TOTAL 5,012 3,427 1,946 $657,300,111 $337,770 $318,000 26 98 Year-to-Date: June 2010 Area Listed Sales $ Volume Avg Price Med Price Avg DOM Avg %List E01 969 510 $250,666,506 $491,503 $461,000 14 103 E02 881 505 $307,502,717 $608,916 $547,000 13 102 E03 1,379 728 $306,070,303 $420,426 $411,000 17 101 E04 1,038 511 $151,314,516 $296,115 $315,000 23 99 E05 1,089 588 $199,573,311 $339,410 $310,000 20 100 E06 629 321 $131,927,774 $410,990 $359,000 18 102 E07 991 524 $177,278,504 $338,318 $345,000 21 100 E08 980 483 $152,204,835 $315,124 $327,000 22 99 E09 1,399 765 $210,565,993 $275,250 $265,000 23 99 E10 573 327 $131,288,873 $401,495 $385,000 20 99 E11 1,169 610 $184,062,675 $301,742 $299,950 25 98 E12 271 137 $45,057,933 $328,890 $292,533 24 98 E13 1,129 600 $209,040,723 $348,401 $330,000 22 99 E14 1,854 1,076 $357,530,677 $332,278 $317,000 21 99 E15 1,701 947 $300,115,724 $316,912 $305,000 20 99 E16 2,623 1,355 $314,452,467 $232,068 $224,000 29 97 E17 1,232 709 $184,215,213 $259,824 $247,000 28 98 E18 75 30 $17,428,900 $580,963 $453,750 49 95 E19 442 242 $93,142,419 $384,886 $351,000 28 98 E20 352 159 $47,978,650 $301,753 $275,000 49 97 E21 459 216 $73,446,934 $340,032 $308,800 45 96 TOTAL 21,235 11,343 $3,844,865,647 $338,964 $314,000 23 99 TORONTO REAL ESTATE BOARD 3
  • 4. SINGLE FAMILY EAST BREAKDOWN - JuNE 2010 East District East District East District 80 Days on Market 80 Sales Active Listing Ratio 60 60 40 40 20 20 0 0 Jun Jul Aug Sep Oct Nov Dec Jan Feb Mar Apr May Jun Jun Jul Aug Sep Oct Nov Dec Jan Fab Mar Apr May Jun 2009 2010 2009 2010 Detached Houses Semi-Detached Houses Area Act Sales Av. Price Med. Price % S-A Av. % List Area Act Sales Av. Price Med. Price % S-A Av. % List E01 31 23 $529,585 $450,000 74.2 101 E01 61 58 $475,772 $441,000 95.1 101 E02 62 29 $723,083 $650,000 46.8 100 E02 57 33 $525,979 $475,950 57.9 99 E03 131 59 $452,469 $425,000 45.0 99 E03 52 36 $480,564 $478,000 69.2 101 E04 107 45 $380,853 $375,000 42.1 98 E04 15 4 $313,850 $285,500 26.7 94 E05 90 36 $487,594 $466,500 40.0 98 E05 15 5 $360,200 $350,000 33.3 99 E06 101 40 $383,789 $345,750 39.6 97 E06 17 3 $371,667 $345,000 17.7 100 E07 85 38 $435,883 $416,500 44.7 98 E07 16 10 $330,880 $329,000 62.5 97 E08 144 47 $400,501 $365,000 32.6 97 E08 6 5 $312,100 $285,000 83.3 97 E09 94 49 $358,898 $348,000 52.1 98 E09 5 4 $304,125 $323,250 80.0 98 E10 89 44 $453,102 $431,500 49.4 98 E10 5 - - - - - E11 96 39 $402,952 $405,000 40.6 99 E11 31 16 $346,456 $362,500 51.6 98 E12 38 16 $390,481 $317,950 42.1 98 E12 4 2 $262,000 $262,000 50.0 100 E13 161 60 $422,502 $394,250 37.3 99 E13 10 10 $281,050 $272,250 100.0 98 E14 250 118 $366,226 $352,250 47.2 98 E14 21 13 $287,377 $280,000 61.9 100 E15 247 92 $355,623 $339,000 37.3 98 E15 10 5 $236,000 $239,000 50.0 98 E16 508 164 $270,069 $255,000 32.3 97 E16 63 29 $185,757 $183,600 46.0 97 E17 221 74 $282,453 $262,500 33.5 98 E17 7 4 $180,625 $179,500 57.1 98 E18 31 7 $579,000 $355,000 22.6 95 E18 - - - - - - E19 93 31 $447,624 $388,000 33.3 97 E19 - - - - - - E20 113 31 $303,202 $289,900 27.4 97 E20 - - - - - - E21 173 33 $387,770 $350,000 19.1 96 E21 1 1 $235,000 $235,000 100.0 98 4 TORONTO REAL ESTATE BOARD
  • 5. SINGLE FAMILY EAST BREAKDOWN - JuNE 2010 East District Condo Apartment Link Area Act Sales Av. Price Med. Price % S-A Av. % List Area Act Sales Av. Price Med. Price % S-A Av. % List E01 40 11 $412,764 $379,000 27.5 103 E01 - - - - - - E02 12 4 $432,475 $421,450 33.3 98 E02 - - - - - - E03 73 31 $224,177 $171,500 42.5 96 E03 - - - - - - E04 95 34 $182,935 $190,000 35.8 97 E04 - - - - - - E05 113 40 $249,445 $248,500 35.4 96 E05 8 1 $348,000 $348,000 12.5 97 E06 7 3 $244,500 $225,000 42.9 96 E06 - - - - - - E07 80 34 $197,599 $200,000 42.5 97 E07 18 4 $362,250 $361,500 22.2 98 E08 95 21 $173,538 $164,500 22.1 97 E08 - - - - - - E09 219 54 $234,029 $233,250 24.7 98 E09 - - - - - - E10 4 3 $170,800 $153,000 75.0 100 E10 1 1 $327,500 $327,500 100.0 99 E11 117 26 $158,115 $160,000 22.2 97 E11 6 - - - - - E12 3 - - - - - E12 1 1 $338,500 $338,500 100.0 98 E13 18 16 $200,488 $185,400 88.9 98 E13 5 2 $262,500 $262,500 40.0 97 E14 16 4 $225,875 $219,250 25.0 97 E14 4 2 $251,000 $251,000 50.0 99 E15 36 11 $223,409 $196,000 30.6 97 E15 5 11 $275,545 $274,500 220.0 98 E16 17 4 $141,725 $138,500 23.5 94 E16 9 5 $215,300 $220,000 55.6 98 E17 8 7 $168,214 $160,000 87.5 96 E17 31 16 $239,696 $228,250 51.6 99 E18 - - - - - - E18 - - - - - - E19 - - - - - - E19 5 1 $301,500 $301,500 20.0 99 E20 10 - - - - - E20 2 1 $275,000 $275,000 50.0 97 E21 - - - - - - E21 - 1 $275,000 $275,000 - 99 Condo Townhouse Detached Condo Area Act Sales Av. Price Med. Price % S-A Av. % List Area Act Sales Av. Price Med. Price % S-A Av. % List E01 24 2 $358,500 $358,500 8.3 98 E01 - - - - - - E02 9 1 $394,000 $394,000 11.1 100 E02 - - - - - - E03 7 2 $264,650 $264,650 28.6 98 E03 - - - - - - E04 24 12 $268,275 $261,500 50.0 98 E04 - - - - - - E05 43 17 $267,076 $261,000 39.5 99 E05 - - - - - - E06 3 - - - - - E06 - - - - - - E07 20 9 $275,411 $278,000 45.0 97 E07 - - - - - - E08 28 7 $206,514 $220,000 25.0 97 E08 - - - - - - E09 46 5 $166,430 $178,000 10.9 98 E09 - - - - - - E10 7 7 $212,129 $200,000 100.0 96 E10 - - - - - - E11 36 18 $238,722 $243,000 50.0 98 E11 - - - - - - E12 14 5 $230,700 $240,000 35.7 99 E12 - - - - - - E13 40 16 $225,666 $216,250 40.0 97 E13 - - - - - - E14 32 12 $225,233 $228,450 37.5 99 E14 1 1 $201,000 $201,000 100.0 98 E15 17 11 $217,891 $212,500 64.7 98 E15 - - - - - - E16 77 17 $154,200 $150,000 22.1 97 E16 - - - - - - E17 14 5 $200,900 $210,000 35.7 97 E17 - - - - - - E18 - - - - - - E18 - - - - - - E19 - 1 $263,000 $263,000 - 97 E19 - - - - - - E20 7 - - - - - E20 - - - - - - E21 - - - - - - E21 - - - - - - TORONTO REAL ESTATE BOARD 5
  • 6. SINGLE FAMILY EAST BREAKDOWN - JuNE 2010 East District Co-op Apartment Attached/Row/Townhouse Area Act Sales Av. Price Med. Price % S-A Av. % List Area Act Sales Av. Price Med. Price % S-A Av. % List E01 - - - - - - E01 18 14 $460,279 $458,450 77.8 100 E02 2 1 $270,000 $270,000 50.0 97 E02 12 6 $425,000 $394,500 50.0 97 E03 - 2 $214,450 $214,450 - 99 E03 9 2 $424,750 $424,750 22.2 99 E04 2 - - - - - E04 7 1 $371,000 $371,000 14.3 105 E05 - - - - - - E05 4 3 $342,000 $338,000 75.0 98 E06 - - - - - - E06 3 3 $515,000 $419,000 100.0 98 E07 - - - - - - E07 4 3 $295,167 $297,000 75.0 98 E08 - - - - - - E08 6 - - - - - E09 - - - - - - E09 5 1 $373,000 $373,000 20.0 98 E10 - - - - - - E10 8 8 $348,788 $352,450 100.0 98 E11 - - - - - - E11 25 12 $285,650 $291,500 48.0 99 E12 - - - - - - E12 7 - - - - - E13 - - - - - - E13 21 11 $286,782 $302,000 52.4 98 E14 - - - - - - E14 34 21 $283,686 $286,000 61.8 98 E15 - - - - - - E15 37 18 $257,217 $260,000 48.7 99 E16 - - - - - - E16 14 8 $172,175 $202,450 57.1 93 E17 - - - - - - E17 22 14 $201,486 $196,450 63.6 99 E18 - - - - - - E18 - - - - - - E19 - - - - - - E19 3 8 $265,800 $263,950 266.7 99 E20 - - - - - - E20 - - - - - - E21 - - - - - - E21 - - - - - - West District Current Month: June 2010 Area Active New Sales $ Volume Avg Price Med Price Avg DOM Avg %List W01 126 119 64 $33,777,144 $527,768 $476,639 19 101 W02 160 130 75 $38,321,032 $510,947 $460,000 15 101 W03 260 128 62 $20,460,312 $330,005 $314,500 26 98 W04 267 143 67 $21,894,500 $326,784 $342,000 30 97 W05 489 231 111 $33,611,630 $302,807 $325,000 33 97 W06 361 211 123 $49,266,590 $400,541 $396,500 27 99 W07 155 123 68 $34,866,719 $512,746 $492,250 23 99 W08 289 201 122 $75,228,074 $616,624 $475,750 24 97 W09 172 102 52 $22,337,222 $429,562 $422,500 30 98 W10 314 178 76 $20,083,700 $264,259 $281,250 36 98 W12 266 159 97 $52,526,354 $541,509 $423,000 28 97 W13 264 142 79 $49,302,925 $624,088 $538,000 30 97 W14 148 90 52 $18,800,222 $361,543 $359,161 27 97 W15 551 360 209 $56,793,330 $271,738 $252,000 28 97 W16 179 138 88 $39,449,075 $448,285 $365,500 19 98 W17 3 2 - - - - - - W18 163 98 35 $9,317,950 $266,227 $277,500 31 97 W19 527 386 235 $95,711,050 $407,281 $390,000 24 98 W20 537 444 291 $116,645,268 $400,843 $380,000 21 98 W21 572 311 190 $121,458,739 $639,257 $511,750 33 97 W22 228 219 117 $47,254,599 $403,885 $365,200 19 99 W23 1,077 793 387 $133,778,999 $345,682 $335,000 24 98 W24 782 565 314 $109,005,984 $347,153 $338,000 24 97 W25 166 105 51 $18,816,200 $368,945 $333,000 34 98 W26 40 10 8 $5,957,500 $744,688 $713,750 58 92 W27 226 137 81 $35,206,690 $434,650 $383,000 26 98 W28 290 112 73 $36,843,600 $504,707 $464,000 41 98 W29 162 91 61 $20,193,100 $331,034 $290,000 34 98 TOTAL 8,774 5,728 3,188 $1,316,908,508 $413,083 $360,000 26 98 6 TORONTO REAL ESTATE BOARD
  • 7. SINGLE FAMILY WEST BREAKDOWN - JuNE 2010 West District West District West District 80 Days on Market 80 Sales Active Listing Ratio 60 60 40 40 20 20 0 0 Jun Jul Aug Sep Oct Nov Dec Jan Feb Mar Apr May Jun Jun Jul Aug Sep Oct Nov Dec Jan Feb Mar Apr May Jun 2009 2010 2009 2010 Year-to-Date: June 2010 Area Listed Sales $ Volume Avg Price Med Price Avg DOM Avg %List W01 630 375 $201,133,959 $536,357 $475,000 17 103 W02 828 484 $249,193,566 $514,863 $455,000 15 104 W03 895 416 $138,603,237 $333,181 $329,250 23 99 W04 934 445 $142,338,637 $319,862 $319,000 30 98 W05 1,482 634 $200,863,609 $316,820 $331,000 29 98 W06 1,336 707 $287,798,490 $407,070 $380,000 24 100 W07 721 433 $216,992,495 $501,137 $479,000 18 100 W08 1,246 738 $432,479,596 $586,016 $490,000 22 99 W09 563 275 $107,138,426 $389,594 $401,000 28 98 W10 1,138 531 $140,904,319 $265,357 $265,000 30 98 W12 1,052 551 $293,252,341 $532,218 $430,000 26 98 W13 966 479 $290,378,578 $606,218 $457,000 25 98 W14 615 346 $127,667,005 $368,980 $361,000 22 98 W15 2,207 1,235 $330,701,189 $267,774 $245,000 24 98 W16 884 536 $232,942,078 $434,593 $389,500 19 99 W17 3 - - - - - - W18 483 234 $66,540,001 $284,359 $295,000 28 97 W19 2,389 1,312 $528,668,127 $402,948 $390,000 19 99 W20 2,756 1,583 $647,558,454 $409,070 $384,000 17 99 W21 2,028 1,056 $616,687,076 $583,984 $503,750 25 98 W22 1,250 769 $308,559,927 $401,248 $369,900 15 99 W23 4,939 2,642 $912,076,450 $345,222 $333,000 21 98 W24 3,645 1,980 $714,217,131 $360,716 $345,000 21 98 W25 551 305 $120,823,401 $396,142 $357,000 28 98 W26 74 34 $22,443,500 $660,103 $577,500 57 96 W27 853 527 $218,288,265 $414,209 $381,000 26 99 W28 832 444 $219,247,906 $493,802 $452,500 32 98 W29 534 336 $105,741,351 $314,706 $290,000 33 98 TOTAL 35,834 19,407 $7,873,239,114 $405,691 $360,000 22 99 TORONTO REAL ESTATE BOARD 7
  • 8. SINGLE FAMILY WEST BREAKDOWN - JuNE 2010 West District Detached Houses Semi-Detached Houses Area Act Sales Av. Price Med. Price % S-A Av. % List Area Act Sales Av. Price Med. Price % S-A Av. % List W01 35 15 $801,368 $845,000 42.9 102 W01 21 20 $511,514 $498,889 95.2 102 W02 56 30 $664,636 $682,500 53.6 102 W02 63 24 $458,023 $447,500 38.1 101 W03 164 34 $345,568 $318,250 20.7 97 W03 60 18 $381,667 $391,850 30.0 98 W04 149 34 $404,179 $392,000 22.8 97 W04 13 7 $358,857 $360,000 53.9 98 W05 120 24 $427,946 $398,750 20.0 97 W05 105 40 $375,313 $342,750 38.1 98 W06 115 45 $466,041 $435,000 39.1 100 W06 11 2 $524,000 $524,000 18.2 99 W07 63 32 $655,749 $632,450 50.8 100 W07 - 2 $437,500 $437,500 - 99 W08 180 66 $896,024 $797,950 36.7 97 W08 2 1 $418,000 $418,000 50.0 95 W09 64 29 $558,887 $560,000 45.3 99 W09 2 3 $372,000 $367,000 150.0 99 W10 94 37 $355,189 $345,000 39.4 98 W10 6 2 $308,100 $308,100 33.3 96 W12 183 59 $683,094 $542,000 32.2 97 W12 14 5 $338,500 $338,000 35.7 96 W13 193 50 $826,969 $804,950 25.9 96 W13 20 9 $328,222 $318,000 45.0 99 W14 35 17 $550,853 $535,000 48.6 97 W14 15 8 $400,688 $412,500 53.3 97 W15 35 12 $508,833 $496,500 34.3 97 W15 16 10 $405,000 $400,000 62.5 97 W16 87 38 $651,836 $516,500 43.7 98 W16 31 15 $350,060 $360,000 48.4 97 W17 - - - - - - W17 - - - - - - W18 61 10 $312,100 $302,000 16.4 96 W18 56 12 $304,421 $307,000 21.4 97 W19 209 92 $555,054 $526,000 44.0 98 W19 73 34 $396,263 $395,000 46.6 98 W20 242 114 $526,880 $509,500 47.1 98 W20 89 62 $381,685 $381,500 69.7 99 W21 406 116 $795,464 $617,500 28.6 97 W21 12 8 $375,125 $372,000 66.7 98 W22 138 53 $503,651 $493,000 38.4 98 W22 32 21 $346,524 $347,500 65.6 98 W23 735 222 $391,330 $370,750 30.2 98 W23 183 84 $309,711 $315,000 45.9 98 W24 492 164 $430,521 $430,500 33.3 97 W24 126 58 $321,081 $323,500 46.0 98 W25 104 24 $496,746 $444,750 23.1 98 W25 11 1 $294,000 $294,000 9.1 98 W26 39 8 $744,688 $713,750 20.5 92 W26 - - - - - - W27 204 67 $460,976 $435,000 32.8 98 W27 5 6 $316,750 $325,500 120.0 97 W28 269 59 $545,925 $506,000 21.9 98 W28 7 6 $335,167 $336,000 85.7 98 W29 125 45 $363,898 $324,000 36.0 97 W29 6 6 $223,633 $225,000 100.0 99 Condo Apartment Link Area Act Sales Av. Price Med. Price % S-A Av. % List Area Act Sales Av. Price Med. Price % S-A Av. % List W01 56 15 $346,410 $310,150 26.8 98 W01 - - - - - - W02 20 9 $350,944 $378,000 45.0 98 W02 - - - - - - W03 25 9 $179,333 $174,000 36.0 97 W03 - - - - - - W04 68 18 $175,250 $175,000 26.5 96 W04 - - - - - - W05 147 21 $146,878 $126,000 14.3 95 W05 1 1 $240,000 $240,000 100.0 110 W06 195 61 $352,029 $315,000 31.3 98 W06 - - - - - - W07 78 28 $353,366 $285,000 35.9 98 W07 - - - - - - W08 97 47 $270,563 $250,500 48.5 98 W08 1 - - - - - W09 93 18 $239,694 $225,000 19.4 96 W09 - - - - - - W10 162 31 $172,016 $160,000 19.1 99 W10 1 - - - - - W12 45 19 $242,068 $237,000 42.2 97 W12 - - - - - - W13 12 9 $185,222 $190,000 75.0 97 W13 - - - - - - W14 44 13 $207,300 $210,000 29.6 97 W14 - - - - - - W15 441 163 $242,868 $233,500 37.0 97 W15 2 - - - - - W16 16 10 $264,820 $221,950 62.5 98 W16 5 1 $341,000 $341,000 20.0 98 W17 3 - - - - - W17 - - - - - - W18 30 7 $148,071 $133,000 23.3 96 W18 - - - - - - W19 125 45 $221,439 $194,500 36.0 97 W19 2 2 $402,500 $402,500 100.0 98 W20 52 25 $208,820 $198,500 48.1 97 W20 4 2 $369,500 $369,500 50.0 99 W21 69 22 $387,105 $247,000 31.9 96 W21 6 2 $371,500 $371,500 33.3 99 W22 1 3 $287,833 $277,000 300.0 98 W22 5 1 $297,000 $297,000 20.0 99 W23 27 12 $225,875 $212,000 44.4 97 W23 9 - - - - - W24 50 33 $171,224 $159,900 66.0 97 W24 1 2 $291,100 $291,100 200.0 97 W25 24 10 $224,850 $219,000 41.7 97 W25 2 - - - - - W26 - - - - - - W26 - - - - - - W27 4 - - - - - W27 1 1 $262,000 $262,000 100.0 95 W28 5 - - - - - W28 1 - - - - - W29 18 3 $287,633 $320,000 16.7 97 W29 1 - - - - - 8 TORONTO REAL ESTATE BOARD
  • 9. SINGLE FAMILY WEST BREAKDOWN - JuNE 2010 West District Condo Townhouse Detached Condo Area Act Sales Av. Price Med. Price % S-A Av. % List Area Act Sales Av. Price Med. Price % S-A Av. % List W01 6 5 $314,600 $308,000 83.3 100 W01 - - - - - - W02 12 4 $258,725 $247,950 33.3 98 W02 - - - - - - W03 7 - - - - - W03 - - - - - - W04 31 5 $291,780 $289,000 16.1 98 W04 - - - - - - W05 98 23 $198,717 $204,990 23.5 97 W05 - - - - - - W06 16 7 $400,929 $376,500 43.8 99 W06 - - - - - - W07 1 1 $285,000 $285,000 100.0 95 W07 - - - - - - W08 7 7 $314,971 $320,000 100.0 97 W08 - - - - - - W09 6 2 $349,500 $349,500 33.3 99 W09 - - - - - - W10 46 6 $165,500 $184,000 13.0 95 W10 - - - - - - W12 21 14 $423,714 $391,000 66.7 98 W12 2 - - - - - W13 34 8 $248,188 $237,750 23.5 97 W13 1 1 $685,000 $685,000 100.0 98 W14 46 13 $241,948 $253,000 28.3 97 W14 - - - - - - W15 55 24 $293,745 $287,250 43.6 98 W15 - - - - - - W16 39 24 $268,300 $275,500 61.5 98 W16 - - - - - - W17 - - - - - - W17 - - - - - - W18 15 5 $241,480 $212,000 33.3 98 W18 - - - - - - W19 84 44 $314,630 $314,500 52.4 98 W19 - - - - - - W20 100 71 $288,084 $290,000 71.0 98 W20 5 - - - - - W21 29 10 $319,030 $304,750 34.5 99 W21 - - - - - - W22 5 5 $225,980 $225,000 100.0 98 W22 - - - - - - W23 62 35 $238,326 $235,000 56.5 97 W23 - - - - - - W24 53 29 $189,607 $187,200 54.7 97 W24 3 - - - - - W25 15 10 $245,280 $252,750 66.7 98 W25 - 1 $312,000 $312,000 - 96 W26 - - - - - - W26 1 - - - - - W27 5 1 $184,900 $184,900 20.0 100 W27 - - - - - - W28 1 - - - - - W28 - - - - - - W29 4 2 $193,000 $193,000 50.0 97 W29 - - - - - - Co-op Apartment Attached/Row/Townhouse Area Act Sales Av. Price Med. Price % S-A Av. % List Area Act Sales Av. Price Med. Price % S-A Av. % List W01 - - - - - - W01 8 9 $528,578 $530,000 112.5 102 W02 2 1 $162,000 $162,000 50.0 96 W02 7 7 $433,429 $384,000 100.0 103 W03 - - - - - - W03 4 1 $227,000 $227,000 25.0 99 W04 - - - - - - W04 6 3 $342,333 $347,000 50.0 98 W05 7 1 $63,500 $63,500 14.3 91 W05 11 1 $370,000 $370,000 9.1 97 W06 6 2 $126,750 $126,750 33.3 99 W06 18 6 $452,167 $476,500 33.3 98 W07 1 1 $140,000 $140,000 100.0 93 W07 12 4 $672,125 $686,500 33.3 100 W08 1 - - - - - W08 1 1 $751,226 $751,226 100.0 105 W09 4 - - - - - W09 3 - - - - - W10 2 - - - - - W10 3 - - - - - W12 - - - - - - W12 1 - - - - - W13 - - - - - - W13 4 2 $331,500 $331,500 50.0 97 W14 1 - - - - - W14 7 1 $390,000 $390,000 14.3 98 W15 1 - - - - - W15 1 - - - - - W16 - - - - - - W16 1 - - - - - W17 - - - - - - W17 - - - - - - W18 - - - - - - W18 1 1 $300,000 $300,000 100.0 97 W19 - - - - - - W19 34 18 $364,428 $360,000 52.9 98 W20 - - - - - - W20 45 17 $382,529 $390,000 37.8 98 W21 - - - - - - W21 50 32 $429,197 $383,500 64.0 99 W22 - - - - - - W22 47 34 $323,344 $326,250 72.3 99 W23 - - - - - - W2 3 61 34 $289,297 $290,050 55.7 98 W24 - - - - - - W24 57 28 $287,382 $301,500 49.1 98 W25 1 - - - - - W25 9 5 $317,400 $320,000 55.6 99 W26 - - - - - - W26 - - - - - - W27 - - - - - - W27 7 6 $328,983 $323,200 85.7 100 W28 3 - - - - - W28 4 8 $327,875 $309,500 200.0 99 W29 - - - - - - W29 8 5 $245,400 $252,000 62.5 99 TORONTO REAL ESTATE BOARD 9
  • 10. Central District Current Month: June 2010 Area Active New Sales $ Volume Avg Price Med Price Avg DOM Avg%List C01 1,197 726 438 $180,501,643 $412,104 $357,750 25 99 C02 274 172 93 $67,892,053 $730,022 $555,000 19 99 C03 182 120 40 $37,803,160 $945,079 $727,500 26 98 C04 252 174 106 $88,127,350 $831,390 $790,000 20 97 C06 96 60 24 $14,076,911 $586,538 $567,000 30 97 C07 373 201 113 $49,396,116 $437,134 $385,000 30 97 C08 479 332 188 $74,133,024 $394,325 $348,250 24 98 C09 98 68 42 $48,729,129 $1,160,217 $960,115 24 98 C10 195 152 109 $73,483,374 $674,159 $542,000 22 99 C11 66 54 36 $17,976,600 $499,350 $505,900 19 98 C12 184 84 43 $57,868,800 $1,345,786 $1,157,500 29 97 C13 193 99 82 $36,805,263 $448,845 $393,000 25 98 C14 513 342 162 $75,701,114 $467,291 $392,500 25 98 C15 390 261 106 $48,495,500 $457,505 $384,800 22 98 TOTAL 4,492 2,845 1,582 $870,990,037 $550,563 $415,000 24 98 Central District Central District 80 Days on Market 80 Sales Active Listing Ratio 60 60 40 40 20 20 0 0 Jun Jul Aug Sep Oct Nov Dec Jan Feb Mar Apr May Jun Jun Jul Aug Sep Oct Nov Dec Jan Feb Mar Apr May Jun 2009 2010 2009 2010 Year-to-Date: June 2010 Area Listed Sales $ Volume Avg Price Med Price Avg DOM Avg%List C01 4,813 2,368 $980,874,085 $414,220 $365,000 19 100 C02 1,045 507 $388,984,383 $767,228 $580,000 21 101 C03 695 332 $289,507,727 $872,011 $611,000 22 100 C04 1,252 698 $585,494,450 $838,817 $760,500 18 100 C06 386 175 $97,493,497 $557,106 $520,000 21 99 C07 1,468 747 $331,801,388 $444,179 $378,000 21 99 C08 1,981 1,012 $398,504,055 $393,779 $350,000 19 100 C09 390 198 $248,442,258 $1,254,759 $955,000 22 100 C10 970 557 $406,340,982 $729,517 $593,900 17 101 C11 356 219 $116,390,471 $531,463 $450,000 20 100 C12 587 260 $382,053,308 $1,469,436 $1,186,500 26 99 C13 817 403 $170,474,696 $423,014 $372,000 21 100 C14 2,085 1,044 $505,867,692 $484,548 $380,000 19 100 C15 1,590 773 $350,105,495 $452,918 $375,000 19 100 TOTAL 18,435 9,293 $5,252,334,487 $565,193 $411,000 20 100 10 TORONTO REAL ESTATE BOARD
  • 11. SINGLE FAMILY CENTRAL BREAKDOWN - JuNE 2010 Central District Detached Houses Semi-Detached Houses Area Act Sales Av. Price Med. Price % S-A Av. % List Area Act Sales Av. Price Med. Price % S-A Av.% List C01 20 8 $640,750 $633,000 40.0 101 C01 56 23 $664,835 $637,900 41.1 101 C02 51 19 $1,039,316 $800,000 37.3 99 C02 50 34 $622,397 $535,000 68.0 100 C03 107 25 $1,165,590 $834,000 23.4 97 C03 24 7 $618,057 $586,000 29.2 99 C04 175 75 $990,689 $912,500 42.9 97 C04 12 8 $638,000 $615,000 66.7 99 C06 58 18 $685,245 $662,500 31.0 96 C06 2 - - - - - C07 121 31 $669,762 $660,000 25.6 97 C07 15 6 $458,583 $462,500 40.0 100 C08 6 2 $817,000 $817,000 33.3 100 C08 18 10 $684,250 $683,500 55.6 98 C09 45 18 $1,695,791 $1,577,500 40.0 97 C09 7 1 $1,468,000 $1,468,000 14.3 99 C10 59 34 $1,085,861 $891,000 57.6 98 C10 16 16 $626,206 $632,500 100.0 101 C11 25 10 $933,100 $908,000 40.0 99 C11 4 9 $569,722 $560,000 225.0 98 C12 149 28 $1,770,268 $1,269,500 18.8 97 C12 3 - - - - - C13 38 26 $687,545 $585,000 68.4 99 C13 17 11 $410,859 $429,000 64.7 100 C14 110 40 $770,850 $681,500 36.4 98 C14 - - - - - - C15 100 34 $693,568 $621,000 34.0 100 C15 33 12 $406,633 $407,500 36.4 98 Condo Apartment Link Area Act Sales Av. Price Med. Price % S-A Av. % List Area Act Sales Av. Price Med. Price % S-A Av.% List C01 1,029 349 $378,489 $340,000 33.9 98 C01 - - - - - - C02 130 30 $689,952 $440,056 23.1 98 C02 - - - - - - C03 37 8 $542,125 $453,500 21.6 98 C03 - - - - - - C04 51 21 $374,557 $325,000 41.2 97 C04 - - - - - - C06 32 5 $268,700 $280,000 15.6 98 C06 - - - - - - C07 198 67 $320,900 $299,000 33.8 98 C07 1 1 $455,000 $455,000 100.0 97 C08 420 161 $365,609 $340,000 38.3 98 C08 - - - - - - C09 34 18 $697,606 $504,500 52.9 100 C09 - - - - - - C10 108 49 $423,192 $400,000 45.4 99 C10 - - - - - - C11 29 15 $166,167 $145,000 51.7 97 C11 - - - - - - C12 25 9 $533,144 $472,500 36.0 98 C12 - - - - - - C13 132 41 $305,943 $282,000 31.1 98 C13 - - - - - - C14 359 104 $351,782 $331,000 29.0 98 C14 - - - - - - C15 191 37 $343,703 $312,000 19.4 97 C15 5 1 $455,000 $455,000 20.0 97 Condo Townhouse Detached Condo Area Act Sales Av. Price Med. Price % S-A Av. % List Area Act Sales Av. Price Med. Price % S-A Av.% List C01 63 45 $468,784 $369,000 71.4 99 C01 - - - - - - C02 8 2 $610,000 $610,000 25.0 100 C02 - - - - - - C03 4 - - - - - C03 - - - - - - C04 4 1 $308,000 $308,000 25.0 100 C04 - - - - - - C06 1 1 $399,000 $399,000 100.0 100 C06 - - - - - - C07 27 3 $354,967 $364,900 11.1 97 C07 - - - - - - C08 12 7 $400,874 $363,000 58.3 99 C08 - - - - - - C09 5 2 $844,000 $844,000 40.0 95 C09 - - - - - - C10 7 9 $619,933 $639,000 128.6 98 C10 - - - - - - C11 6 1 $512,800 $512,800 16.7 103 C11 - - - - - - C12 7 6 $583,833 $555,000 85.7 98 C12 - - - - - - C13 4 1 $439,000 $439,000 25.0 98 C13 - - - - - - C14 33 14 $423,557 $407,000 42.4 98 C14 - - - - - - C15 61 22 $311,936 $315,500 36.1 98 C15 - - - - - - TORONTO REAL ESTATE BOARD 11
  • 12. SINGLE FAMILY CENTRAL BREAKDOWN - JuNE 2010 Central District Co-op Apartment Attached/Row/Townhouse Area Act Sales Av. Price Med. Price % S-A Av. % List Area Act Sales Av. Price Med. Price % S-A Av. % List C01 1 - - - - - C01 28 13 $530,508 $519,000 46.4 100 C02 6 1 $250,000 $250,000 16.7 98 C02 29 7 $687,857 $760,000 24.1 98 C03 7 - - - - - C03 3 - - - - - C04 9 - - - - - C04 1 1 $548,000 $548,000 100.0 98 C06 - - - - - - C06 3 - - - - - C07 - - - - - - C07 11 5 $572,360 $580,000 45.5 97 C08 3 1 $255,000 $255,000 33.3 100 C08 20 7 $533,186 $508,000 35.0 98 C09 6 2 $558,500 $558,500 33.3 98 C09 1 1 $1,375,000 $1,375,000 100.0 99 C10 1 1 $229,000 $229,000 100.0 97 C10 4 - - - - - C11 - - - - - - C11 2 1 $512,800 $512,800 50.0 103 C12 - - - - - - C12 - - - - - - C13 2 1 $360,000 $360,000 50.0 96 C13 - 2 $533,500 $533,500 - 98 C14 2 1 $153,000 $153,000 50.0 94 C14 9 3 $733,000 $625,000 33.3 97 C15 - - - - - - C15 - - - - - - North District Current Month: June 2010 Area Active New Sales $ Volume Avg Price Med Price Avg DOM Avg %List N01 189 128 73 $40,889,318 $560,128 $520,000 21 98 N02 280 168 91 $39,363,999 $432,571 $399,000 25 98 N03 501 317 175 $91,912,657 $525,215 $449,900 27 98 N04 301 210 102 $55,376,500 $542,907 $535,000 23 98 N05 261 141 71 $40,122,568 $565,107 $519,900 34 97 N06 237 122 82 $40,971,800 $499,656 $383,000 34 97 N07 262 191 148 $57,918,197 $391,339 $362,750 25 98 N08 697 417 202 $110,814,928 $548,589 $481,000 23 98 N10 255 133 75 $39,124,068 $521,654 $466,500 29 98 N11 690 462 265 $136,870,913 $516,494 $450,000 24 98 N12 154 79 49 $24,660,910 $503,284 $430,000 34 98 N13 112 32 11 $7,794,554 $708,596 $475,000 59 97 N14 172 58 30 $23,040,500 $768,017 $600,000 47 97 N15 130 61 26 $10,867,800 $417,992 $378,750 43 97 N16 151 58 39 $16,636,739 $426,583 $375,000 46 96 N17 337 150 80 $25,072,775 $313,410 $265,000 50 97 N18 158 78 43 $14,201,459 $330,266 $310,000 39 97 N19 191 84 64 $19,969,300 $312,020 $272,500 56 97 N20 40 12 7 $3,199,000 $457,000 $470,000 34 96 N21 44 9 8 $3,145,400 $393,175 $377,000 54 98 N22 107 34 24 $6,305,200 $262,717 $247,200 65 97 N23 238 95 45 $13,832,000 $307,378 $280,000 47 97 N24 138 47 16 $5,265,900 $329,119 $283,500 66 96 TOTAL 5,645 3,086 1,726 $827,356,485 $479,349 $422,200 31 98 12 TORONTO REAL ESTATE BOARD
  • 13. North District North District North District 80 Days on Market 80 Sales Active Listing Ratio 60 60 40 40 20 20 0 0 Jun Jul Aug Sep Oct Nov Dec Jan Feb Mar Apr May Jun Jun Jul Aug Sep Oct Nov Dec Jan Feb Mar Apr May Jun 2009 2010 2009 2010 Year-to-Date: June 2010 Area Listed Sales $ Volume Avg Price Med Price Avg DOM Avg %List N01 755 400 $227,690,056 $569,225 $520,000 19 100 N02 1,092 546 $271,427,148 $497,119 $439,950 21 99 N03 2,310 1,220 $615,854,085 $504,798 $445,000 20 99 N04 1,315 616 $329,841,402 $535,457 $511,900 19 99 N05 1,015 455 $248,918,736 $547,074 $520,000 22 98 N06 915 522 $250,465,276 $479,819 $418,750 25 99 N07 1,282 817 $311,047,358 $380,719 $355,000 21 99 N08 2,794 1,434 $738,257,886 $514,824 $472,800 21 98 N10 1,001 457 $225,752,015 $493,987 $471,000 19 100 N11 2,935 1,548 $810,258,113 $523,423 $474,640 19 100 N12 528 283 $132,440,798 $467,989 $420,000 26 98 N13 211 67 $50,509,142 $753,868 $615,000 77 97 N14 358 156 $106,802,738 $684,633 $574,250 44 96 N15 334 154 $67,534,510 $438,536 $376,450 38 97 N16 398 197 $83,226,030 $422,467 $379,114 45 97 N17 903 471 $133,387,667 $283,201 $265,000 37 97 N18 471 255 $84,900,156 $332,942 $315,000 39 98 N19 487 274 $80,589,720 $294,123 $267,000 51 98 N20 82 39 $17,478,600 $448,169 $422,500 59 96 N21 98 50 $16,607,900 $332,158 $333,000 59 97 N22 267 133 $39,944,150 $300,332 $269,000 57 97 N23 554 236 $65,540,349 $277,713 $254,750 52 97 N24 273 82 $22,316,052 $272,147 $235,000 57 96 TOTAL 20,378 10,412 $4,930,789,887 $473,568 $429,000 26 99 TORONTO REAL ESTATE BOARD 13
  • 14. SINGLE FAMILY NORTH BREAKDOWN - JuNE 2010 North District Detached Houses Semi-Detached Houses Area Act Sales Av. Price Med. Price % S-A Av. % List Area Act Sales Av. Price Med. Price % S-A Av. % List N01 101 36 $762,501 $666,000 35.6 98 N01 4 3 $469,333 $453,000 75.0 98 N02 141 41 $568,383 $539,000 29.1 98 N02 2 1 $420,000 $420,000 50.0 98 N03 227 75 $787,151 $711,000 33.0 98 N03 12 7 $455,929 $480,000 58.3 98 N04 209 71 $601,501 $583,000 34.0 98 N04 11 3 $414,167 $453,000 27.3 98 N05 216 49 $643,550 $584,000 22.7 97 N05 11 5 $391,700 $392,000 45.5 97 N06 177 44 $615,986 $491,250 24.9 97 N06 19 10 $365,340 $359,450 52.6 99 N07 171 93 $446,703 $420,000 54.4 98 N07 32 17 $317,294 $322,500 53.1 99 N08 458 129 $642,791 $560,000 28.2 97 N08 71 35 $419,143 $425,000 49.3 98 N10 144 39 $637,694 $588,000 27.1 97 N10 9 1 $395,000 $395,000 11.1 98 N11 391 132 $665,723 $613,400 33.8 98 N11 58 29 $401,573 $400,000 50.0 98 N12 133 38 $550,563 $448,000 28.6 97 N12 12 7 $355,571 $361,000 58.3 100 N13 112 11 $708,596 $475,000 9.8 97 N13 - - - - - - N14 157 30 $768,017 $600,000 19.1 97 N14 1 - - - - - N15 115 23 $440,430 $395,000 20.0 96 N15 - - - - - - N16 131 29 $473,697 $430,000 22.1 95 N16 - - - - - - N17 317 74 $320,646 $274,000 23.3 97 N17 7 1 $253,000 $253,000 14.3 99 N18 132 24 $388,236 $337,500 18.2 96 N18 5 7 $263,243 $243,000 140.0 98 N19 127 41 $328,995 $299,900 32.3 97 N19 4 1 $197,500 $197,500 25.0 94 N20 40 7 $457,000 $470,000 17.5 96 N20 - - - - - - N21 44 8 $393,175 $377,000 18.2 98 N21 - - - - - - N22 90 16 $283,563 $293,500 17.8 97 N22 1 1 $154,800 $154,800 100.0 97 N23 230 42 $316,750 $284,500 18.3 97 N23 - - - - - - N24 133 15 $335,027 $302,000 11.3 96 N24 - - - - - - Condo Apartment Link Area Act Sales Av. Price Med. Price % S-A Av. % List Area Act Sales Av. Price Med. Price % S-A Av. % List N01 46 14 $350,214 $310,500 30.4 99 N01 6 2 $524,500 $524,500 33.3 99 N02 106 33 $279,858 $276,000 31.1 97 N02 7 6 $379,000 $380,000 85.7 99 N03 180 55 $271,039 $273,250 30.6 98 N03 3 6 $462,984 $463,001 200.0 99 N04 32 7 $337,571 $205,000 21.9 96 N04 1 - - - - - N05 1 - - - - - N05 4 3 $466,333 $447,000 75.0 97 N06 6 4 $318,750 $312,500 66.7 94 N06 - - - - - - N07 17 8 $237,153 $209,500 47.1 99 N07 - - - - - - N08 79 12 $280,492 $282,500 15.2 97 N08 2 1 $450,000 $450,000 50.0 94 N10 29 4 $297,500 $290,500 13.8 98 N10 60 29 $410,827 $408,000 48.3 99 N11 114 32 $295,809 $270,250 28.1 98 N11 23 10 $452,560 $408,400 43.5 99 N12 3 - - - - - N12 - - - - - - N13 - - - - - - N13 - - - - - - N14 11 - - - - - N14 - - - - - - N15 - - - - - - N15 - - - - - - N16 9 3 $235,633 $220,000 33.3 98 N16 4 2 $330,807 $330,807 50.0 97 N17 1 1 $192,000 $192,000 100.0 96 N17 3 - - - - - N18 2 2 $168,750 $168,750 100.0 98 N18 12 7 $297,143 $300,000 58.3 98 N19 9 1 $193,000 $193,000 11.1 94 N19 4 3 $244,667 $240,000 75.0 97 N20 - - - - - - N20 - - - - - - N21 - - - - - - N21 - - - - - - N22 - - - - - - N22 5 3 $223,667 $223,000 60.0 98 N23 - - - - - - N23 3 - - - - - N24 - - - - - - N24 - - - - - - 14 TORONTO REAL ESTATE BOARD
  • 15. SINGLE FAMILY NORTH BREAKDOWN - JuNE 2010 North District Condo Townhouse Detached Condo Area Act Sales Av. Price Med. Price % S-A Av. % List Area Act Sales Av. Price Med. Price % S-A Av. % List N01 30 17 $327,018 $313,000 56.7 98 N01 - - - - - - N02 18 7 $374,714 $374,000 38.9 98 N02 1 - - - - - N03 34 16 $327,469 $313,500 47.1 98 N03 - - - - - - N04 6 1 $320,000 $320,000 16.7 98 N04 - - - - - - N05 1 1 $318,000 $318,000 100.0 98 N05 - - - - - - N06 14 8 $414,438 $339,000 57.1 98 N06 - - - - - - N07 14 10 $271,468 $237,250 71.4 99 N07 - - - - - - N08 8 2 $316,500 $316,500 25.0 98 N08 - - - - - - N10 7 - - - - - N10 - - - - - - N11 39 21 $365,143 $365,000 53.9 98 N11 - 1 $526,000 $526,000 - 99 N12 - - - - - - N12 1 - - - - - N13 - - - - - - N13 - - - - - - N14 3 - - - - - N14 - - - - - - N15 - - - - - - N15 - - - - - - N16 4 2 $281,000 $281,000 50.0 97 N16 - - - - - - N17 2 - - - - - N17 - - - - - - N18 5 3 $207,867 $204,000 60.0 98 N18 - - - - - - N19 7 4 $206,125 $209,000 57.1 98 N19 22 8 $400,125 $432,500 36.4 98 N20 - - - - - - N20 - - - - - - N21 - - - - - - N21 - - - - - - N22 - - - - - - N22 - - - - - - N23 - - - - - - N23 - - - - - - N24 5 1 $240,500 $240,500 20.0 97 N24 - - - - - - Co-op Apartment Attached/Row/Townhouse Area Act Sales Av. Price Med. Price % S-A Av. % List Area Act Sales Av. Price Med. Price % S-A Av. % List N01 - - - - - - N01 2 1 $520,000 $520,000 50.0 104 N02 - - - - - - N02 5 3 $502,667 $525,000 60.0 99 N03 - - - - - - N03 45 16 $422,519 $432,500 35.6 98 N04 1 - - - - - N04 41 20 $437,220 $422,000 48.8 99 N05 - - - - - - N05 28 13 $377,932 $380,000 46.4 98 N06 - - - - - - N06 21 16 $351,531 $342,500 76.2 98 N07 - - - - - - N07 28 20 $318,445 $325,000 71.4 99 N08 - - - - - - N08 79 23 $381,565 $375,000 29.1 98 N10 - - - - - - N10 6 2 $377,500 $377,500 33.3 100 N11 1 - - - - - N11 64 40 $379,110 $367,000 62.5 98 N12 - - - - - - N12 5 4 $312,625 $320,500 80.0 96 N13 - - - - - - N13 - - - - - - N14 - - - - - - N14 - - - - - - N15 - - - - - - N15 15 3 $245,967 $236,900 20.0 98 N16 - - - - - - N16 3 3 $323,000 $310,000 100.0 98 N17 - - - - - - N17 7 4 $225,000 $221,250 57.1 99 N18 - - - - - - N18 2 - - - - - N19 - - - - - - N19 18 6 $221,750 $226,250 33.3 99 N20 - - - - - - N20 - - - - - - N21 - - - - - - N21 - - - - - - N22 - - - - - - N22 11 4 $235,600 $234,000 36.4 99 N23 - - - - - - N23 5 3 $176,167 $172,000 60.0 96 N24 - - - - - - N24 - - - - - - TORONTO REAL ESTATE BOARD 15
  • 16. District Totals New Active Listed Sales $ Volume Avg Price Med Price Avg DOM Avg Month Grand Total 15,086 23,923 N/A 8,442 3,672,555,141 435,034 367,750 27 98 Year N/A N/A 95,882 50,455 21,901,229,135 434,075 369,000 23 99 Annual Summary - Single Family Year *Number of Sales *Average Price Year *Number of Sales *Average Price 1976 19,025 $61,389 2009 1977 20,512 $64,559 January 2,670 $343,632 1978 21,184 $67,333 February 4,120 $361,305 1979 23,466 $70,830 March 6,171 $362,050 1980 26,017 $75,694 April 8,107 $385,641 1981 29,625 $90,203 May 9,589 $395,609 1982 25,336 $95,496 June 10,955 $403,972 1983 30,046 $101,626 July 9,967 $395,414 1984 31,905 $102,318 August 8,035 $387,921 1985 45,509 $109,094 September 8,196 $406,877 1986 52,919 $138,925 October 8,476 $423,559 1987 43,475 $189,105 November 7,446 $418,460 1988 49,381 $229,635 December 5,541 $411,931 1989 38,960 $273,698 1990 26,779 $255,020 Total** 87,308 $395,460 1991 38,144 $234,313 1992 41,703 $214,971 2010 1993 38,990 $206,490 January 4,986 $409,058 1994 44,237 $208,921 February 7,291 $431,509 1995 39,273 $203,028 March 10,430 $434,696 1996 55,779 $198,150 April 10,898 $437,600 1997 58,014 $211,307 May 9,470 $446,593 1998 55,344 $216,815 June 8,442 $435,034 1999 58,957 $228,372 2000 58,343 $243,255 Year-to-Date** 50,455 $434,075 2001 67,612 $251,508 2002 74,759 $275,231 2003 78,898 $293,067 2004 83,501 $315,231 2005 84,145 $335,907 2006 83,084 $351,941 2007 93,193 $376,236 2008 74,552 $379,347 * Due to District revisions, caution should be exercised when undertaking historical comparisons. Please refer to appropriate maps. **This figure may not equal the sum of all monthly totals, as the year-to-date total reflects sales reported in error and deals that have fallen through since January 1st. Single Family Dwelling Sales Comparison Sales Active Listings Average Price 15000 500000 35000 13500 30000 12000 425000 10500 25000 9000 20000 7500 350000 6000 15000 4500 10000 275000 3000 5000 1500 0 0 200000 Jun Jul Aug Sep Oct Nov Dec Jan Feb Mar Apr May Jun Jun Jul Aug Sep Oct Nov Dec Jan Feb Mar Apr May Jun 2000 2001 2002 2003 2004 2005 2006 2007 2008 2009 2010 2009 2010 2009 2010 16 TORONTO REAL ESTATE BOARD