SlideShare a Scribd company logo
1 of 4
Download to read offline
Third Quarter 2008
© 2008, CB Richard Ellis, Inc.
www.cbre.com.au/research
ACT Residential
Hot Topics
Canberra house•	
market softens
Canberra house•	
rents retract
ACT building approvals fall•	
Canberra unit market sees•	
some growth
Canberra’s 2009•	
residential market
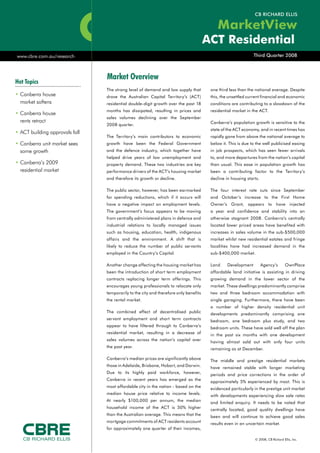
The strong level of demand and low supply that
drove the Australian Capital Territory’s (ACT)
residential double-digit growth over the past 18
months has dissipated, resulting in prices and
sales volumes declining over the September
2008 quarter.
The Territory’s main contributors to economic
growth have been the Federal Government
and the defence industry, which together have
helped drive years of low unemployment and
property demand. These two industries are key
performance drivers of the ACT’s housing market
and therefore its growth or decline.
The public sector, however, has been earmarked
for spending reductions, which if it occurs will
have a negative impact on employment levels.
The government’s focus appears to be moving
from centrally administered plans in defence and
industrial relations to locally managed issues
such as housing, education, health, indigenous
affairs and the environment. A shift that is
likely to reduce the number of public servants
employed in the Country’s Capital.
Another change affecting the housing market has
been the introduction of short term employment
contracts replacing longer term offerings. This
encourages young professionals to relocate only
temporarily to the city and therefore only benefits
the rental market.
The combined effect of decentralised public
servant employment and short term contracts
appear to have filtered through to Canberra’s
residential market, resulting in a decrease of
sales volumes across the nation’s capital over
the past year.
Canberra’s median prices are significantly above
those in Adelaide, Brisbane, Hobart, and Darwin.
Due to its highly paid workforce, however,
Canberra in recent years has emerged as the
most affordable city in the nation - based on the
median house price relative to income levels.
At nearly $100,000 per annum, the median
household income of the ACT is 50% higher
than the Australian average. This means that the
mortgage commitments of ACT residents account
for approximately one quarter of their incomes,
one third less than the national average. Despite
this, the unsettled current financial and economic
conditions are contributing to a slowdown of the
residential market in the ACT.
Canberra’s population growth is sensitive to the
state of the ACT economy, and in recent times has
rapidly gone from above the national average to
below it. This is due to the well publicised easing
in job prospects, which has seen fewer arrivals
to, and more departures from the nation’s capital
than usual. This ease in population growth has
been a contributing factor to the Territory’s
decline in housing starts.
The four interest rate cuts since September
and October’s increase to the First Home
Owner’s Grant, appears to have injected
a year end confidence and stability into an
otherwise stagnant 2008. Canberra’s centrally
located lower priced areas have benefited with
increases in sales volume in the sub-$500,000
market whilst new residential estates and fringe
localities have had increased demand in the
sub-$400,000 market.
Land Development Agency’s OwnPlace
affordable land initiative is assisting in driving
growing demand in the lower sector of the
market. These dwellings predominantly comprise
two and three bedroom accommodation with
single garaging. Furthermore, there have been
a number of higher density residential unit
developments predominantly comprising one
bedroom, one bedroom plus study, and two
bedroom units. These have sold well off the plan
in the past six months with one development
having almost sold out with only four units
remaining as at December.
The middle and prestige residential markets
have remained stable with longer marketing
periods and price corrections in the order of
approximately 5% experienced by most. This is
evidenced particularly in the prestige unit market
with developments experiencing slow sale rates
and limited enquiry. It needs to be noted that
centrally located, good quality dwellings have
been and will continue to achieve good sales
results even in an uncertain market.
Market Overview
© 2008, CB Richard Ellis, Inc.
Page 2
Canberra House Market
The September 2008 quarter saw Canberra’s house market record further softening in
price and sales volumes. The September quarter recorded negative capital growth of 0.78%
producing marginal price growth since January this year of 2.57%. The median house
price of $464,000 for the September quarter is the fourth highest capital city median
behind Sydney ($571,000), Perth ($505,000) and Melbourne ($482,000). House sales
numbers in Canberra have fallen, tracking well below capital growth in recent quarters,
with a fall in sales of 7.7% in the last year to 4,944 compared to the year before. Between
the June and September 2008 quarters, house sales dropped 11%, a likely response to
current economic conditions and the change in government employment focus.
Canberra House Rents and Yields
Following a succession of rollercoaster quarterly rent results, Canberra’s median house
rent reduced by $10 per week over the September 2008 quarter. Canberra’s September
quarter median house rent of $410 per week places it third nationally, behind Sydney
($480 per week) and Darwin ($460 per week). Average housing rental yields in Canberra
are second only to those in Darwin, which has median gross yields in both its housing
and unit markets above 5%. Canberra’s rental yield of 4.61% and softening house prices
could entice long term investors and home buyers into the market. Given the government’s
change in employment focus and easing population growth, house rents are likely to
remain flat in comparison to Sydney.
ACT Building Approvals
Population growth in the ACT is easing and according to the Department of Treasury,
residential approvals in September 2008 were down 4% from the previous month.
From February to July 2008, monthly residential approvals increased consecutively, but
declined over the following two months to September 2008. During September, most
states experienced falls in building approvals, with New South Wales recording the largest
decrease (down 6.9%) followed by the ACT. The State and Federal government and the
Reserve Bank of Australia have introduced a number of factors that are likely to support an
increase in residential building approvals in 2009. These include the ACT Government’s
Affordable Housing Action Plan combined with residential land releases of 3,400 blocks
in 2007-08 and 4,200 planned for 2008-09, recent interest rate cuts, and the tripling of
the First Home Owner Grant for the purchase of newly constructed homes.
Jun
2005Sep
2005D
ec
2005M
ar2006Jun
2006Sep
2006D
ec
2006M
ar2007Jun
2007Sep
2007D
ec
2007M
ar2008Jun
2008Sep
2008
$0
$100
$200
$300
$400
$500
Weekly Rent ($)
3 Bedroom Houses
ACT Median House Rent
Source: Residex/CBRE Research & Consulting (as at Sept 2008)
ACT NSW NT QLD SA TAS VIC AUS
0
10
20
30
-10
-20
-30
-40
No. of Approvals
Monthly Change Annual Change
Residential Approvals
State/Territory Comparisons
Source: ACT Dept of Treasury (Sept 2008)
Sep
2002
Sep
2003
Sep
2004
Sep
2005
Sep
2006
Sep
2007
Sep
2008
$0
$100,000
$200,000
$300,000
$400,000
$500,000
Median Price
0
320
640
960
1,280
1,600
Sales (No.)
Median Price Houses No. of Sales
ACT Median House Price
and Sales
Source: Residex/CBRE Research & Consulting (as at Sept 2008)
House Market
No. of Sales
(year)
Median Price
(Sept Qtr)
Median Price
(last year)
% Growth
(last year)
Median
Weekly Rent
Rental Yield
(last qtr)
Chifley 41 $538,500 $457,000 17.77% $410 3.96%
Bonython 39 $471,500 $402,000 17.32% $405 4.59%
Dickson 41 $540,000 $465,000 16.21% $420 4.11%
Kaleen 105 $448,500 $387,000 15.87% $420 4.72%
Torrens 39 $529,000 $457,000 15.81% $375 3.88%
Canberra Houses 4,944 $464,000 $431,500 7.61% $410 4.61%
Source: Residex
Canberra’s Top 5 Growth House Suburbs – September 2008 Quarter
© 2008, CB Richard Ellis, Inc.
Page 3
Canberra Unit Market
The unit market’s strong growth in the last year of 11.2% is not likely to be sustained.
This is partly due to uncertain economic circumstances and the government’s
change in employment focus. Both factors are likely to reduce public service
growth in the nation’s capital, decreasing demand for housing and therefore
capital growth. A 2.09% increase in Canberra’s unit price over the September
2008 quarter produced a median unit price of $372,000, the highest unit capital
growth increase recorded over the quarter. This growth was largely driven by a
number of high priced sales in new unit complexes in South Canberra, boosting
the median price. The number of unit sales over the year to September 2008 fell
by 9.9% to just 3,082.
Sep
2002
Sep
2003
Sep
2004
Sep
2005
Sep
2006
Sep
2007
Sep
2008
$0
$50,000
$100,000
$150,000
$200,000
$250,000
$300,000
$350,000
$400,000
Median Price
0%
20%
40%
60%
80%
100%
% Change
Median Unit Price Capital Growth
ACT Median Unit Price and
Capital Growth
Source: Residex/CBRE Research & Consulting (as at Sept 2008)
Canberra Unit Rent and Yield
Canberra’s median unit rent dropped by $15 per week to $370 over the September
2008 quarter, partially due to an oversupply of units and diminishing demand.
The September quarter’s rental decrease contributed to an overall decrease of
11.9% for the year. Canberra’s average unit rental yield remains high in contrast
to other capital cities with Sydney (5.56%) and Darwin (6.13%), the only cities to
exceed Canberra’s 5.2% yield as at September 2008. It is believed Canberra’s
unit rental market is likely to experience further reductions in median rent over
the short term unless government focus changes significantly resulting in public
servant employment growth.
Jun
2005Sep
2005D
ec
2005M
ar
2006Jun
2006Sep
2006D
ec
2006M
ar
2007Jun
2007Sep
2007D
ec
2007M
ar
2008Jun
2008Sep
2008
$0
$100
$200
$300
$400
$500
Weekly Rent ($)
2 Bedroom Units
ACT Median Unit Rent
Source: Residex/CBRE Research & Consulting (as at Sept 2008)
ACT Residential Supply Pipeline
The Australian Capital Territory’s Indicative Residential Land Release Program,
released in April 2007, will inject approximately 15,590 additional dwelling sites
into the development pipeline. This program is intended to address the Territory’s
housing shortage and affordability issues with annual land releases ranging from
2,370 blocks to 4,200 blocks planned over the next five years. These releases,
combined with the Territory’s private sector developments, are expected to put
approximately 47,022 new residential dwellings and blocks into the development
pipeline. Across these 163 proposed projects/stages, the largest unit projects
are located in Canberra City while Molonglo and Weston will house the largest
land project (33,000 blocks) staged over the next 30 years. From November
2007 to November 2008, 65 projects had development applications lodged, 31
received development approval, 30 had tenders called or contracts issued, and
37 projects were under construction. Due to decreased demand and the current
financial and economic conditions, not all proposed projects are expected to be
constructed, with some likely to be deferred or abandoned.
1,233 1,102
1,308
1,620
870
4,208
2,702
2,938
3,370
2,370
1,600
1,500
1,300
1,000
1,000
2008-2009 2009-2010 2010-2011 2012-2012 2012-2013
0
2,000
4,000
6,000
8,000
LDA Estates
Govt Releases
Private Sector
Indicative Residential Land
Release Program
Source: ACT Government (April 2008)
Forecast
Unit Market
No. of Sales
(year)
Median Price
(Sept Qtr)
Median Price
(last year)
% Growth
(last year)
Median
Weekly Rent
Rental Yield
(last qtr)
Curtin 20 $264,000 $219,000 20.63% $290 6.75%
Charnwood 10 $302,500 $254,500 18.81% $350 6.33%
Macquarie 24 $355,500 $301,000 18.21% $365 5.65%
Cook 26 $368,000 $316,500 16.36% $380 5.60%
Banks 30 $338,500 $291,500 16.12% $370 5.67%
Canberra Units 3,082 $372,000 $334,500 11.21% $370 5.19%
Source: Residex
ThirdQuarter2008ACTResidential
Canberra’s Top 5 Performing Unit Suburbs - September 2008 Quarter
Information in this document may have been provided to CB Richard Ellis by other people and we do not warrant that it is accurate or correct. Figures quoted are approximate only
and financial information is provided without reference to the possible impact of GST. Interested parties should make their own enquiries and seek independent advice before acting.
Subject to any statutory limitation on its ability to do so, CB Richard Ellis disclaims liability under any cause of action including negligence for any loss arising from reliance upon
this document. This document is not an offer or part of a contract of sale. CB Richard Ellis respects your privacy and is bound by the National Privacy Principles. If you would prefer to
be removed from this mailing list, please contact our Privacy Officer via phone 61 3 8621 3497, facsimile 61 3 8621 3330 or email privacy@cbre.com.au. A copy of our Privacy
Policy can be viewed at www.cbre.com.au.
© 2009 (CB Richard Ellis Pty Ltd) This publication is subject to copyright protection. All rights reserved. Subject to the conditions prescribed in the Copyright Act (Cth) 1968, no part
of this publication may in any form or by any means (electronic, mechanical, photocopying, recording or otherwise), be reproduced stored in a retrieval system or transmitted to any
other person, without the specific permission of the copyright owner.
CB Richard Ellis Pty Ltd ABN 57 057 373 574, Licenced Estate Agent, Level 26, 363 George Street, Sydney, NSW 2000 T 61 2 9333 3333 F 61 2 9333 3330
ACT Residential
The ACT residential market is expected to remain
subdued over 2009. This is largely due to a decline
in the population growth rates following a focus
away from employment in various government
and defence departments.
Uncertain economic conditions and financial
concerns could hinder some large residential
projects proposed for the Territory’s northern
regions. There are concerns that an oversupply
of properties priced above $450,000 could strain
the Canberra market in the short to medium term.
This follows proposed large land releases and
pricing above the first home buyer’s capability.
While Canberra’s overall market has slowed and
is likely to continue to do so in the short term,
dwellings priced at the lower end of the market
appear to be benefiting from the recent increase
to the First Home Owners Grant. Canberra’s
sub-$400,000 residential market appears to be
experiencing healthy buyer activity, as reported
by an affordable home builder whose waiting list
is far in excess of the number of terrace homes
available priced sub-$300,000.
Heading into 2009, providing the ACT economy
remains buoyant and job security is maintained,
demand for entry level products should remain
strong especially in the newer land estates. Areas
such as MacGregor West are reporting healthy
sales stemming from the increased First Home
Owners Grant and affordable housing policy. This
increase in Canberra’s lower end of the market
is likely to roll through to newer suburbs such as
Franklin, Bonner and Casey One in 2009.
Canberra’s unit investors, who typically purchase
within a 5km radius of the City, are likely to see
good opportunities appearing in the market over
the next six months. A combination of declining
sales volumes and hesitant developers could
result in price adjustments and incentives on offer.
Canberra City’s well paid population is likely to be
able to retain the area’s high rent and attractive
yields over the short term, supported by a vacancy
rate of 2%.
Canberra’s middle tier or mortgage belt housing
market could see continued slowing in the outer
suburbs in 2009. Whereas, inner city suburbs with
houses priced up to $500,000 may see some buyer
activity over the next six months as those who do
purchase choose to do so closer to the CBD.
Like many capital cities at this time, houses priced
over $1.5 million have experienced a remarkable
slowing in demand and easing of price. Canberra’s
outer top end housing market is likely to be no
different, with buyers shying away from expensive
new homes in recently developed estates and
heading closer into the city. Inner Canberra
suburbs with median house prices over $1 million,
such as Deakin, Red Hill, Forrest, Griffith and
Yarralumba, are the most likely buyers’ picks at
this end of the market, as established suburbs
are often preferred over newly developed areas
further from the city.
It is projected that growth will be substantially
more subdued over the next six months. Looking
further forward high rental yields may stimulate the
interests of Canberra investors. A further lowering
of interest rates should also assist in stabilising
Canberra’s residential market.
Market Outlook Local Offices
CANBERRA
Level 4,
92 Northbourne
Avenue
Braddon ACT 2612
GPO Box 1987
Canberra ACT 260
T 61 2 6232 2733
F 61 2 6232 2730
For more information regarding the
MarketView, please contact:
Toni McKnight
Senior Manager, Residential
CB Richard Ellis (C) Pty Ltd
ABN 64 003 205 552
Level 33, Waterfront Place
1 Eagle Street
Brisbane QLD 4000
T 61 7 3833 9773
F 61 7 3833 9830
toni.mcknight@cbre.com.au
Tom Edwards
Regional Director
Residential Mortgage Valuation Services
M 61 408 787 880
thomas.edwards@cbre.com.au
Marcus Hon
Associate Director
Valuation & Advisory Services
M 61 409 308 687
marcus.hon@cbre.com.au

More Related Content

What's hot

Mercer Capital's Value Focus: Construction and Building Materials | Q2 2019 |...
Mercer Capital's Value Focus: Construction and Building Materials | Q2 2019 |...Mercer Capital's Value Focus: Construction and Building Materials | Q2 2019 |...
Mercer Capital's Value Focus: Construction and Building Materials | Q2 2019 |...Mercer Capital
 
Today’s Economic Landscape and What’s on the Other Side February 2010
Today’s Economic Landscape and What’s on the Other Side February 2010Today’s Economic Landscape and What’s on the Other Side February 2010
Today’s Economic Landscape and What’s on the Other Side February 2010Savannah Whaley
 
Global Country Comparison| Canada vs Australia| February 2019
Global Country Comparison| Canada vs Australia| February 2019Global Country Comparison| Canada vs Australia| February 2019
Global Country Comparison| Canada vs Australia| February 2019paul young cpa, cga
 
US Residential Construction Outlook_New England Mortgage Expo_Jan 13, 2017
US Residential Construction Outlook_New England Mortgage Expo_Jan 13, 2017US Residential Construction Outlook_New England Mortgage Expo_Jan 13, 2017
US Residential Construction Outlook_New England Mortgage Expo_Jan 13, 2017Bernard (Bernie) Markstein, Ph.D.
 
The saturday economist 15th september
The saturday economist 15th septemberThe saturday economist 15th september
The saturday economist 15th septemberJohn Ashcroft
 

What's hot (7)

Mercer Capital's Value Focus: Construction and Building Materials | Q2 2019 |...
Mercer Capital's Value Focus: Construction and Building Materials | Q2 2019 |...Mercer Capital's Value Focus: Construction and Building Materials | Q2 2019 |...
Mercer Capital's Value Focus: Construction and Building Materials | Q2 2019 |...
 
Today’s Economic Landscape and What’s on the Other Side February 2010
Today’s Economic Landscape and What’s on the Other Side February 2010Today’s Economic Landscape and What’s on the Other Side February 2010
Today’s Economic Landscape and What’s on the Other Side February 2010
 
Global Country Comparison| Canada vs Australia| February 2019
Global Country Comparison| Canada vs Australia| February 2019Global Country Comparison| Canada vs Australia| February 2019
Global Country Comparison| Canada vs Australia| February 2019
 
Presentation to the Lake Elsinore EDWC
Presentation to the Lake Elsinore EDWCPresentation to the Lake Elsinore EDWC
Presentation to the Lake Elsinore EDWC
 
April en lvrec
April en lvrecApril en lvrec
April en lvrec
 
US Residential Construction Outlook_New England Mortgage Expo_Jan 13, 2017
US Residential Construction Outlook_New England Mortgage Expo_Jan 13, 2017US Residential Construction Outlook_New England Mortgage Expo_Jan 13, 2017
US Residential Construction Outlook_New England Mortgage Expo_Jan 13, 2017
 
The saturday economist 15th september
The saturday economist 15th septemberThe saturday economist 15th september
The saturday economist 15th september
 

Viewers also liked

Species Pages Slide Show
Species Pages Slide ShowSpecies Pages Slide Show
Species Pages Slide Showtbarbaro
 
ITU - Social software: 18 Storesamarbejder
ITU - Social software: 18 StoresamarbejderITU - Social software: 18 Storesamarbejder
ITU - Social software: 18 StoresamarbejderMorten Gade
 
2014 Plastics Manufacturing Labor Characteristics Report
2014 Plastics Manufacturing Labor Characteristics Report2014 Plastics Manufacturing Labor Characteristics Report
2014 Plastics Manufacturing Labor Characteristics ReportGreater Burlington Partnership
 
Lsu Presentation Feb 2009
Lsu Presentation Feb 2009Lsu Presentation Feb 2009
Lsu Presentation Feb 2009albarocco
 
Los Yernos
Los YernosLos Yernos
Los Yernoshome
 
Letter of Recomendation
Letter of RecomendationLetter of Recomendation
Letter of Recomendationguest743b0e6
 
4 T Memorial Olga Vilalta
4 T Memorial Olga Vilalta4 T Memorial Olga Vilalta
4 T Memorial Olga Vilaltajose abia
 

Viewers also liked (8)

Species Pages Slide Show
Species Pages Slide ShowSpecies Pages Slide Show
Species Pages Slide Show
 
Adelaide Sept 2008
Adelaide Sept 2008Adelaide Sept 2008
Adelaide Sept 2008
 
ITU - Social software: 18 Storesamarbejder
ITU - Social software: 18 StoresamarbejderITU - Social software: 18 Storesamarbejder
ITU - Social software: 18 Storesamarbejder
 
2014 Plastics Manufacturing Labor Characteristics Report
2014 Plastics Manufacturing Labor Characteristics Report2014 Plastics Manufacturing Labor Characteristics Report
2014 Plastics Manufacturing Labor Characteristics Report
 
Lsu Presentation Feb 2009
Lsu Presentation Feb 2009Lsu Presentation Feb 2009
Lsu Presentation Feb 2009
 
Los Yernos
Los YernosLos Yernos
Los Yernos
 
Letter of Recomendation
Letter of RecomendationLetter of Recomendation
Letter of Recomendation
 
4 T Memorial Olga Vilalta
4 T Memorial Olga Vilalta4 T Memorial Olga Vilalta
4 T Memorial Olga Vilalta
 

Similar to Act Market View Q3 2008

WA Market View Q3 2008
WA Market View Q3 2008WA Market View Q3 2008
WA Market View Q3 2008Property News
 
NSW Market View Q32008 Email Version1
NSW Market View Q32008 Email Version1NSW Market View Q32008 Email Version1
NSW Market View Q32008 Email Version1Property News
 
Market Watch Aug09
Market Watch Aug09Market Watch Aug09
Market Watch Aug09dandry44
 
Pasadena Homes August Sales Report
Pasadena Homes August Sales ReportPasadena Homes August Sales Report
Pasadena Homes August Sales ReportDoug Willis
 
Real estate trend
Real estate trendReal estate trend
Real estate trendajay79
 
Pasadena Real Estate - up2date Market Recap for October
Pasadena Real Estate - up2date Market Recap for OctoberPasadena Real Estate - up2date Market Recap for October
Pasadena Real Estate - up2date Market Recap for OctoberDoug Willis
 
Economic Indicators for Week of December 20-23, 2010
Economic Indicators for Week of December 20-23, 2010Economic Indicators for Week of December 20-23, 2010
Economic Indicators for Week of December 20-23, 2010NAR Research
 
Vreb oct 19 stats package
Vreb oct 19 stats packageVreb oct 19 stats package
Vreb oct 19 stats packageVicky Aulakh
 
Gary Keller's Vision Speech - Keller Williams Realty Family Reunion 2009
Gary Keller's Vision Speech - Keller Williams Realty Family Reunion 2009Gary Keller's Vision Speech - Keller Williams Realty Family Reunion 2009
Gary Keller's Vision Speech - Keller Williams Realty Family Reunion 2009Keller Williams Careers
 

Similar to Act Market View Q3 2008 (20)

WA Market View Q3 2008
WA Market View Q3 2008WA Market View Q3 2008
WA Market View Q3 2008
 
NSW Market View Q32008 Email Version1
NSW Market View Q32008 Email Version1NSW Market View Q32008 Email Version1
NSW Market View Q32008 Email Version1
 
Canberra Sept 2008
Canberra Sept 2008Canberra Sept 2008
Canberra Sept 2008
 
2016 10-core logicc-hedonic_index
2016 10-core logicc-hedonic_index2016 10-core logicc-hedonic_index
2016 10-core logicc-hedonic_index
 
Market Watch Aug09
Market Watch Aug09Market Watch Aug09
Market Watch Aug09
 
Australian property-market-report-october-2018
Australian property-market-report-october-2018Australian property-market-report-october-2018
Australian property-market-report-october-2018
 
Pasadena Homes August Sales Report
Pasadena Homes August Sales ReportPasadena Homes August Sales Report
Pasadena Homes August Sales Report
 
Real estate trend
Real estate trendReal estate trend
Real estate trend
 
Core logic home value index - January 2019
Core logic home value index - January 2019Core logic home value index - January 2019
Core logic home value index - January 2019
 
CoreLogic-home-value-index-FEB-23-FINAL.pdf
CoreLogic-home-value-index-FEB-23-FINAL.pdfCoreLogic-home-value-index-FEB-23-FINAL.pdf
CoreLogic-home-value-index-FEB-23-FINAL.pdf
 
Economic Presentation
Economic PresentationEconomic Presentation
Economic Presentation
 
Best of the Best 2022 Property Report
Best of the Best 2022 Property ReportBest of the Best 2022 Property Report
Best of the Best 2022 Property Report
 
Pasadena Real Estate - up2date Market Recap for October
Pasadena Real Estate - up2date Market Recap for OctoberPasadena Real Estate - up2date Market Recap for October
Pasadena Real Estate - up2date Market Recap for October
 
Core logic home value index Nov 19 final
Core logic home value index Nov 19 finalCore logic home value index Nov 19 final
Core logic home value index Nov 19 final
 
Economic Indicators for Week of December 20-23, 2010
Economic Indicators for Week of December 20-23, 2010Economic Indicators for Week of December 20-23, 2010
Economic Indicators for Week of December 20-23, 2010
 
R E I Q
R  E  I  QR  E  I  Q
R E I Q
 
Vreb oct 19 stats package
Vreb oct 19 stats packageVreb oct 19 stats package
Vreb oct 19 stats package
 
2018 08--cl18 quarterly-economic_and_property_review
2018 08--cl18 quarterly-economic_and_property_review2018 08--cl18 quarterly-economic_and_property_review
2018 08--cl18 quarterly-economic_and_property_review
 
Core logic home value index jan 2021 final
Core logic home value index jan 2021 finalCore logic home value index jan 2021 final
Core logic home value index jan 2021 final
 
Gary Keller's Vision Speech - Keller Williams Realty Family Reunion 2009
Gary Keller's Vision Speech - Keller Williams Realty Family Reunion 2009Gary Keller's Vision Speech - Keller Williams Realty Family Reunion 2009
Gary Keller's Vision Speech - Keller Williams Realty Family Reunion 2009
 

More from Property News

February 2009 Month In Review
February 2009 Month In ReviewFebruary 2009 Month In Review
February 2009 Month In ReviewProperty News
 
Flyover Lilyfield Nsw
Flyover Lilyfield NswFlyover Lilyfield Nsw
Flyover Lilyfield NswProperty News
 
Flyover Kyeemagh Nsw
Flyover Kyeemagh NswFlyover Kyeemagh Nsw
Flyover Kyeemagh NswProperty News
 
Flyover Beenleigh Qld
Flyover Beenleigh QldFlyover Beenleigh Qld
Flyover Beenleigh QldProperty News
 
808 Qld Resi View Brisbane Northern Link Tunnel Report
808 Qld Resi View Brisbane Northern Link Tunnel Report808 Qld Resi View Brisbane Northern Link Tunnel Report
808 Qld Resi View Brisbane Northern Link Tunnel ReportProperty News
 
1008 Nsw Resi Suburb View Newcastle
1008 Nsw Resi Suburb View Newcastle1008 Nsw Resi Suburb View Newcastle
1008 Nsw Resi Suburb View NewcastleProperty News
 
June Qld Resi Suburb View Surfers Paradise
June Qld Resi Suburb View Surfers ParadiseJune Qld Resi Suburb View Surfers Paradise
June Qld Resi Suburb View Surfers ParadiseProperty News
 
December 2008 Month In Review
December 2008 Month In ReviewDecember 2008 Month In Review
December 2008 Month In ReviewProperty News
 
API eNews 14 Jan 2009
API eNews 14 Jan 2009API eNews 14 Jan 2009
API eNews 14 Jan 2009Property News
 

More from Property News (17)

February 2009 Month In Review
February 2009 Month In ReviewFebruary 2009 Month In Review
February 2009 Month In Review
 
Flyover Glebe
Flyover GlebeFlyover Glebe
Flyover Glebe
 
Flyover Lilyfield Nsw
Flyover Lilyfield NswFlyover Lilyfield Nsw
Flyover Lilyfield Nsw
 
Flyover Kyeemagh Nsw
Flyover Kyeemagh NswFlyover Kyeemagh Nsw
Flyover Kyeemagh Nsw
 
Flyover Beenleigh Qld
Flyover Beenleigh QldFlyover Beenleigh Qld
Flyover Beenleigh Qld
 
Flyover Margate Qld
Flyover Margate QldFlyover Margate Qld
Flyover Margate Qld
 
Perth Sept 2008
Perth Sept 2008Perth Sept 2008
Perth Sept 2008
 
Melbourne Sept 2008
Melbourne Sept 2008Melbourne Sept 2008
Melbourne Sept 2008
 
Darwin Sept 2008
Darwin Sept 2008Darwin Sept 2008
Darwin Sept 2008
 
Hobart Sept 2008
Hobart Sept 2008Hobart Sept 2008
Hobart Sept 2008
 
Brisbane Sept 2008
Brisbane Sept 2008Brisbane Sept 2008
Brisbane Sept 2008
 
Sydney Sept 2008
Sydney Sept 2008Sydney Sept 2008
Sydney Sept 2008
 
808 Qld Resi View Brisbane Northern Link Tunnel Report
808 Qld Resi View Brisbane Northern Link Tunnel Report808 Qld Resi View Brisbane Northern Link Tunnel Report
808 Qld Resi View Brisbane Northern Link Tunnel Report
 
1008 Nsw Resi Suburb View Newcastle
1008 Nsw Resi Suburb View Newcastle1008 Nsw Resi Suburb View Newcastle
1008 Nsw Resi Suburb View Newcastle
 
June Qld Resi Suburb View Surfers Paradise
June Qld Resi Suburb View Surfers ParadiseJune Qld Resi Suburb View Surfers Paradise
June Qld Resi Suburb View Surfers Paradise
 
December 2008 Month In Review
December 2008 Month In ReviewDecember 2008 Month In Review
December 2008 Month In Review
 
API eNews 14 Jan 2009
API eNews 14 Jan 2009API eNews 14 Jan 2009
API eNews 14 Jan 2009
 

Recently uploaded

9990771857 Call Girls in Dwarka Sector 6 Delhi (Call Girls) Delhi
9990771857 Call Girls in Dwarka Sector 6 Delhi (Call Girls) Delhi9990771857 Call Girls in Dwarka Sector 6 Delhi (Call Girls) Delhi
9990771857 Call Girls in Dwarka Sector 6 Delhi (Call Girls) Delhidelhimodel235
 
3D Architectural Rendering Company by Panoram CGI
3D Architectural Rendering Company by Panoram CGI3D Architectural Rendering Company by Panoram CGI
3D Architectural Rendering Company by Panoram CGIPanoram CGI
 
BDSM⚡Call Girls in Sector 57 Noida Escorts >༒8448380779 Escort Service
BDSM⚡Call Girls in Sector 57 Noida Escorts >༒8448380779 Escort ServiceBDSM⚡Call Girls in Sector 57 Noida Escorts >༒8448380779 Escort Service
BDSM⚡Call Girls in Sector 57 Noida Escorts >༒8448380779 Escort ServiceDelhi Call girls
 
Magarpatta Nova Elegance Mundhwa Pune E-Brochure.pdf
Magarpatta Nova Elegance Mundhwa Pune  E-Brochure.pdfMagarpatta Nova Elegance Mundhwa Pune  E-Brochure.pdf
Magarpatta Nova Elegance Mundhwa Pune E-Brochure.pdfManishSaxena95
 
9990771857 Call Girls in Dwarka Sector 1 Delhi (Call Girls) Delhi
9990771857 Call Girls in Dwarka Sector 1 Delhi (Call Girls) Delhi9990771857 Call Girls in Dwarka Sector 1 Delhi (Call Girls) Delhi
9990771857 Call Girls in Dwarka Sector 1 Delhi (Call Girls) Delhidelhimodel235
 
Kohinoor Flats In Hinjewadi Phase 2 | Homes Built To Suit Your Needs
Kohinoor Flats In Hinjewadi Phase 2 | Homes Built To Suit Your NeedsKohinoor Flats In Hinjewadi Phase 2 | Homes Built To Suit Your Needs
Kohinoor Flats In Hinjewadi Phase 2 | Homes Built To Suit Your Needsaidasheikh47
 
Girls in Kalyanpuri }Delhi↫8447779280↬Escort Service. In Delhi NCR
Girls in Kalyanpuri }Delhi↫8447779280↬Escort Service. In Delhi NCRGirls in Kalyanpuri }Delhi↫8447779280↬Escort Service. In Delhi NCR
Girls in Kalyanpuri }Delhi↫8447779280↬Escort Service. In Delhi NCRasmaqueen5
 
Best Deal Virtual Space in Satya The Hive Tata Zudio 750 Sqft 1.89 Cr All inc...
Best Deal Virtual Space in Satya The Hive Tata Zudio 750 Sqft 1.89 Cr All inc...Best Deal Virtual Space in Satya The Hive Tata Zudio 750 Sqft 1.89 Cr All inc...
Best Deal Virtual Space in Satya The Hive Tata Zudio 750 Sqft 1.89 Cr All inc...ApartmentWala1
 
9990771857 Call Girls in Dwarka Sector 3 Delhi (Call Girls) Delhi
9990771857 Call Girls in Dwarka Sector 3 Delhi (Call Girls) Delhi9990771857 Call Girls in Dwarka Sector 3 Delhi (Call Girls) Delhi
9990771857 Call Girls in Dwarka Sector 3 Delhi (Call Girls) Delhidelhimodel235
 
Call Girls in Noida Sector 77 Noida 💯Call Us 🔝 9582086666 🔝 South Delhi Escor...
Call Girls in Noida Sector 77 Noida 💯Call Us 🔝 9582086666 🔝 South Delhi Escor...Call Girls in Noida Sector 77 Noida 💯Call Us 🔝 9582086666 🔝 South Delhi Escor...
Call Girls in Noida Sector 77 Noida 💯Call Us 🔝 9582086666 🔝 South Delhi Escor...delhimodel235
 
Shapoorji Pallonji Joyville Vista Pune | Spend Your Family Time Together
Shapoorji Pallonji Joyville Vista Pune | Spend Your Family Time TogetherShapoorji Pallonji Joyville Vista Pune | Spend Your Family Time Together
Shapoorji Pallonji Joyville Vista Pune | Spend Your Family Time Togetheraidasheikh47
 
Listing Turkey Sylvana Istanbul - Bahcesehir
Listing Turkey Sylvana Istanbul - BahcesehirListing Turkey Sylvana Istanbul - Bahcesehir
Listing Turkey Sylvana Istanbul - BahcesehirListing Turkey
 
Telibagh & Call Girls Lucknow - 450+ Call Girl Cash Payment 🎂 8923113531 🎪 Ne...
Telibagh & Call Girls Lucknow - 450+ Call Girl Cash Payment 🎂 8923113531 🎪 Ne...Telibagh & Call Girls Lucknow - 450+ Call Girl Cash Payment 🎂 8923113531 🎪 Ne...
Telibagh & Call Girls Lucknow - 450+ Call Girl Cash Payment 🎂 8923113531 🎪 Ne...gurkirankumar98700
 
Call Girls in laxmi Nagar Delhi 💯Call Us 🔝 9582086666🔝 South Delhi Escorts Se...
Call Girls in laxmi Nagar Delhi 💯Call Us 🔝 9582086666🔝 South Delhi Escorts Se...Call Girls in laxmi Nagar Delhi 💯Call Us 🔝 9582086666🔝 South Delhi Escorts Se...
Call Girls in laxmi Nagar Delhi 💯Call Us 🔝 9582086666🔝 South Delhi Escorts Se...delhimodel235
 
Call Girls in Noida Sector 12 Noida 💯Call Us 🔝 9582086666 🔝 South Delhi Escor...
Call Girls in Noida Sector 12 Noida 💯Call Us 🔝 9582086666 🔝 South Delhi Escor...Call Girls in Noida Sector 12 Noida 💯Call Us 🔝 9582086666 🔝 South Delhi Escor...
Call Girls in Noida Sector 12 Noida 💯Call Us 🔝 9582086666 🔝 South Delhi Escor...delhimodel235
 
M3M The Line Brochure - Premium Investment Opportunity for Commercial Ventures
M3M The Line Brochure - Premium Investment Opportunity for Commercial VenturesM3M The Line Brochure - Premium Investment Opportunity for Commercial Ventures
M3M The Line Brochure - Premium Investment Opportunity for Commercial Venturessheltercareglobal
 
Call Girls in shastri nagar Delhi 8264348440 ✅ call girls ❤️
Call Girls in shastri nagar Delhi 8264348440 ✅ call girls ❤️Call Girls in shastri nagar Delhi 8264348440 ✅ call girls ❤️
Call Girls in shastri nagar Delhi 8264348440 ✅ call girls ❤️soniya singh
 
Kolte Patil Kharadi Pune E Brochure.pdf
Kolte Patil Kharadi Pune E  Brochure.pdfKolte Patil Kharadi Pune E  Brochure.pdf
Kolte Patil Kharadi Pune E Brochure.pdfabbu831446
 
Low Rate ↬Call Girls in Trilokpuri Delhi ↫8447779280}Escorts Service In Delhi
Low Rate ↬Call Girls in Trilokpuri Delhi ↫8447779280}Escorts Service In DelhiLow Rate ↬Call Girls in Trilokpuri Delhi ↫8447779280}Escorts Service In Delhi
Low Rate ↬Call Girls in Trilokpuri Delhi ↫8447779280}Escorts Service In Delhiasmaqueen5
 
Call Girls In Mayur Vihar Delhi ☆↫8447779280 ❤Escorts Service In Delhi
Call Girls In Mayur Vihar Delhi ☆↫8447779280 ❤Escorts Service In DelhiCall Girls In Mayur Vihar Delhi ☆↫8447779280 ❤Escorts Service In Delhi
Call Girls In Mayur Vihar Delhi ☆↫8447779280 ❤Escorts Service In Delhiasmaqueen5
 

Recently uploaded (20)

9990771857 Call Girls in Dwarka Sector 6 Delhi (Call Girls) Delhi
9990771857 Call Girls in Dwarka Sector 6 Delhi (Call Girls) Delhi9990771857 Call Girls in Dwarka Sector 6 Delhi (Call Girls) Delhi
9990771857 Call Girls in Dwarka Sector 6 Delhi (Call Girls) Delhi
 
3D Architectural Rendering Company by Panoram CGI
3D Architectural Rendering Company by Panoram CGI3D Architectural Rendering Company by Panoram CGI
3D Architectural Rendering Company by Panoram CGI
 
BDSM⚡Call Girls in Sector 57 Noida Escorts >༒8448380779 Escort Service
BDSM⚡Call Girls in Sector 57 Noida Escorts >༒8448380779 Escort ServiceBDSM⚡Call Girls in Sector 57 Noida Escorts >༒8448380779 Escort Service
BDSM⚡Call Girls in Sector 57 Noida Escorts >༒8448380779 Escort Service
 
Magarpatta Nova Elegance Mundhwa Pune E-Brochure.pdf
Magarpatta Nova Elegance Mundhwa Pune  E-Brochure.pdfMagarpatta Nova Elegance Mundhwa Pune  E-Brochure.pdf
Magarpatta Nova Elegance Mundhwa Pune E-Brochure.pdf
 
9990771857 Call Girls in Dwarka Sector 1 Delhi (Call Girls) Delhi
9990771857 Call Girls in Dwarka Sector 1 Delhi (Call Girls) Delhi9990771857 Call Girls in Dwarka Sector 1 Delhi (Call Girls) Delhi
9990771857 Call Girls in Dwarka Sector 1 Delhi (Call Girls) Delhi
 
Kohinoor Flats In Hinjewadi Phase 2 | Homes Built To Suit Your Needs
Kohinoor Flats In Hinjewadi Phase 2 | Homes Built To Suit Your NeedsKohinoor Flats In Hinjewadi Phase 2 | Homes Built To Suit Your Needs
Kohinoor Flats In Hinjewadi Phase 2 | Homes Built To Suit Your Needs
 
Girls in Kalyanpuri }Delhi↫8447779280↬Escort Service. In Delhi NCR
Girls in Kalyanpuri }Delhi↫8447779280↬Escort Service. In Delhi NCRGirls in Kalyanpuri }Delhi↫8447779280↬Escort Service. In Delhi NCR
Girls in Kalyanpuri }Delhi↫8447779280↬Escort Service. In Delhi NCR
 
Best Deal Virtual Space in Satya The Hive Tata Zudio 750 Sqft 1.89 Cr All inc...
Best Deal Virtual Space in Satya The Hive Tata Zudio 750 Sqft 1.89 Cr All inc...Best Deal Virtual Space in Satya The Hive Tata Zudio 750 Sqft 1.89 Cr All inc...
Best Deal Virtual Space in Satya The Hive Tata Zudio 750 Sqft 1.89 Cr All inc...
 
9990771857 Call Girls in Dwarka Sector 3 Delhi (Call Girls) Delhi
9990771857 Call Girls in Dwarka Sector 3 Delhi (Call Girls) Delhi9990771857 Call Girls in Dwarka Sector 3 Delhi (Call Girls) Delhi
9990771857 Call Girls in Dwarka Sector 3 Delhi (Call Girls) Delhi
 
Call Girls in Noida Sector 77 Noida 💯Call Us 🔝 9582086666 🔝 South Delhi Escor...
Call Girls in Noida Sector 77 Noida 💯Call Us 🔝 9582086666 🔝 South Delhi Escor...Call Girls in Noida Sector 77 Noida 💯Call Us 🔝 9582086666 🔝 South Delhi Escor...
Call Girls in Noida Sector 77 Noida 💯Call Us 🔝 9582086666 🔝 South Delhi Escor...
 
Shapoorji Pallonji Joyville Vista Pune | Spend Your Family Time Together
Shapoorji Pallonji Joyville Vista Pune | Spend Your Family Time TogetherShapoorji Pallonji Joyville Vista Pune | Spend Your Family Time Together
Shapoorji Pallonji Joyville Vista Pune | Spend Your Family Time Together
 
Listing Turkey Sylvana Istanbul - Bahcesehir
Listing Turkey Sylvana Istanbul - BahcesehirListing Turkey Sylvana Istanbul - Bahcesehir
Listing Turkey Sylvana Istanbul - Bahcesehir
 
Telibagh & Call Girls Lucknow - 450+ Call Girl Cash Payment 🎂 8923113531 🎪 Ne...
Telibagh & Call Girls Lucknow - 450+ Call Girl Cash Payment 🎂 8923113531 🎪 Ne...Telibagh & Call Girls Lucknow - 450+ Call Girl Cash Payment 🎂 8923113531 🎪 Ne...
Telibagh & Call Girls Lucknow - 450+ Call Girl Cash Payment 🎂 8923113531 🎪 Ne...
 
Call Girls in laxmi Nagar Delhi 💯Call Us 🔝 9582086666🔝 South Delhi Escorts Se...
Call Girls in laxmi Nagar Delhi 💯Call Us 🔝 9582086666🔝 South Delhi Escorts Se...Call Girls in laxmi Nagar Delhi 💯Call Us 🔝 9582086666🔝 South Delhi Escorts Se...
Call Girls in laxmi Nagar Delhi 💯Call Us 🔝 9582086666🔝 South Delhi Escorts Se...
 
Call Girls in Noida Sector 12 Noida 💯Call Us 🔝 9582086666 🔝 South Delhi Escor...
Call Girls in Noida Sector 12 Noida 💯Call Us 🔝 9582086666 🔝 South Delhi Escor...Call Girls in Noida Sector 12 Noida 💯Call Us 🔝 9582086666 🔝 South Delhi Escor...
Call Girls in Noida Sector 12 Noida 💯Call Us 🔝 9582086666 🔝 South Delhi Escor...
 
M3M The Line Brochure - Premium Investment Opportunity for Commercial Ventures
M3M The Line Brochure - Premium Investment Opportunity for Commercial VenturesM3M The Line Brochure - Premium Investment Opportunity for Commercial Ventures
M3M The Line Brochure - Premium Investment Opportunity for Commercial Ventures
 
Call Girls in shastri nagar Delhi 8264348440 ✅ call girls ❤️
Call Girls in shastri nagar Delhi 8264348440 ✅ call girls ❤️Call Girls in shastri nagar Delhi 8264348440 ✅ call girls ❤️
Call Girls in shastri nagar Delhi 8264348440 ✅ call girls ❤️
 
Kolte Patil Kharadi Pune E Brochure.pdf
Kolte Patil Kharadi Pune E  Brochure.pdfKolte Patil Kharadi Pune E  Brochure.pdf
Kolte Patil Kharadi Pune E Brochure.pdf
 
Low Rate ↬Call Girls in Trilokpuri Delhi ↫8447779280}Escorts Service In Delhi
Low Rate ↬Call Girls in Trilokpuri Delhi ↫8447779280}Escorts Service In DelhiLow Rate ↬Call Girls in Trilokpuri Delhi ↫8447779280}Escorts Service In Delhi
Low Rate ↬Call Girls in Trilokpuri Delhi ↫8447779280}Escorts Service In Delhi
 
Call Girls In Mayur Vihar Delhi ☆↫8447779280 ❤Escorts Service In Delhi
Call Girls In Mayur Vihar Delhi ☆↫8447779280 ❤Escorts Service In DelhiCall Girls In Mayur Vihar Delhi ☆↫8447779280 ❤Escorts Service In Delhi
Call Girls In Mayur Vihar Delhi ☆↫8447779280 ❤Escorts Service In Delhi
 

Act Market View Q3 2008

  • 1. Third Quarter 2008 © 2008, CB Richard Ellis, Inc. www.cbre.com.au/research ACT Residential Hot Topics Canberra house• market softens Canberra house• rents retract ACT building approvals fall• Canberra unit market sees• some growth Canberra’s 2009• residential market The strong level of demand and low supply that drove the Australian Capital Territory’s (ACT) residential double-digit growth over the past 18 months has dissipated, resulting in prices and sales volumes declining over the September 2008 quarter. The Territory’s main contributors to economic growth have been the Federal Government and the defence industry, which together have helped drive years of low unemployment and property demand. These two industries are key performance drivers of the ACT’s housing market and therefore its growth or decline. The public sector, however, has been earmarked for spending reductions, which if it occurs will have a negative impact on employment levels. The government’s focus appears to be moving from centrally administered plans in defence and industrial relations to locally managed issues such as housing, education, health, indigenous affairs and the environment. A shift that is likely to reduce the number of public servants employed in the Country’s Capital. Another change affecting the housing market has been the introduction of short term employment contracts replacing longer term offerings. This encourages young professionals to relocate only temporarily to the city and therefore only benefits the rental market. The combined effect of decentralised public servant employment and short term contracts appear to have filtered through to Canberra’s residential market, resulting in a decrease of sales volumes across the nation’s capital over the past year. Canberra’s median prices are significantly above those in Adelaide, Brisbane, Hobart, and Darwin. Due to its highly paid workforce, however, Canberra in recent years has emerged as the most affordable city in the nation - based on the median house price relative to income levels. At nearly $100,000 per annum, the median household income of the ACT is 50% higher than the Australian average. This means that the mortgage commitments of ACT residents account for approximately one quarter of their incomes, one third less than the national average. Despite this, the unsettled current financial and economic conditions are contributing to a slowdown of the residential market in the ACT. Canberra’s population growth is sensitive to the state of the ACT economy, and in recent times has rapidly gone from above the national average to below it. This is due to the well publicised easing in job prospects, which has seen fewer arrivals to, and more departures from the nation’s capital than usual. This ease in population growth has been a contributing factor to the Territory’s decline in housing starts. The four interest rate cuts since September and October’s increase to the First Home Owner’s Grant, appears to have injected a year end confidence and stability into an otherwise stagnant 2008. Canberra’s centrally located lower priced areas have benefited with increases in sales volume in the sub-$500,000 market whilst new residential estates and fringe localities have had increased demand in the sub-$400,000 market. Land Development Agency’s OwnPlace affordable land initiative is assisting in driving growing demand in the lower sector of the market. These dwellings predominantly comprise two and three bedroom accommodation with single garaging. Furthermore, there have been a number of higher density residential unit developments predominantly comprising one bedroom, one bedroom plus study, and two bedroom units. These have sold well off the plan in the past six months with one development having almost sold out with only four units remaining as at December. The middle and prestige residential markets have remained stable with longer marketing periods and price corrections in the order of approximately 5% experienced by most. This is evidenced particularly in the prestige unit market with developments experiencing slow sale rates and limited enquiry. It needs to be noted that centrally located, good quality dwellings have been and will continue to achieve good sales results even in an uncertain market. Market Overview
  • 2. © 2008, CB Richard Ellis, Inc. Page 2 Canberra House Market The September 2008 quarter saw Canberra’s house market record further softening in price and sales volumes. The September quarter recorded negative capital growth of 0.78% producing marginal price growth since January this year of 2.57%. The median house price of $464,000 for the September quarter is the fourth highest capital city median behind Sydney ($571,000), Perth ($505,000) and Melbourne ($482,000). House sales numbers in Canberra have fallen, tracking well below capital growth in recent quarters, with a fall in sales of 7.7% in the last year to 4,944 compared to the year before. Between the June and September 2008 quarters, house sales dropped 11%, a likely response to current economic conditions and the change in government employment focus. Canberra House Rents and Yields Following a succession of rollercoaster quarterly rent results, Canberra’s median house rent reduced by $10 per week over the September 2008 quarter. Canberra’s September quarter median house rent of $410 per week places it third nationally, behind Sydney ($480 per week) and Darwin ($460 per week). Average housing rental yields in Canberra are second only to those in Darwin, which has median gross yields in both its housing and unit markets above 5%. Canberra’s rental yield of 4.61% and softening house prices could entice long term investors and home buyers into the market. Given the government’s change in employment focus and easing population growth, house rents are likely to remain flat in comparison to Sydney. ACT Building Approvals Population growth in the ACT is easing and according to the Department of Treasury, residential approvals in September 2008 were down 4% from the previous month. From February to July 2008, monthly residential approvals increased consecutively, but declined over the following two months to September 2008. During September, most states experienced falls in building approvals, with New South Wales recording the largest decrease (down 6.9%) followed by the ACT. The State and Federal government and the Reserve Bank of Australia have introduced a number of factors that are likely to support an increase in residential building approvals in 2009. These include the ACT Government’s Affordable Housing Action Plan combined with residential land releases of 3,400 blocks in 2007-08 and 4,200 planned for 2008-09, recent interest rate cuts, and the tripling of the First Home Owner Grant for the purchase of newly constructed homes. Jun 2005Sep 2005D ec 2005M ar2006Jun 2006Sep 2006D ec 2006M ar2007Jun 2007Sep 2007D ec 2007M ar2008Jun 2008Sep 2008 $0 $100 $200 $300 $400 $500 Weekly Rent ($) 3 Bedroom Houses ACT Median House Rent Source: Residex/CBRE Research & Consulting (as at Sept 2008) ACT NSW NT QLD SA TAS VIC AUS 0 10 20 30 -10 -20 -30 -40 No. of Approvals Monthly Change Annual Change Residential Approvals State/Territory Comparisons Source: ACT Dept of Treasury (Sept 2008) Sep 2002 Sep 2003 Sep 2004 Sep 2005 Sep 2006 Sep 2007 Sep 2008 $0 $100,000 $200,000 $300,000 $400,000 $500,000 Median Price 0 320 640 960 1,280 1,600 Sales (No.) Median Price Houses No. of Sales ACT Median House Price and Sales Source: Residex/CBRE Research & Consulting (as at Sept 2008) House Market No. of Sales (year) Median Price (Sept Qtr) Median Price (last year) % Growth (last year) Median Weekly Rent Rental Yield (last qtr) Chifley 41 $538,500 $457,000 17.77% $410 3.96% Bonython 39 $471,500 $402,000 17.32% $405 4.59% Dickson 41 $540,000 $465,000 16.21% $420 4.11% Kaleen 105 $448,500 $387,000 15.87% $420 4.72% Torrens 39 $529,000 $457,000 15.81% $375 3.88% Canberra Houses 4,944 $464,000 $431,500 7.61% $410 4.61% Source: Residex Canberra’s Top 5 Growth House Suburbs – September 2008 Quarter
  • 3. © 2008, CB Richard Ellis, Inc. Page 3 Canberra Unit Market The unit market’s strong growth in the last year of 11.2% is not likely to be sustained. This is partly due to uncertain economic circumstances and the government’s change in employment focus. Both factors are likely to reduce public service growth in the nation’s capital, decreasing demand for housing and therefore capital growth. A 2.09% increase in Canberra’s unit price over the September 2008 quarter produced a median unit price of $372,000, the highest unit capital growth increase recorded over the quarter. This growth was largely driven by a number of high priced sales in new unit complexes in South Canberra, boosting the median price. The number of unit sales over the year to September 2008 fell by 9.9% to just 3,082. Sep 2002 Sep 2003 Sep 2004 Sep 2005 Sep 2006 Sep 2007 Sep 2008 $0 $50,000 $100,000 $150,000 $200,000 $250,000 $300,000 $350,000 $400,000 Median Price 0% 20% 40% 60% 80% 100% % Change Median Unit Price Capital Growth ACT Median Unit Price and Capital Growth Source: Residex/CBRE Research & Consulting (as at Sept 2008) Canberra Unit Rent and Yield Canberra’s median unit rent dropped by $15 per week to $370 over the September 2008 quarter, partially due to an oversupply of units and diminishing demand. The September quarter’s rental decrease contributed to an overall decrease of 11.9% for the year. Canberra’s average unit rental yield remains high in contrast to other capital cities with Sydney (5.56%) and Darwin (6.13%), the only cities to exceed Canberra’s 5.2% yield as at September 2008. It is believed Canberra’s unit rental market is likely to experience further reductions in median rent over the short term unless government focus changes significantly resulting in public servant employment growth. Jun 2005Sep 2005D ec 2005M ar 2006Jun 2006Sep 2006D ec 2006M ar 2007Jun 2007Sep 2007D ec 2007M ar 2008Jun 2008Sep 2008 $0 $100 $200 $300 $400 $500 Weekly Rent ($) 2 Bedroom Units ACT Median Unit Rent Source: Residex/CBRE Research & Consulting (as at Sept 2008) ACT Residential Supply Pipeline The Australian Capital Territory’s Indicative Residential Land Release Program, released in April 2007, will inject approximately 15,590 additional dwelling sites into the development pipeline. This program is intended to address the Territory’s housing shortage and affordability issues with annual land releases ranging from 2,370 blocks to 4,200 blocks planned over the next five years. These releases, combined with the Territory’s private sector developments, are expected to put approximately 47,022 new residential dwellings and blocks into the development pipeline. Across these 163 proposed projects/stages, the largest unit projects are located in Canberra City while Molonglo and Weston will house the largest land project (33,000 blocks) staged over the next 30 years. From November 2007 to November 2008, 65 projects had development applications lodged, 31 received development approval, 30 had tenders called or contracts issued, and 37 projects were under construction. Due to decreased demand and the current financial and economic conditions, not all proposed projects are expected to be constructed, with some likely to be deferred or abandoned. 1,233 1,102 1,308 1,620 870 4,208 2,702 2,938 3,370 2,370 1,600 1,500 1,300 1,000 1,000 2008-2009 2009-2010 2010-2011 2012-2012 2012-2013 0 2,000 4,000 6,000 8,000 LDA Estates Govt Releases Private Sector Indicative Residential Land Release Program Source: ACT Government (April 2008) Forecast Unit Market No. of Sales (year) Median Price (Sept Qtr) Median Price (last year) % Growth (last year) Median Weekly Rent Rental Yield (last qtr) Curtin 20 $264,000 $219,000 20.63% $290 6.75% Charnwood 10 $302,500 $254,500 18.81% $350 6.33% Macquarie 24 $355,500 $301,000 18.21% $365 5.65% Cook 26 $368,000 $316,500 16.36% $380 5.60% Banks 30 $338,500 $291,500 16.12% $370 5.67% Canberra Units 3,082 $372,000 $334,500 11.21% $370 5.19% Source: Residex ThirdQuarter2008ACTResidential Canberra’s Top 5 Performing Unit Suburbs - September 2008 Quarter
  • 4. Information in this document may have been provided to CB Richard Ellis by other people and we do not warrant that it is accurate or correct. Figures quoted are approximate only and financial information is provided without reference to the possible impact of GST. Interested parties should make their own enquiries and seek independent advice before acting. Subject to any statutory limitation on its ability to do so, CB Richard Ellis disclaims liability under any cause of action including negligence for any loss arising from reliance upon this document. This document is not an offer or part of a contract of sale. CB Richard Ellis respects your privacy and is bound by the National Privacy Principles. If you would prefer to be removed from this mailing list, please contact our Privacy Officer via phone 61 3 8621 3497, facsimile 61 3 8621 3330 or email privacy@cbre.com.au. A copy of our Privacy Policy can be viewed at www.cbre.com.au. © 2009 (CB Richard Ellis Pty Ltd) This publication is subject to copyright protection. All rights reserved. Subject to the conditions prescribed in the Copyright Act (Cth) 1968, no part of this publication may in any form or by any means (electronic, mechanical, photocopying, recording or otherwise), be reproduced stored in a retrieval system or transmitted to any other person, without the specific permission of the copyright owner. CB Richard Ellis Pty Ltd ABN 57 057 373 574, Licenced Estate Agent, Level 26, 363 George Street, Sydney, NSW 2000 T 61 2 9333 3333 F 61 2 9333 3330 ACT Residential The ACT residential market is expected to remain subdued over 2009. This is largely due to a decline in the population growth rates following a focus away from employment in various government and defence departments. Uncertain economic conditions and financial concerns could hinder some large residential projects proposed for the Territory’s northern regions. There are concerns that an oversupply of properties priced above $450,000 could strain the Canberra market in the short to medium term. This follows proposed large land releases and pricing above the first home buyer’s capability. While Canberra’s overall market has slowed and is likely to continue to do so in the short term, dwellings priced at the lower end of the market appear to be benefiting from the recent increase to the First Home Owners Grant. Canberra’s sub-$400,000 residential market appears to be experiencing healthy buyer activity, as reported by an affordable home builder whose waiting list is far in excess of the number of terrace homes available priced sub-$300,000. Heading into 2009, providing the ACT economy remains buoyant and job security is maintained, demand for entry level products should remain strong especially in the newer land estates. Areas such as MacGregor West are reporting healthy sales stemming from the increased First Home Owners Grant and affordable housing policy. This increase in Canberra’s lower end of the market is likely to roll through to newer suburbs such as Franklin, Bonner and Casey One in 2009. Canberra’s unit investors, who typically purchase within a 5km radius of the City, are likely to see good opportunities appearing in the market over the next six months. A combination of declining sales volumes and hesitant developers could result in price adjustments and incentives on offer. Canberra City’s well paid population is likely to be able to retain the area’s high rent and attractive yields over the short term, supported by a vacancy rate of 2%. Canberra’s middle tier or mortgage belt housing market could see continued slowing in the outer suburbs in 2009. Whereas, inner city suburbs with houses priced up to $500,000 may see some buyer activity over the next six months as those who do purchase choose to do so closer to the CBD. Like many capital cities at this time, houses priced over $1.5 million have experienced a remarkable slowing in demand and easing of price. Canberra’s outer top end housing market is likely to be no different, with buyers shying away from expensive new homes in recently developed estates and heading closer into the city. Inner Canberra suburbs with median house prices over $1 million, such as Deakin, Red Hill, Forrest, Griffith and Yarralumba, are the most likely buyers’ picks at this end of the market, as established suburbs are often preferred over newly developed areas further from the city. It is projected that growth will be substantially more subdued over the next six months. Looking further forward high rental yields may stimulate the interests of Canberra investors. A further lowering of interest rates should also assist in stabilising Canberra’s residential market. Market Outlook Local Offices CANBERRA Level 4, 92 Northbourne Avenue Braddon ACT 2612 GPO Box 1987 Canberra ACT 260 T 61 2 6232 2733 F 61 2 6232 2730 For more information regarding the MarketView, please contact: Toni McKnight Senior Manager, Residential CB Richard Ellis (C) Pty Ltd ABN 64 003 205 552 Level 33, Waterfront Place 1 Eagle Street Brisbane QLD 4000 T 61 7 3833 9773 F 61 7 3833 9830 toni.mcknight@cbre.com.au Tom Edwards Regional Director Residential Mortgage Valuation Services M 61 408 787 880 thomas.edwards@cbre.com.au Marcus Hon Associate Director Valuation & Advisory Services M 61 409 308 687 marcus.hon@cbre.com.au