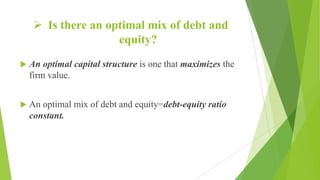
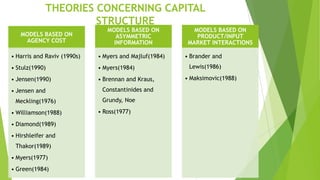
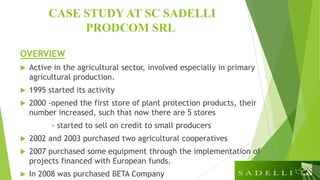
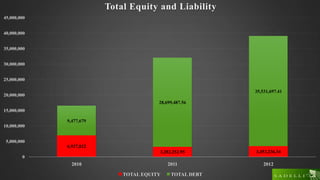
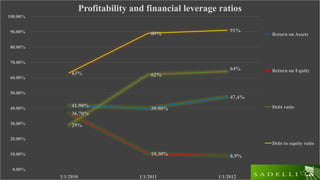
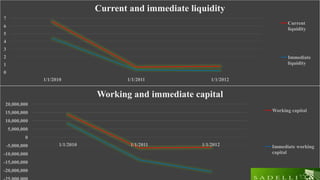
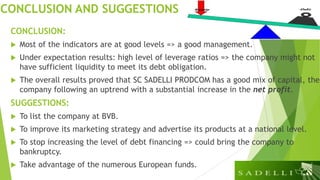
CAPITAL STRUCTURE OF
A COMPANY
CASE STUDY AT SC SADELLI PRODCOM SRL
AUTHOR:
LUP PAULA MARIA
THE CAPITAL STRUCTURE
“Neither a borrower nor a lender be!”
(Polonius, Hamlet)
 Capital can be collected by using two sources debt and equity, when a
business establishes its capital structure arises the problem of how much
should be debt and how much should be equity, each manager targets to get at
an optimal capital structure which is hard to be achieved.
 Is there an optimal mix of
debt and equity?
If yes, what determines
an optimal mix?
 And what are the costs and benefits of using debt
instead of equity?
 Is there an optimal mix of debt and
equity?
 An optimal capital structure is one that maximizes the
firm value.
 An optimal mix of debt and equity=debt-equity ratio
constant.
 What determines an optimal capital
structure?
EXTERNAL FACTORS
Inflation
Flotation cost
Market conditions
Lender's attitude
Legal framework
INTERNAL FACTORS
Tangibility
Control
Profitability
Liquidity
Company size
Growth opportunities
Flexibility of the company
Effective tax rate
 What are the costs of capital structure?
 The company’s cost of capital represents the cost that a company gives
up as a consequence of using sources of capital to finance its
investments which includes debt and equity.
 The cost of capital is the cost of each component weighted by its
relative market value and we have the following formula to compute
weighted average cost of capital (WACC):
WACC = E/V Re + D/V Rd (1 - Tc)
ESTIMATING COST OF
EQUITY
 The cost of equity is the expected return on company’s shares a company pays to
its investors for assuming some risk.
 When we talk about listed companies we can use to estimate the cost of equity the
expected return on the company’s shares, capital asset pricing model (CAPM)
and dividend discount model (DDM).
ESTIMATING COST OF
DEBT
 Debt financing=borrowing.
 Attractive because of the interest paid which is tax deductible
 Too much debt increases the risk of the company and makes it
unattractive to investors.
 Cost of debt =the interest rate paid by a company for its debts
 It can also be computed by dividing the annual interest payment of the
debt to its market value.
THEORIES CONCERNING CAPITAL
STRUCTURE
MODELS BASED ON
AGENCY COST
• Harris and Raviv (1990s)
• Stulz(1990)
• Jensen(1990)
• Jensen and
Meckling(1976)
• Williamson(1988)
• Diamond(1989)
• Hirshleifer and
Thakor(1989)
• Myers(1977)
• Green(1984)
MODELS BASED ON
ASYMMETRIC
INFORMATION
• Myers and Majluf(1984)
• Myers(1984)
• Brennan and Kraus,
Constantinides and
Grundy, Noe
• Ross(1977)
MODELS BASED ON
PRODUCT/INPUT
MARKET INTERACTIONS
• Brander and
Lewis(1986)
• Maksimovic(1988)
CASE STUDY AT SC SADELLI
PRODCOM SRL
OVERVIEW
 Active in the agricultural sector, involved especially in primary
agricultural production.
 1995 started its activity
 2000 -opened the first store of plant protection products, their
number increased, such that now there are 5 stores
- started to sell on credit to small producers
 2002 and 2003 purchased two agricultural cooperatives
 2007 purchased some equipment through the implementation of
projects financed with European funds.
 In 2008 was purchased BETA Company
SWOT ANALYSIS
STRENGHTS
Strong market position
Strong performance in cereals
High quality land
New technology
Financial resources are available
WEEKNESSES
Poor image marketing
Lack of reliable data and information on
organic agriculture
High cost of production
Extension system oriented towards
accessible farmers
OPPORTUNITIES
Strategic acquisitions
The development of new technologies
Governmental and EU support in policy
programs for agriculture
The increasing industries that are
related to agriculture
THREATS
Economic changes
Production risk
Legal and regulatory changes
Changes in what current competitors
offer
Entry of new competitors into
marketplace
6,927,822
3,282,252.95 3,453,236.34
9,477,679
28,699,487.56
35,531,697.41
0
5,000,000
10,000,000
15,000,000
20,000,000
25,000,000
30,000,000
35,000,000
40,000,000
45,000,000
2010 2011 2012
Total Equity and Liability
TOTAL EQUITY TOTAL DEBT
41.90%
39.90%
47,4%
36.70%
10.30% 8,9%
29%
62%
64%
63%
89%
91%
0.00%
10.00%
20.00%
30.00%
40.00%
50.00%
60.00%
70.00%
80.00%
90.00%
100.00%
1/1/2010 1/1/2011 1/1/2012
Profitability and financial leverage ratios
Return on Assets
Return on Equity
Debt ratio
Debt to equity ratio
-20,000,000
-15,000,000
-10,000,000
-5,000,000
0
5,000,000
10,000,000
15,000,000
20,000,000
1/1/2010 1/1/2011 1/1/2012
Working and immediate capital
Working capital
Immediate working
capital
0
1
2
3
4
5
6
7
1/1/2010 1/1/2011 1/1/2012
Current and immediate liquidity
Current
liquidity
Immediate
liquidity
CONCLUSION AND SUGGESTIONS
CONCLUSION:
 Most of the indicators are at good levels => a good management.
 Under expectation results: high level of leverage ratios => the company might not
have sufficient liquidity to meet its debt obligation.
 The overall results proved that SC SADELLI PRODCOM has a good mix of capital, the
company following an uptrend with a substantial increase in the net profit.
SUGGESTIONS:
 To list the company at BVB.
 To improve its marketing strategy and advertise its products at a national level.
 To stop increasing the level of debt financing => could bring the company to
bankruptcy.
 Take advantage of the numerous European funds.
Capital structure of a company

Capital structure of a company

  • 1.
    CAPITAL STRUCTURE OF ACOMPANY CASE STUDY AT SC SADELLI PRODCOM SRL AUTHOR: LUP PAULA MARIA
  • 2.
    THE CAPITAL STRUCTURE “Neithera borrower nor a lender be!” (Polonius, Hamlet)  Capital can be collected by using two sources debt and equity, when a business establishes its capital structure arises the problem of how much should be debt and how much should be equity, each manager targets to get at an optimal capital structure which is hard to be achieved.
  • 3.
     Is therean optimal mix of debt and equity? If yes, what determines an optimal mix?  And what are the costs and benefits of using debt instead of equity?
  • 4.
     Is therean optimal mix of debt and equity?  An optimal capital structure is one that maximizes the firm value.  An optimal mix of debt and equity=debt-equity ratio constant.
  • 5.
     What determinesan optimal capital structure? EXTERNAL FACTORS Inflation Flotation cost Market conditions Lender's attitude Legal framework INTERNAL FACTORS Tangibility Control Profitability Liquidity Company size Growth opportunities Flexibility of the company Effective tax rate
  • 6.
     What arethe costs of capital structure?  The company’s cost of capital represents the cost that a company gives up as a consequence of using sources of capital to finance its investments which includes debt and equity.  The cost of capital is the cost of each component weighted by its relative market value and we have the following formula to compute weighted average cost of capital (WACC): WACC = E/V Re + D/V Rd (1 - Tc)
  • 7.
    ESTIMATING COST OF EQUITY The cost of equity is the expected return on company’s shares a company pays to its investors for assuming some risk.  When we talk about listed companies we can use to estimate the cost of equity the expected return on the company’s shares, capital asset pricing model (CAPM) and dividend discount model (DDM).
  • 8.
    ESTIMATING COST OF DEBT Debt financing=borrowing.  Attractive because of the interest paid which is tax deductible  Too much debt increases the risk of the company and makes it unattractive to investors.  Cost of debt =the interest rate paid by a company for its debts  It can also be computed by dividing the annual interest payment of the debt to its market value.
  • 9.
    THEORIES CONCERNING CAPITAL STRUCTURE MODELSBASED ON AGENCY COST • Harris and Raviv (1990s) • Stulz(1990) • Jensen(1990) • Jensen and Meckling(1976) • Williamson(1988) • Diamond(1989) • Hirshleifer and Thakor(1989) • Myers(1977) • Green(1984) MODELS BASED ON ASYMMETRIC INFORMATION • Myers and Majluf(1984) • Myers(1984) • Brennan and Kraus, Constantinides and Grundy, Noe • Ross(1977) MODELS BASED ON PRODUCT/INPUT MARKET INTERACTIONS • Brander and Lewis(1986) • Maksimovic(1988)
  • 10.
    CASE STUDY ATSC SADELLI PRODCOM SRL OVERVIEW  Active in the agricultural sector, involved especially in primary agricultural production.  1995 started its activity  2000 -opened the first store of plant protection products, their number increased, such that now there are 5 stores - started to sell on credit to small producers  2002 and 2003 purchased two agricultural cooperatives  2007 purchased some equipment through the implementation of projects financed with European funds.  In 2008 was purchased BETA Company
  • 11.
    SWOT ANALYSIS STRENGHTS Strong marketposition Strong performance in cereals High quality land New technology Financial resources are available WEEKNESSES Poor image marketing Lack of reliable data and information on organic agriculture High cost of production Extension system oriented towards accessible farmers OPPORTUNITIES Strategic acquisitions The development of new technologies Governmental and EU support in policy programs for agriculture The increasing industries that are related to agriculture THREATS Economic changes Production risk Legal and regulatory changes Changes in what current competitors offer Entry of new competitors into marketplace
  • 12.
  • 13.
    41.90% 39.90% 47,4% 36.70% 10.30% 8,9% 29% 62% 64% 63% 89% 91% 0.00% 10.00% 20.00% 30.00% 40.00% 50.00% 60.00% 70.00% 80.00% 90.00% 100.00% 1/1/2010 1/1/20111/1/2012 Profitability and financial leverage ratios Return on Assets Return on Equity Debt ratio Debt to equity ratio
  • 14.
    -20,000,000 -15,000,000 -10,000,000 -5,000,000 0 5,000,000 10,000,000 15,000,000 20,000,000 1/1/2010 1/1/2011 1/1/2012 Workingand immediate capital Working capital Immediate working capital 0 1 2 3 4 5 6 7 1/1/2010 1/1/2011 1/1/2012 Current and immediate liquidity Current liquidity Immediate liquidity
  • 15.
    CONCLUSION AND SUGGESTIONS CONCLUSION: Most of the indicators are at good levels => a good management.  Under expectation results: high level of leverage ratios => the company might not have sufficient liquidity to meet its debt obligation.  The overall results proved that SC SADELLI PRODCOM has a good mix of capital, the company following an uptrend with a substantial increase in the net profit. SUGGESTIONS:  To list the company at BVB.  To improve its marketing strategy and advertise its products at a national level.  To stop increasing the level of debt financing => could bring the company to bankruptcy.  Take advantage of the numerous European funds.