
Recommended
Recommended
More Related Content
What's hot
What's hot (19)
Viewers also liked
Viewers also liked (20)
Similar to Design of Hybrid Solar-Wind Power System for a Coaster Area in Lagos State, South Western Nigeria
Similar to Design of Hybrid Solar-Wind Power System for a Coaster Area in Lagos State, South Western Nigeria (20)
Recently uploaded
Recently uploaded (20)
Design of Hybrid Solar-Wind Power System for a Coaster Area in Lagos State, South Western Nigeria
- 1. ISSN 2349-7815 International Journal of Recent Research in Electrical and Electronics Engineering (IJRREEE) Vol. 2, Issue 3, pp: (135-152), Month: July 2015 - September 2015, Available at: www.paperpublications.org Page | 135 Paper Publications Design of Hybrid Solar-Wind Power System for a Coaster Area in Lagos State, South Western Nigeria 1 EFUNBOTE M.I., 2 ADELEKE M.B. 1 Department of Electrical/Electronics Engineering 2 Department of Mechanical Engineering Abstract: Akodo community in Ibeju Lekki local government area of Lagos State is a rural area without access to grid electricity. Extension of the grid to the community is difficult and uneconomical; hence a hybrid energy system stands as a solution for electrification in Akodo. In this project, the HOMER (Hybrid Optimization Model for Electric Renewables) software was used to simulate a Solar and Wind hybrid system. In terms of energy delivery, the design was adequate for the 89kW load of the community. The important variables in the simulation are the level of availability of resources and the slope of the PV modules. The slope of the modules at 12o and 15o gave different levelised costs of energy (LCOE) of N27.521/kWh for the 12o PV slope and N28.846/kWh for the 15o PV slope. The PV slope at 12o is more desirable and more economical than that at 15o . The hybrid system is proposed for a project lifetime of 25 years. Keywords: Hybrid Power, Optimisation, Solar Energy, Wind Energy. 1. INTRODUCTION Stable and constant electricity is one of the driving forces of the developed countries but the situation in developing countries such as Nigeria is different. In Nigeria, people are struggling to receive enough power even for their basic needs. It is evident that the country has a problem in the power sector, which operates below its estimated capacity i.e. power supply is not covering the energy demand of the populace. Since power sector is working below its estimated capacity therefore, power outage is frequent. Due to this great challenge, privately own generators are being used to compensate for lack of stable and constant power supply. According to the EIA 2004 Annual report, Nigeria‟s energy consumptions are from the three (3) different types of energy: Oil (58 percents), natural gas (34 percents) and hydroelectricity (8 percent). Nigeria is the world‟s 8th largest exporter of crude oil. However, corruption and ill-management skills are militating against the progress of oil production, distribution and exportation. Despite the huge availability of crude oil in the country yet, more than the half of the populace are living in poverty. Furthermore, the powers that are generated from these oil and natural gas cannot cater for the demand of the masses. However, energy from the sun and the wind are inexhaustible, renewable and environmental friendly. In order to avoid colossal pollution created by non-renewable energy from gas, oil, coal and so on, it is important to adopt renewable energy methods of generating electricity. Though, initial cost of implementation of renewable energy is higher but less maintenance is required and it serves as a sustainable energy of the future. Renewable energy has been designed for small scale in the residential environment for low-power household appliances but not yet used to supply large communities.
- 2. ISSN 2349-7815 International Journal of Recent Research in Electrical and Electronics Engineering (IJRREEE) Vol. 2, Issue 3, pp: (135-152), Month: July 2015 - September 2015, Available at: www.paperpublications.org Page | 136 Paper Publications One source of energy, such as solar source or wind source, may not be sufficient because solar panels and wind turbines depend on climate and weather conditions. Therefore, neither solar nor wind is sufficient alone. In the summer time, when sun beam are strong enough, wind velocity is relatively small. In winter time, when sunny days are relatively shorter, wind velocity is high on the contrast. In that case, it is necessary to complement solar energy and wind energy with each other in order to sustain continuity of energy production in the solar-wind hybrid synchronous inverter. Converter are used to correct voltage magnitude and phase (in case of solar energy) and also used to isolate mechanical and electrical frequencies (in case of wind energy). 1.1 Aim and Objective: In this work, our aim is to design hybrid solar and wind power for Akodo community, a coastal area in Lagos State, Nigeria. In the remote rural areas, where the grid extension is difficult and not economical , hybrid energy systems stands as a simple solution for rural electrification project. Such system incorporates a combination of one or several renewable energy sources including solar photovoltaic, wind energy, micro-hydro and conventional generators if need be for any power backup. 2. HISTORY OF HYBRID POWER GENERATION Research on hybrid power systems ―combining renewable and fossil derived electricity generators started 25 years ago, but few have written papers about cost savings derived when compared with stand–alone systems. The first papers describing renewable energy hybrid systems appeared in the mid-eighties, but literature on hybrid systems did not blossom until the early 1990s. Initially, this expansion in hybrid literature was driven by the need to increase grid stability and reliability as large quantities of wind power were being added to small autonomous grids. There are some papers that optimize hybrid system and a few noteworthy papers are mentioned here. Schmid examined the economic feasibility of converting stationary diesel plants in rural Brazil into Diesel/Battery/Photovoltaic (PV) plants and found that conversions were economically favourable for smaller (<50 kW) diesel-based systems . Park modelled the cost savings of converting a ferry‟s propulsion from diesel into PV/Battery/Diesel. Chedid created software that predicted the operational cost of a hypothetical autonomous PV/Wind/Diesel system. He concluded that the inclusion of renewable energy into a diesel power plant would significantly reduce the operational cost of the plant. Nehrir used a Matlab model to examine the performance of a Wind/PV system and concluded that the use of an electric hot-water heater as a dump load made the renewable-only system more economically feasible. Ashok used a Quasi- Newtonian method to find the system that provided the lowest cost electricity to a rural Indian village. He finds that a PV/Wind/Diesel/Micro hydro system would provide 24 hour coverage at the cost of only US$0.14/kWh. Nfah examined pico-hydro/biogas/PV systems for use in rural Cameroon and reasoned that the inclusion of biogas would decrease the generation cost of hybrid systems. Ruther converted a diesel-only mini-grid into a hybrid system in rural Brazil. He then used diesel consumption data to show that similar PV/diesel systems with no battery storage can reduce diesel fuel consumption in Northern Brazilian plant. Ruther dismissed the inclusion of battery banks into a hybrid because the losses introduced by the batteries increases diesel fuel consumption. Ruther admits one limitation to the PV/Diesel system that a solar array‟s total energy contribution to a hybrid system without energy storage cannot be above roughly 10 percent because of PV‟s tendency to destabilize a grid. Phuangpornpitak examined the economic benefit (or lack thereof) of 105 solar/wind/diesel hybrid systems installed in Thailand between 1990 and 2004. Phuangpornpitak supplied a mix of experimental data and HOMER model data to provide information on the technical and financial operation of the systems. This was the only paper found that described the financial cost of actual systems and even stated that some systems were more costly than the baseline diesel only system due to over design. Nayar et al. built, installed, and tested a PV/diesel/battery/grid Uninterruptible Power Supply (UPS) in two locations in India. He reported roughly 24 hours of data on the system performance including plots of the battery bank‟s voltage, inverter power output, utility voltage, and system frequency, but omitted any information on system cost. He concluded that he successfully created a system that would improve power reliability and power factor to the load. While these four papers do use and report limited experimental data on the cost of a hybrid system, they do not discuss system design and optimization. In Nigeria, fossil fuel generators are mostly used for power generation for off-grid locations or to serve
- 3. ISSN 2349-7815 International Journal of Recent Research in Electrical and Electronics Engineering (IJRREEE) Vol. 2, Issue 3, pp: (135-152), Month: July 2015 - September 2015, Available at: www.paperpublications.org Page | 137 Paper Publications critical needs. There are distinct disadvantages of fossil fuel generators, such as high operation and maintenance costs, high emission of Green house gases (GHG) and other pollutants, and so on. Very little attempt has been made to generate power for remote areas with renewable resources such as in solar panels and wind turbines. These renewable energy generators are expensive to install. In this project, I model a hybrid system comprising the Solar and wind energies. 3. METHODOLOGY 3.1 Site Survey of Akodo Community: Akodo community is located in Ibeju Lekki local government of Lagos state of Nigeria, around latitude 06° 251 north latitude and 03° 241 east longitudes. Communities in its environs include Imagbon, Idotu , Eleko and Bogije. It is a water front area and has beaches, including the popular Eleko beach around it. The residents of the communities are mainly fishermen, farmers and traders. The community has no access to grid-supplied electricity and relies on few individual portable diesel-generators for electricity. There is a potential for electricity generation from solar and wind sources based on daily solar irradiation between 63.813 and 74.127 kWh/m2 / day. The annual average wind speed is 4.504m/s. In this study, a hybrid power system of solar PV and wind is proposed power the community‟s load demand of 88.9kw. In this study, HOMER (Hybrid Optimization Model for Electric Renewables) software is used for system simulation and cost analysis. For the simulation, input information includes electrical load demand, solar and wind resource availability, technical specification of different components, costs, type of load dispatch strategy etc 3.2 Energy Resources: For any energy system design, energy resources selection is vital. Renewable energy is sometimes called infinitive energy, because it relies on energy that is in infinite supply and there is no fuel cost for renewable energy system. Renewable energy is also considered as green or clean energy, because it does not produce toxins or pollutants that are harmful to the environment. In the location of my study, wind and solar energy are being considered based on their abundance. There is no water-body for a hydro-electricity generation project, or natural gas reserves for gas-to-electricity installations. 3.3 Solar Energy Resource Availability in Akodo Community: Solar energy is received from the sun's rays that reach the earth being converted to energy through different processes. Solar can be converted to electricity via Photovoltaic cells or panels. Solar irradiance, a measure of incoming solar radiation of Akodo is very good for the purpose of electricity generation. The monthly average global radiation data obtained from Nigeria Meteorological Agency (NIMET) is about 8.084kwh/m 2/day. The clearness index is a measure of the clearness of the atmosphere with an average value of 0.813 for Ibeju Lekki local government of Lagos state. Table 1 shows the clearness index and daily radiation for the local government; it also shows the monthly averaged values of clearness index and daily radiation. Table3.1: Solar resource values for Akodo community (REF: NIMET). Month Clearness Index Daily Radiation (kWh/m2 /Day) January 7.0 65.346 February 6.9 68.258 March 7.0 72.552 April 7.1 74.127 May 7.1 72.268 June 7.4 73.658 July 3.0 30.062 August 7.2 73.931 September 7.1 73.328 October 7.1 70.860 November 7.0 65.977 December 7.1 63.813 Annual Average 0.813 8.084
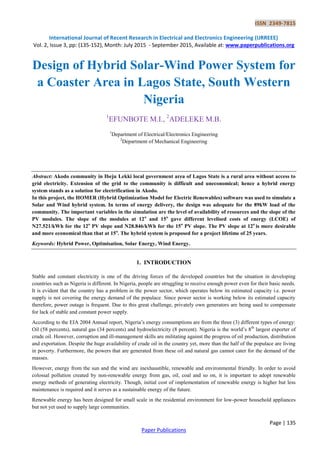
- 4. ISSN 2349-7815 International Journal of Recent Research in Electrical and Electronics Engineering (IJRREEE) Vol. 2, Issue 3, pp: (135-152), Month: July 2015 - September 2015, Available at: www.paperpublications.org Page | 138 Paper Publications 3.4 Wind Energy Resource Availability in Akodo: Lagos State is situated along the coastal line at the southern part of Nigeria, and so is the local government being studied. It is very close to the Eleko beach of the Atlantic Ocean. The areas near the coastal line have wind speed high enough to produce electricity commercially due to lack of obstruction on the ocean and the strong south/south-western monsoon wind come from the Atlantic Ocean traveling a long distance over the Niger Delta area of Nigeria. This wind blows over Nigeria from March to September with a monthly average speed of 3 m/s to 9 m/s at different heights. According to the studies of Nigerian Meteorological Agency (NIMET), wind speed is high in Nigeria during the Monsoon period (7 months, March–September). In rest of the months (October –February) wind speed remains either calm or too low. The peak wind speed occurs during the months of July to September. The wind speed data in Ibeju Lekki local government is recorded at 2m height. Table 2 shows the monthly average wind speed around the year in Lagos. Table 3.2: Wind speed at 2m height in Ibeju Lekki local govt. of Lagos. Wind energy is the kinetic energy of the moving air mass. The power, P, in watts, possessed by wind blowing with a speed of V, in meter per second (m/s), is directly proportional to the area swept by rotor and to the cube of the wind speed, and is given by, P = 1/2 ρ.A.V3 ………..1 Where, A is the area perpendicular to the direction of flow (m2 ) ρ is density of air, kg/m3 , is approximately 1.2 kg/m3 . Only a part of the total available power calculated by equation (1) can be extracted and is given by, P = 1/2 ρ.A.V.3 CP Cp is the power coefficient; it is the ratio of power extracted by a wind turbine to power available in wind at that location. A theoretical maximum of 59.3% of available power can be extracted. Practically a typical maximum of 40% is achievable. The hour of peak wind speed is simply the time of day tends to be windiest on an average throughout the year. In this study, 15 hours are used as the hour of peak wind speed. 3.5 Design of Hybrid Energy System for Akodo: A hybrid power system for the studied community is designed where wind and solar power generation have been combined together. Solar-Wind has been chosen due to its operating reliability and low cost, quick start and small size. It has good thermal and electrical efficiency. Moreover, it has low fuel consumption and good load support. The figure below shows the connection of the solar-wind hybrid power system with its accessories. Month Wind Speed (m/s) January 4.0 February 3.9 March 3.5 April 4.5 May 4.3 June 3.9 July 6.0 August 6.9 September 6.0 October 3.6 November 3.9 December 3.5 Annual Average 4.504
- 5. ISSN 2349-7815 International Journal of Recent Research in Electrical and Electronics Engineering (IJRREEE) Vol. 2, Issue 3, pp: (135-152), Month: July 2015 - September 2015, Available at: www.paperpublications.org Page | 139 Paper Publications Fig 3.1: Solar-Wind Hybrid Power System 3.6 Load Profile: The load profile is the basis for designing the projected hybrid system by using simulation software. Generally the load profile is the determination of electrical load distribution in any area which is generally measured in of 150 users daily or monthly basis. In this study, a hypothetical model area in Akodo community is considered which is comprised. In the community, there are four Shops, two Salons, two Poultries, three Churches, two Mosques one Primary School and one Secondary School. The electricity consumption in the households of the rural areas is comparatively lower than those of urban areas. A rural household generally uses electrical energy for lighting, cooling and entertaining. Each Akodo household is considered to consume about 3W made up of energy efficient lamps (compact fluorescent bulb, 15W each), 2 ceiling fans (80W each) and 1 television (100W). The daily average hours of use the light and TV are 6-7hrs, fan 16- 17hrs . The primary load or energy consumption pattern usually varies daily and monthly of the year. The tables below show the load and energy demand for an Akodo household. Table 3.3 Load Input 1
- 6. ISSN 2349-7815 International Journal of Recent Research in Electrical and Electronics Engineering (IJRREEE) Vol. 2, Issue 3, pp: (135-152), Month: July 2015 - September 2015, Available at: www.paperpublications.org Page | 140 Paper Publications Table 3.4: Load Input 2 3.7 Homer Input Summary: This is a HOMER file for Akodo community in Lagos State, using solar and wind hybrid electricity. AC Load: Akodo Load Data source: Synthetic Daily noise: 5% Hourly noise: 5% Scaled annual average: 895 kWh/d Scaled peak load: 88.9 Kw Load factor: 0.419 Table 3.5 PV sizes and costs Size (kW) Capital ($) Replacement ($) O&M ($/yr) 0.080 22,000 22,000 500 0.140 35,000 35,000 500 Sizes to consider: 50, 100, 150, 200, 205, 220, 240, 260, 300 kW Lifetime: 18 yr Derating factor: 80% Tracking system: No Tracking
- 7. ISSN 2349-7815 International Journal of Recent Research in Electrical and Electronics Engineering (IJRREEE) Vol. 2, Issue 3, pp: (135-152), Month: July 2015 - September 2015, Available at: www.paperpublications.org Page | 141 Paper Publications Slope: 15, 12 deg Azimuth: 0 deg Ground reflectance: 20% Solar Resource Latitude: 6 degrees 25 minutes North Longitude: 3 degrees 24 minutes East Time zone: GMT +0:00 Data source: Synthetic Table 3.5: Solar Resource Values Month Clearness Index Average Radiation (kWh/m2 /day) Jan 7.000 65.346 Feb 6.900 68.258 Mar 7.000 72.552 Apr 7.100 74.127 May 7.100 72.268 Jun 7.400 73.658 Jul 3.000 30.062 Aug 7.200 73.931 Sep 7.100 73.328 Oct 7.100 70.860 Nov 7.000 65.977 Dec 7.000 63.813 Scaled annual average: 8.08 kWh/m²/d
- 8. ISSN 2349-7815 International Journal of Recent Research in Electrical and Electronics Engineering (IJRREEE) Vol. 2, Issue 3, pp: (135-152), Month: July 2015 - September 2015, Available at: www.paperpublications.org Page | 142 Paper Publications Table 3.6 AC Wind Turbine: BWC Excel-S Quantity Capital ($) Replacement ($) O&M ($/yr) 1 5,940,990 5,940,990 1,500 Quantities to consider: 1, 2, 3, 4, 5, 6, 7, 9, 10 Lifetime: 15 yr Hub height: 20 m Table 3.7 Wind Resource Data source: Synthetic Month Wind Speed (m/s) Jan 4.0 Feb 3.9 Mar 3.5 Apr 4.5 May 4.3 Jun 3.9 Jul 6.0 Aug 6.9 Sep 6.0 Oct 3.6 Nov 3.9 Dec 3.5
- 9. ISSN 2349-7815 International Journal of Recent Research in Electrical and Electronics Engineering (IJRREEE) Vol. 2, Issue 3, pp: (135-152), Month: July 2015 - September 2015, Available at: www.paperpublications.org Page | 143 Paper Publications Weibull k: 2.00 Autocorrelation factor: 0.850 Diurnal pattern strength: 0.250 Hour of peak wind speed: 15 Scaled annual average: 6 m/s Anemometer height: 10 m Altitude: 2 m Wind shear profile: Logarithmic Surface roughness length: 0.01 m Table 3.8: Battery: Hoppecke 20 OPzS 2500 Quantity Capital ($) Replacement ($) O&M ($/yr) 1 114,117 114,117 500.00 Quantities to consider: 10, 12, 15, 18, 20, 30, 35, 40 Voltage: 2 V Nominal capacity: 2,500 Ah Lifetime throughput: 8,523 kWh Min battery life: 4 yr Table 3.8: Converter Size (kW) Capital ($) Replacement ($) O&M ($/yr) 4.000 150,000 150,000 1,000 Sizes to consider: 30, 40, 50, 60, 70, 80, 90, 100 kW Lifetime: 15 yr Inverter efficiency: 90% Inverter can parallel with AC generator: Yes Rectifier relative capacity: 90% Rectifier efficiency: 85% Economics Annual real interest rate: 6% Project lifetime: 25 yr Capacity shortage penalty: $ 0/kWh System fixed capital cost: $ 0 System fixed O&M cost: $ 0/yr Generator control Check load following: No Check cycle charging: Yes Setpoint state of charge: 80% Allow systems with multiple generators: Yes Allow multiple generators to operate simultaneously: Yes Allow systems with generator capacity less than peak load: Yes Emissions
- 10. ISSN 2349-7815 International Journal of Recent Research in Electrical and Electronics Engineering (IJRREEE) Vol. 2, Issue 3, pp: (135-152), Month: July 2015 - September 2015, Available at: www.paperpublications.org Page | 144 Paper Publications Carbon dioxide penalty: $ 0/t Carbon monoxide penalty: $ 0/t Unburned hydrocarbons penalty: $ 0/t Particulate matter penalty: $ 0/t Sulfur dioxide penalty: $ 0/t Nitrogen oxides penalty: $ 0/t Constraints Maximum annual capacity shortage: 3% Minimum renewable fraction: 95% Operating reserve as percentage of hourly load: 10% Operating reserve as percentage of peak load: 0% Operating reserve as percentage of solar power output: 10% Operating reserve as percentage of wind power output: 15% The HOMER simulates the operation of the hybrid system by making energy balance calculations for every hour of the 8760hours in a year. The generated results from the load inputs are shown in the charts and the corresponding tables as given above. The components‟ specifications and costs of the PV, the Wind Turbine, the battery and the Converter are also included. 4. RESULTS AND DISCUSSION For the hybrid system designed for the Akodo community, the PV panels, wind turbines, the batteries and the Converter systems were configured and simulated using HOMER software. The results generated from the software are shown in the Tables and the corresponding Charts given below. 4.1: SYSTEM REPORT – AKODO: The System Report presented below is extracted from the HOMER software simulation. The sensitivity case is presented for the angle of slope of the PV panels 12o . Sensitivity case PV Slope: 12 deg Table 4.1: System architecture PV Array 150 Kw Wind turbine 2 BWC Excel-S Battery 240 Hoppecke 20 OPzS 2500 Inverter 80 Kw Rectifier 72 Kw Table 4.2: Cost summary Total net present cost $ 112,276,448 Levelized cost of energy $ 27.521/kWh Operating cost $ 2,933,637/yr
- 11. ISSN 2349-7815 International Journal of Recent Research in Electrical and Electronics Engineering (IJRREEE) Vol. 2, Issue 3, pp: (135-152), Month: July 2015 - September 2015, Available at: www.paperpublications.org Page | 145 Paper Publications Table 4.3: Net Present Costs Component Capital Replacement O&M Fuel Salvage Total ($) ($) ($) ($) ($) ($) PV 32,504,664 11,387,818 6,392 0 -4,628,283 39,270,592 BWC Excel-S 11,881,980 4,957,939 38,350 0 -922,830 15,955,439 Hoppecke 20 OPzS 2500 27,388,080 25,531,760 1,534,004 0 -1,677,860 52,775,980 Converter 3,000,000 1,251,796 255,667 0 -232,999 4,274,466 System 74,774,720 43,129,312 1,834,413 0 -7,461,971 112,276,456 Table 4.4: Annualized Costs Component Capital Replacement O&M Fuel Salvage Total ($/yr) ($/yr) ($/yr) ($/yr) ($/yr) ($/yr) PV 2,542,733 890,832 500 0 -362,055 3,072,010 BWC Excel-S 929,488 387,843 3,000 0 -72,190 1,248,142 Hoppecke 20 OPzS 2500 2,142,480 1,997,266 120,000 0 -131,253 4,128,492 Converter 234,680 97,924 20,000 0 -18,227 334,377 System 5,849,381 3,373,865 143,500 0 -583,726 8,783,018
- 12. ISSN 2349-7815 International Journal of Recent Research in Electrical and Electronics Engineering (IJRREEE) Vol. 2, Issue 3, pp: (135-152), Month: July 2015 - September 2015, Available at: www.paperpublications.org Page | 146 Paper Publications Table 4.5: Electrical Production Component Production Fraction (kWh/yr) PV array 354,756 90% Wind turbines 39,121 10% Total 393,877 100% Table 4.6: Electrical Consumption Load Consumption Fraction (kWh/yr) AC primary load 319,136 100% Total 319,136 100% Table 4.7 PV Values Quantity Value Units Excess electricity 10,544 kWh/yr Unmet load 7,539 kWh/yr Capacity shortage 9,620 kWh/yr Renewable fraction 1.000 Quantity Value Units Rated capacity 150 kW Mean output 40.5 kW Mean output 972 kWh/d Capacity factor 27.0 % Total production 354,756 kWh/yr Quantity Value Units Minimum output 0 kW Maximum output 150 kW PV penetration 109 % Hours of operation 4,314 hr/yr Levelized cost 8.66 $/kWh
- 13. ISSN 2349-7815 International Journal of Recent Research in Electrical and Electronics Engineering (IJRREEE) Vol. 2, Issue 3, pp: (135-152), Month: July 2015 - September 2015, Available at: www.paperpublications.org Page | 147 Paper Publications Table 4.8: AC Wind Turbine: BWC Excel-S Variable Value Units Total rated capacity 20.0 Kw Mean output 4.47 Kw Capacity factor 22.3 % Total production 39,121 kWh/yr Table 4.9 Battery Quantity Value String size 24 Strings in parallel 10 Batteries 240 Bus voltage (V) 48 Variable Value Units Minimum output 0.00 kW Maximum output 24.0 kW Wind penetration 12.0 % Hours of operation 8,289 hr/yr Levelized cost 31.9 $/kWh
- 14. ISSN 2349-7815 International Journal of Recent Research in Electrical and Electronics Engineering (IJRREEE) Vol. 2, Issue 3, pp: (135-152), Month: July 2015 - September 2015, Available at: www.paperpublications.org Page | 148 Paper Publications Quantity Value Units Nominal capacity 1,200 kWh Usable nominal capacity 840 kWh Autonomy 22.5 Hr Lifetime throughput 2,045,520 kWh Battery wear cost 14.438 $/kWh Average energy cost 0.000 $/kWh Quantity Value Units Energy in 2,40,759 kWh/yr Energy out 2,07,682 kWh/yr Storage depletion 572 kWh/yr Losses 32,505 kWh/yr Annual throughput 2,23,949 kWh/yr Expected life 9.13 Yr
- 15. ISSN 2349-7815 International Journal of Recent Research in Electrical and Electronics Engineering (IJRREEE) Vol. 2, Issue 3, pp: (135-152), Month: July 2015 - September 2015, Available at: www.paperpublications.org Page | 149 Paper Publications Table 4.10 Converter Quantity Inverter Rectifier Units Capacity 80.0 72.0 kW Mean output 32.0 0.0 kW Minimum output 0.0 0.0 kW Maximum output 80.0 2.7 kW Capacity factor 40.0 0.0 % Quantity Inverter Rectifier Units Hours of operation 8,589 22 hrs/yr Energy in 3,11,162 26 kWh/yr Energy out 2,80,046 22 kWh/yr Losses 31,116 4 kWh/yr
- 16. ISSN 2349-7815 International Journal of Recent Research in Electrical and Electronics Engineering (IJRREEE) Vol. 2, Issue 3, pp: (135-152), Month: July 2015 - September 2015, Available at: www.paperpublications.org Page | 150 Paper Publications Table 4.11 Emissions Pollutant Emissions (kg/yr) Carbon dioxide 0 Carbon monoxide 0 Unburned hydrocarbons 0 Particulate matter 0 Sulfur dioxide 0 Nitrogen oxides 0 4.2 Cost Summary: This deals with the cash flows as either a present value or annualized cost, categorized by component or cost type. The three cost outputs, the total net present cost, levelized cost of energy, and the operating cost appear in the top right corner of the Simulation Results window. 4.2.1 Total Net Present Cost (NPC): The total net present cost of a system is the present value of all the costs that it incurs over its lifetime, minus the present value of all the revenue that it earns over its lifetime. Costs include capital costs, replacement costs, O&M costs and emissions penalties (but there is no emission penalty) . Revenue is the salvage value. The NPC of this system is $112,276,448. HOMER calculates the total net present cost using the following equation: CNPC = Cann,tot / CRF(I,Rproj) where : Cann,tot = total annualized cost [$/yr] CRF() = capital recovery factor I = interest rate [%] Rproj = project lifetime [yr] The total net present cost is HOMER's main economic output. HOMER ranks all systems according to total net present cost. It could be seen from the chart and table that the PV has the highest cost ($32,504,664), followed by the battery ($27,388,080,) then the turbine ($11,881,980) and the converter ($3,000,000) has the least costs. The total cost of the system is $74,774,720. No fuel was used so the cost fuel is zero. The gain from the HOMER is seen under salvage. The costs of replacement were not as high as the amount in which the components were purchased. The cost of operation and maintenance (O&M) were very low. 4.2.2 Levelized Cost Of Energy (COE): HOMER defines the levelized cost of energy (COE) as the average cost per kWh of useful electrical energy produced by the system. The COE of the system at 12 degree was $27.521/kwh at 12 degree. To calculate the COE, HOMER divides the annualized cost of producing electricity (the total annualized cost minus the cost of serving the thermal load) by the total useful electric energy production. The equation for the COE is as follows: COE = Cann,tot-CboilerEthermal/Eprim,AC+Eprim,DC+Edef+Egrid where : Cann,tot = total annualized cost of the system [$/yr]
- 17. ISSN 2349-7815 International Journal of Recent Research in Electrical and Electronics Engineering (IJRREEE) Vol. 2, Issue 3, pp: (135-152), Month: July 2015 - September 2015, Available at: www.paperpublications.org Page | 151 Paper Publications cboiler = boiler marginal cost [$/kWh] Ethermal = total thermal load served [kWh/yr] Eprim,AC = AC primary load served [kWh/yr] Eprim,DC = DC primary load served [kWh/yr] Edef = deferrable load served [kWh/yr] Egrid,sales = total grid sales [kWh/yr] The second term in the numerator is the portion of the annualized cost that results from serving the thermal load. In systems that do not serve a thermal load (Ethermal=0) this term will equal zero. The grid sales will equal to zero. The COE is a convenient metric with which to compare systems, but HOMER does not rank systems based on COE. 4.2.3 Cash Flow Outputs: The Cash Flow tab of the simulation results window shows a graph of the system cash flow. Each bar in the graph represents either a total inflow or total outflow of cash for a single year. The first bar, for year zero, shows the capital cost of the system, which also appears in the optimization results. A negative value represents an outflow, or expenditure for fuel, equipment replacements, or operation and maintenance (O&M). A positive value represents an inflow, which may be income from electricity sales or the salvage value of equipment at the end of the project lifetime. The income we have from this system is about $50,000,000 in the 25th year. The outflow of capital is almost $75,000,000 in year 0 and Replacement is $33,000,000. 5. CONCLUSION The hybrid power system simulation carried out on Akodo community shows that a 150kW array of solar panels and 20kW of wind turbines can be used to power the community, which has its peak load to be 89kW. Despite the intermittent nature of the two sources, the energy supplied using solar-wind hybrid power system could be reliable, as they complement each other and excess electricity is stored in the battery bank for use later. Though, there can be some factors like vandalization, theft case, flood and others which can cause the break- down of the system. The hybrid system can produce electrical energy to power appliances in the community, with solar panels producing 86% of the electrical energy while wind turbines produce 14%. The initial cost of implementing the solar-wind hybrid power system is estimated at $110,434,080*. The total lifespan of the project is proposed to be 25 years, while the salvage value of the entire system is estimated at $50,000,000*. In this study, it is shown that when the panels were sloped at 12o they gave values for Net Present Cost and Levelised Cost of Energy which were lower than that of panels sloped at 15o . Despite having high initial costs, renewable energy hybrid systems are long-term investments which are economically profitable, environmentally friendly and can cater for the electrical demand of remote communities lacking grid electricity. *Although, the HOMER software uses the dollar sign, the actual amounts shown in the tables and charts are naira value REFERENCES [1] A.D. Dhass et al, Cost Effective Hybrid Energy System Employing Solar-Wind-Biomass Resources for Rural Electrification. International Journal of Renewable Energy Research [2] Chedid R, Rahman S.‟‟ Unit sizing and control of hybrid wind-solar power system. IEEE Trans Energy Convers „‟;112(1):79–86.1997 [3] C. Protegeropouios, B.J. Brinkworth, R.H. Marshall, “Sizing and techno-economical optimization for hybrid photovoltaic/wind power systems with battery storage”, Int. J Energy Res, vol. 21, pp. 465-479, 1997. [4] Karaki SH, Chedid RB, Ramadan R. Probabilistic performance assessment of autonomous solar-wind energy systems. IEEE Trans Energy Convers; 14 (3):766–72.1999. [5] Karolis Kevelaitis, Rasa Museckaite, Gaisva R. Obiola, Vytautas Raudonis “Solar Energy Implementation in Nigeria” Bachelor Level in Business Studies, House 44.2, Roskilde University, Fall 2008.
- 18. ISSN 2349-7815 International Journal of Recent Research in Electrical and Electronics Engineering (IJRREEE) Vol. 2, Issue 3, pp: (135-152), Month: July 2015 - September 2015, Available at: www.paperpublications.org Page | 152 Paper Publications [6] Kellog WD,Nehrir MH, Venkataramena,Gerez V. Generation unit sizing and cost analysis for stand alone wind, photovoltaic and hybrid wind/PV systems. IEEE trans Energy convers ;13(1);70-75.1998. [7] N. A. Rahim and Saad Mekhilef “Implementation of Three-Phase Grid Connected Inverter for Photovoltaic Solar Power Generation System”, Power Electronics Research Laboratory, Dept. of Electrical Engineering, University Malaya, 50603 Kuala Lumpur, Malaysia, © IEEE.2002. [8] Nigeria Meteorological Agency (NIMET) [9] Rajib Baran Roy Design and Cost Analysis of Hybrid Power System for Off-Grid Rural Areas. Canadian Journal on Electrical and Electronics Engineering Vol. 3, No. 7, September 2012 [10] S.Ashok” Optimised model for community base hybrid energy system” Renew Energy, Vol 7, pp 1155-1164,2007. [11] V. Nayaret al, “solar/wind/diesel hybrid energy systems for remote area” Energy conversion Engineering conference, Vol pp-641-646, 2004. [12] W. Ajan Christoper, S. Shahnawaz Ahmed, B. Ahmed Hussien, T. Faridah, B.M. Abdullah Asuhaimi, “On the policy of photovoltaic and diesel generation mix for an off-grid sit: East Malaysian Perspectives”, Sol. Energy, vol. 74, pp. 453-457, 2003. [13] Zubair et al, Optimal Planning of Standalone Solar-Wind-Diesel Hybrid Energy System for a Coastal Area. International Journal of Electrical and Computer Engineering (IJECE) Vol.2, No.6, December 2012, pp. 732~735 Ahmed.